-
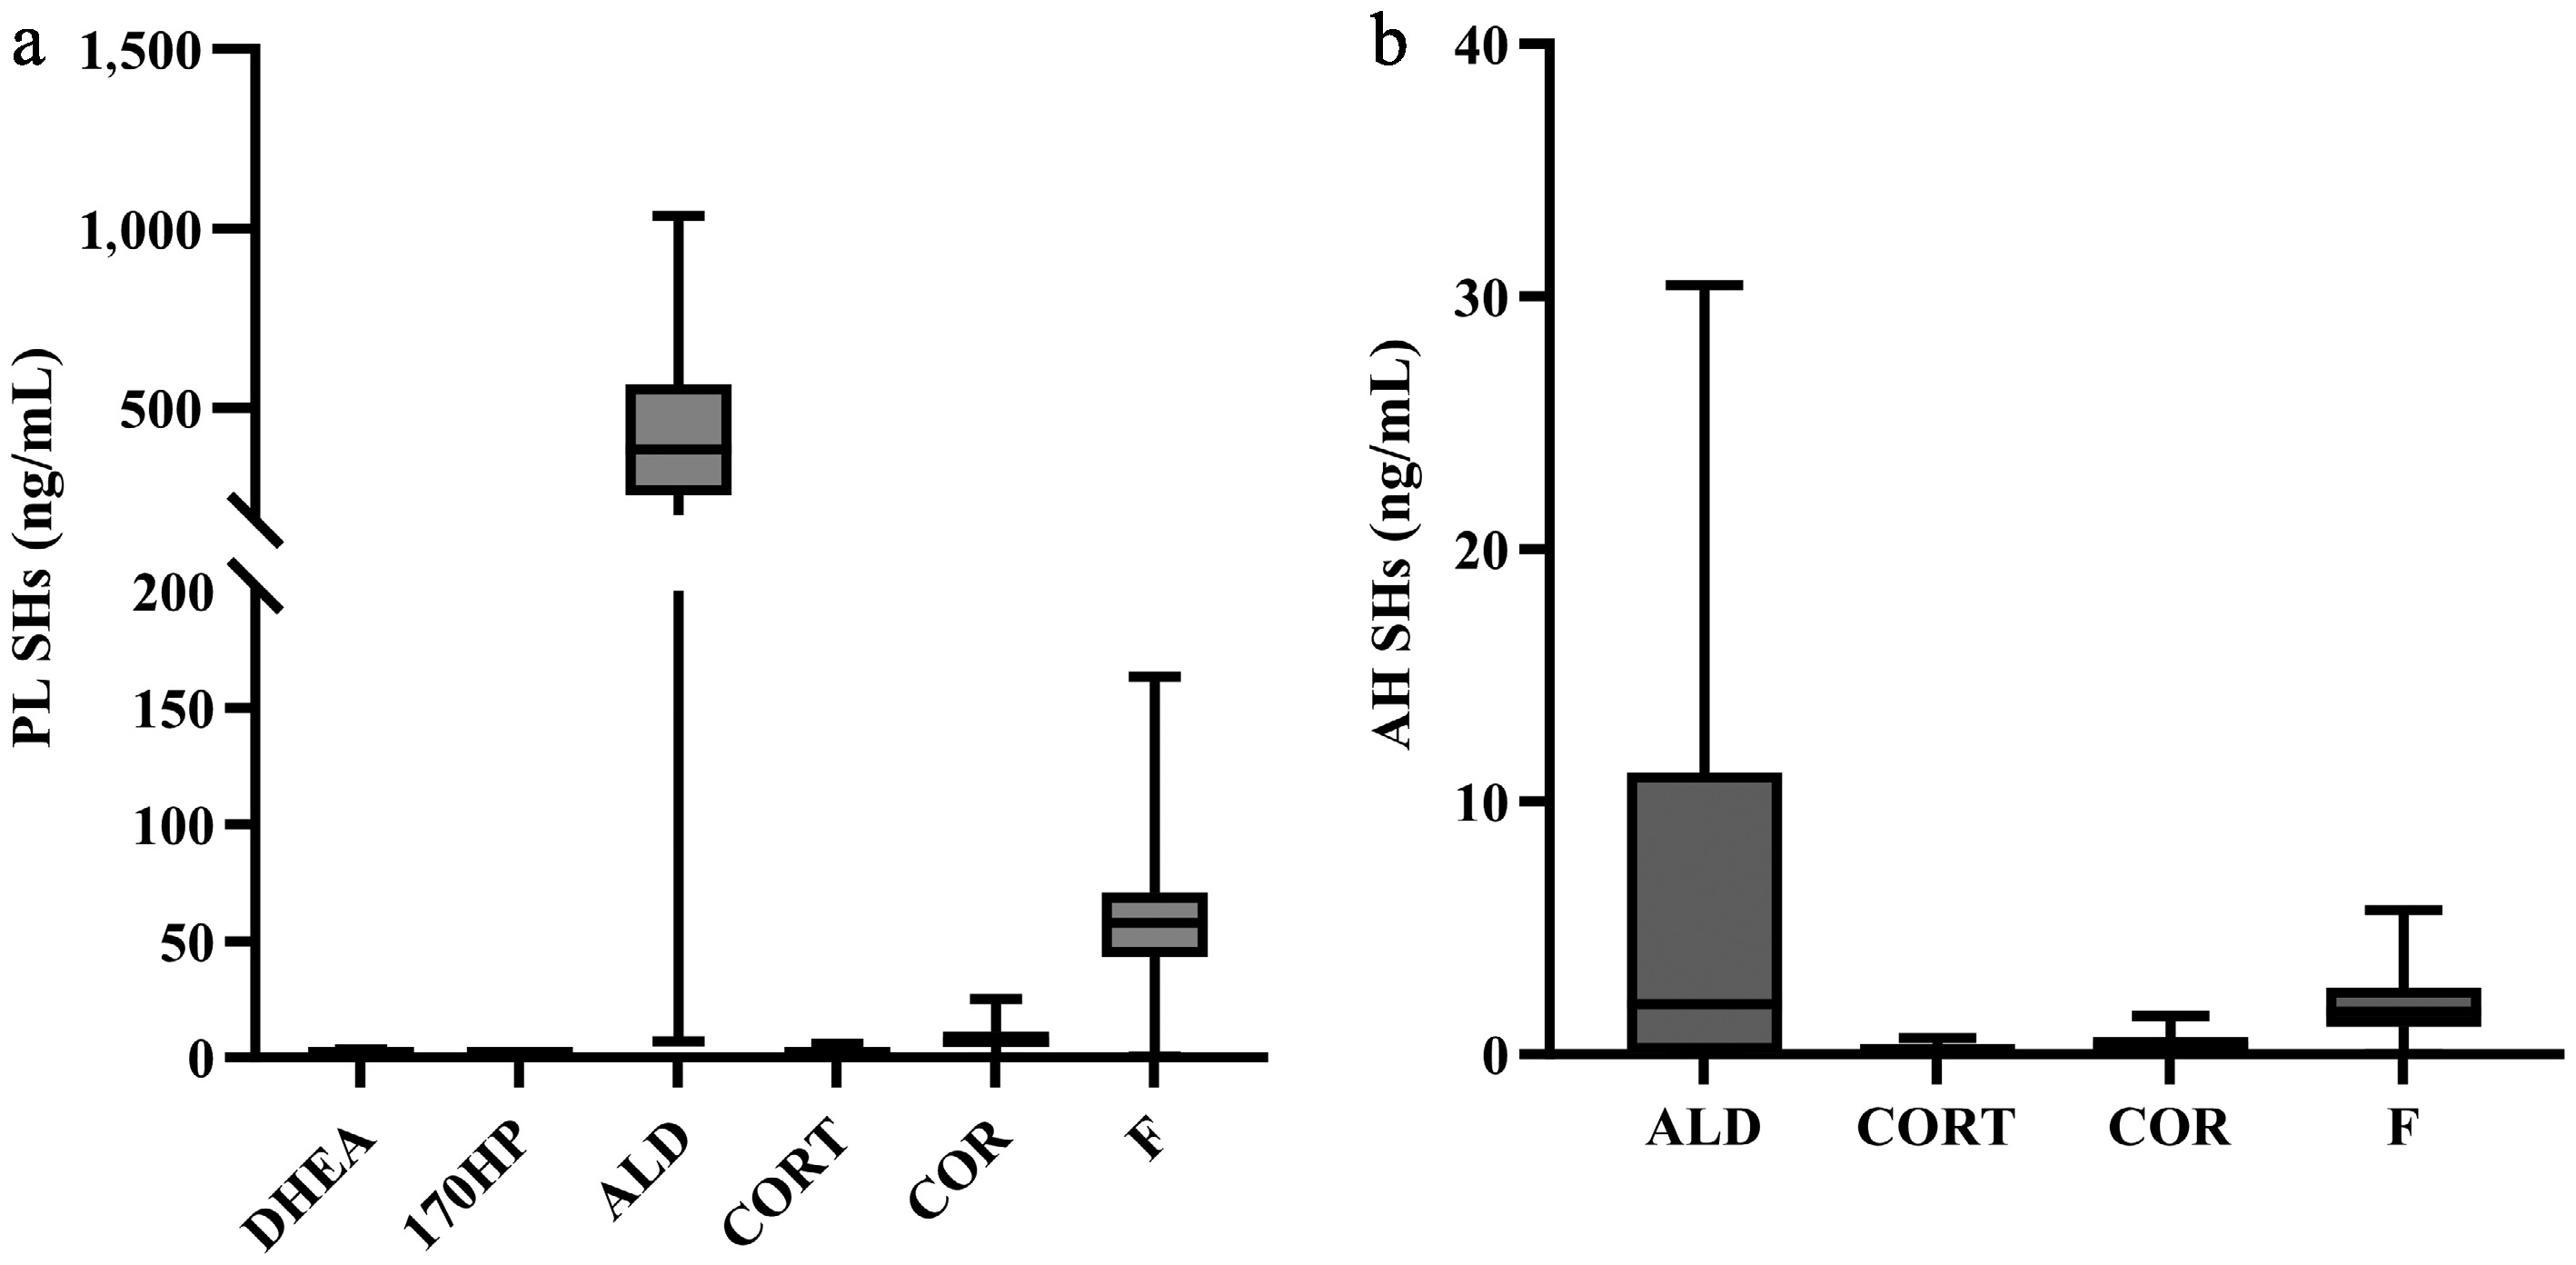
Figure 1.
Distribution of steroid hormones in plasma and aqueous humor. (a) In plasma, six steroid hormones (ALD, CORT, COR, F, DHEA, and 17OHP) were detected at high abundance. (b) In aqueous humor, four steroid hormones (ALD, CORT, COR, and F) were detected at high abundance. Notes: AH, aqueous humor; SHs, steroid hormones; PL, plasma; ALD, aldosterone; CORT, corticosterone; COR, cortisone; F, cortisol; DHEA, dehydroepiandrosterone; 17OHP, 17-hydroxyprogesterone.
-
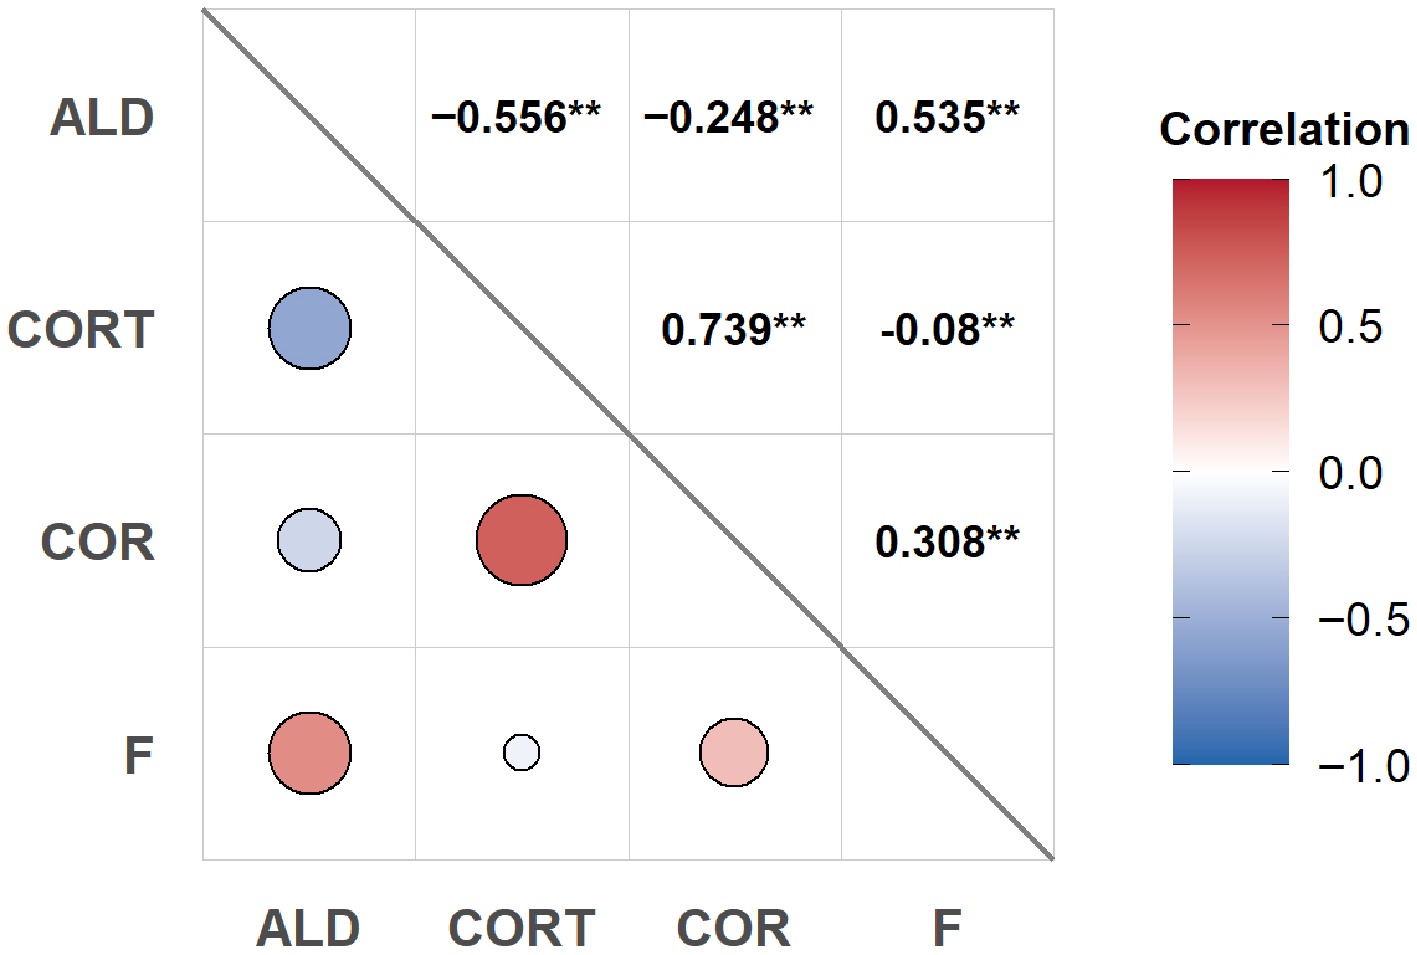
Figure 2.
The correlation of steroid hormones within aqueous humor. Correlation analysis was performed on 121 aqueous humor samples. Notes: * p < 0.05, ** p < 0.01. ALD, aldosterone; CORT, corticosterone; COR, cortisone; F, cortisol.
-
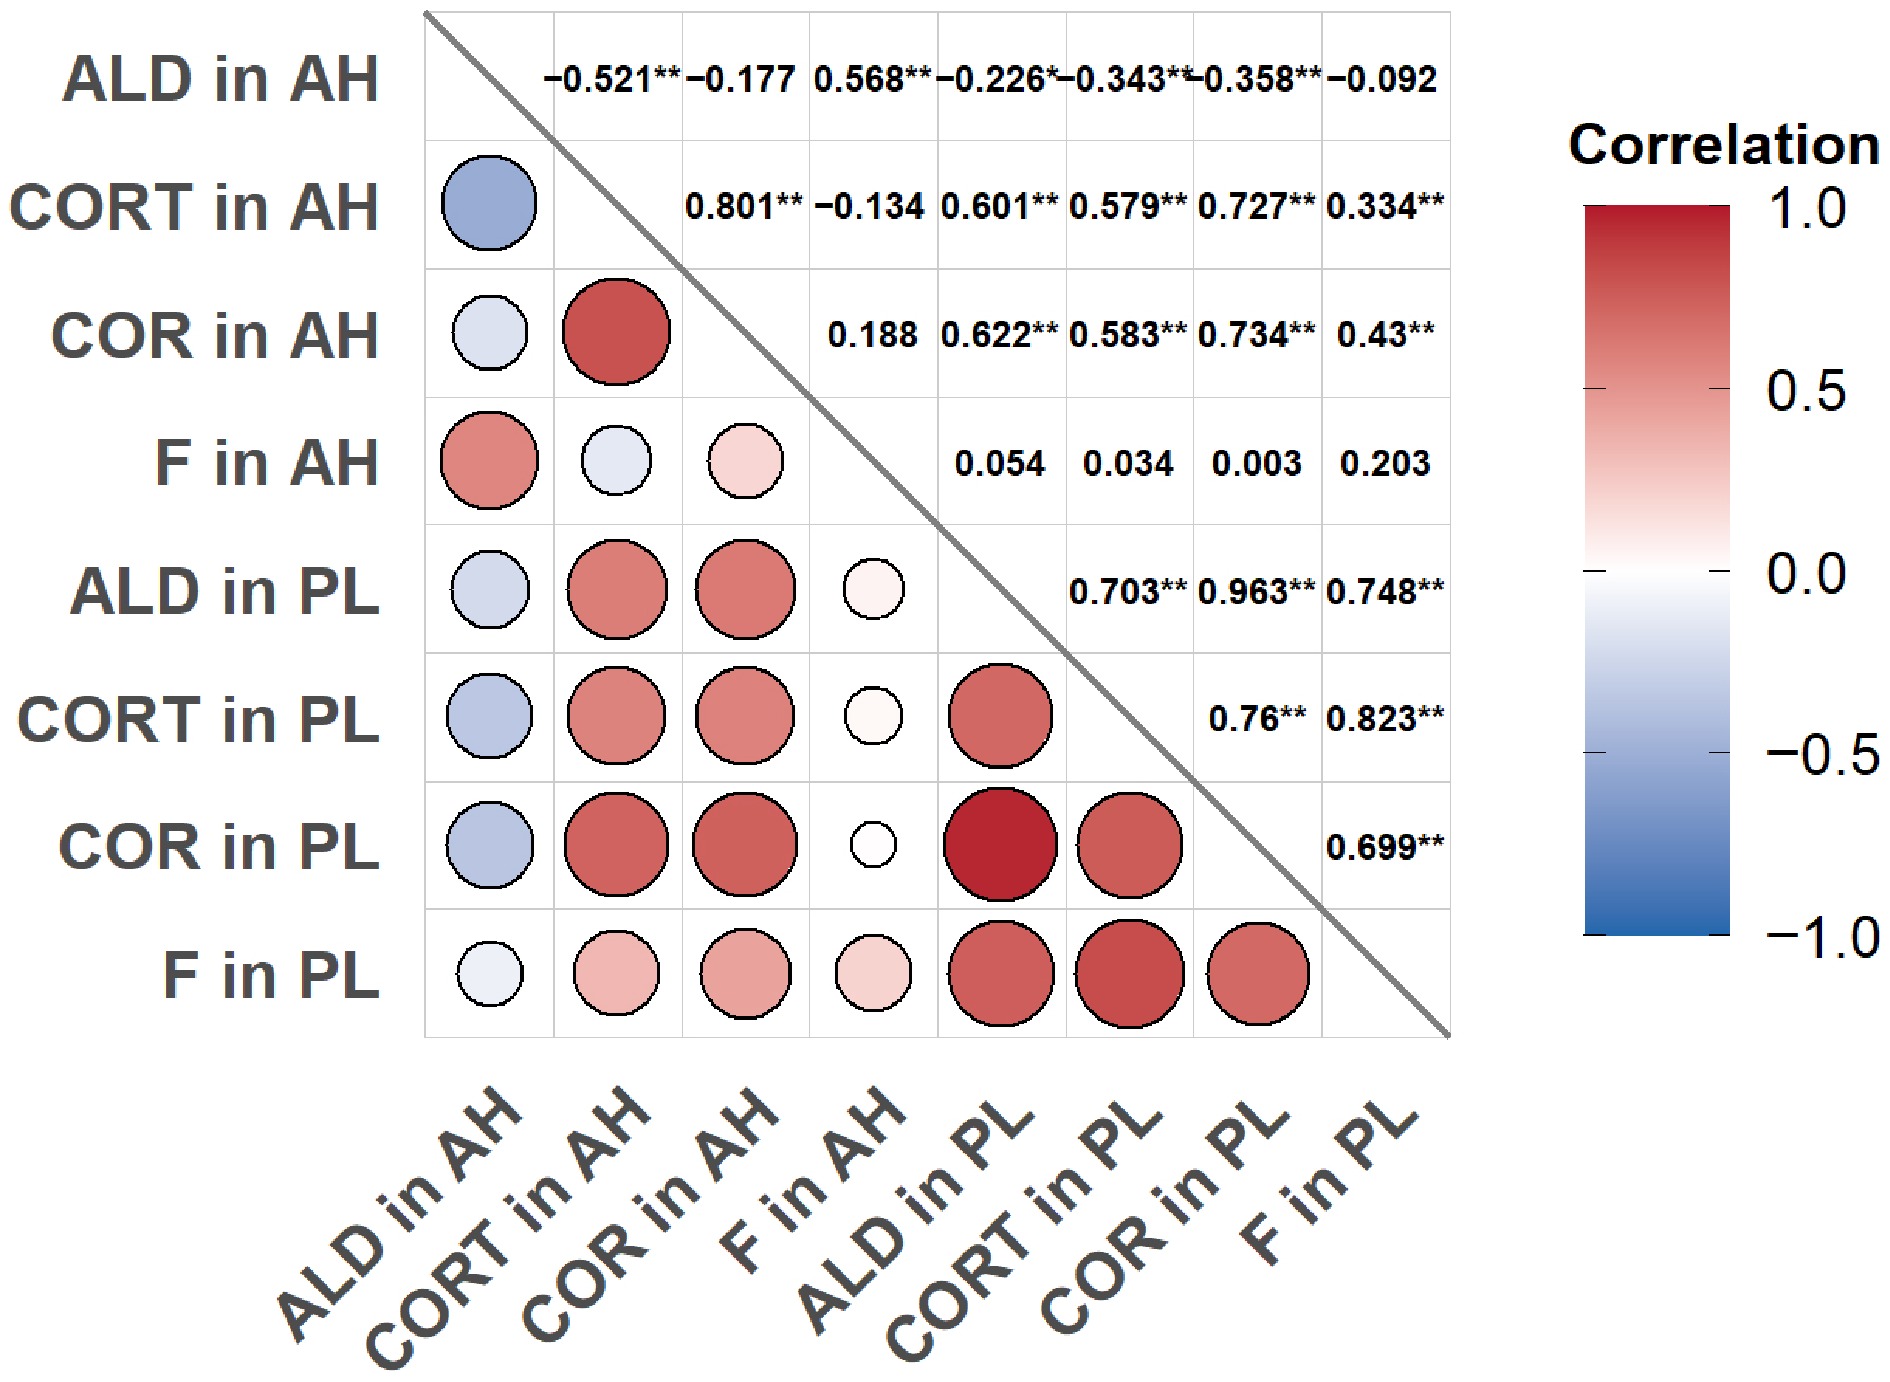
Figure 3.
Correlation analysis of steroid hormones between 92 matched plasma and aqueous humor samples. Notes: * p < 0.05, ** p < 0.01, AH, aqueous humor; PL, plasma; ALD, aldosterone; CORT, corticosterone; COR, cortisone; F, cortisol. Correlation analysis was performed using 92 pairs of matched plasma and aqueous humor samples.
-
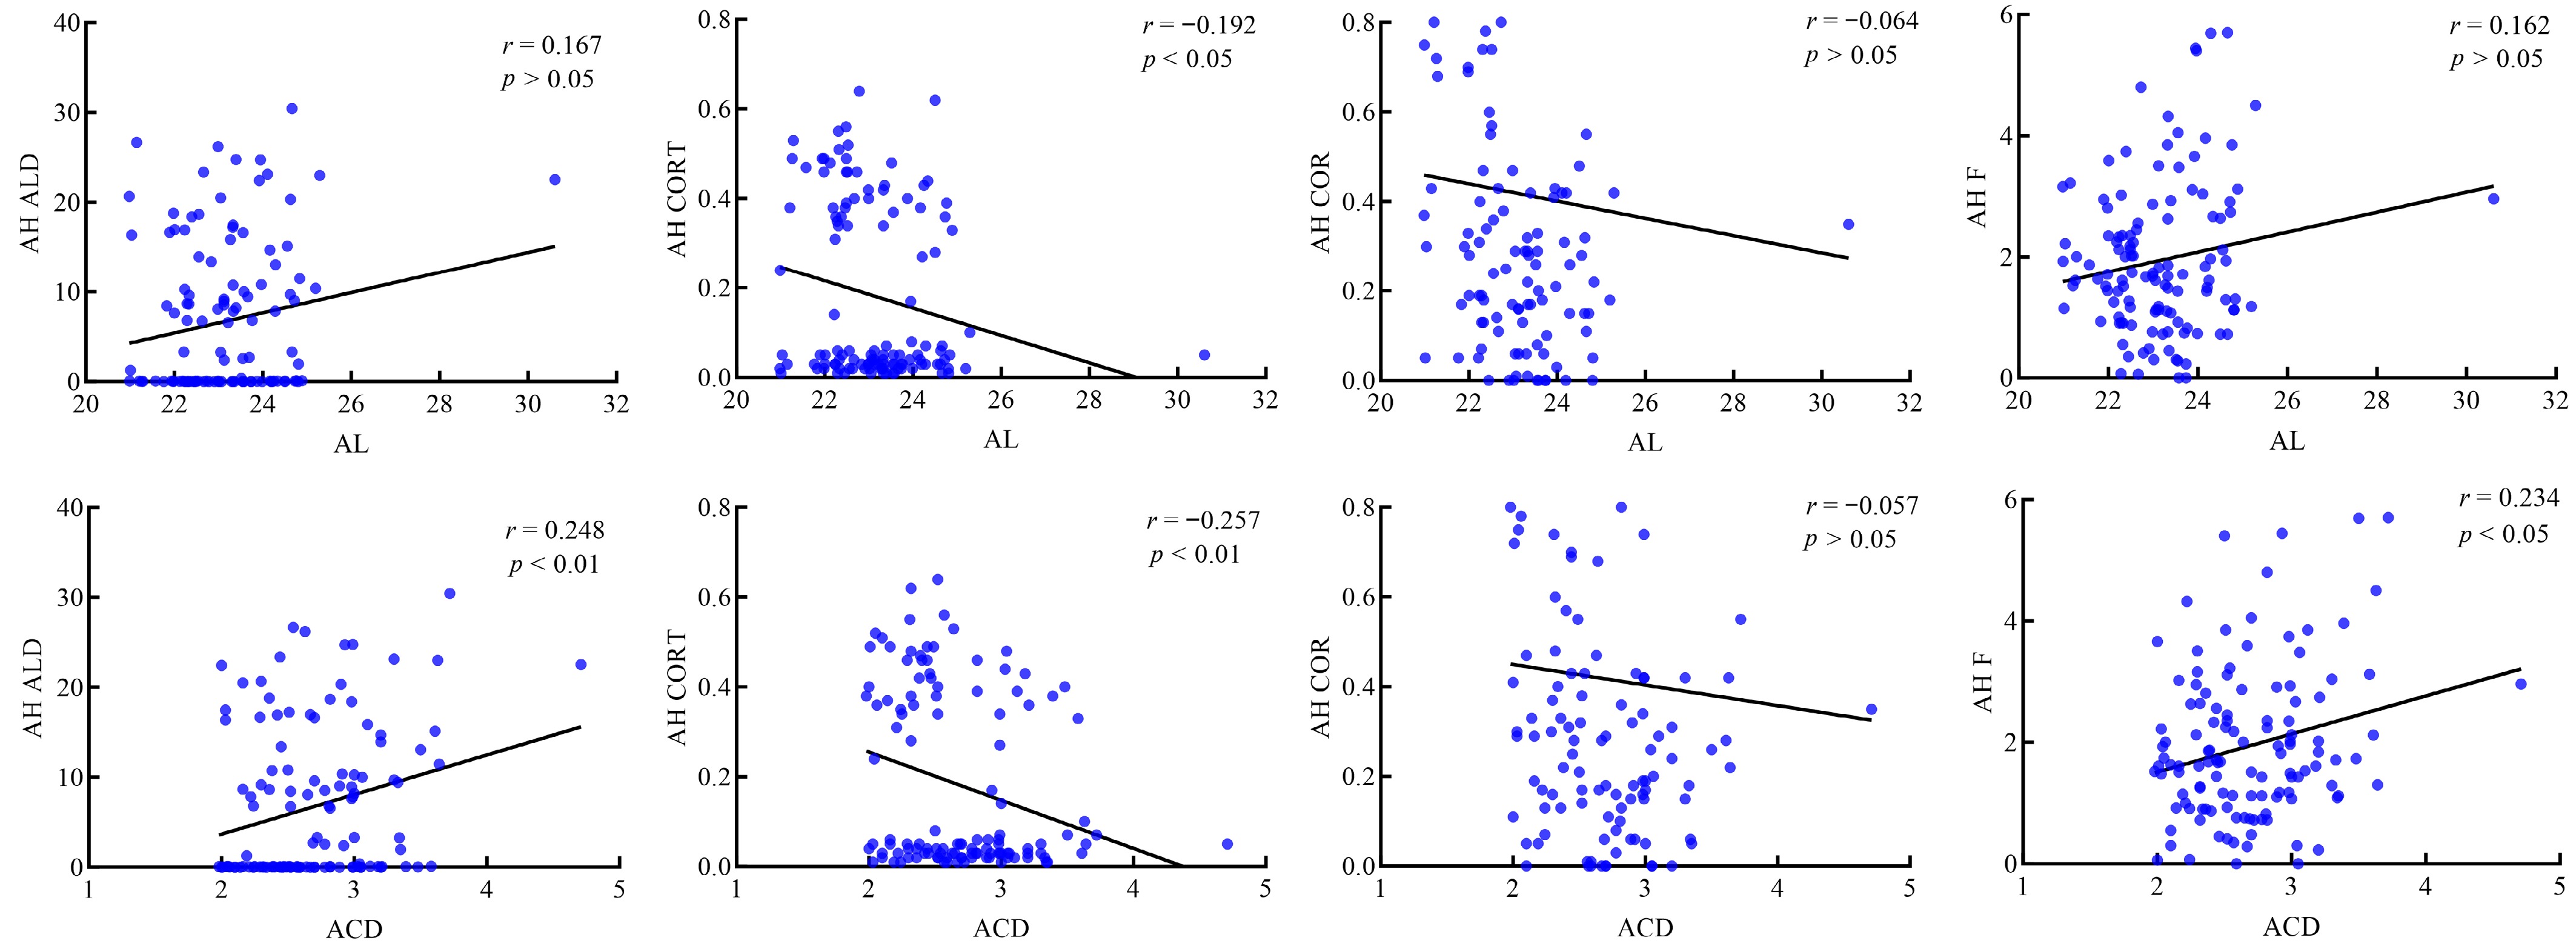
Figure 4.
Correlation analysis of 121 aqueous humor samples with AL and ACD. Notes: AH, aqueous humor; ALD, aldosterone; CORT, corticosterone; COR, cortisone; F, cortisol.
-
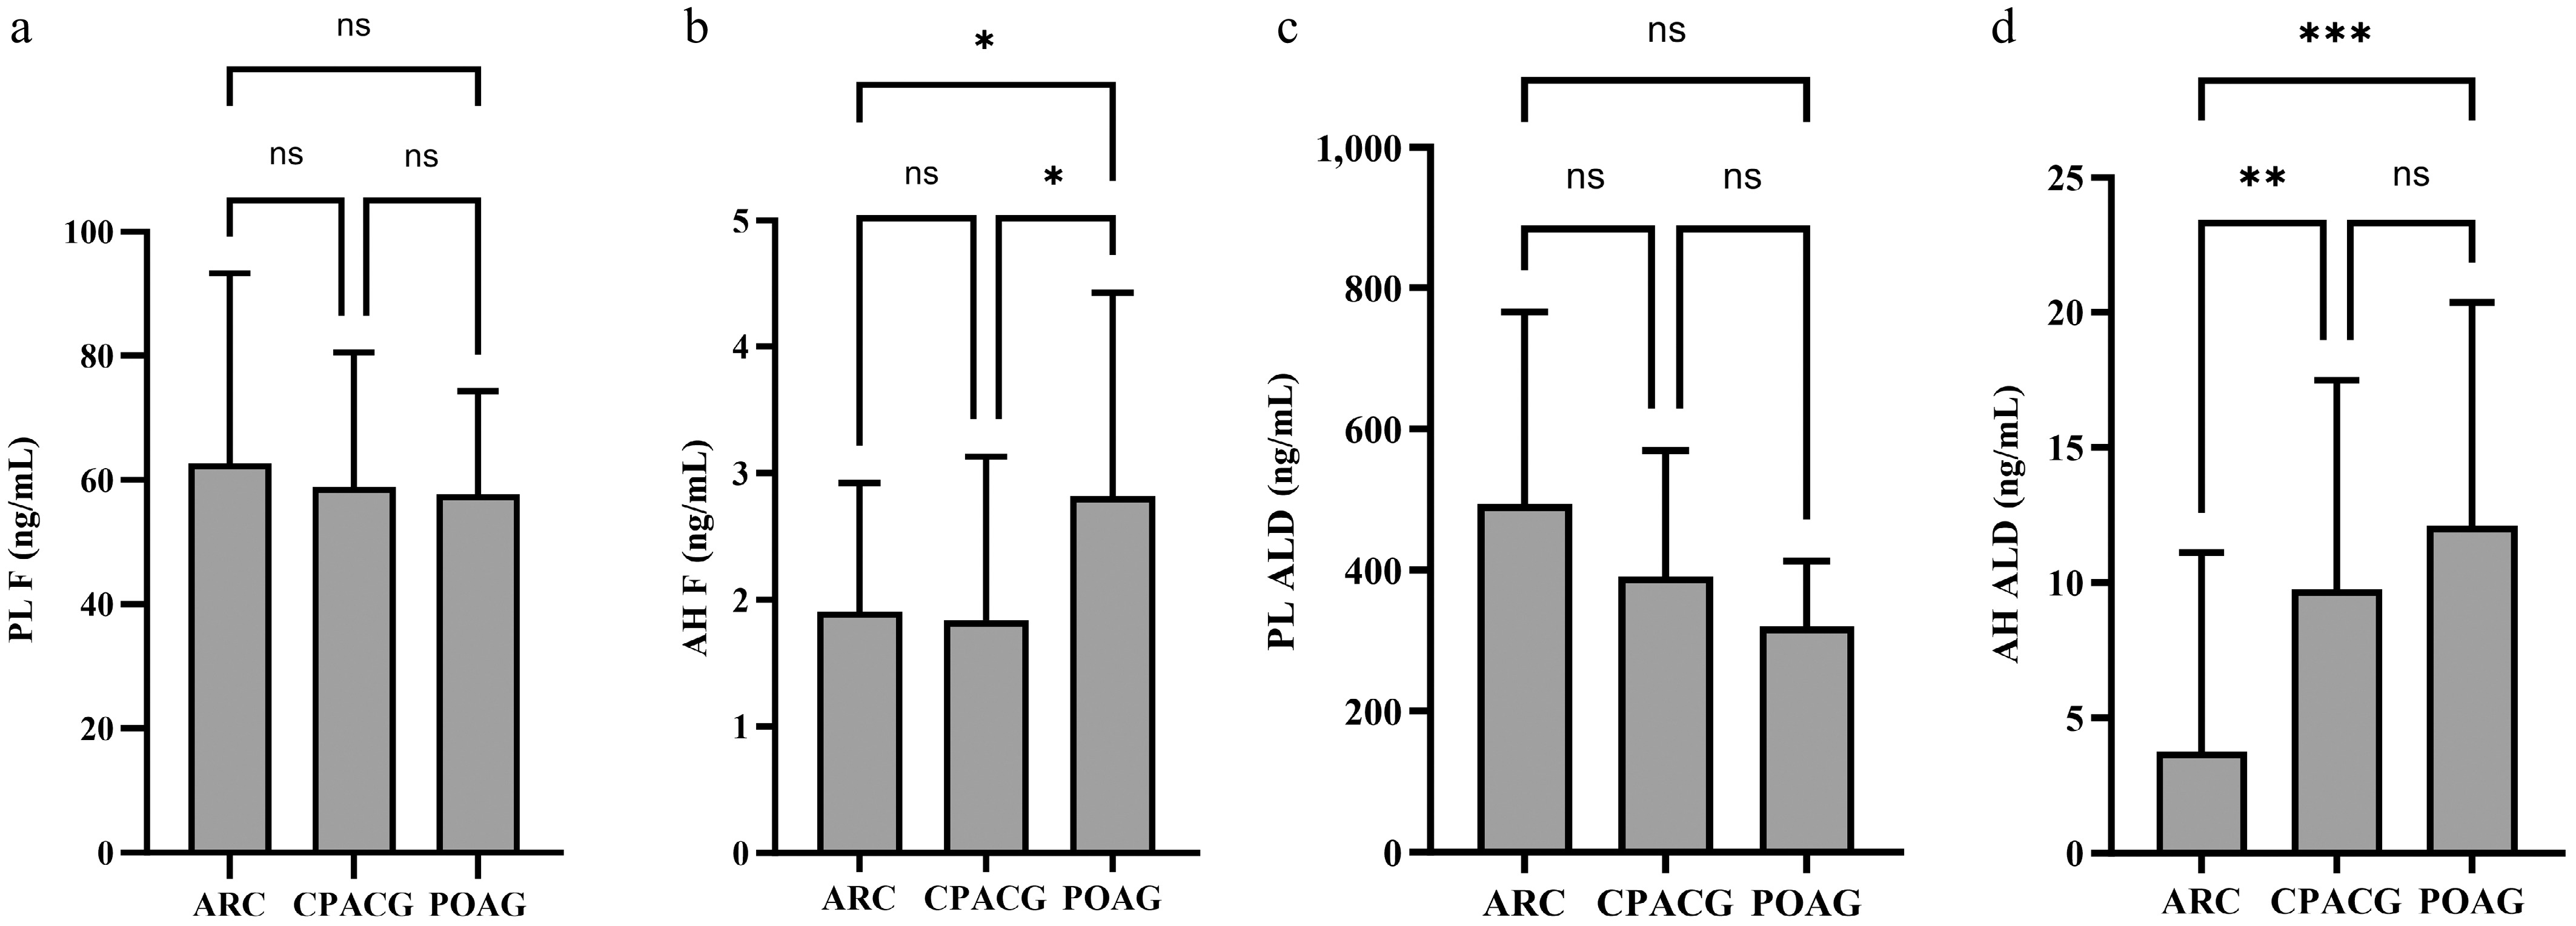
Figure 5.
Comparison of cortisol and aldosterone concentrations among ARC, CPACG, and POAG groups. (a) No significant differences in plasma cortisol concentrations among groups. (b) Aqueous humor cortisol concentrations were significantly higher in POAG compared to ARC and CPACG. (c) No significant differences in plasma aldosterone concentrations. (d) Aqueous humor aldosterone concentrations were elevated in both POAG and CPACG compared to ARC (p < 0.01). Notes: Data are presented as mean ± SD. *p < 0.05, **p < 0.01, ***p < 0.001. AH, aqueous humor; PL, plasma; ALD, aldosterone; CORT, corticosterone; COR, cortisone; F, cortisol. ARC group: 63 aqueous humor, 42 plasma. POAG group: 19 aqueous humor, 12 plasma. CPACG group: 20 aqueous humor, 20 plasma.
-
Group ALD CORT COR F DHEA 17OHP PL (n = 92) 418.73 ± 229.38 0.99 + 1.02 8.63 ± 6.07 58.72 ± 26.76 0.51 ± 0.73 0.22 ± 0.34 AH (n = 121) 6.73 ± 8.32 0.18 ± 0.20 0.42 ± 0.37 1.95 ± 1.25 PL/AH 62.04 5.44 20.43 29.96 AH, aqueous humor; PL, plasma; ALD, aldosterone; CORT, corticosterone; COR, cortisone; F, cortisol; DHEA, dehydroepiandrosterone; 17OHP, 17-hydroxyprogesterone. Table 1.
Concentrations (ng/mL) and ratios of steroid hormones in total PL and AH samples.
-
Group ARC CPACG POAG η2 (95% CI) F P PL 62.73 ± 30.58 58.89 ± 21.64 57.71 ± 16.55 0.01 (0.00~0.06) 0.24 0.785 AH 1.91 ± 1.02 1.84 ± 1.29 2.82 ± 1.61*# 0.09 (0.01~0.19) 4.65 0.012 PL/AH 32.9 32.03 20.49 AH, aqueous humor; PL, plasma. * Compared with the ARC group, p < 0.05; # Compared with the CPACG group, p < 0.05. Group comparisons: one-way ANOVA and post hoc pairwise comparisons were conducted using the Bonferroni method. Table 2.
Comparison of cortisol concentrations (ng/mL) and corresponding ratios in PL and AH among ARC, CPACG, and POAG groups.
-
Variables SHs CPACG PAC/PACS d (95% CI) t P PL ALD 391.4 ± 177.8 334.3 ± 178.5 0.32 (−0.32~0.96) 0.99 0.330 F 58.89 ± 21.64 43.30 ± 30.10 0.60 (−0.06~1.25) 1.82 0.079 AH ALD 9.77 ± 7.23 7.94 ± 8.45 0.23 (−0.41~0.85) 0.70 0.486 F 1.84 ± 1.29 1.39 ± 1.13 0.37 (−0.28~1.01) 1.13 0.266 AL 22.38 ± 0.89 22.53 ± 0.84 0.17 (−0.46~0.80) 0.52 0.605 ACD 2.37 ± 0.24 2.34 ± 0.19 0.10 (−0.53~0.73) 0.33 0.746 AH, aqueous humor; PL, plasma; SHs, steroid hormones; ALD, aldosterone; F, cortisol. Group comparisons: unpaired t-test. Table 3.
Comparison of ALD and F concentrations (ng/mL) in PL and AH, AL and ACD values (mm) between the CPACG and PAC/PACS groups.
Figures
(5)
Tables
(3)