-
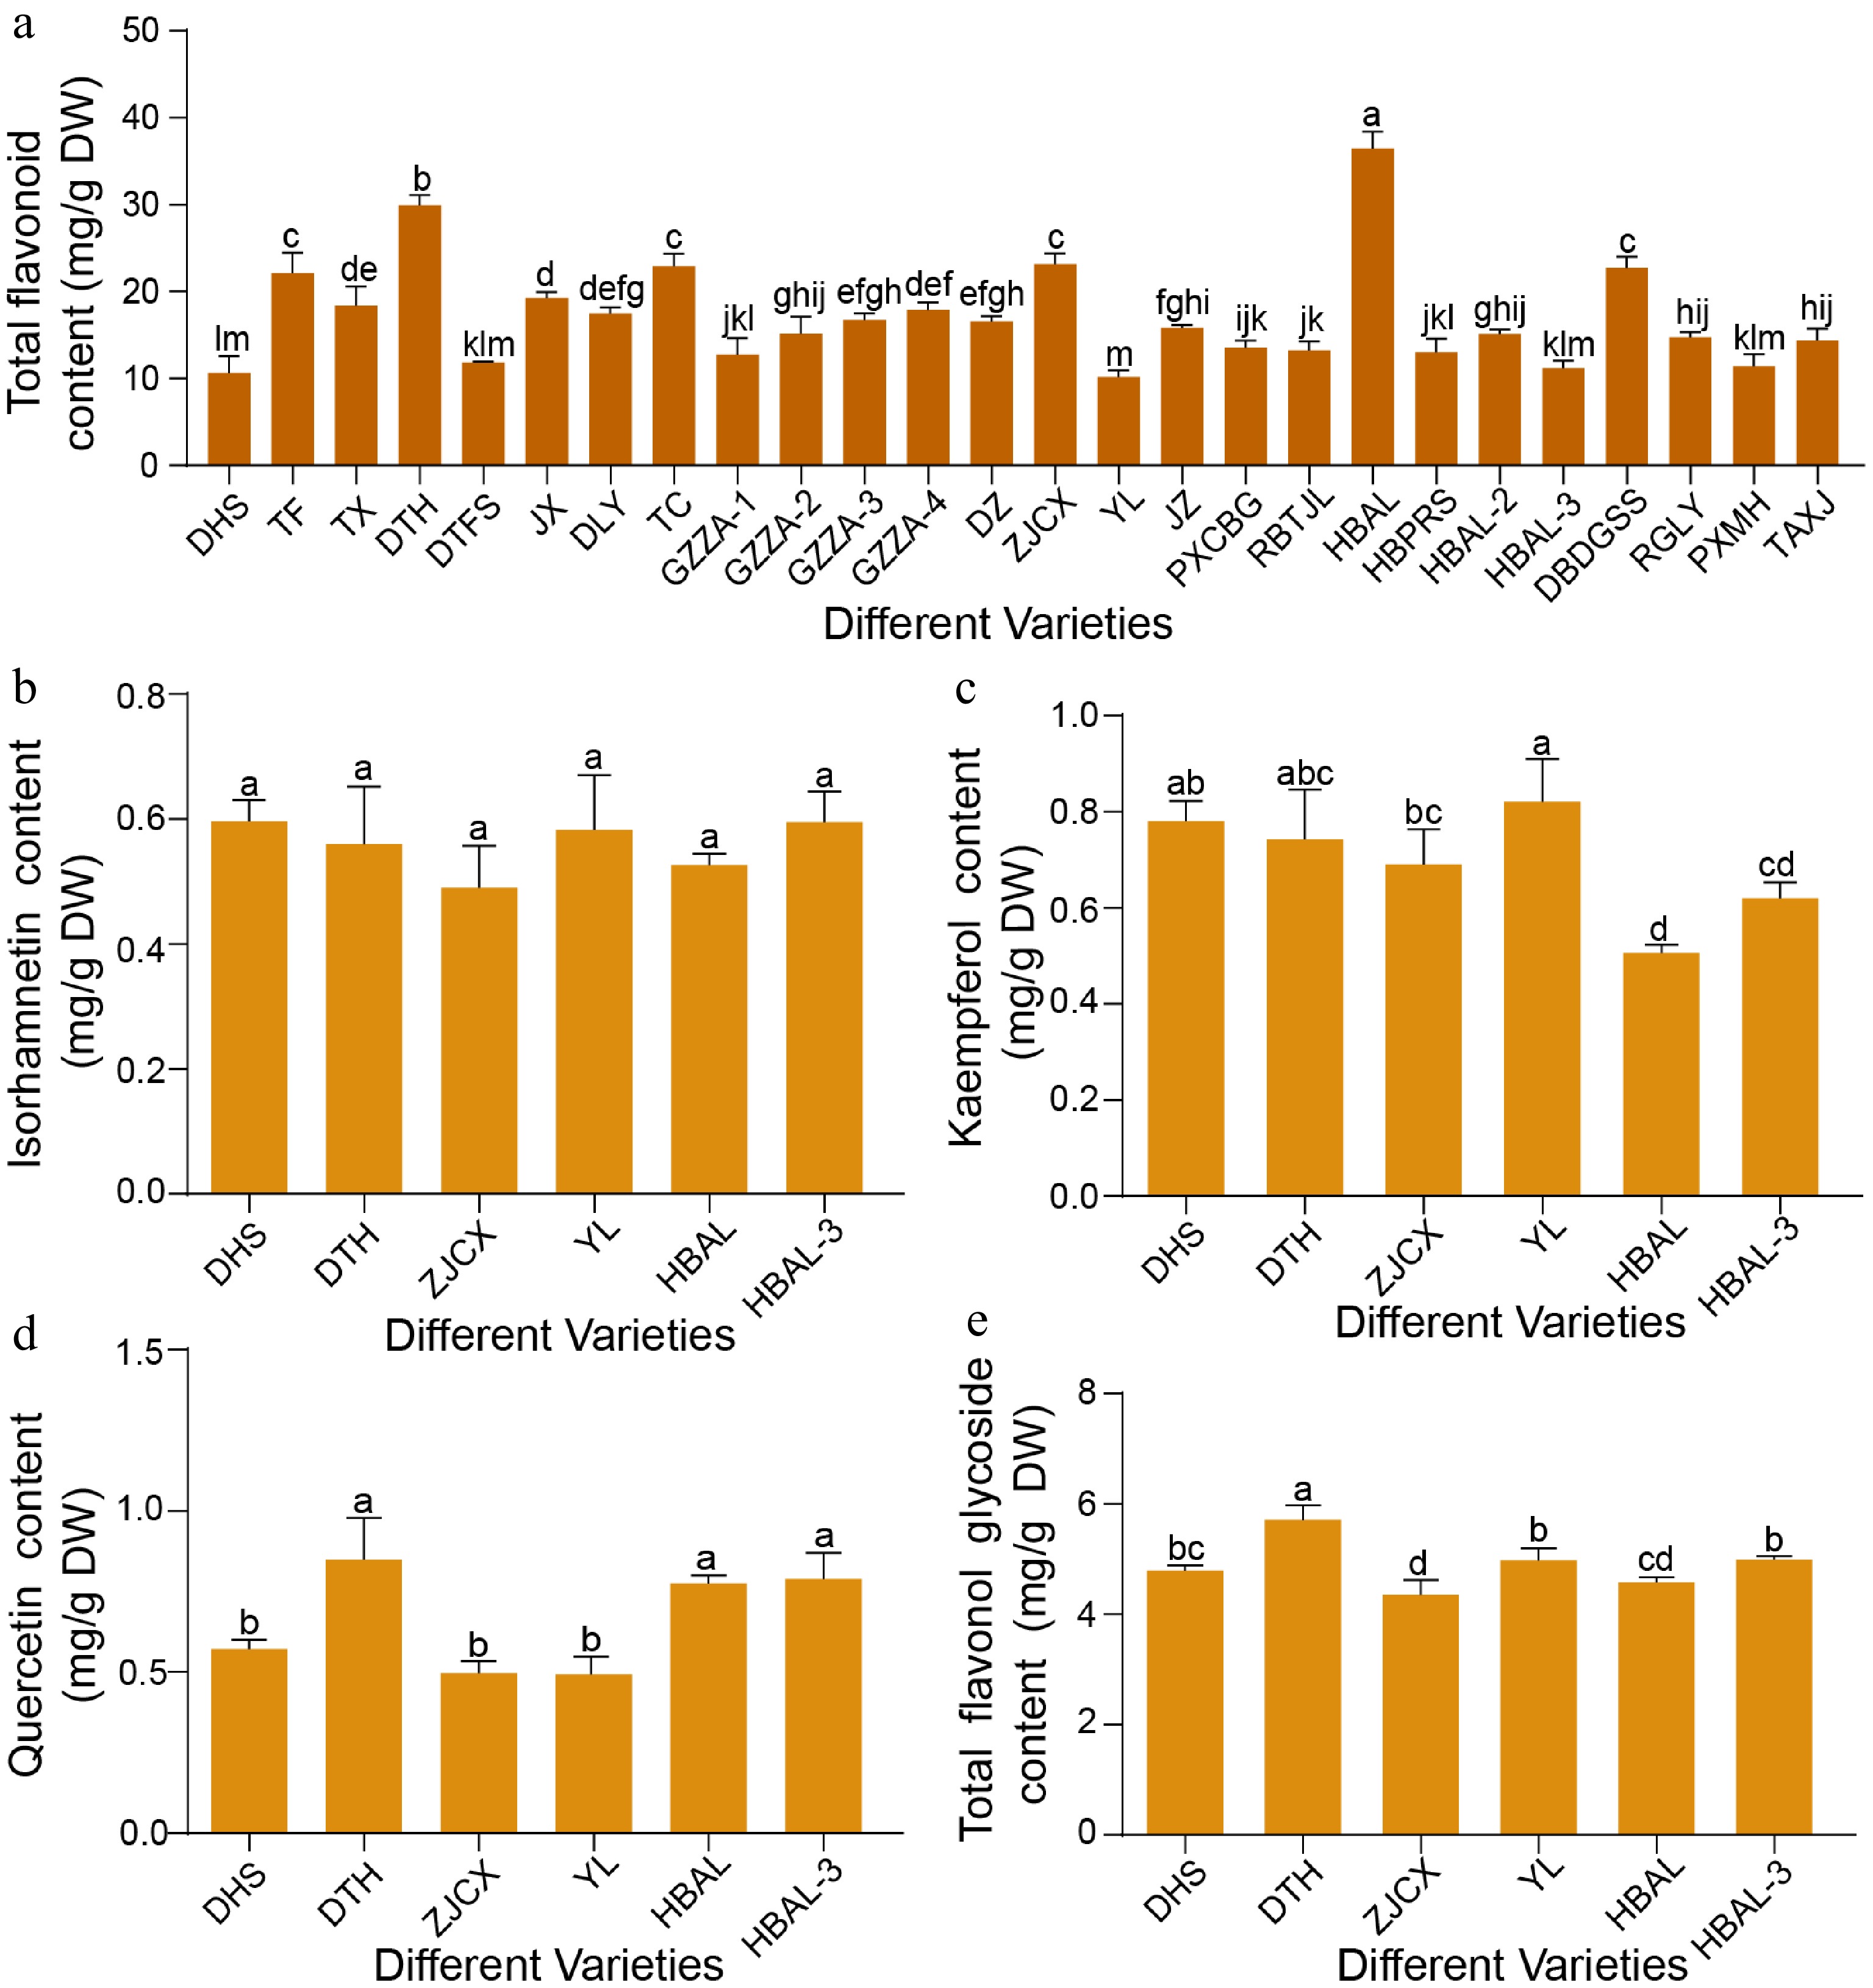
Figure 1.
Variation in flavonoid content among different G. biloba cultivars. (a) Total flavonoid levels in leaves of 26 G. biloba cultivars. (b) Isorhamnetin, (c) kaempferol, (d) quercetin, and (e) total flavonol glycoside contents in leaves of six selected cultivars. Statistical significance was determined by one-way ANOVA. Different lowercase letters indicate significant differences (p < 0.05). Data are presented as mean ± SD (n = 3 biological replicates).
-
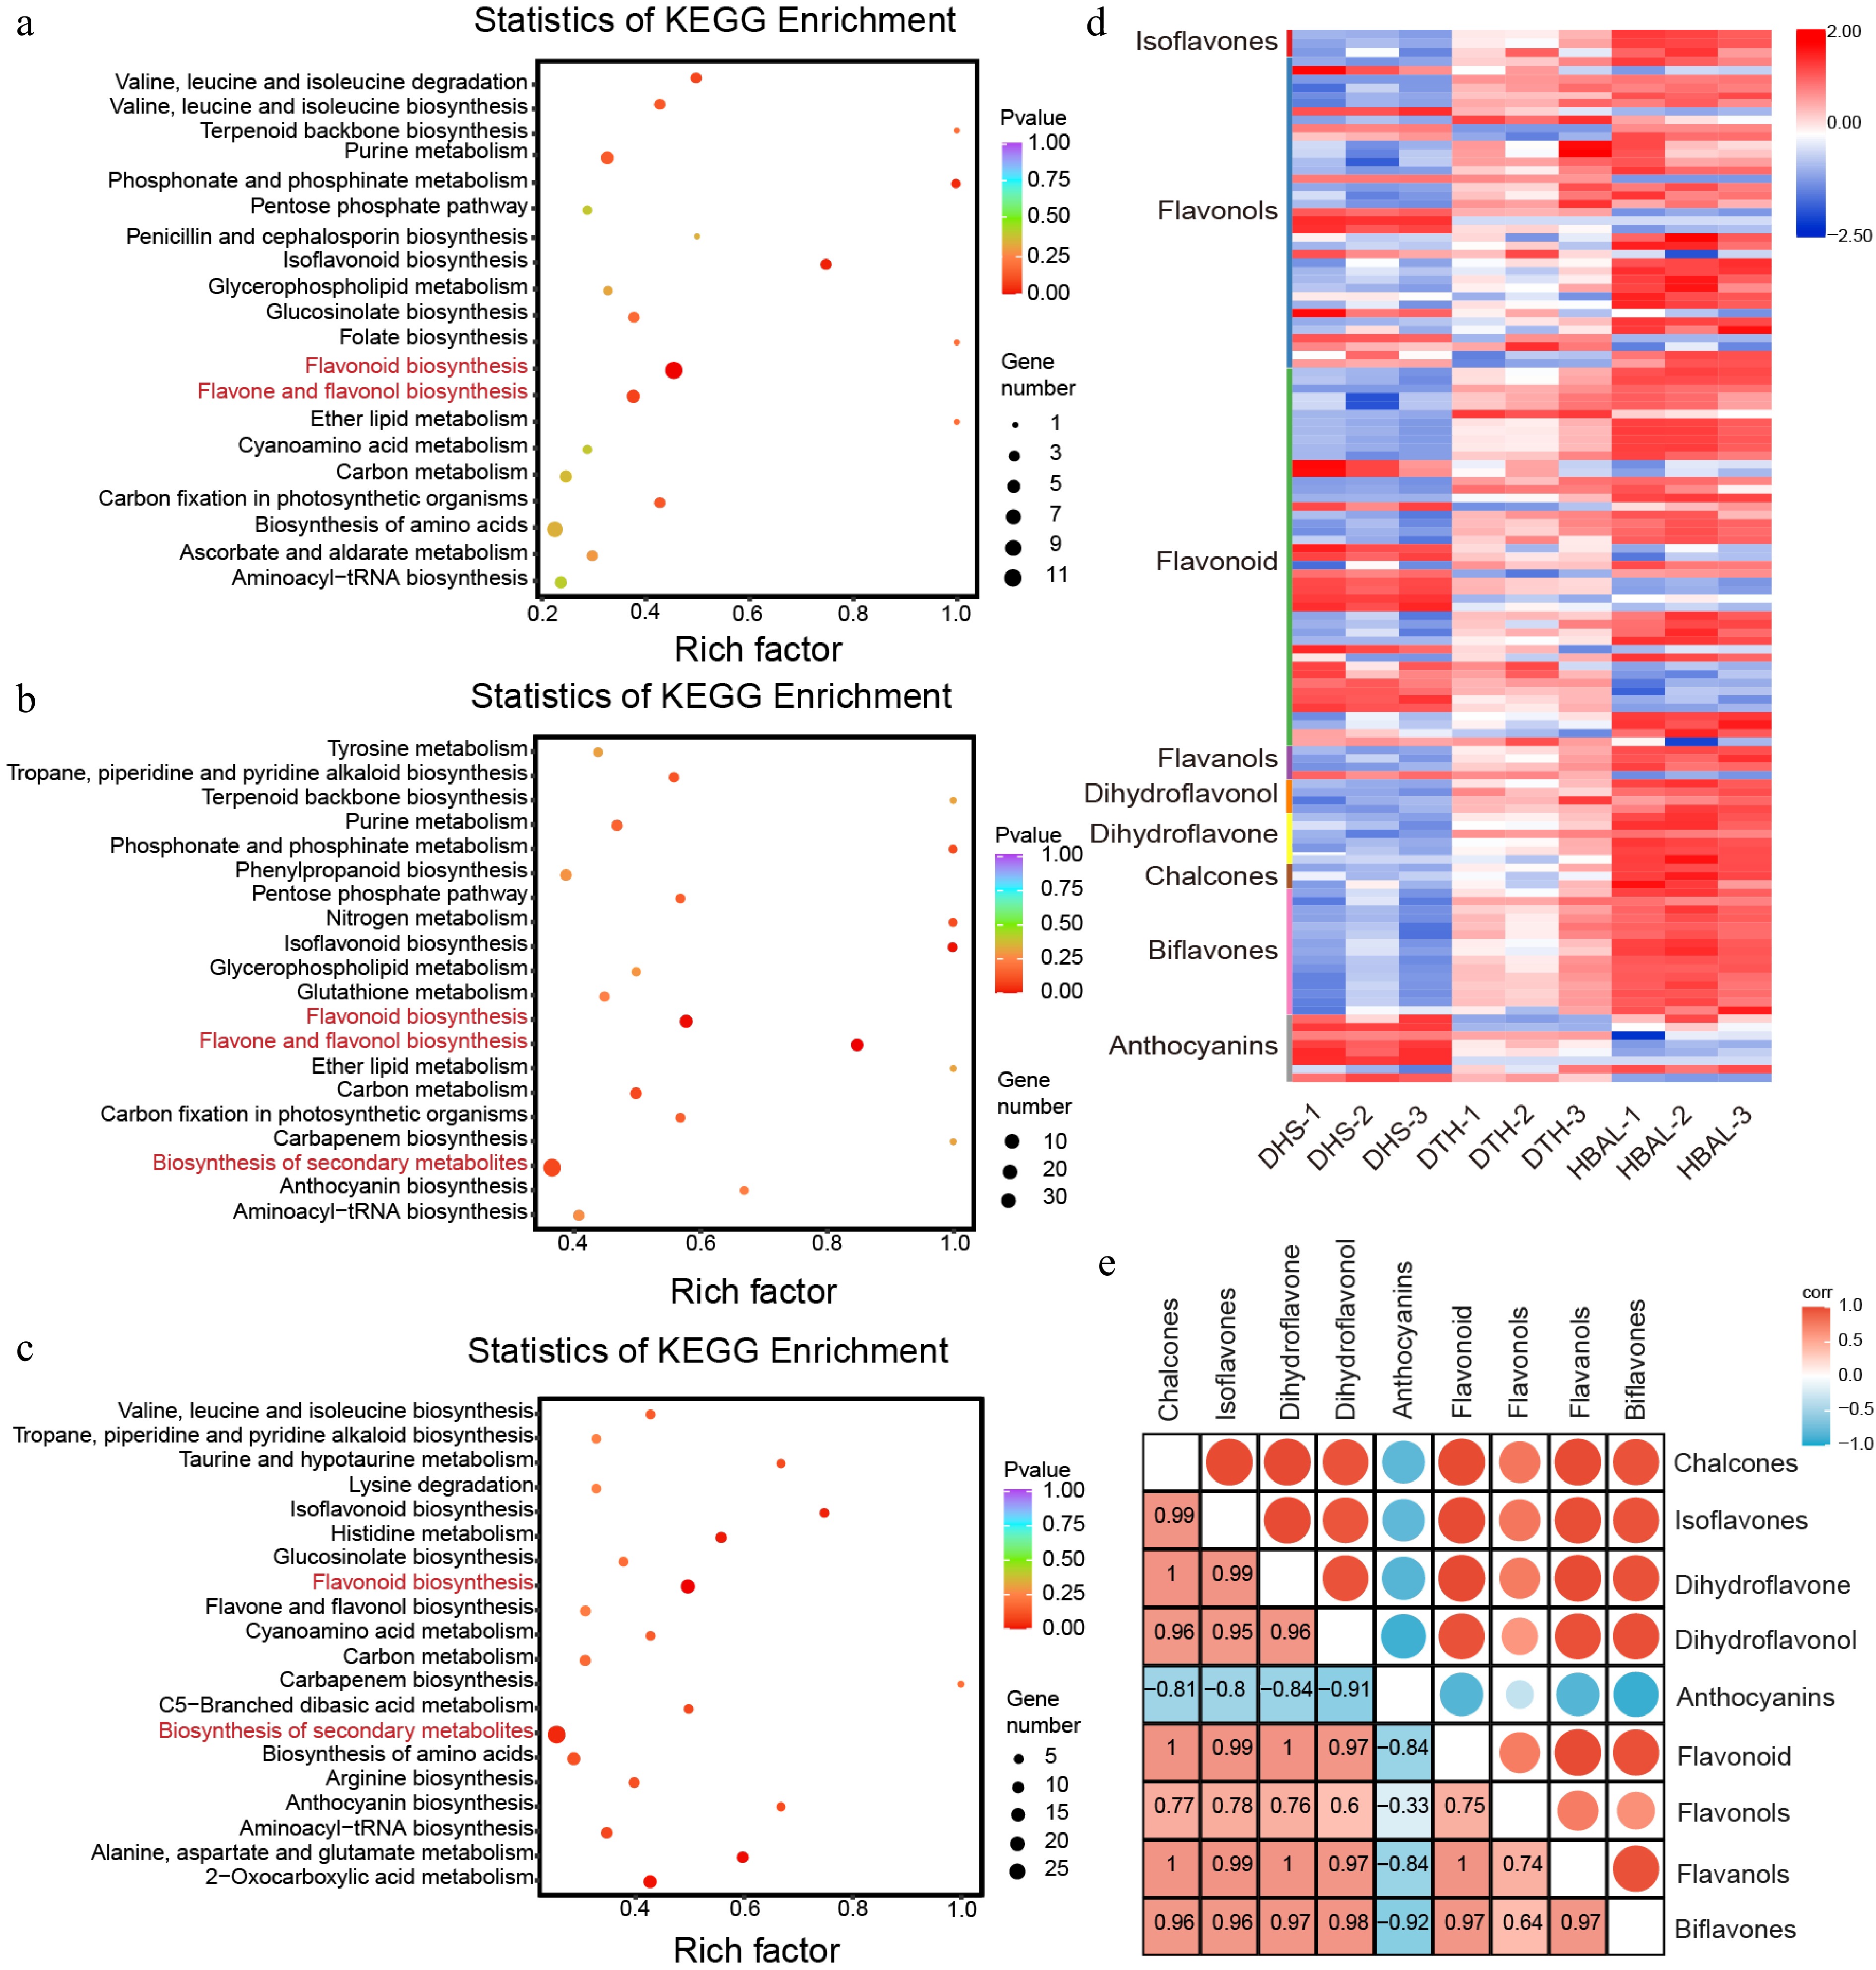
Figure 2.
Metabolomic analysis of three G. biloba cultivars. KEGG pathway enrichment analysis of DAMs in the comparisons between (a) 'DTH' and 'DHS', (b) 'HBAL' and 'DHS', and (c) 'DTH' and 'HBAL'. The rich factor represents the proportion of DAMs mapped to a given pathway relative to the total number of annotated metabolites in that pathway, and the circle size indicates the number of DAMs. (d) Distribution of differentially accumulated flavonoid metabolites among cultivars. (e) Correlation analysis between anthocyanins and other flavonoid subclasses.
-

Figure 3.
Integrated transcriptomic and metabolomic profiling of flavonoid biosynthesis in G. biloba. (a) Expression patterns of DEGs and accumulation levels of DAMs associated with flavonoid biosynthesis. (b) Correlation network illustrating relationships between GbCHS expression and different flavonoid subclasses.
-
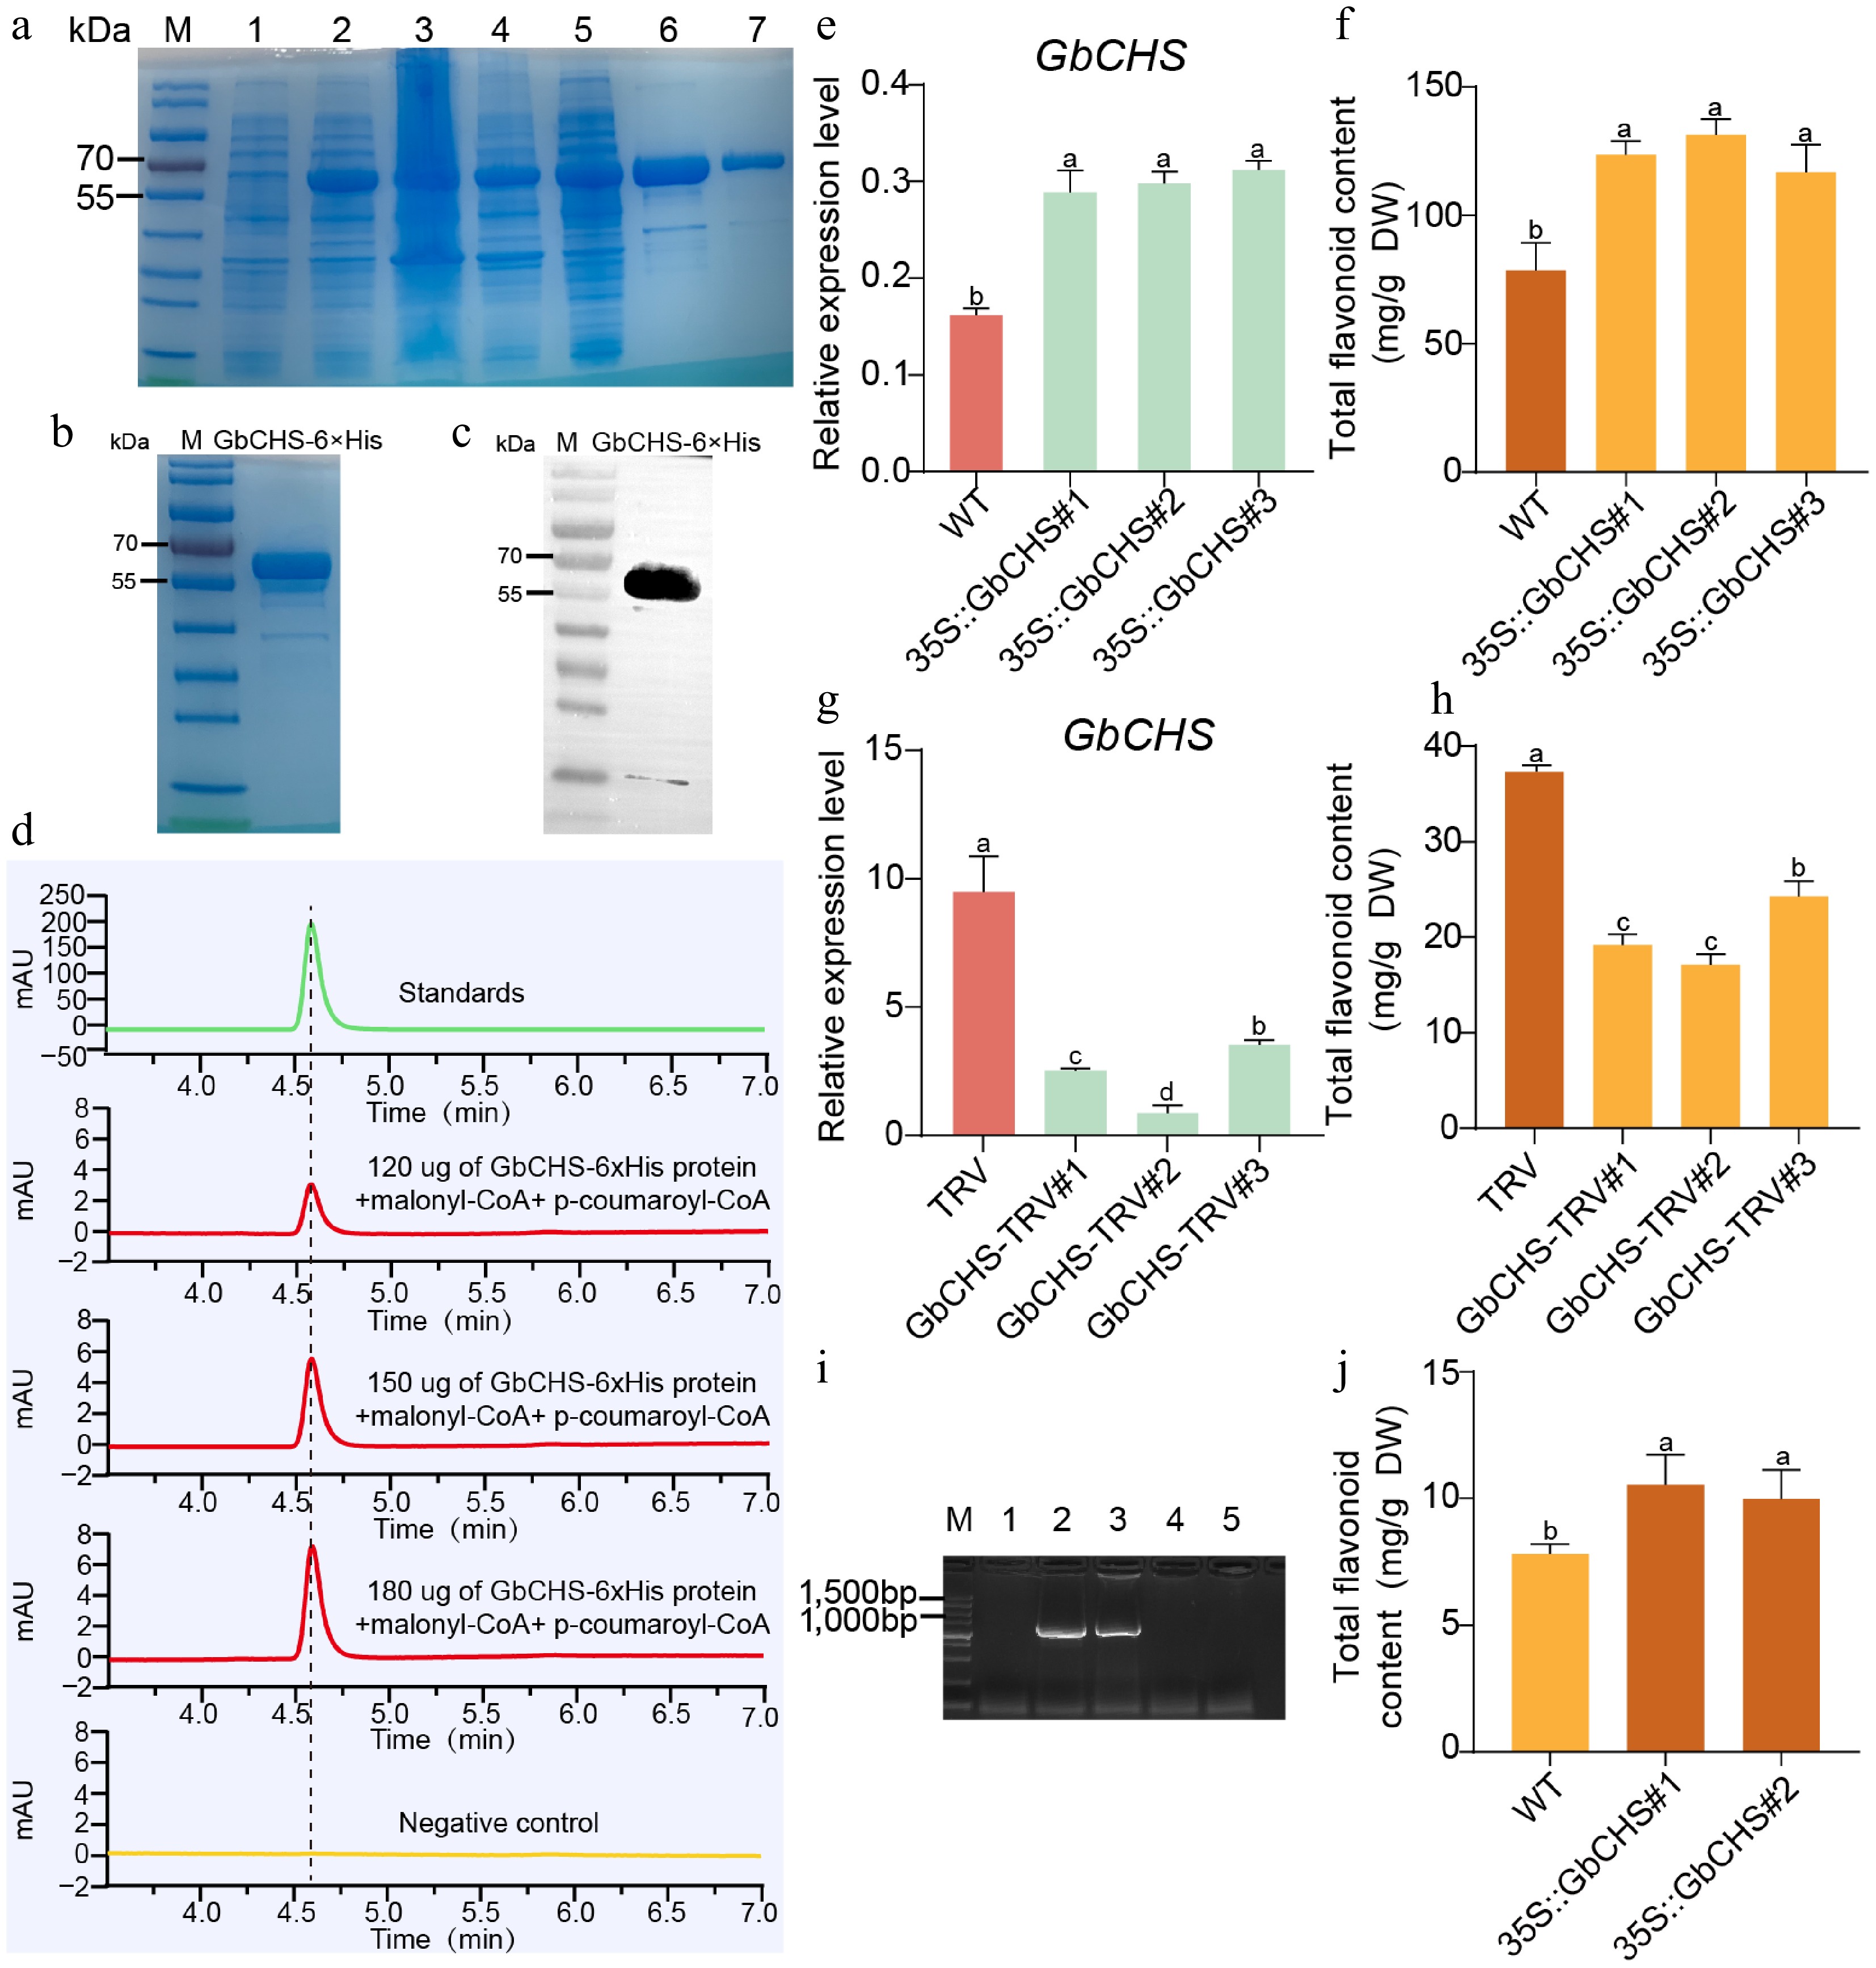
Figure 4.
GbCHS promotes the accumulation of total flavonoids. (a) Expression and purification of the recombinant GbCHS protein. M: Protein marker; 1: non-induced sample; 2: induced sample; 3: supernatant after induction and lysis; 4: pellet after induction and lysis; 5: flow-through during purification; 6−7: eluted GbCHS recombinant protein. (b) Buffer exchange and quality assessment of purified GbCHS protein. (c) Western blot analysis of recombinant GbCHS protein. (d) Enzymatic activity assay of GbCHS based on naringenin production. (e) Relative expression levels of GbCHS in overexpressing G. biloba calli. (f) Total flavonoid content in GbCHS-overexpressing G. biloba calli. (g) GbCHS expression levels in VIGS-mediated silenced G. biloba plants. (h) Total flavonoid content in GbCHS-silenced G. biloba plants. (i) Positive detection of GbCHS-overexpressing A. thaliana lines. M: DNA molecular weight marker; 1: wild-type A. thaliana (WT); 2−3: GbCHS-overexpressing A. thaliana; 4−5: negative control. (j) Total flavonoid content in GbCHS-overexpressing A. thaliana plants. Different lowercase letters indicate significant differences (p < 0.05). Data are presented as mean ± SD of three biological replicates (n = 3).
-
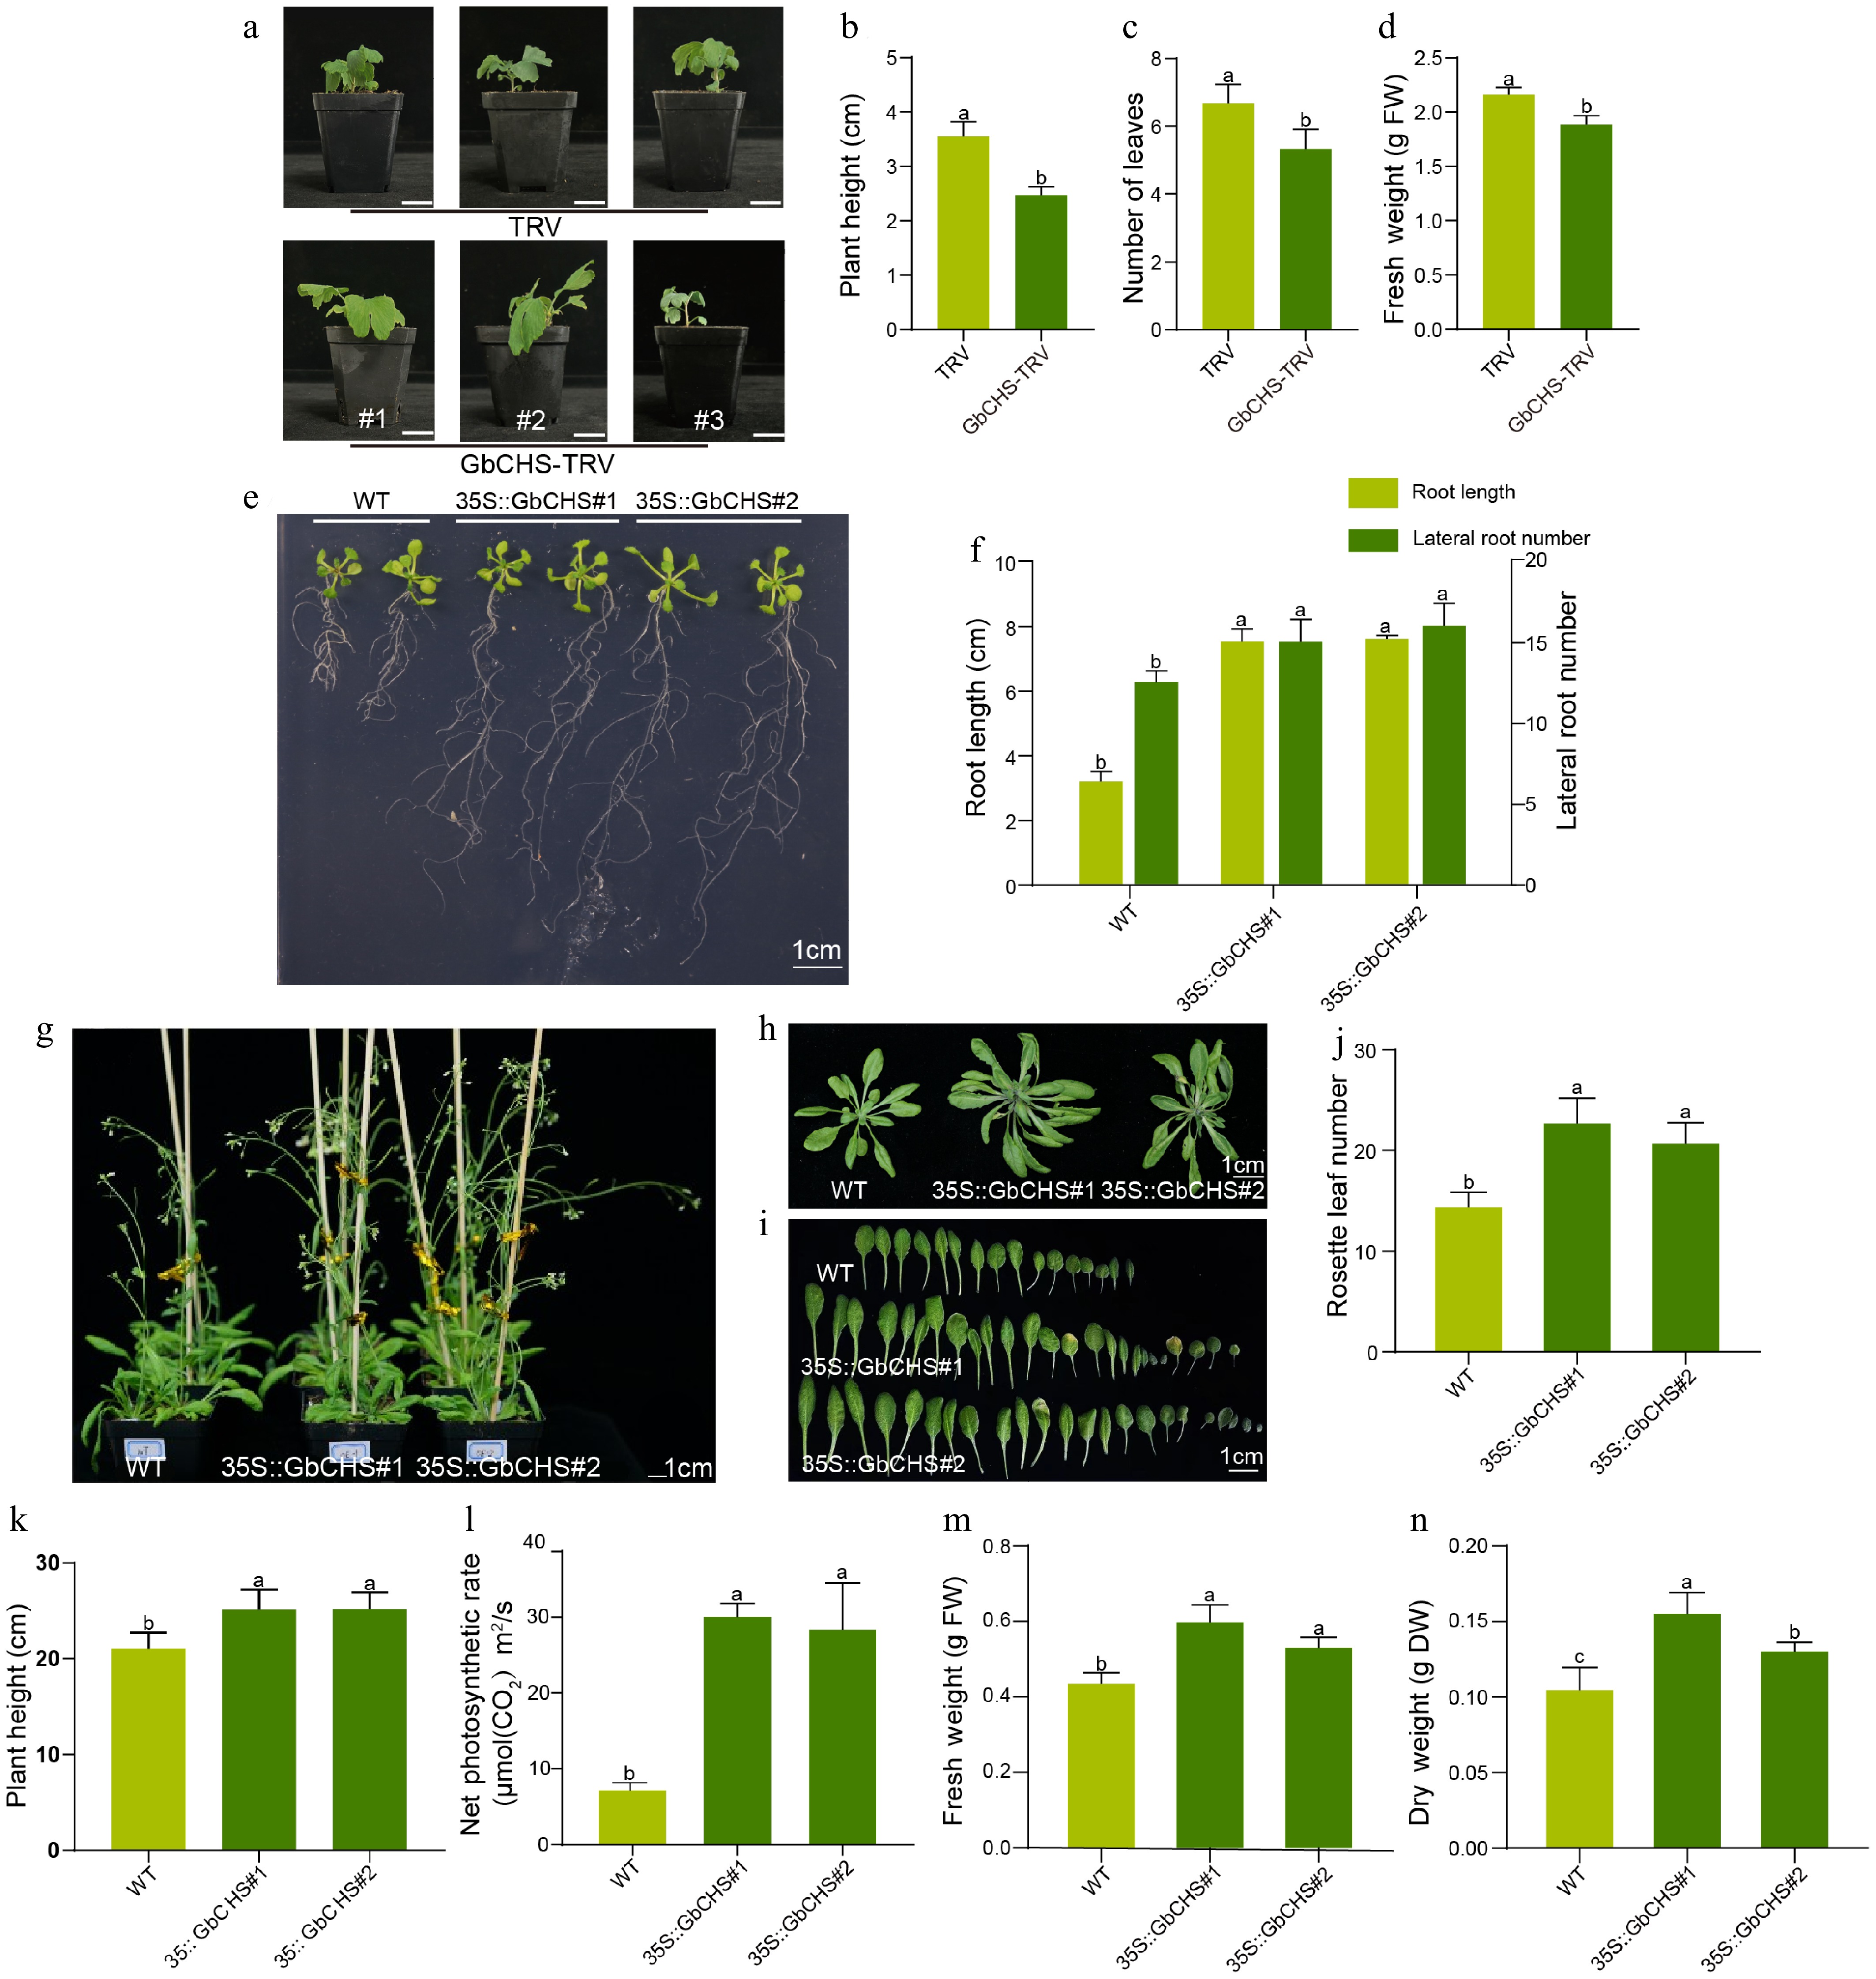
Figure 5.
Phenotypic effects of GbCHS silenced in G. biloba and GbCHS overexpression in A. thaliana plants. (a), (b) Comparison of plant height. (c) Comparison of the number of leaves. (d) Comparison of fresh weight. Plant height was measured from the soil surface to the apical meristem. Scale bar = 3 cm. (e), (f) Comparison of root traits. (g)−(j) Comparison of rosette leaf number. (k) Comparison of plant height. (l) Comparison of net photosynthetic rate. (m) Comparison of aboveground fresh weight (FW). (n) Comparison of aboveground dry weight (DW). Statistical significance was determined by ANOVA. Different lowercase letters indicate significant differences at p < 0.05. All data are shown as the mean ± SD (sample sizes: n = 3 for panels 5B−5F; n = 5 for panels 5H and 5K−5P).
-
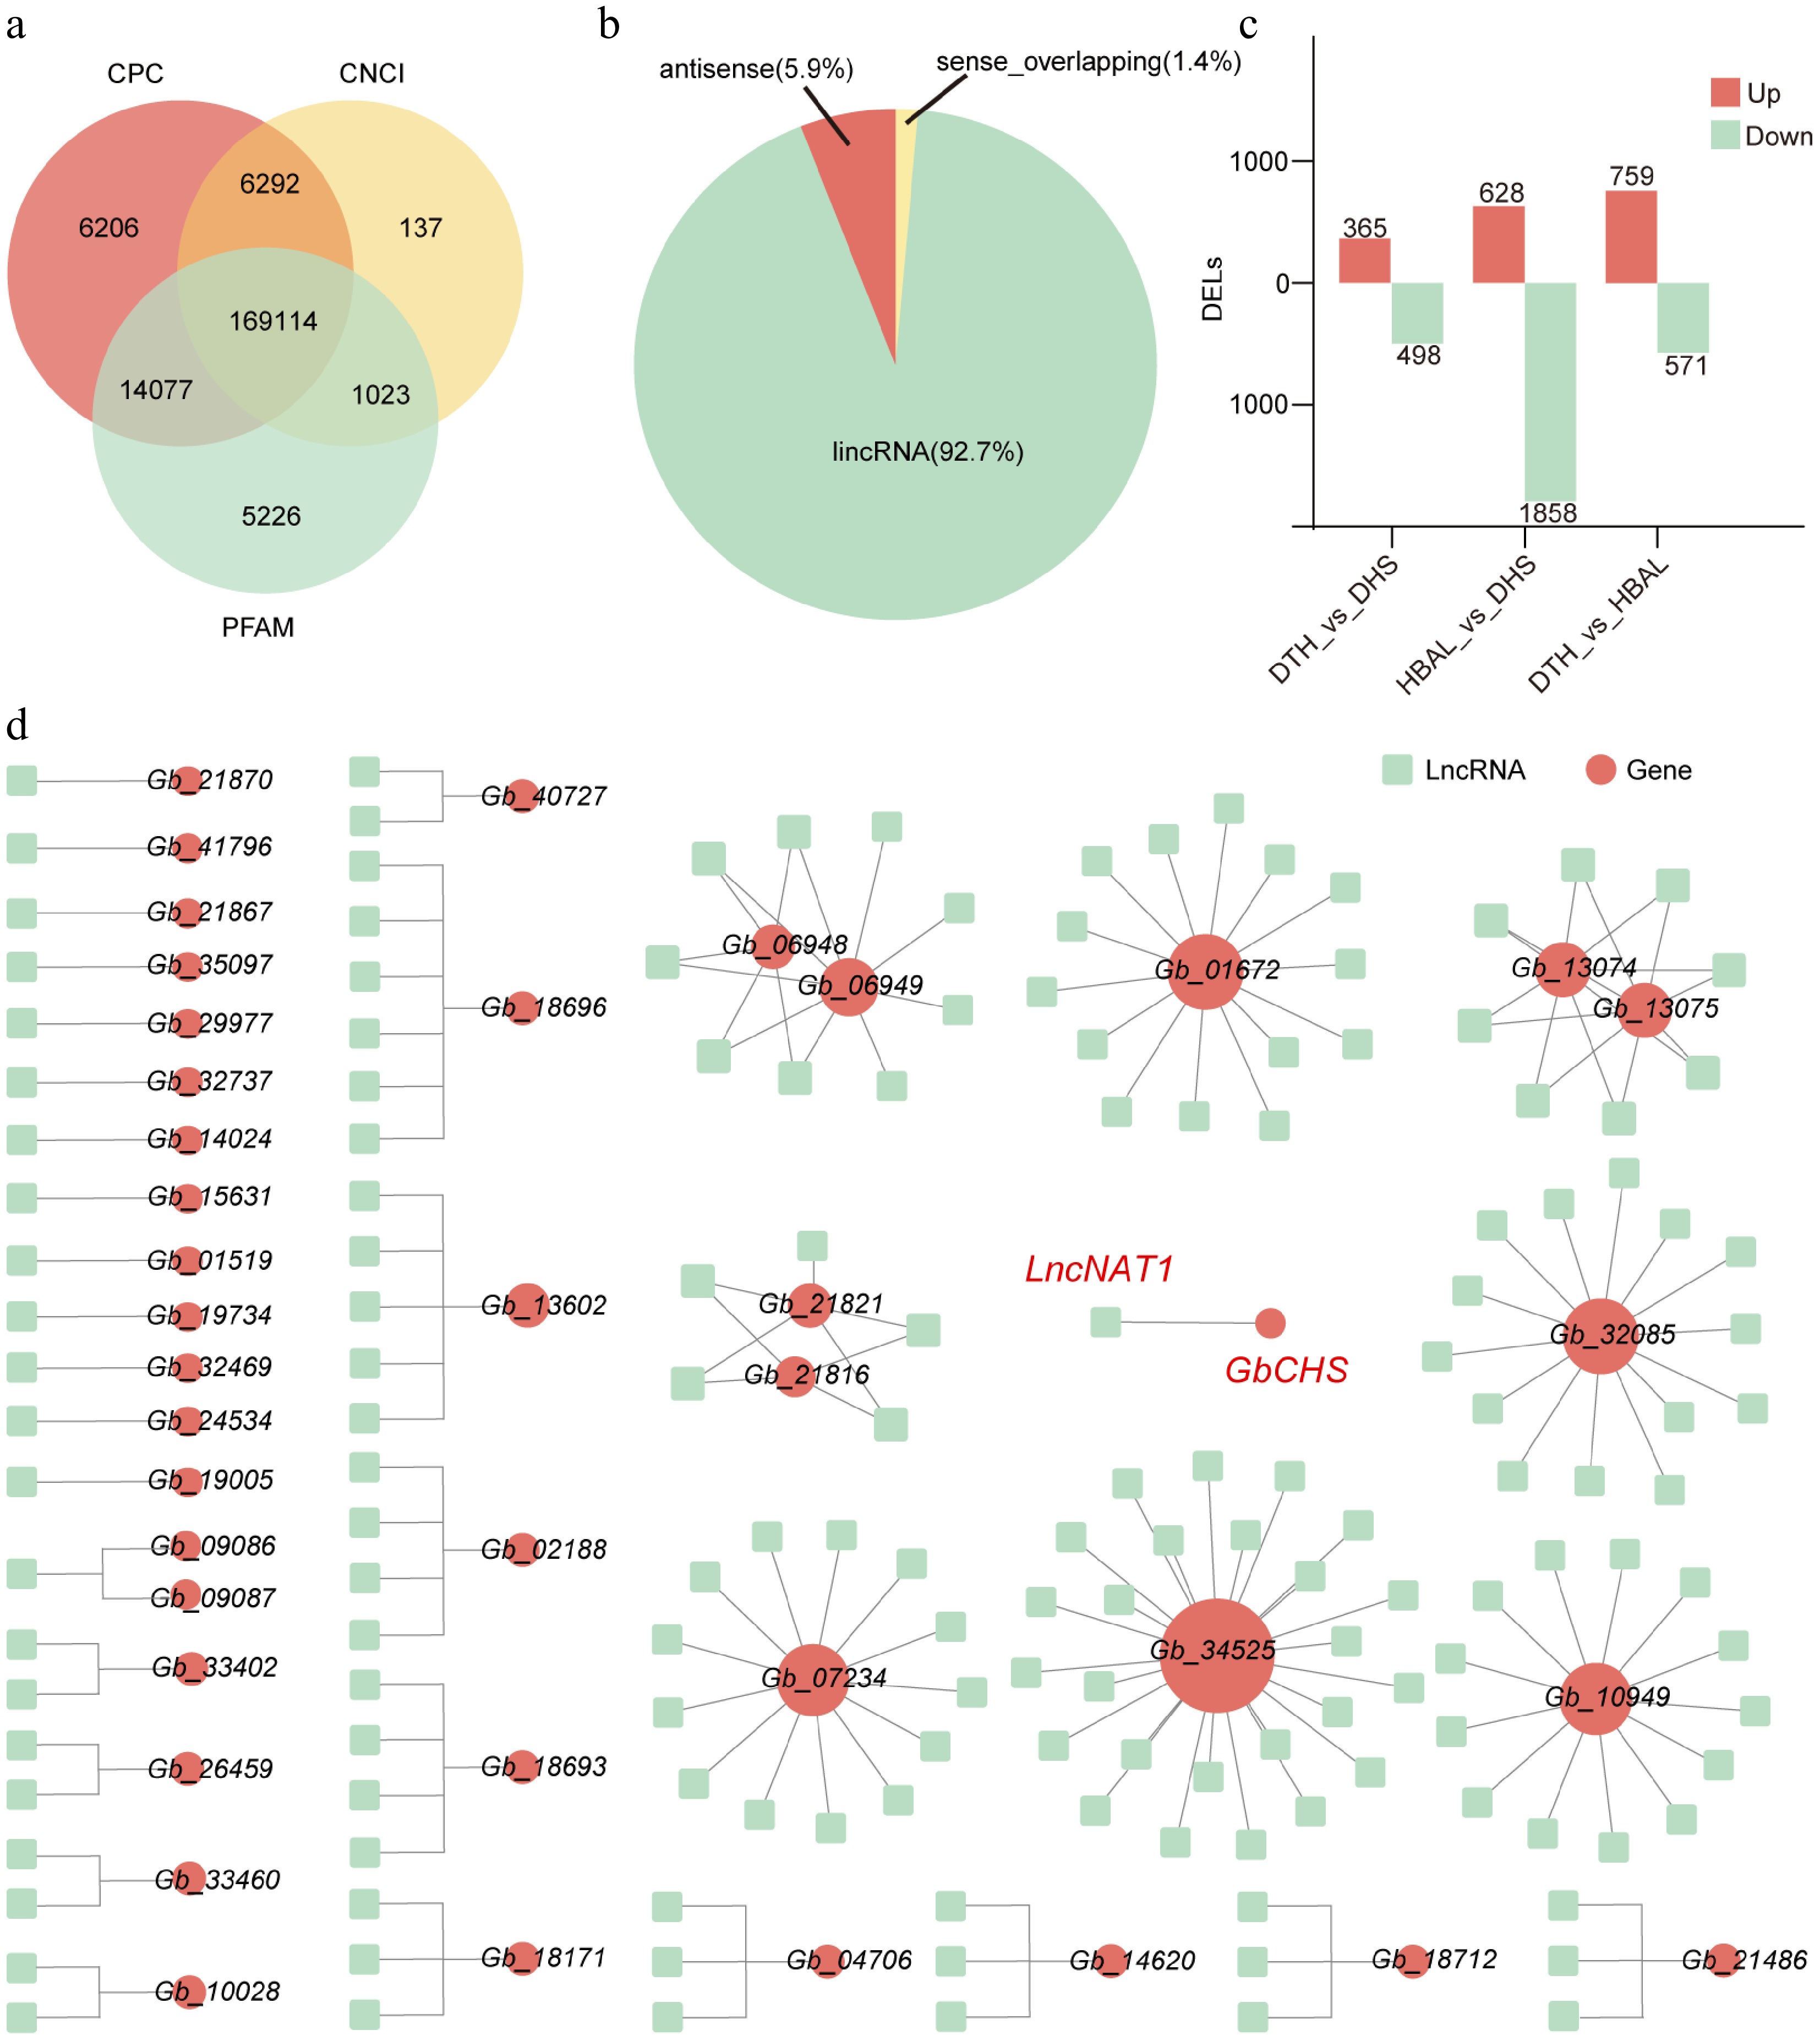
Figure 6.
Genome-wide identification and regulatory network analysis of lncRNAs in three G. biloba cultivars. (a) Identification pipeline and number of lncRNAs detected. (b) Classification of identified lncRNAs into lincRNAs. (c) Numbers of DELs among the three cultivar comparisons. (d) DELs-flavonoid biosynthesis gene networks.
-
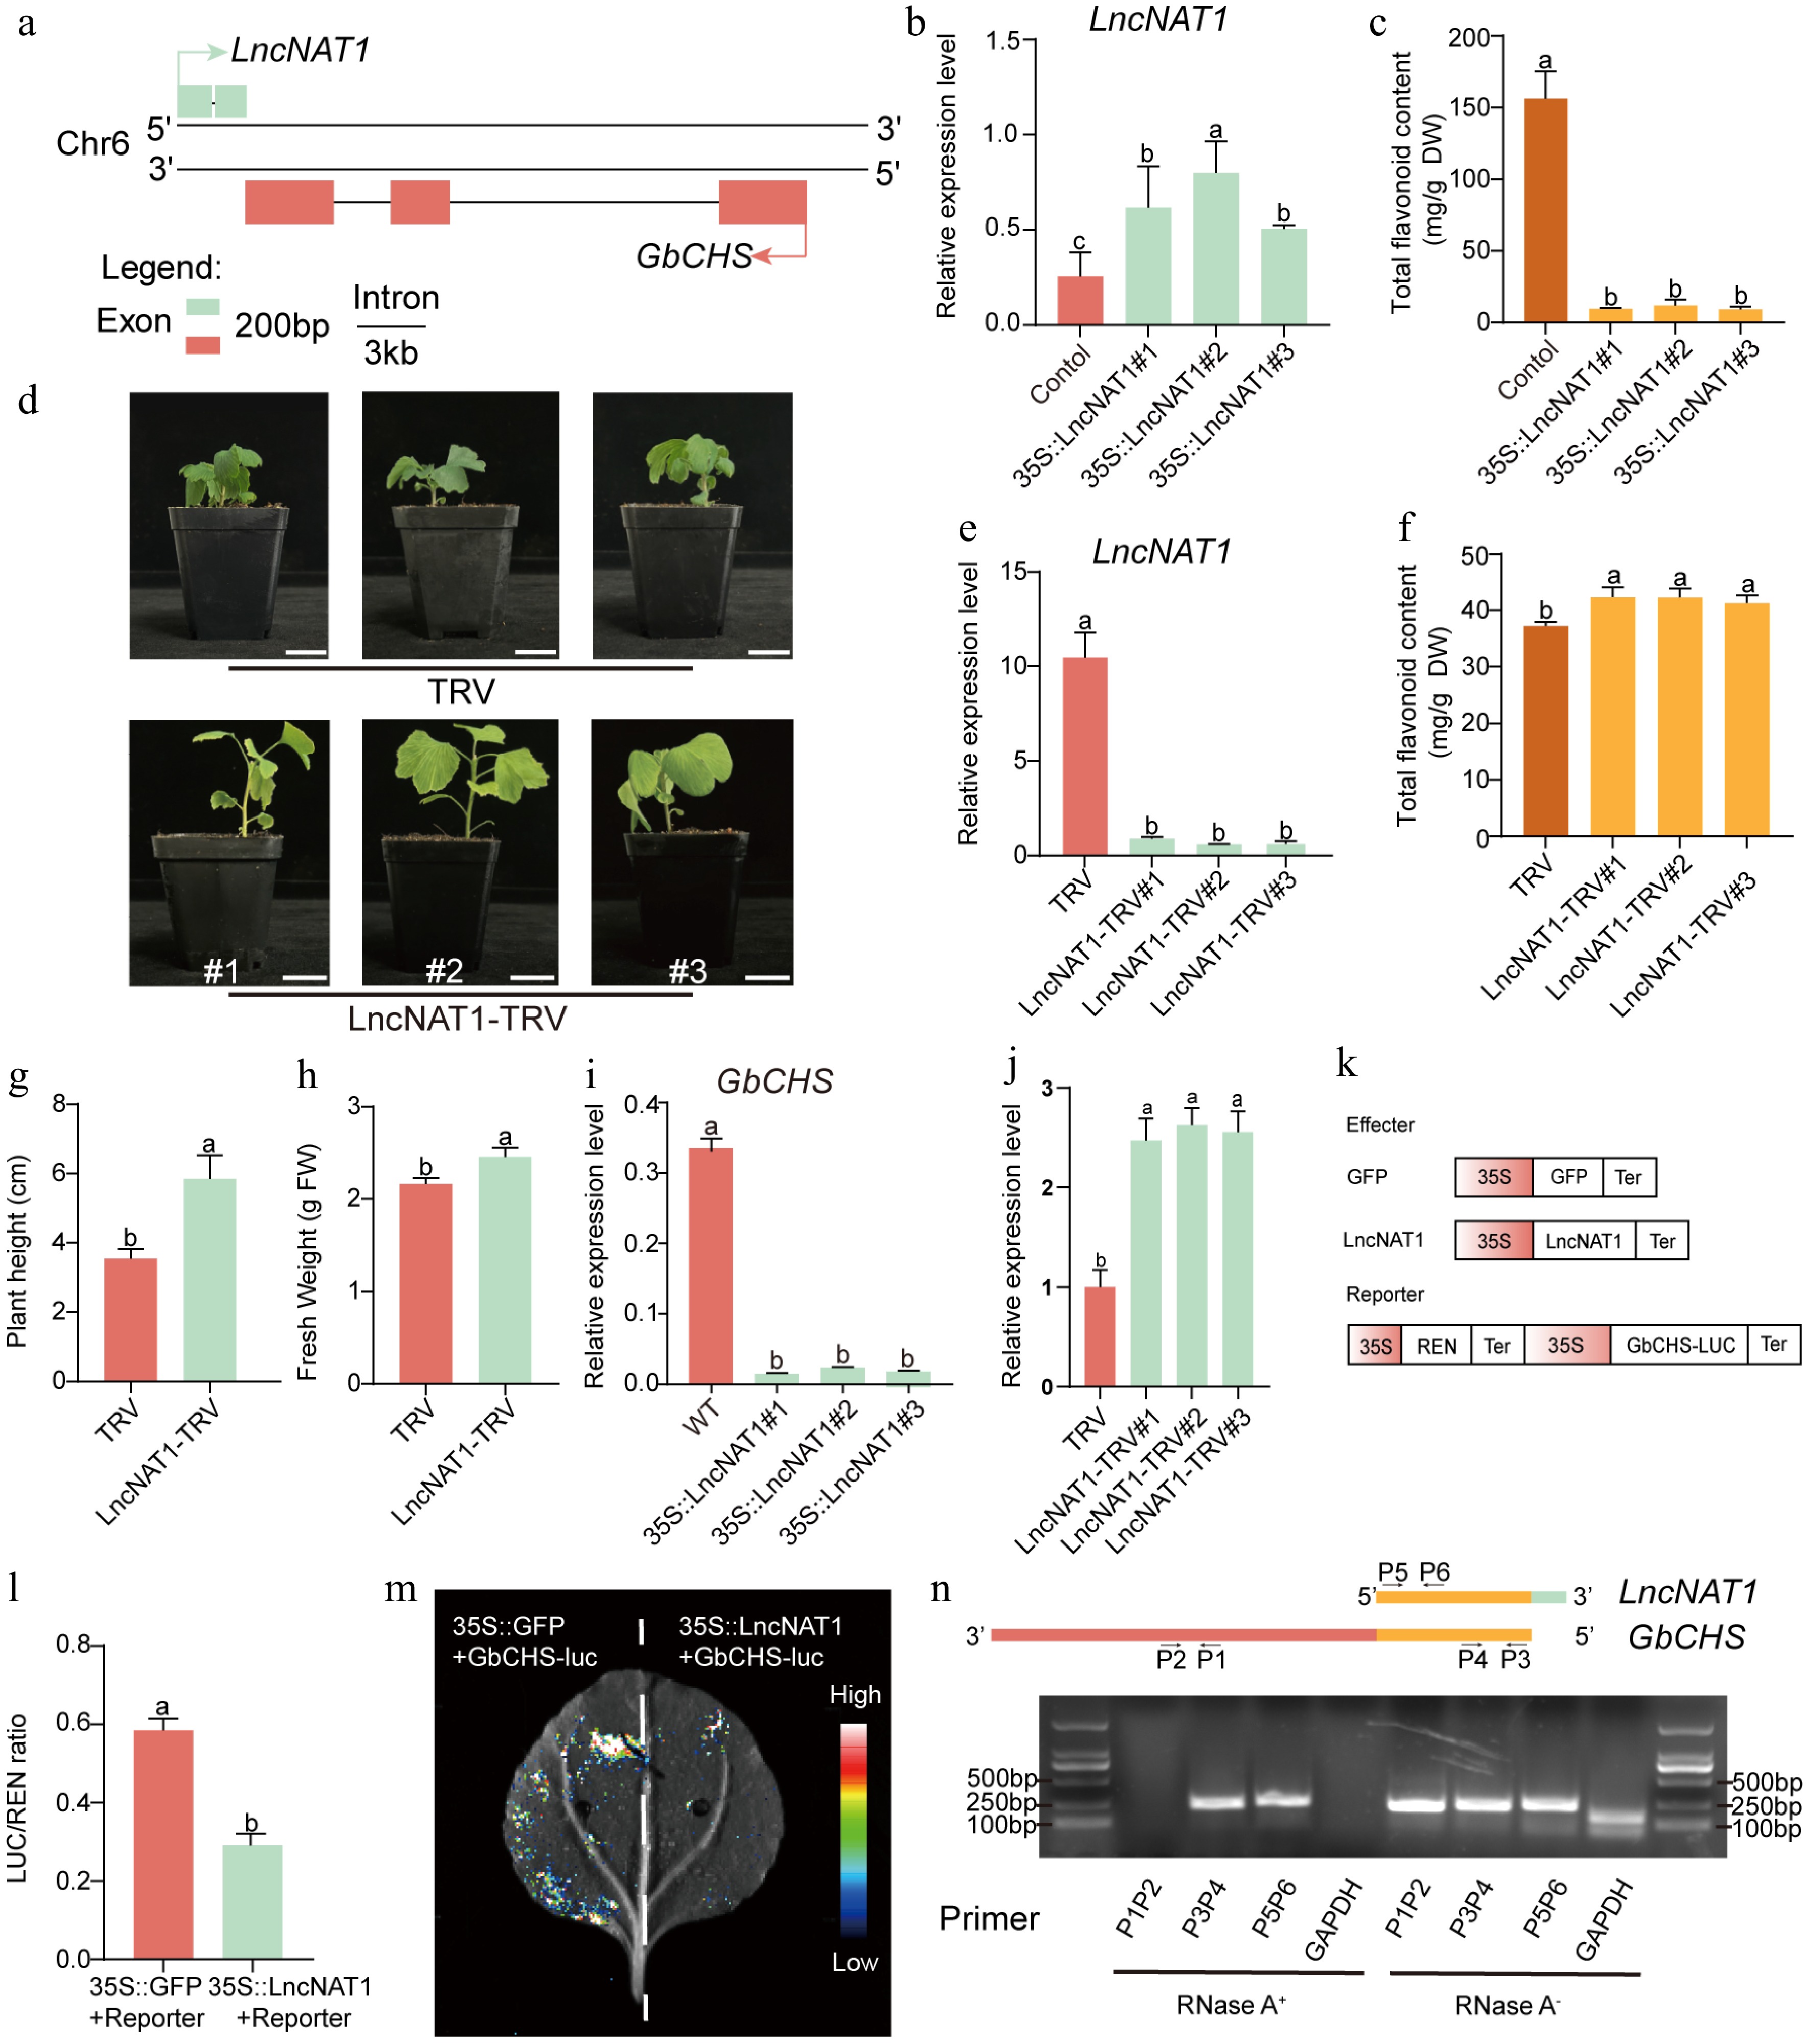
Figure 7.
LncNAT1 negatively regulates flavonoid biosynthesis and plant development by inhibiting GbCHS. (a) Genomic organization showing the antisense relationship between LncNAT1 and GbCHS. (b) LncNAT1 transcript levels, and (c) total flavonoid content in LncNAT1-overexpressing G. biloba calli. (d) Phenotypes of LncNAT1-silenced G. biloba plants. Scale bars = 3 cm. (e) LncNAT1 expression levels (f) and total flavonoid accumulation in LncNAT1-silenced G. biloba plants. (g), (h) Comparison of plant height and fresh weight between LncNAT1-silenced plants and TRV control. GbCHS transcript levels in (i) LncNAT1-overexpressing calli and (j) LncNAT1-silenced plants. (k) Schematic of DLR vector. (l) DLR assay showing repression of GbCHS activity by LncNAT1. (m) Luciferase imaging assay verifies the regulatory relationship between LncNAT1 and GbCHS. (n) RPA analysis of LncNAT1-GbCHS binding interaction. Different lowercase letters indicate significant differences (p < 0.05). Data represent mean ± SD of three biological replicates (n = 3).
-
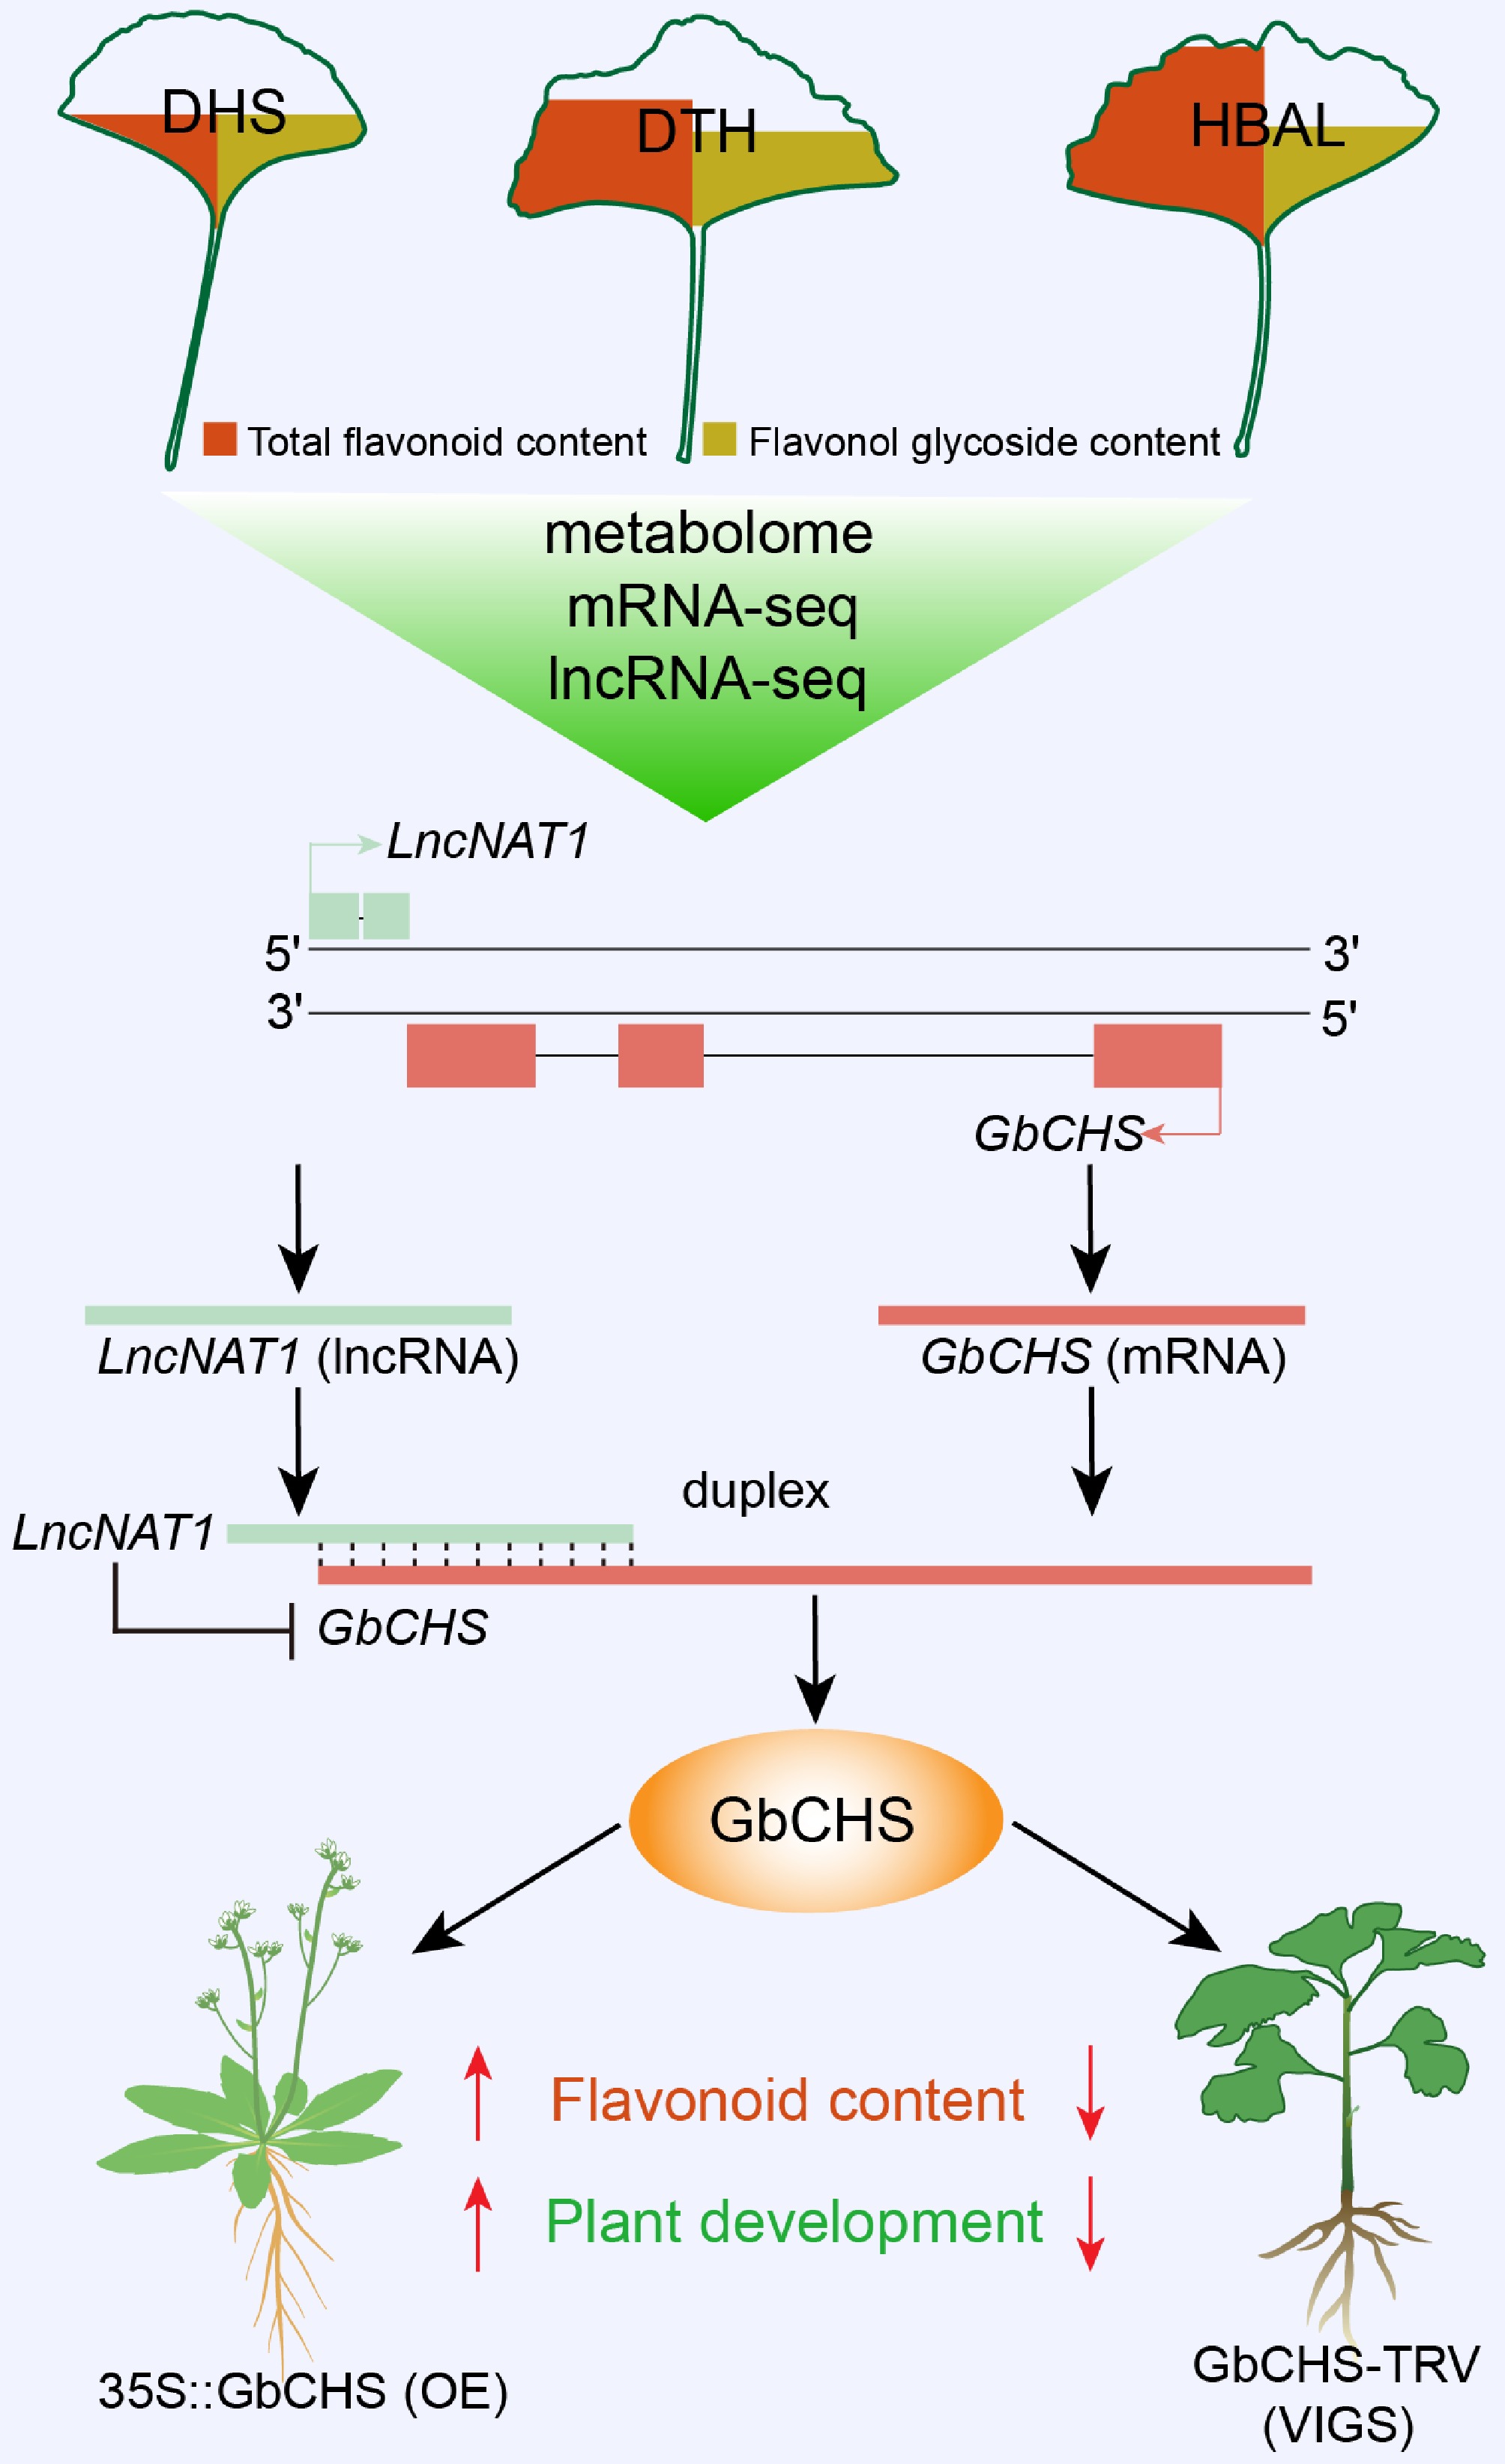
Figure 8.
Working model of the LncNAT1-GbCHS regulatory module in flavonoid biosynthesis and plant development. Integrated analysis of metabolomic, RNA-seq, and lncRNA-seq datasets identified a DEL, LncNAT1, along with its potential target gene, GbCHS. Functional validation using dual-luciferase assays, RPA, and genetic transformation experiments demonstrated that LncNAT1 directly binds to the GbCHS transcript to form an RNA duplex, thereby repressing GbCHS expression. This inhibition thereby negatively regulates flavonoid biosynthesis and plant growth and development in G. biloba.
Figures
(8)
Tables
(0)