-
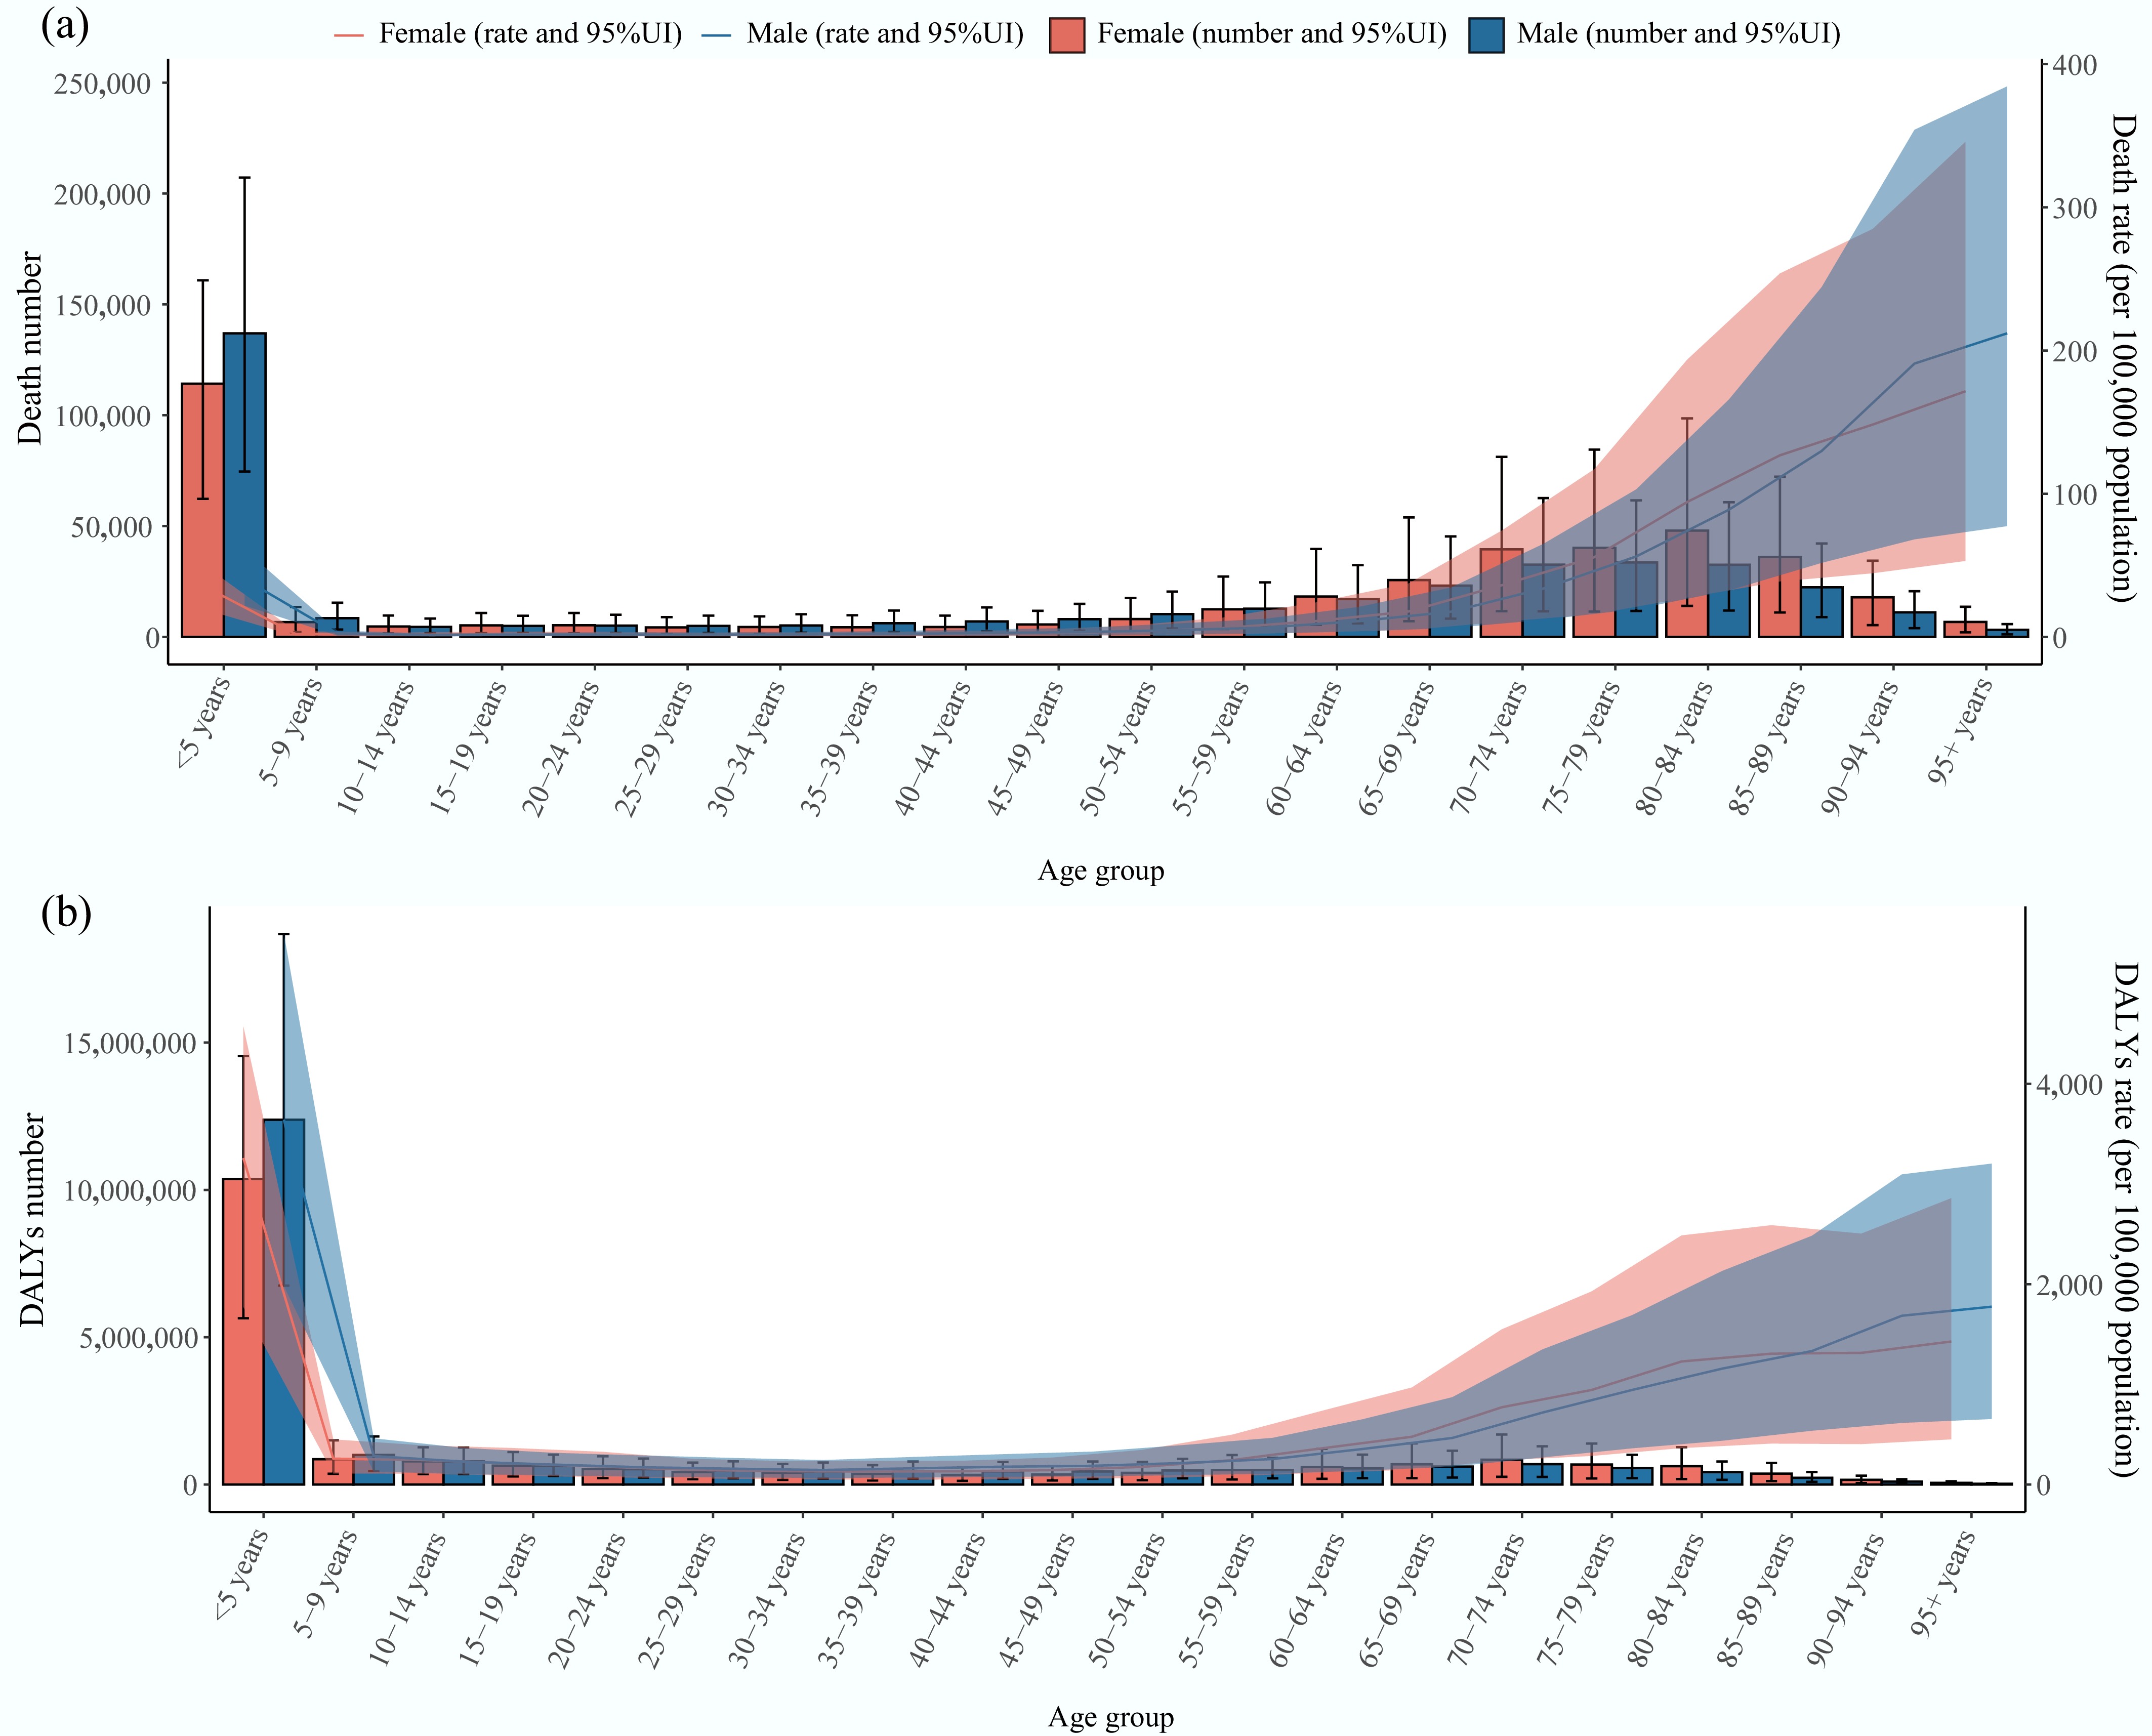
Figure 1.
Global burden of diarrheal diseases attributable to unsafe water by age group and sex in 2021. (a) Deaths number and the rate with their 95% UI. (b) DALYs number and rate with their 95% UI. DALYs: disability-adjusted life years; UI: uncertainty intervals.
-
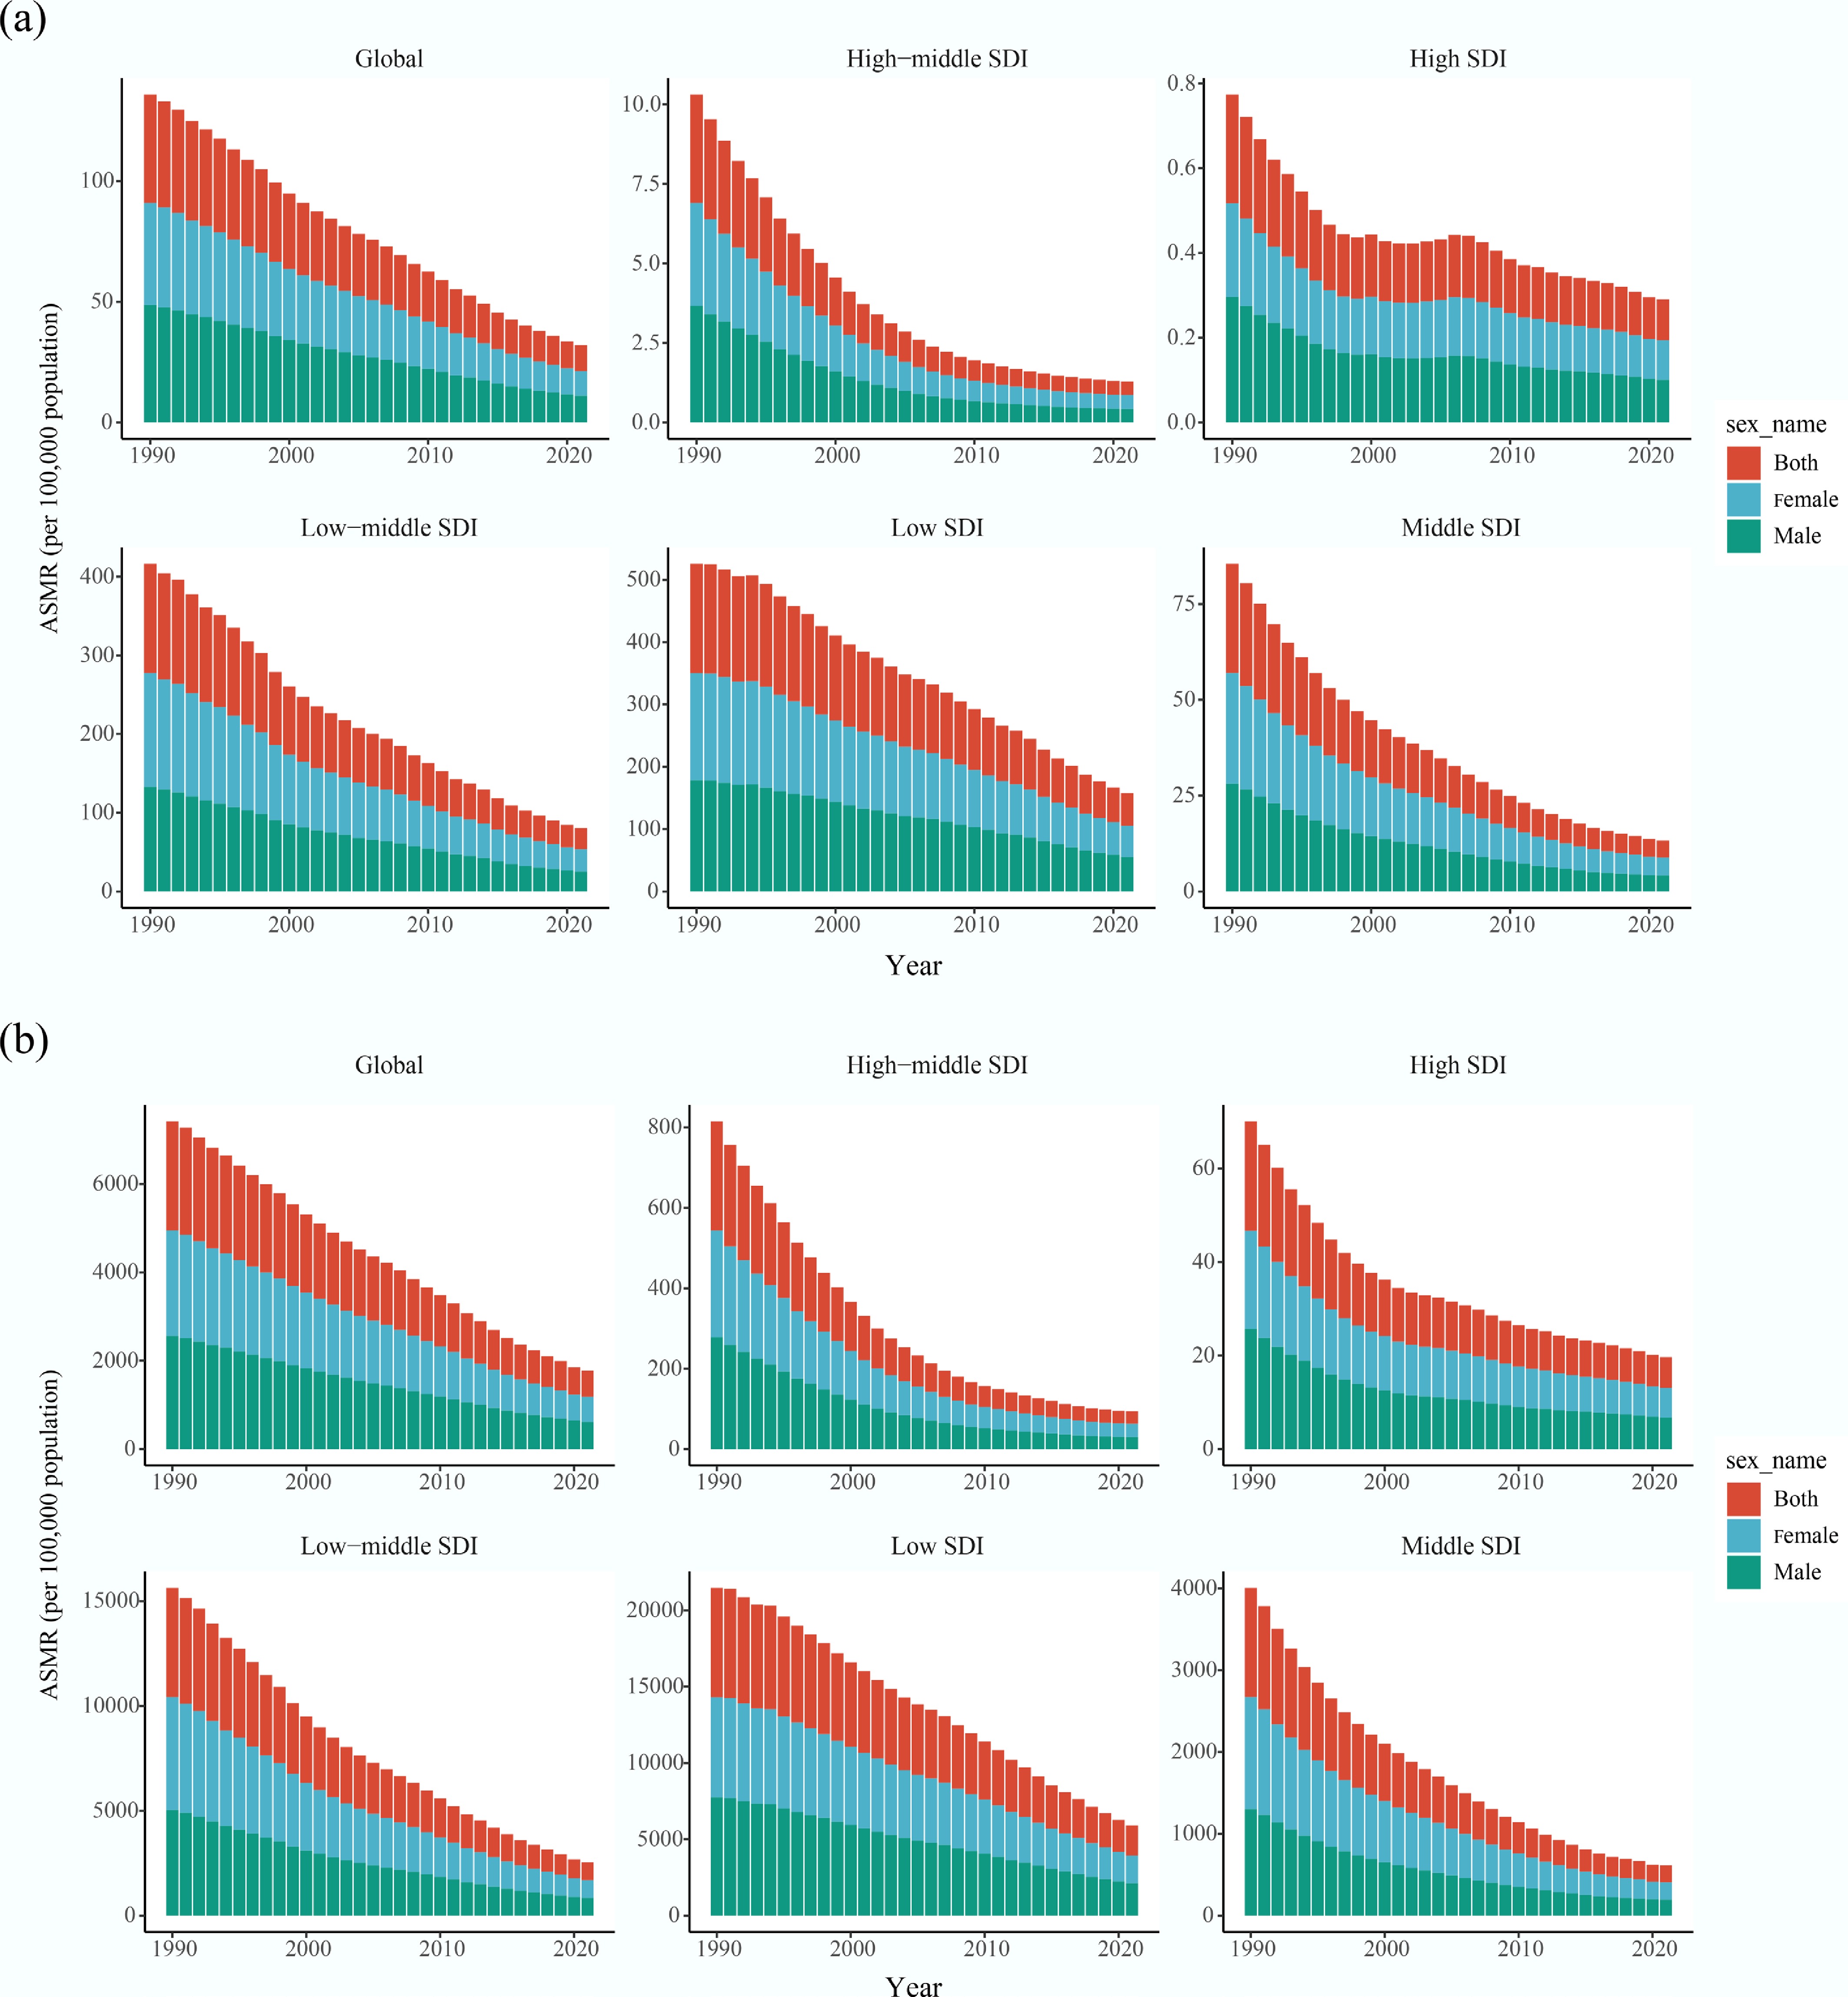
Figure 2.
Temporal trends in the burden of diarrheal diseases attributable to unsafe water in global and different SDI quintile regions from 1990 to 2021. (a) ASMR for both male and female. (b) ASDR for both male and female. ASMR: age-standardized mortality rate; ASDR: age-standardized disability-adjusted life years rate; SDI: socio-demographic index.
-
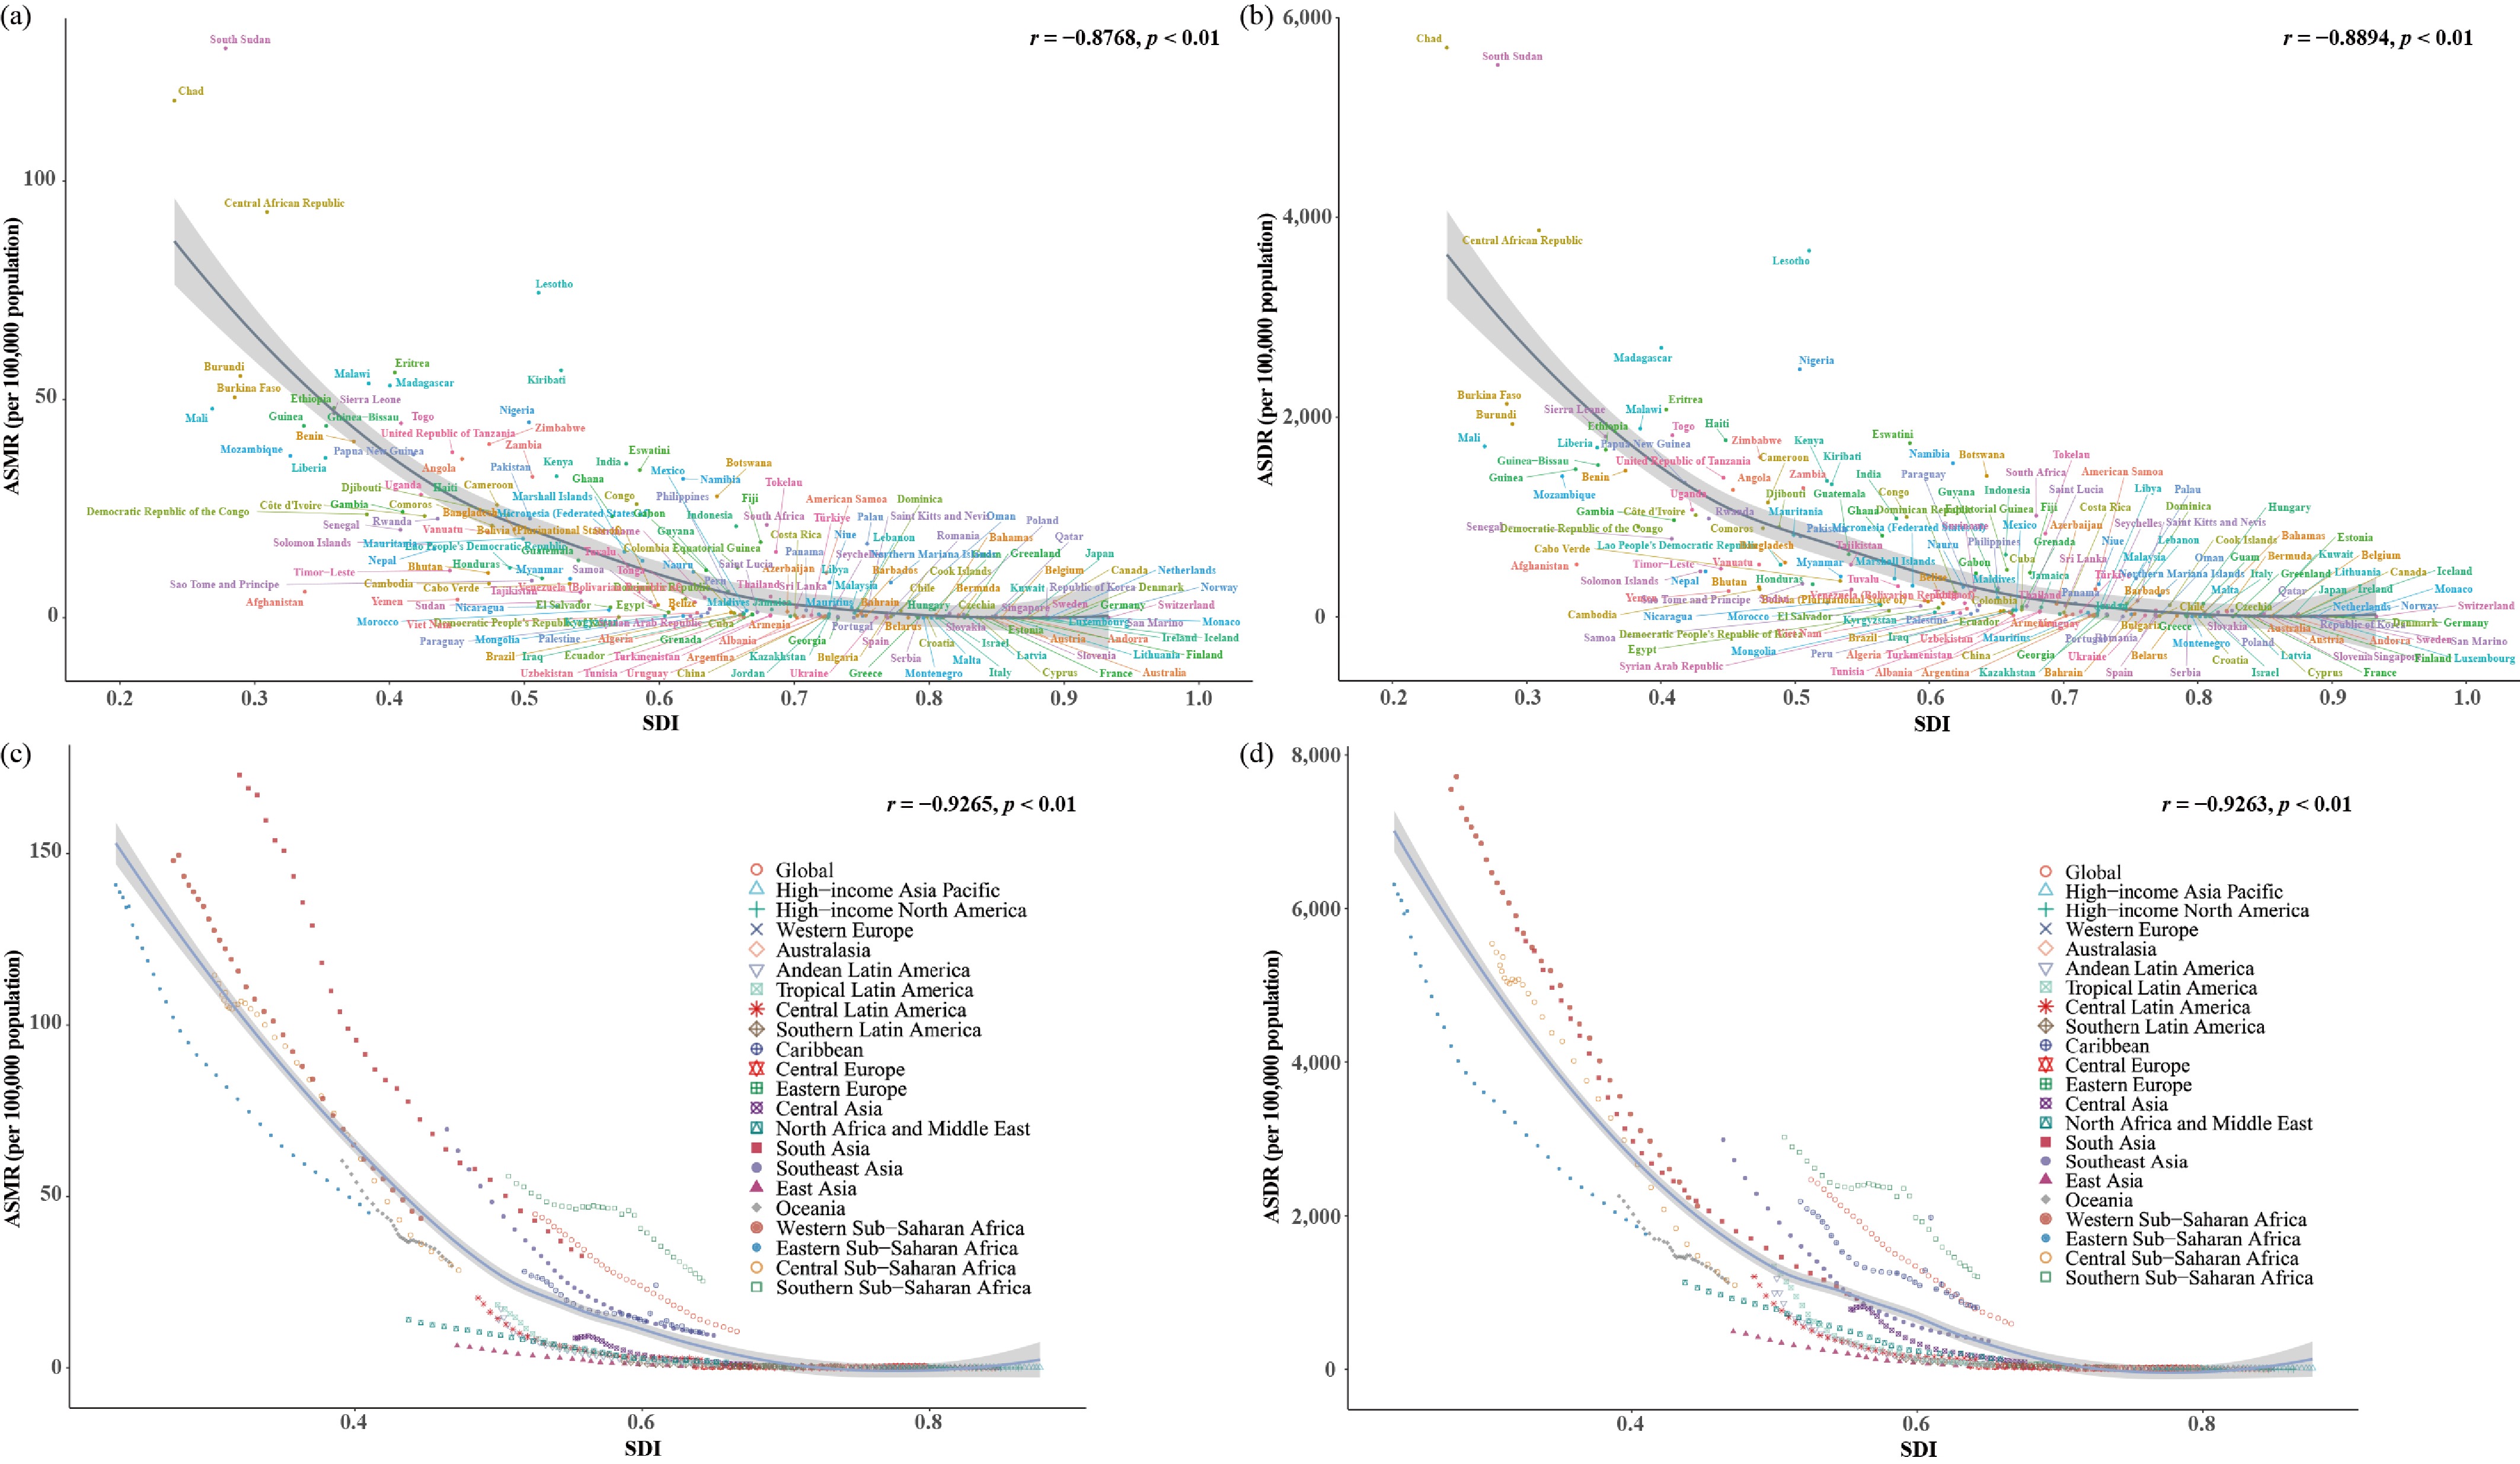
Figure 3.
The burden of diarrheal disease attributable to unsafe water globally and for 21 GBD regions by SDI from 1990 to 2021, and for 204 countries and territories by SDI in 2021. (a) ASMR and (b) ASDR for 204 countries and territories. The dots depict the estimated values in 2021. The black lines show the expected ASRs based solely on SDI. (c) ASMR and (d) ASDR globally, and in 21 GBD regions. The dots from left to right depict the estimated values for each year from 1990 to 2021. ASMR: age-standardized mortality rate; ASDR: age-standardized disability-adjusted life years rate; SDI: socio-demographic index.
-
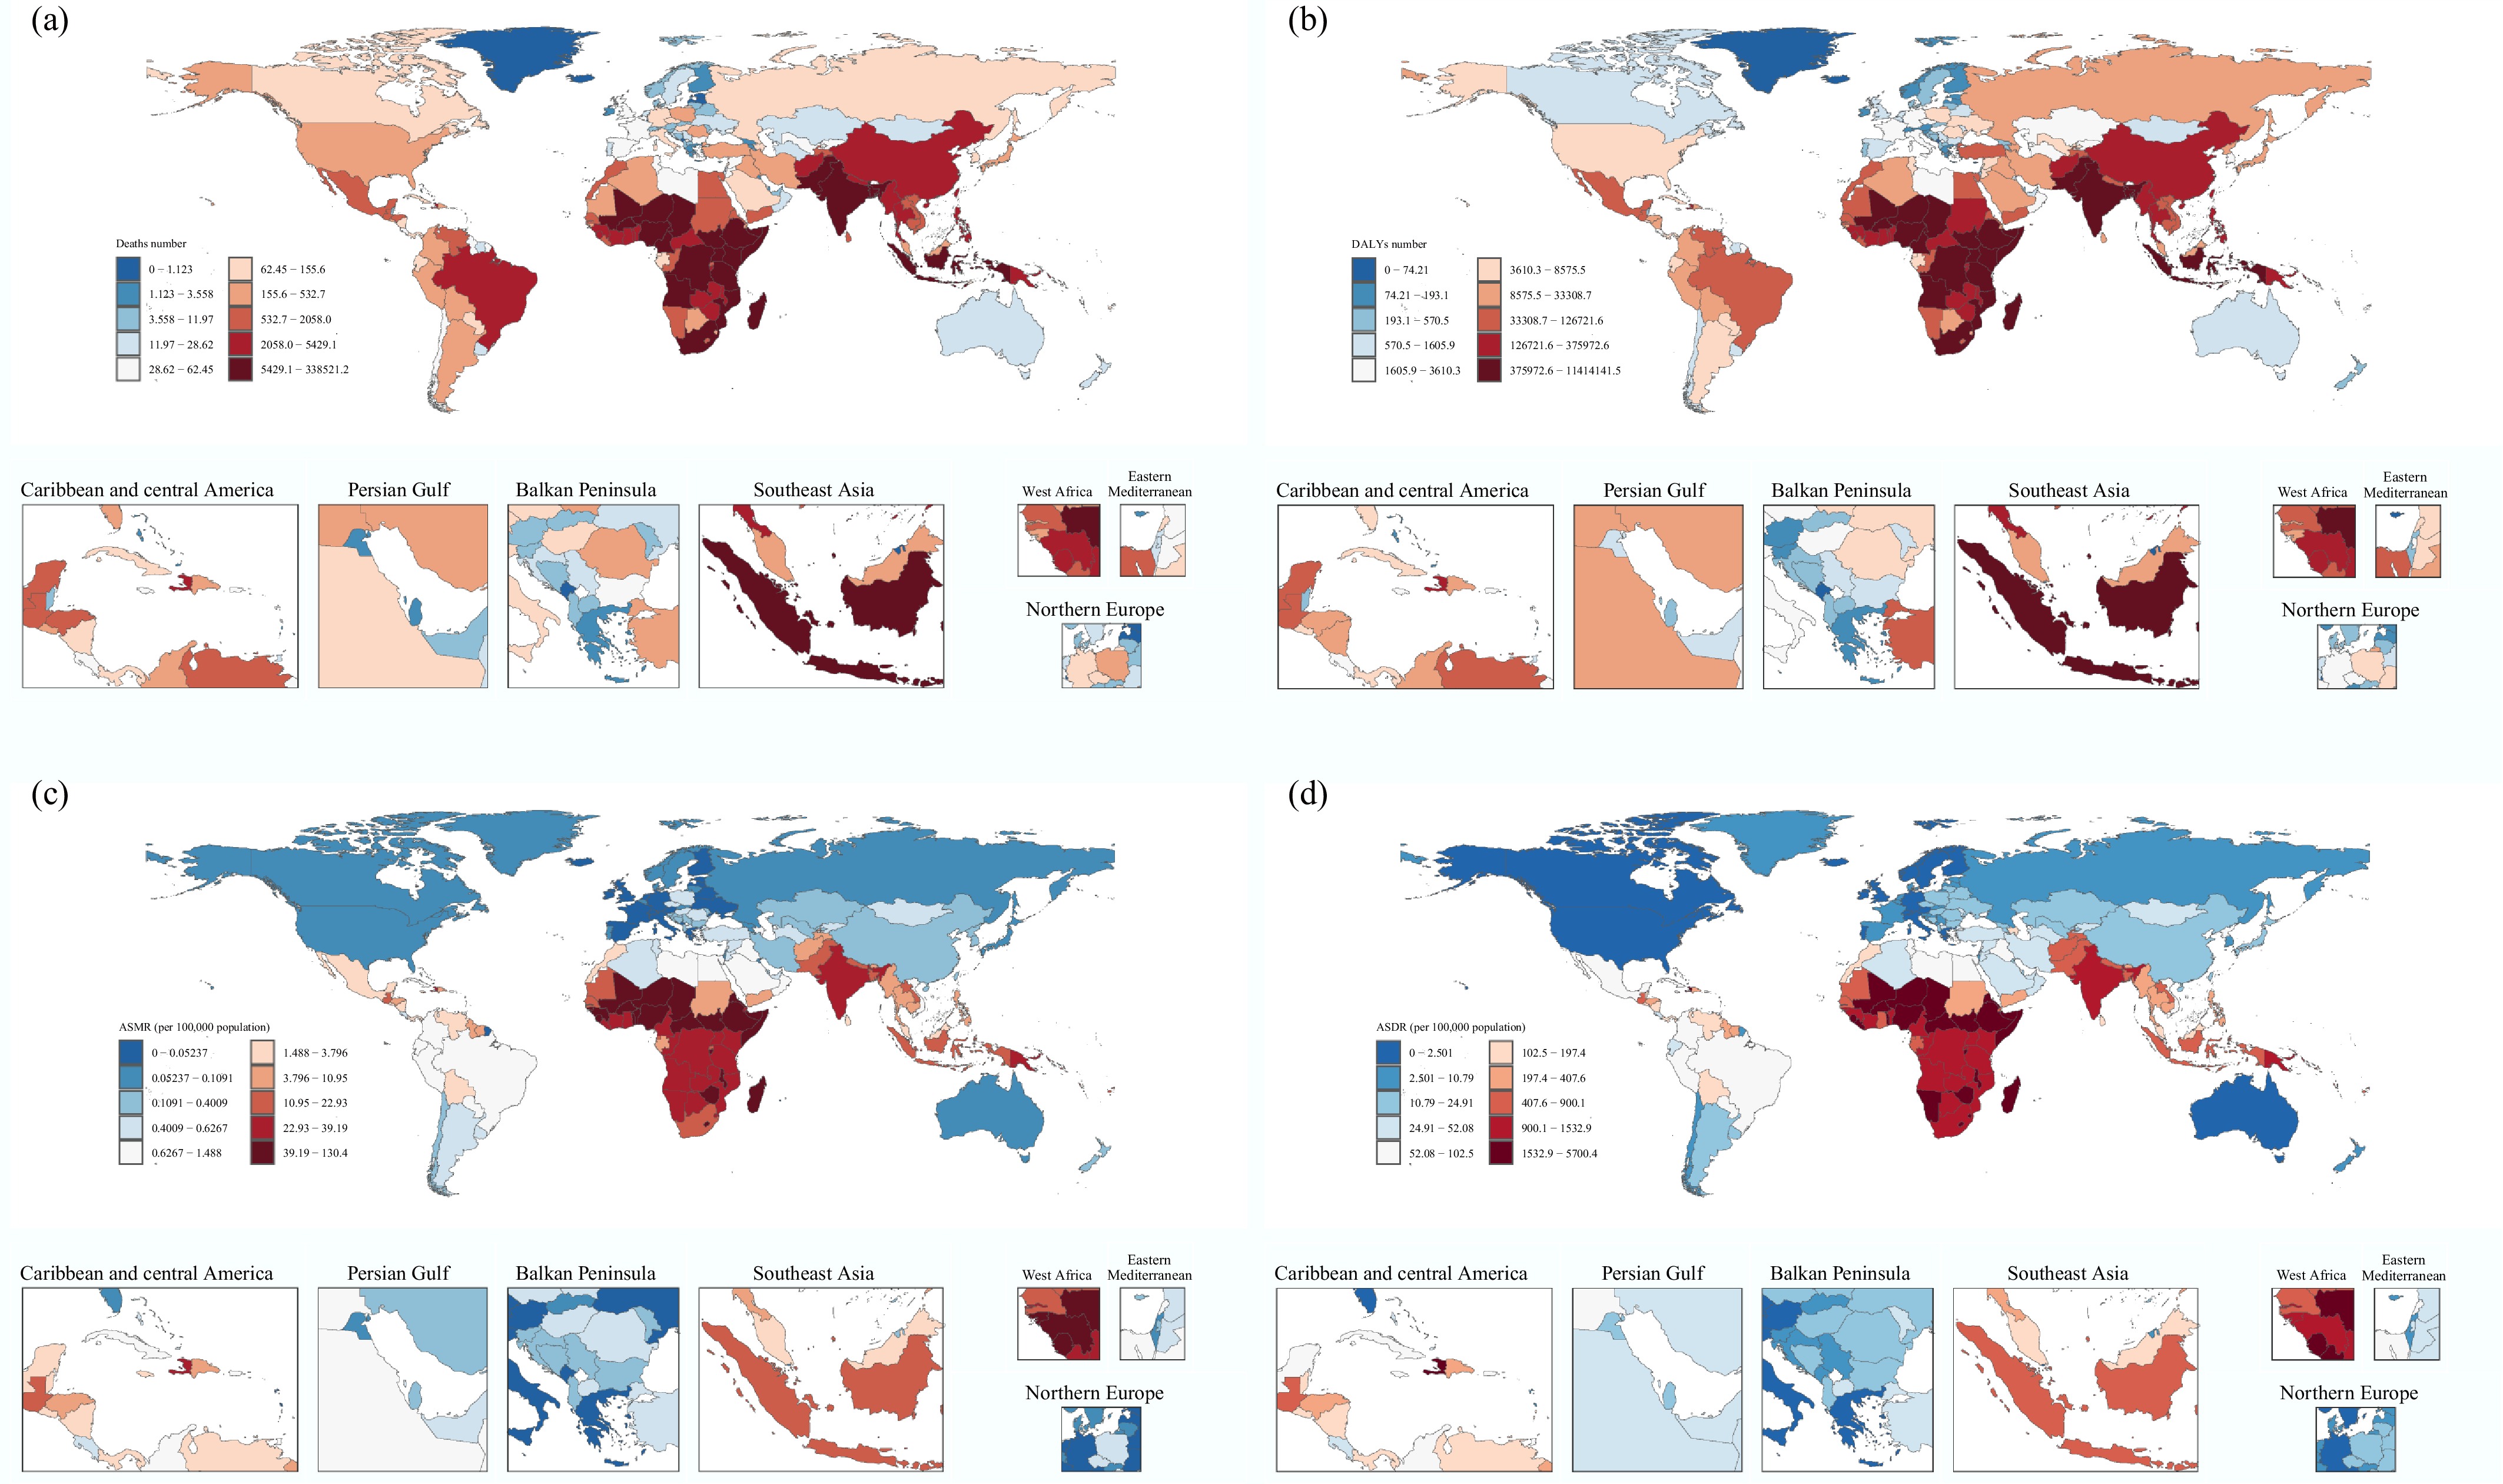
Figure 4.
The burden of diarrheal diseases attributable to unsafe water across countries and territories in 2021. (a) Deaths number; (b) DALYs number; (c) ASMR; (d) ASDR. DALYs: disability-adjusted life years rate; ASMR: age-standardized mortality rate; ASDR: age-standardized disability-adjusted life years rate.
-
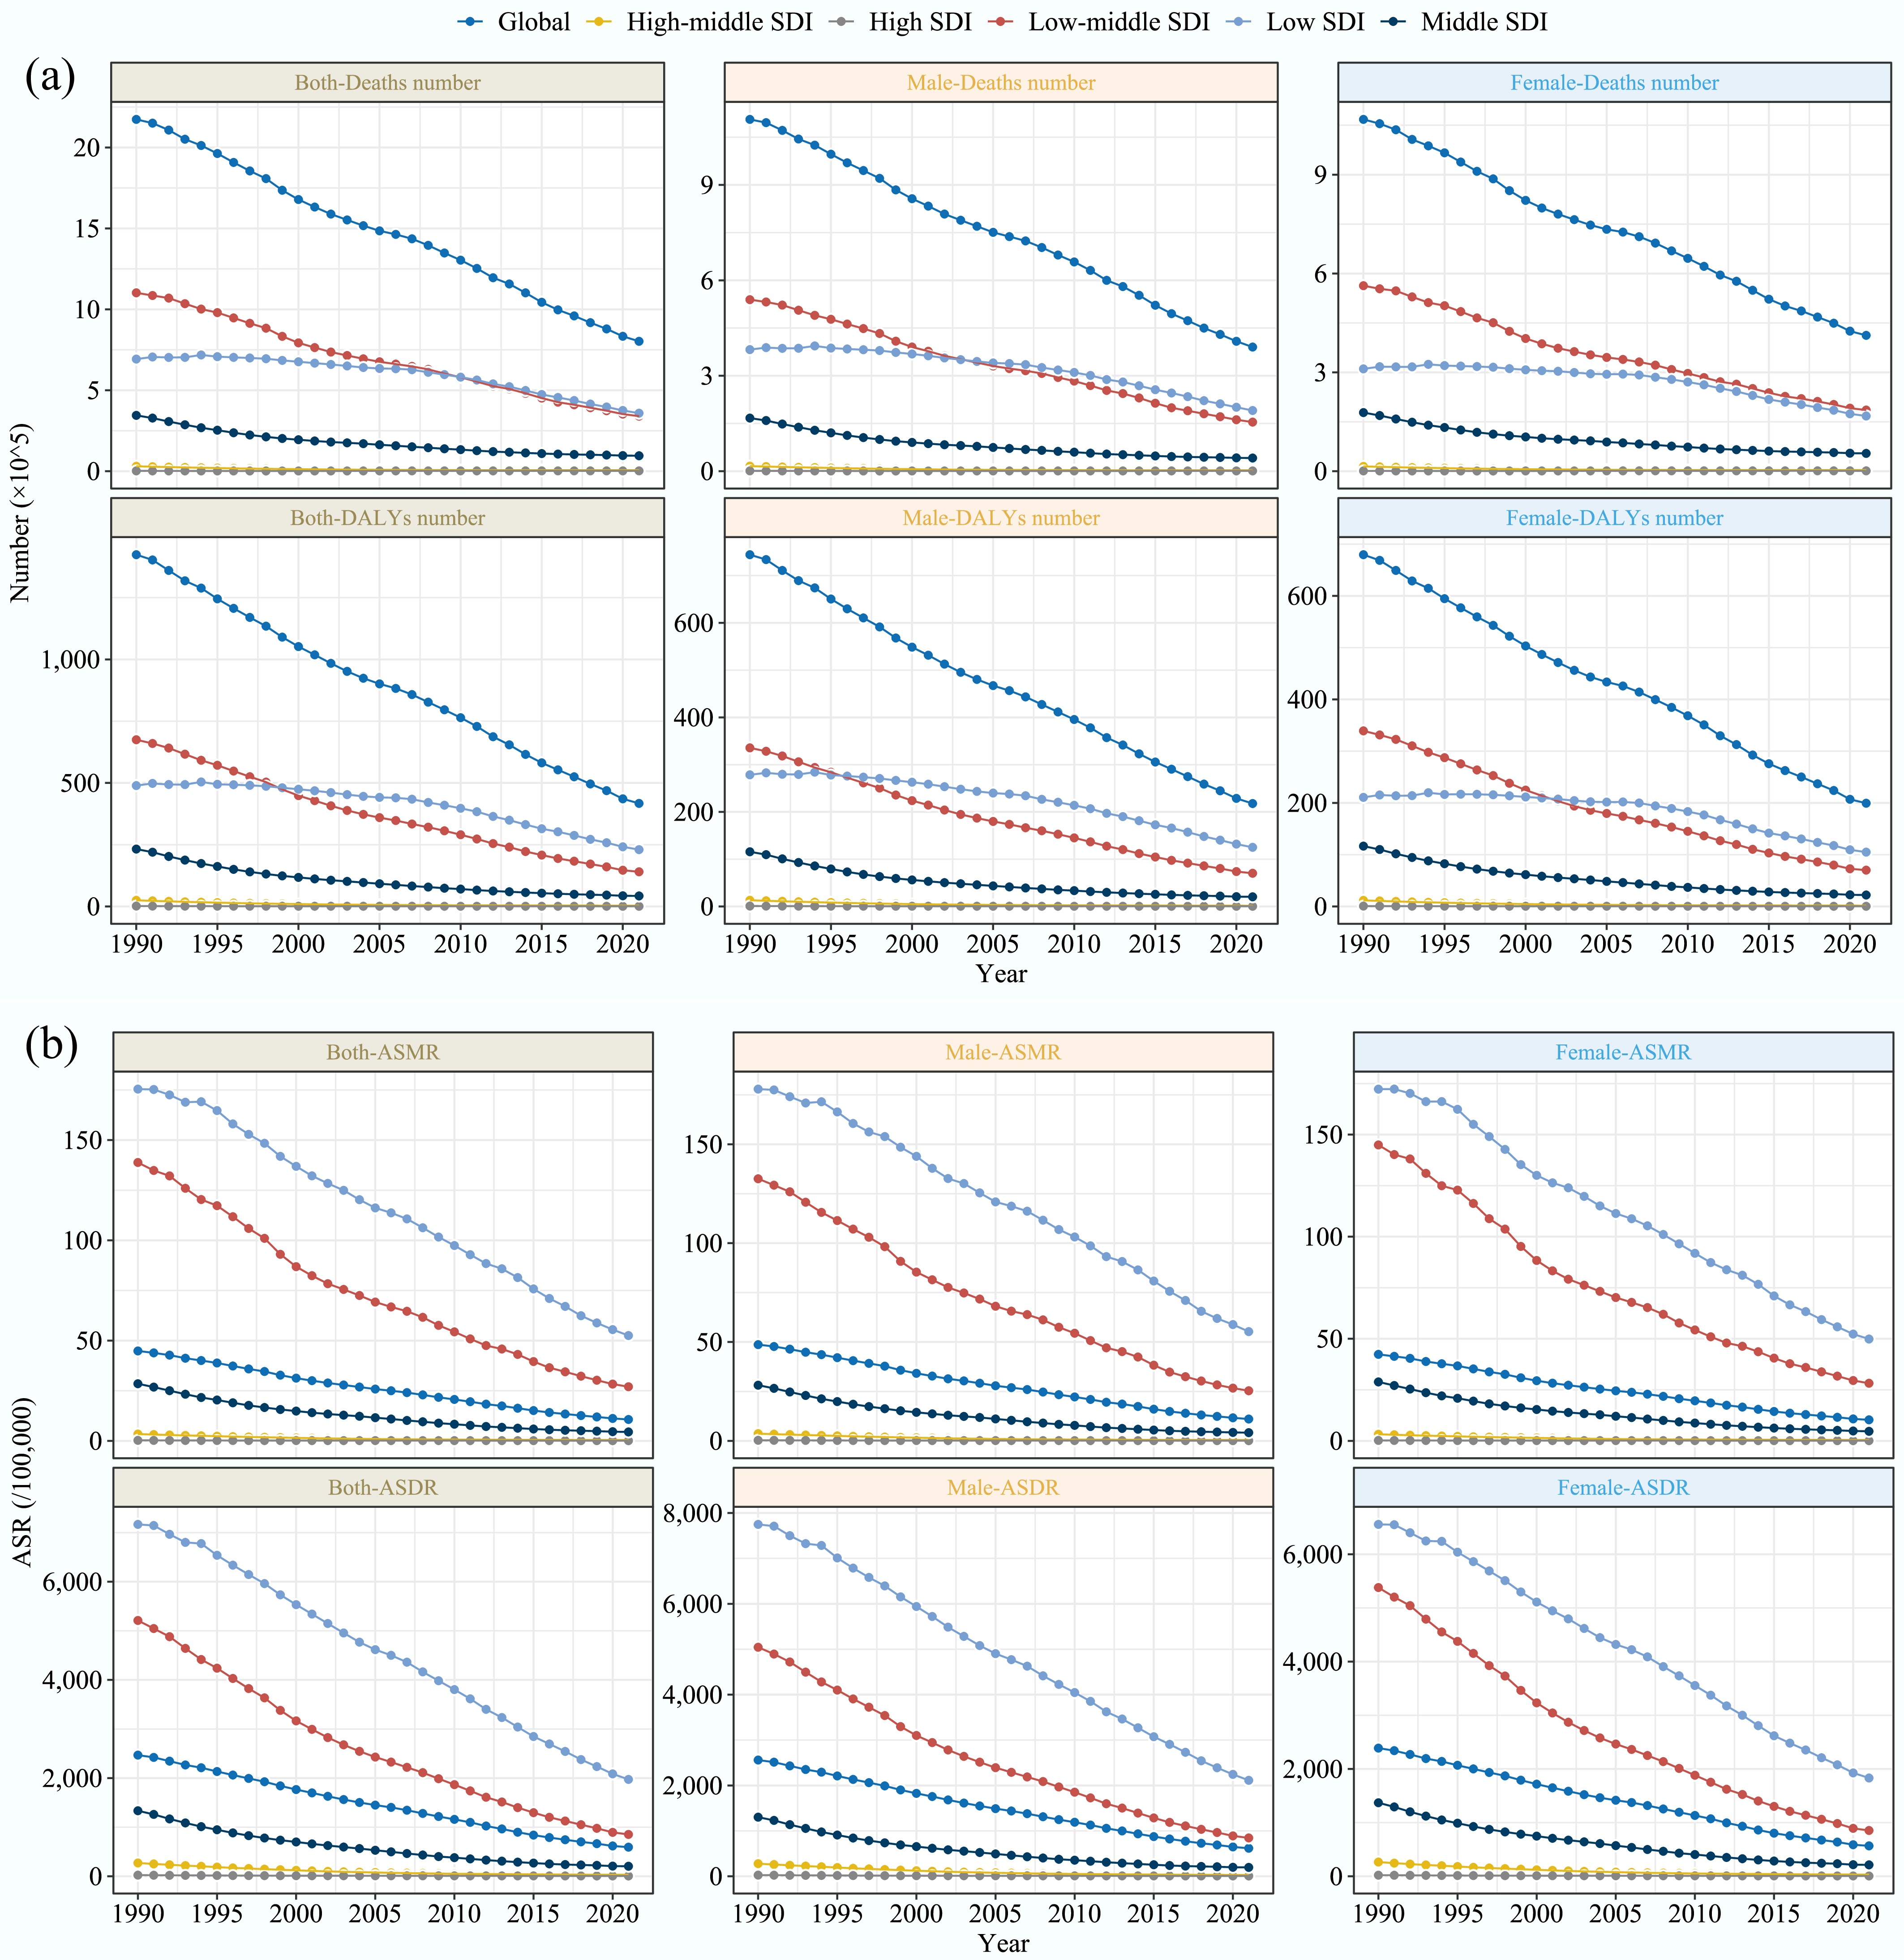
Figure 5.
Temporal trends in the burden of diarrheal diseases attributable to unsafe water globally, and different SDI quintile regions from 1990 to 2021. (a) Number of deaths and DALYs for both male and female. (b) ASMR and ASDR for both male and female. DALYs: disability-adjusted life years rate; ASMR: age-standardized mortality rate; ASDR: age-standardized disability-adjusted life years rate; SDI: socio-demographic index.
-
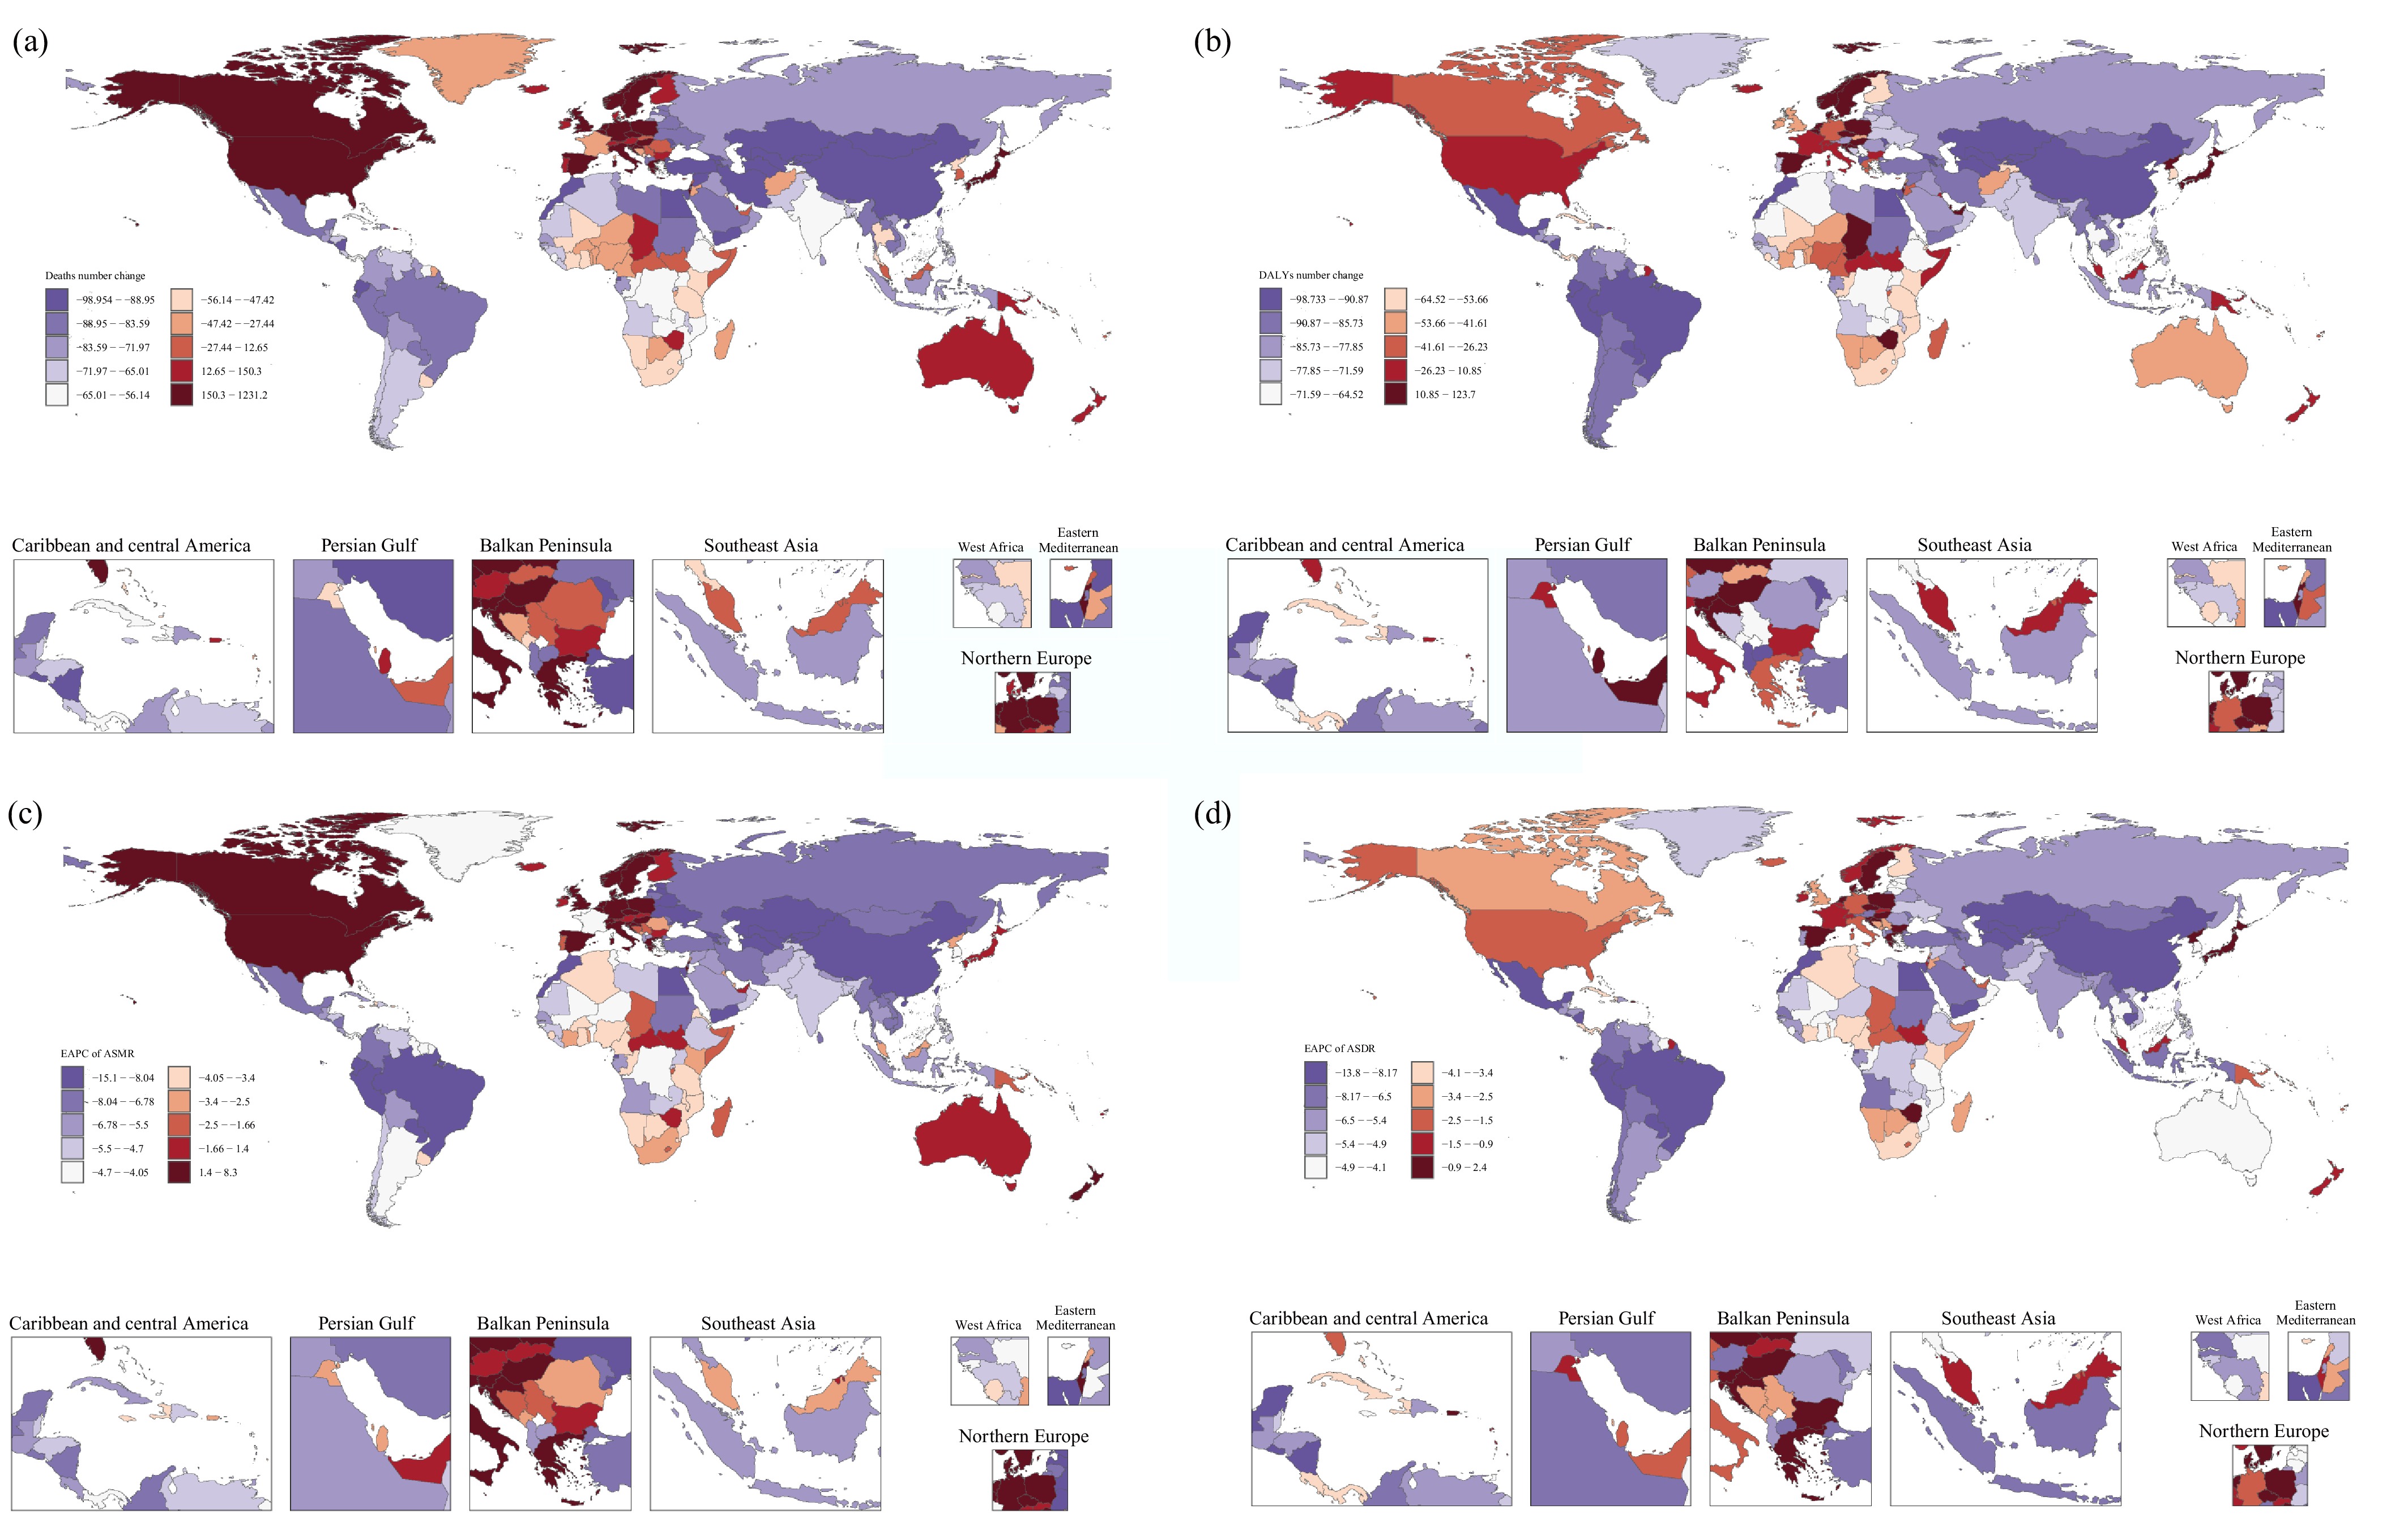
Figure 6.
The number change and EAPC of ASR for diarrheal diseases attributable to unsafe water deaths from 1990 to 2021 in 204 countries and territories. (a) Deaths number change. (b) DALYs number change. (c) EAPC of ASMR. (d) EAPC of ASDR. EAPC: estimated annual percentage change; ASR: age-standardized rate; ASMR: age-standardized mortality rate; ASDR: age-standardized disability-adjusted life years rate.
-
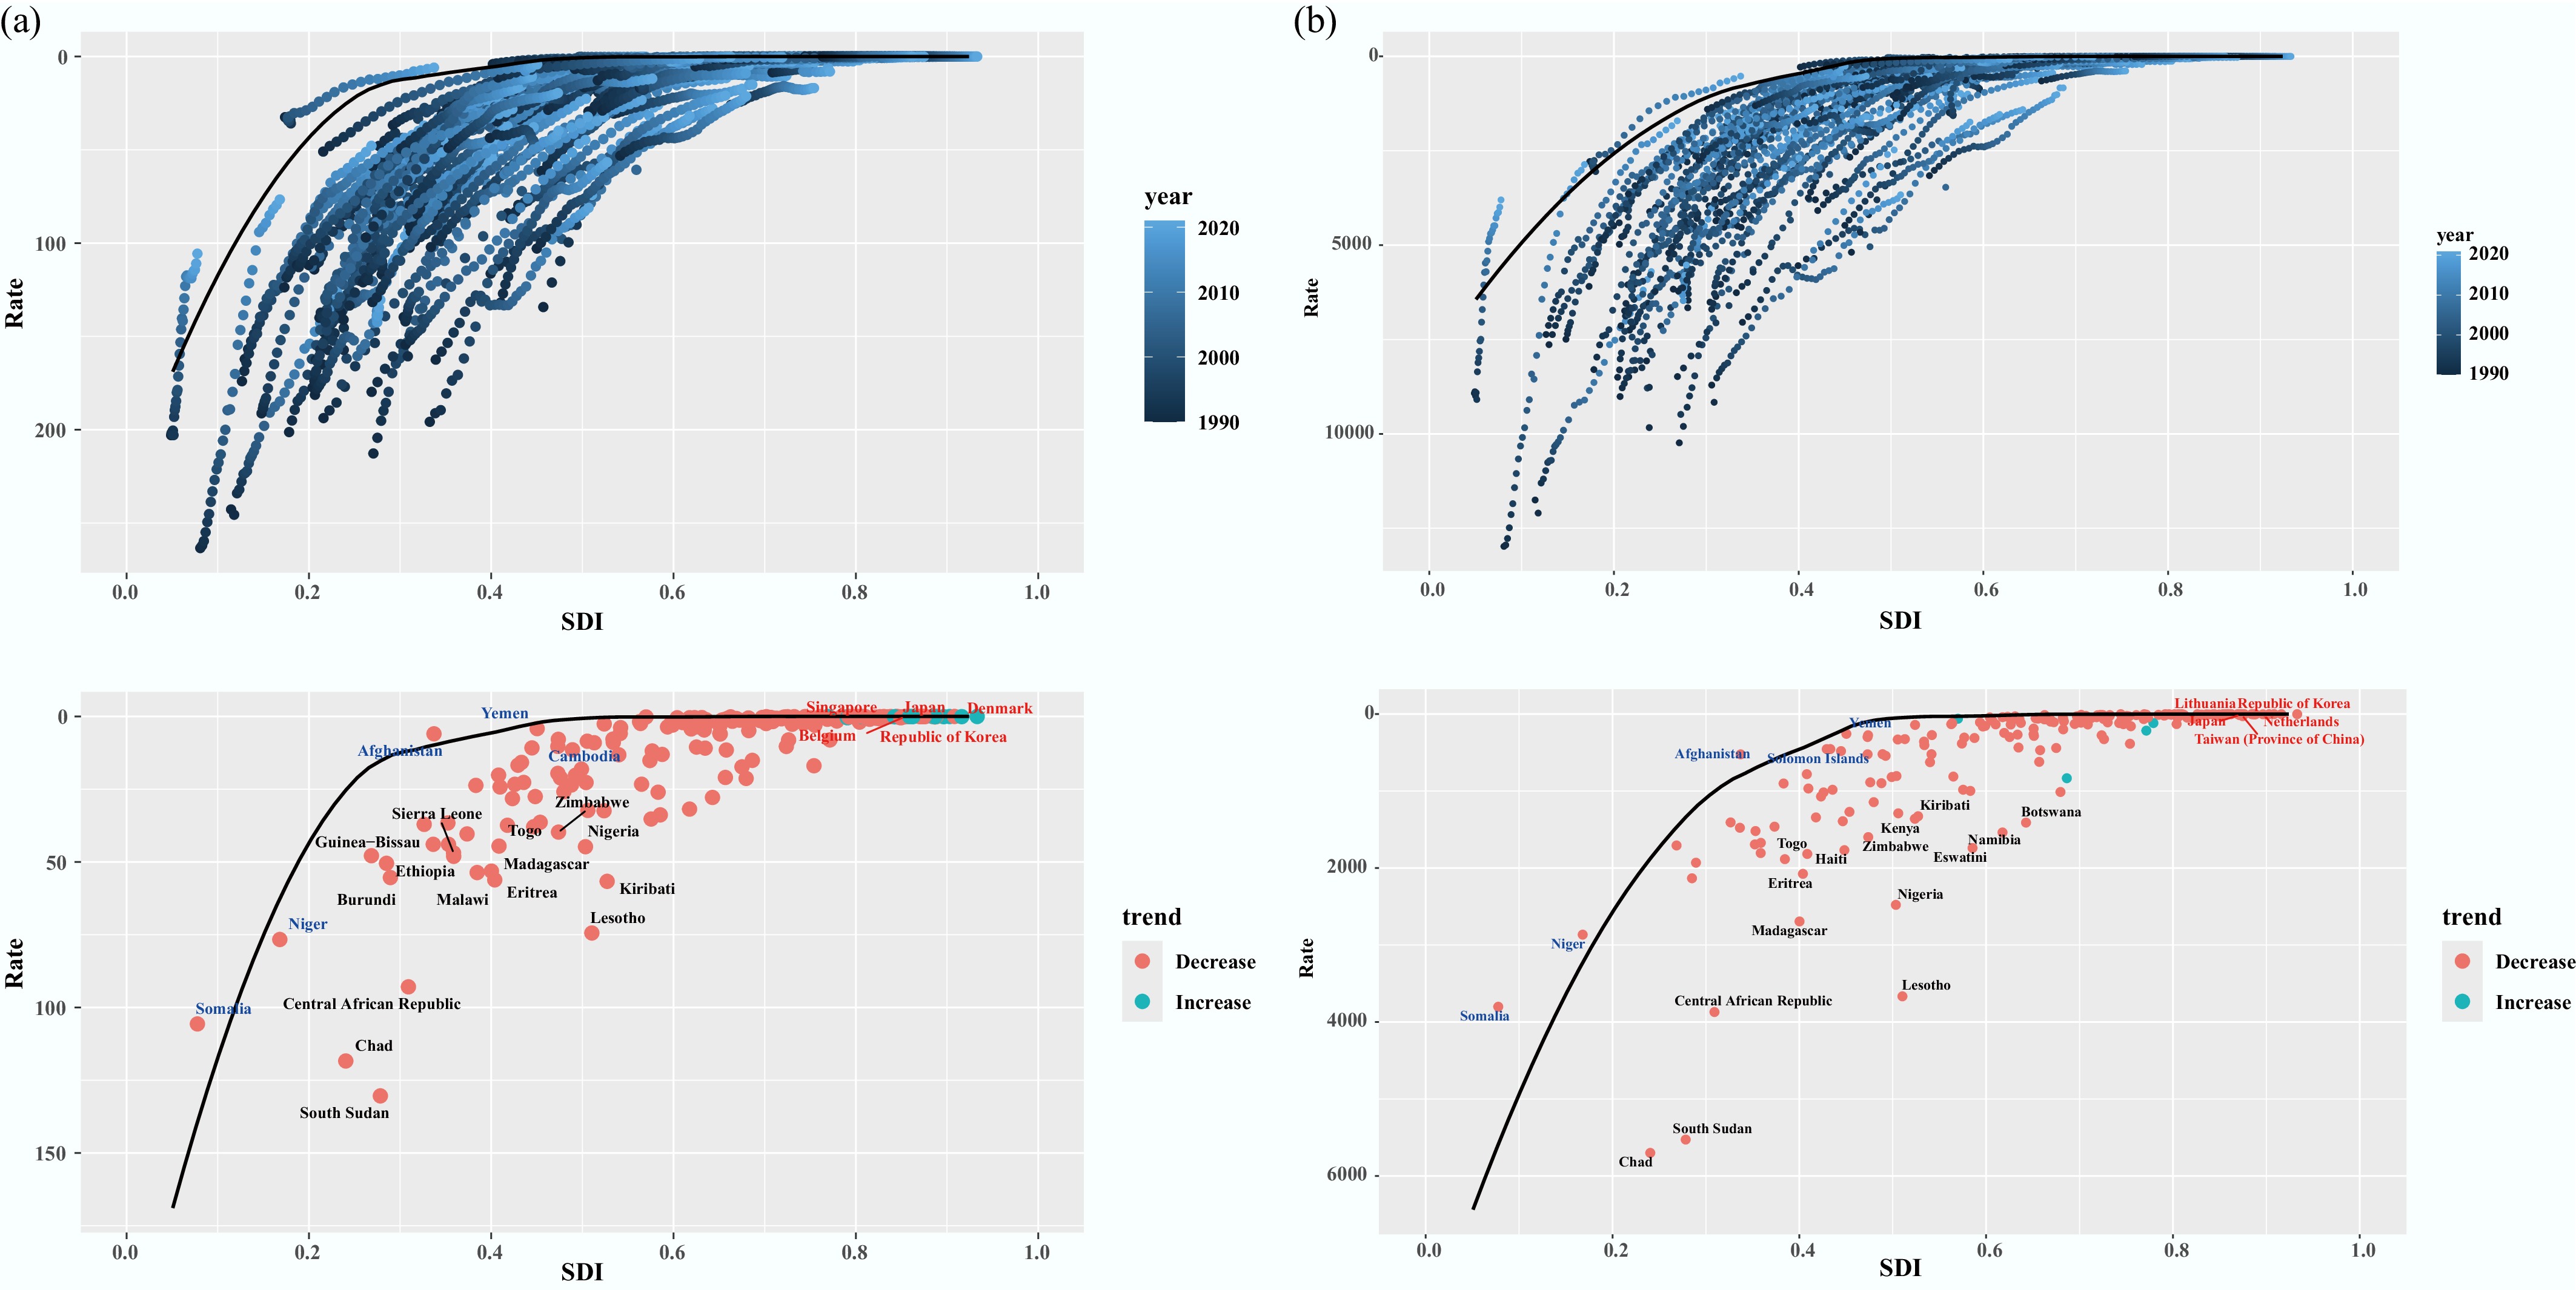
Figure 7.
Frontier analysis based on SDI and the burden of diarrheal diseases attributable to unsafe water from 1990 to 2021. (a) ASMR. (b) ASDR. ASMR: age-standardized mortality rate; ASDR: age-standardized disability-adjusted life years rate; SDI: socio-demographic index.
-
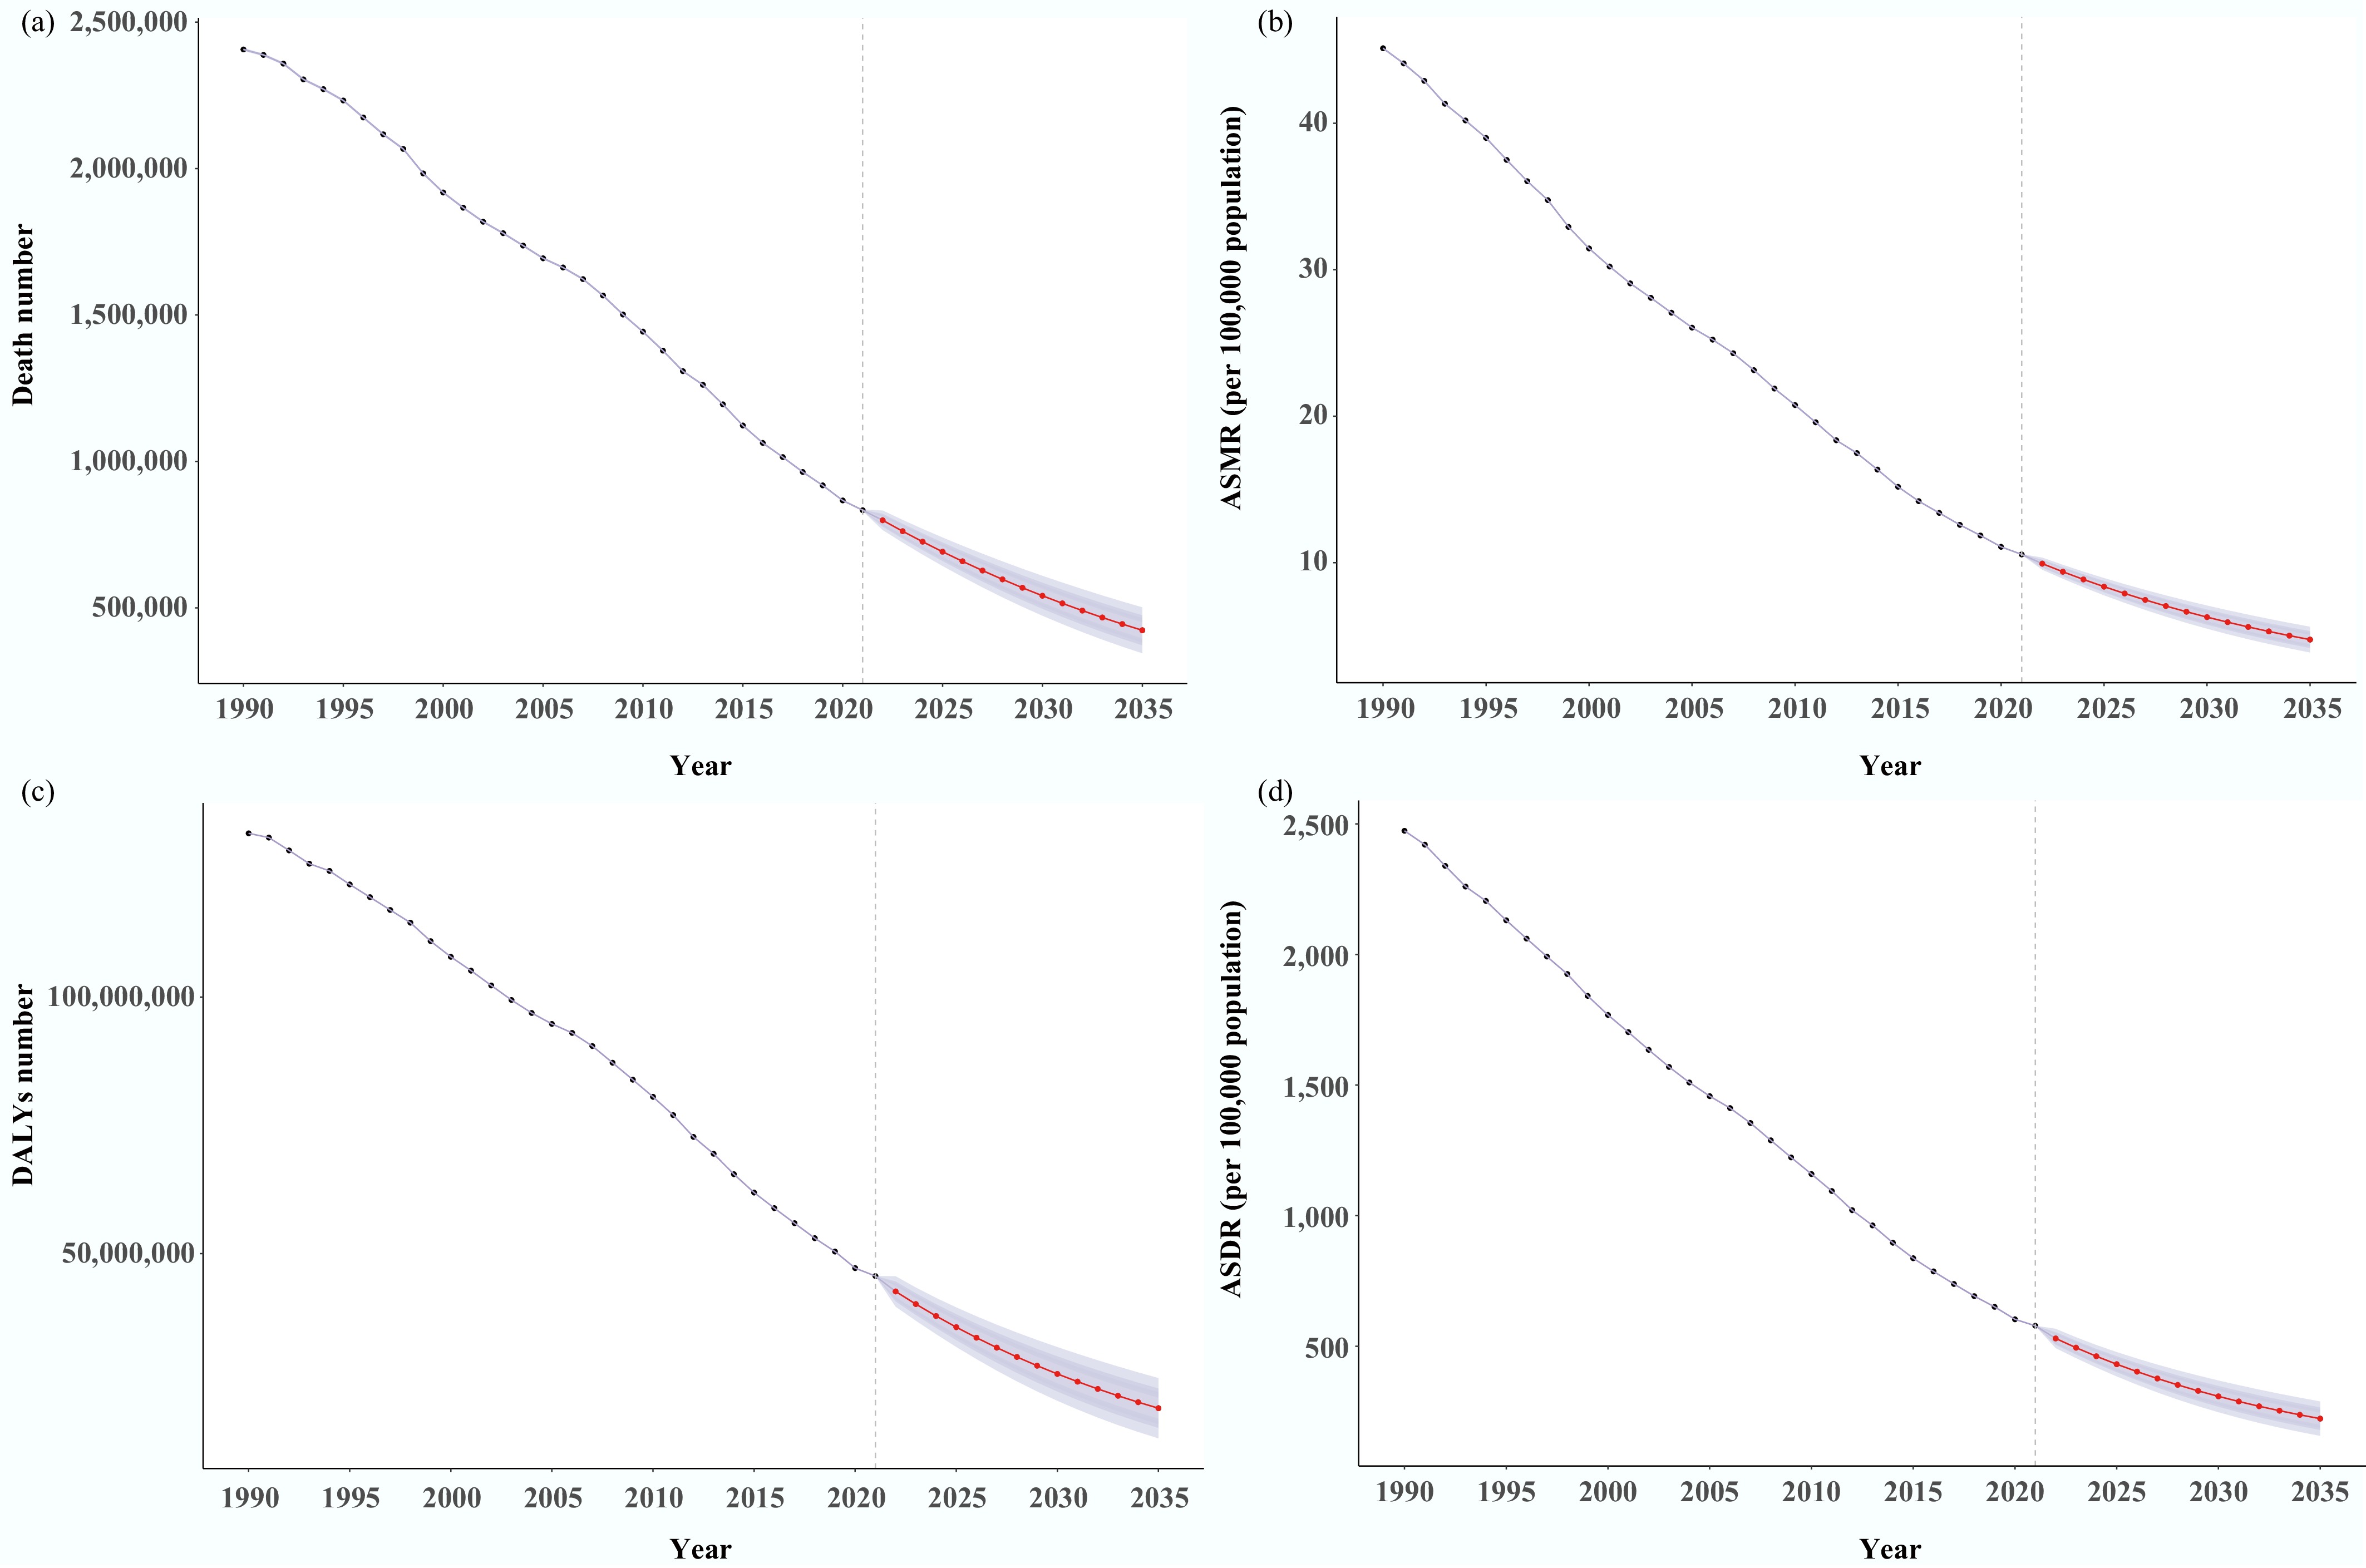
Figure 8.
The predicted global burden of diarrheal diseases attributable to unsafe water from 2022 to 2035 of the BAPC model. (a) Deaths number. (b) DALYs number. (c) ASMR. (d) ASDR. BAPC: Bayesian Age-Period-Cohort; DALYs: disability-adjusted life years rate; ASMR: age-standardized mortality rate; ASDR: age-standardized disability-adjusted life years rate.
-
Characteristics Deaths number DALYs number 1990 2021 Change
(%, 95% CI)1990 2021 Change
(%, 95% CI)Both (95% UI) Both (95% UI) Both (95% UI) Both (95% UI) Global 2,173,550.83
(1,265,813.61−2,913,015.18)802,486.17
(371,672.74−1,215,503.48)−63.08
(−72.25 to −53.88)142,377,712.19
(8,395,2630.63−188,159,938.20)41,718,708.11
(21,351,085.13−57,788,563.73)−70.70
(−76.86 to −64.31)Sex Male 1,105,856.12
(596,876.00−1,520,100.15)390,178.23
(181,559.47−612,241.42)−64.72
(−73.73 to −53.64)74,426,248.47
(41,771,343.32−101,108,721.56)21,776,420.55
(11,071,141.91−31,455,889.18)−70.74
(−77.61 to −62.69)Female 1,067,694.71
(580,734.52−1,596,669.06)412,307.93
(162,776.83−741,530.31)−61.38
(−74.34 to −47.41)67,951,463.72
(40,252,756.12−93,560,756.74)19,942,287.55
(9,544,451.73−29,087,230.38)−70.65
(−78.41 to −62.57)SDI High 1,978.94
(613.66−3,508.45)2,080.22
(382.72−4,970.10)5.12
(−42.21 to 49.51)160,563.35
(50,996.07−295,725.67)72,820.24
(14,755.20−170,439.01)−54.65
(−72.34 to −37.50)High-middle 30,538.27
(14,371.26−44,365.95)6,094.53
(1,586.14−11,323.31)−80.04
(−89.36 to −73.05)2,494,596.80
(1,195,348.64−3,487,882.78)320,392.15
(98,318.66−528,024.04)−87.16
(−91.96 to −83.70)Middle 344,945.32
(172,811.24−493,314.13)95,468.82
(29,990.31−160,261.60)−72.32
(−82.83 to −63.20)23,232,889.29
(11,865,015.17−32,122,015.36)4,253,213.68
(158,0247.15−6,361,599.01)−81.69
(−86.88 to −77.37)Low-middle 1,102,218.96
(629,940.29−1,500,805.50)339,997.20
(149,025.02−580,965.60)−69.15
(−78.57 to −57.60)67,480,802.58
(38,837,083.72−89,533,812.60)14,037,755.28
(6,669,543.76−20,824,787.05)−79.20
(−84.41 to −73.68)Low 692,802.62
(428,612.36−909,643.20)358,394.65
(190,233.73−502,311.01)−48.27
(−61.34 to −33.23)48,929,794.52
(30,739,225.74−64,623,156.08)23,005,435.06
(13,133,771.54−32,197,961.86)−52.98
(−65.45 to −38.14)Region Andean Latin America 5,820.63
(1,663.59−8,757.82)745.47
(114.59−1,443.35)−87.19
(−92.87 to −81.10)492,561.26
(141,422.75−741,160.83)46,480.43
(7,569.21−8,3258.70)−90.56
(−94.43 to −87.35)Australasia 27.32
(5.41−61.71)41.43
(7.66−105.54)51.66
(−4.93 to 129.31)1,835.64
(353.28−4,256.47)1,051.29
(189.33−2,569.36)−42.73
(−63.35 to −12.55)Caribbean 1,0941.85
(5,792.49−1,4579.06)4,274.85
(2,151.83−6,309.51)−60.93
(−73.28 to −47.61)904,349.92
(479,888.75−1,202,405.89)317,886.31
(162,046.97−469,514.54)−64.85
(−75.94 to −52.70)Central Asia 8,044.87
(2,590.13−12,256.51)1,017.41
(289.45−1,727.36)−87.35
(−91.38 to −82.84)728,702.81
(234,597.55−1,109,981.71)94,543.92
(27,303.94−157,861.29)−87.03
(−91.03 to −82.71)Central Europe 516.65
(182.29−806.38)745.73
(163.66−1,529.22)44.34
(−10.32 to 94.13)41,903.08
(14,937.85−6,5481.87)16,989.62
(3,941.75−3,3970.44)−59.45
(−74.23 to −46.18)Central Latin America 32,238.47
(12,997.12−47,386.68)5,631.99
(1,658.38−9,041.68)−82.53
(−87.34 to −78.00)2,490,565.13
(1,001,901.12−3,659,972.86)281,822.84
(84,989.91−457,297.19)−88.68
(−91.45 to −85.83)Central Sub-Saharan Africa 60,607.06
(35,230.65−82,223.69)21,867.24
(9,850.00−34,501.00)−63.92
(−75.51 to −49.49)4,769,718.71
(2,832,273.87−6,479,902.51)1,482,475.07
(704,747.66−2,291,717.83)−68.92
(−78.17 to −56.11)East Asia 65,863.34
(34,602.64−89,614.90)2,451.62
(854.94−4668.36)−96.28
(−98.03 to −93.84)5,554,494.29
(2,841,091.81−7,424,873.67)172,910.44
(58,621.31−274,634.53)−96.89
(−98.18 to −95.63)Eastern Europe 891.60
(289.27−1,462.84)163.72
(40.49−317.08)−81.64
(−88.23 to −76.28)101,173.08
(32,242.18−168,930.22)18,228.23
(4,480.50−35,261.81)−81.98
(−88.34 to −76.41)Eastern Sub-Saharan Africa 231,021.38
(136,591.38−326,786.86)113,609.09
(57,337.38−164,273.06)−50.82
(−67.45 to −28.29)17,300,906.43
(10,120,719.70−24,609,743.56)7,550,896.85
(4,175,069.54−10,891,729.64)−56.36
(−70.64 to −37.03)High-income Asia Pacific 306.19
(53.09−722.18)602.75
(101.56−1,521.67)96.86
(15.41−198.25)21,376.87
(4,165.77−49,228.27)19,478.99
(3,209.43−50,406.67)−8.88
(−46.25 to 42.72)High-income North America 112.11
(18.92−300.80)469.92
(69.47−1,360.02)319.17
(133.26−554.00)10,162.33
(1,677.85−25,905.98)8,223.49
(1,215.78−23,718.17)−19.08
(−57.28 to 27.85)North Africa and Middle East 63,037.13
(28,631.62−92,533.45)8,873.49
(3,534.49−14,386.76)−85.92
(−89.57 to −82.12)5,627,664.02
(2,556,543.77−8,284,532.71)822,689.60
(341,327.31−1,315,801.76)−85.38
(−88.92 to −81.74)Oceania 2,395.16
(1,297.84−3,484.32)2,564.78
(1,320.98−3,791.17)7.08
(−18.25 to 33.65)167,548.22
(95,496.95−244,901.72)167,577.90
(89,478.60−257,595.12)0.02
(−29.46 to 34.36)South Asia 1,116,409.02
(629,736.85−1,559,075.95)393,585.16
(157,173.28−697,979.92)−64.75
(−76.17 to −51.77)62,691,034.12
(36,270,019.06−83,185,946.27)14,067,207.04
(6,377,761.43−22,326,580.60)−77.56
(−83.99 to −70.55)Southeast Asia 225,006.39
(107,758.05−346,945.41)5,0475.73
(17,836.56−79,782.95)−77.57
(−86.85 to −67.67)14,424,539.42
(7,335,671.51−20,331,546.41)2,188,950.93
(834,374.29−3,212,055.23)−84.82
(−89.61 to −79.32)Southern Latin America 896.23
(336.10−1,315.41)304.12
(63.88−637.46)−66.07
(−82.23 to −51.24)74,649.36
(28,027.53−109,779.32)10,304.41
(2,284.18−21,372.03)−86.20
(−92.70 to −80.03)Southern Sub-Saharan Africa 25,792.84
(12,406.49−35,702.28)15,276.66
(6,083.74−23,405.46)−40.77
(−54.80 to −26.45)1,910,957.12
(938,227.72−2,562,049.32)902,425.21
(391,017.67−1295,772.80)−52.78
(−62.85 to −41.91)Tropical Latin America 25,272.08
(13,257.83−34,513.23)2,854.92
(795.55−4,671.74)−88.70
(−93.72 to −85.05)2,104,926.88
(1,104,644.04−2,901,207.76)114,404.79
(33,109.39−182,123.89)−94.56
(−96.95 to −92.87)Western Europe 225.93
(39.31−600.68)476.26
(73.36−1,291.83)110.80
(46.68−172.79)17,183.64
(3,047.47−44,333.23)13,089.31
(1,928.28−37,189.87)−23.83
(−45.21 to −2.87)Western Sub-Saharan Africa 298,124.58
(183,737.02−399,382.60)176,453.83
(101,431.92−259,136.37)−40.81
(−55.46 to −22.36)22,941,459.85
(14,210,087.39−30,183,132.14)13,421,071.41
(7,793,817.58−19,283,985.98)−41.50
(−56.85 to −21.52)Table 1.
The deaths and DALYs in diarrheal diseases attributable to unsafe water from 1990 to 2021
-
Characteristics ASMR (per 100,000 population) ASDR (per 100,000 population) 1990 2021 EAPC (95%CI) 1990 2021 EAPC (95% CI) Both (95% UI) Both (95%UI) Both (95%UI) Both (95%UI) Global 44.84 (25.74−61.80) 10.66 (5.03−15.80) −4.57 (−4.76 to −4.37) 2,468.55 (1,453.28−3,242.23) 593.00 (309.18−823.91) −4.55 (−4.76 to −4.33) Sex Male 48.68 (26.21−70.74) 11.05 (5.17−16.95) −4.72 (−4.94 to −4.49) 2,559.89 (1,422.98−3,467.49) 617.31 (317.69−904.27) −4.54 (−4.74 to −4.34) Female 42.37 (22.46−64.43) 10.30 (4.36−17.58) −4.49 (−4.68 to −4.31) 2,388.92 (1,419.75−3,346.52) 567.56 (278.93−803.57) −4.58 (−4.82 to −4.34) SDI High 0.26 (0.08−0.46) 0.10 (0.02−0.23) −2.50 (−2.81 to −2.18) 23.39 (7.49−42.93) 6.55 (1.40−14.62) −3.68 (−3.97 to −3.39) High-middle 3.40 (1.60−4.96) 0.43 (0.12−0.76) −6.95 (−7.34 to −6.56) 271.47 (130.60−379.64) 31.37 (9.85−50.18) −7.17 (−7.46 to −6.88) Middle 28.49 (12.91−42.50) 4.45 (1.42−7.35) −5.89 (−5.98 to −5.81) 1,335.16 (672.15−1,859.03) 204.62 (79.10−304.03) −6.00 (−6.08 to −5.92) Low-middle 138.82 (75.45−201.62) 27.00 (11.70−46.98) −5.21 (−5.36 to −5.06) 5,210.81 (3,049.65−6,993.99) 852.67 (402.19−1,310.25) −5.72 (−5.88 to −5.55) Low 175.42 (99.97−252.35) 52.52 (25.24−80.94) −3.82 (−4.05 to −3.59) 7,167.67 (4,370.53−9,471.28) 1,973.12 (1,063.01−2,757.62) −4.09 (−4.33 to −3.84) Region Andean Latin America 14.23 (4.15−21.53) 1.27 (0.19−2.46) −8.08 (−8.38 to −7.78) 995.59 (284.67−1,501.24) 75.10 (12.19−134.27) −8.63 (−8.88 to −8.37) Australasia 0.13 (0.03−0.30) 0.07 (0.01−0.18) −0.03 (−1.35 to 1.30) 9.53 (1.84−21.99) 2.78 (0.49−6.66) −3.50 (−3.92 to −3.07) Caribbean 28.14 (14.75−37.44) 10.26 (5.21−15.09) −3.05 (−3.51 to −2.59) 2,186.95 (1,158.97−2,909.15) 802.92 (410.70−1,192.05) −2.95 (−3.42 to −2.47) Central Asia 8.75 (2.82−13.33) 1.03 (0.29−1.75) −7.97 (−8.37 to −7.56) 780.43 (251.25−1,188.68) 95.46 (27.58−159.35) −7.79 (−8.17 to −7.40) Central Europe 0.56 (0.20−0.87) 0.40 (0.09−0.81) −0.69 (−2.39 to 1.03) 47.66 (17.07−74.05) 15.93 (3.93−31.31) −3.44 (−4.66 to −2.20) Central Latin America 20.44 (8.15−29.80) 2.49 (0.74−4.02) −6.44 (−7.00 to −5.87) 1,206.82 (484.96−1,765.24) 128.58 (39.21−209.45) −6.91 (−7.38 to −6.44) Central Sub-Saharan Africa 114.53 (59.62−158.97) 28.50 (12.55−47.97) −4.45 (−5.17 to −3.72) 5,543.25 (3,175.23−7,412.14) 1,096.27 (505.76−1,690.77) −5.14 (−5.91 to −4.36) East Asia 6.48 (3.36−9.04) 0.18 (0.07−0.31) −12.08 (−12.55 to −11.62) 490.80 (252.67−656.09) 15.92 (5.55−24.53) −11.80 (−12.31 to −11.27) Eastern Europe 0.51 (0.17−0.84) 0.07 (0.02−0.14) −7.88 (−8.61 to −7.14) 59.78 (19.28−99.20) 11.64 (2.93−22.27) −5.97 (−6.37 to −5.57) Eastern Sub-Saharan Africa 140.88 (72.43−213.99) 45.28 (21.06−67.25) −3.74 (−3.89 to −3.59) 6,312.91 (3,741.13−9,005.66) 1,761.55 (905.71−2,513.91) −4.16 (−4.28 to −4.03) High-income Asia Pacific 0.20 (0.04−0.47) 0.10 (0.02−0.25) −1.43 (−1.88 to −0.98) 14.86 (2.92−34.45) 10.60 (1.73−27.28) −0.42 (−0.75 to −0.10) High-income North America 0.04 (0.01−0.10) 0.07 (0.01−0.20) 2.51 (0.94−4.10) 4.01 (0.65−10.23) 1.46 (0.22−4.19) −2.55 (−3.24 to −1.86) North Africa and Middle East 14.12 (6.52−20.62) 1.72 (0.68−2.79) −6.88 (−7.14 to −6.62) 1,128.60 (510.43−1,652.20) 140.22 (57.77−223.78) −6.76 (−7.03 to −6.50) Oceania 60.42 (29.51−89.15) 29.79 (14.23−44.58) −1.91 (−2.12 to −1.71) 2,255.43 (1,229.54−3,217.16) 1,130.42 (605.14−1,642.04) −1.82 (−2.01 to −1.63) South Asia 172.95 (91.59−252.11) 32.71 (13.11−59.48) −5.30 (−5.48 to −5.11) 5,728.10 (3,265.20−7,845.74) 931.02 (421.82−1,503.95) −5.75 (−5.93 to −5.58) Southeast Asia 69.60 (30.14−116.69) 9.51 (3.28−15.31) −6.18 (−6.40 to −5.95) 2,990.15 (1,489.73−4,374.25) 368.33 (140.06−542.87) −6.56 (−6.76 to −6.35) Southern Latin America 1.95 (0.73−2.87) 0.37 (0.08−0.77) −4.66 (−5.23 to −4.09) 149.17 (56.01−219.54) 16.57 (3.69−33.95) −6.19 (−6.54 to −5.84) Southern Sub-Saharan Africa 55.92 (25.37−84.25) 25.35 (9.90−40.35) −2.23 (−2.56 to −1.89) 3,022.43 (1,464.65−4,144.68) 1,207.18 (518.72−1,750.86) −2.66 (−3.03 to −2.30) Tropical Latin America 18.41 (9.63−24.91) 1.24 (0.35−2.03) −8.52 (−8.86 to −8.19) 1,341.77 (703.37−1,842.29) 55.09 (16.07−87.37) −10.17 (−10.37 to −9.96) Western Europe 0.04 (0.01−0.12) 0.04 (0.01−0.11) 0.66 (−0.07 to 1.40) 5.23 (0.93−13.60) 2.54 (0.36−7.14) −1.69 (−2.11 to −1.27) Western Sub-Saharan Africa 147.97 (80.78−212.44) 43.60 (23.12−64.06) −3.94 (−4.25 to −3.63) 7,551.69 (4,648.12−10,118.39) 2,126.27 (1,222.17−3,074.01) −4.00 (−4.34 to −3.66) Table 2.
The ASMR and ASDR for diarrheal diseases attributable to unsafe water from 1990 to 2021
Figures
(8)
Tables
(2)