


-
Diarrheal diseases constitute a significant global public health challenge, representing the fourth leading group of communicable, maternal, neonatal, and nutritional diseases worldwide, and remaining a major cause of mortality among both children and adults[1]. These conditions are primarily caused by bacterial, viral, or parasitic infections, which are usually transmitted through unsafe water, contaminated food, or direct contact. According to a Global Burden of Disease (GBD) study, unsafe water, poor sanitation, and inadequate sanitation are key risk factors for diarrheal diseases, disproportionately affecting children and immunocompromised populations[2,3]. The World Health Organization reports approximately 1.7 billion cases of childhood diarrheal diseases globally each year, making it the third leading cause of death among children under six years of age. However, a large proportion of diarrheal diseases can be prevented through access to safe water, and the implementation of proper sanitation and hygiene practices[4].
Unsafe water poses a significant health risk, and can lead to serious waterborne diseases such as diarrhea, typhoid, and cholera[5]. Many countries and regions still struggle with access to safe drinking water due to inadequate water management and insufficient infrastructure[6,7]. The burden of diarrheal diseases caused by unsafe water varies widely across regions and populations, with Sub-Saharan Africa, South Asia, and Southeast Asia experiencing significantly higher morbidity and mortality rates than other parts of the world[8]. These high morbidity rates are not only associated with poor water quality, but are also closely linked to inadequate sanitation facilities and inadequate hygiene practices. Complex ecological and socioeconomic factors compound the burden of diarrheal diseases resulting from unsafe water. The high incidence of these diseases not only imposes a significant economic burden on families and increases healthcare costs for society, but also has long-term negative impacts on children's growth and cognitive development[9]. Research indicates that intestinal infections from diarrheal diseases can impair intestinal absorptive and barrier functions, further weakening the immune system and leading to developmental delays and lower IQ, creating a vicious circle[10]. These effects may even extend into adulthood, with profound implications for both personal and socioeconomic development. Despite global progress in improving access to safe water and sanitation, the fight against diarrheal diseases caused by unsafe water faces new challenges, particularly due to climate change and accelerated urbanization[11].
Despite the significant impact of unsafe water on global health, few studies have comprehensively examined the burden of diarrheal diseases attributable to unsafe water worldwide. Most existing research has been confined to specific countries or regions[12,13], leaving critical gaps in the understanding of the global and regional epidemiological characteristics. Meanwhile, most prior analyses were based on earlier GBD iterations, focused primarily on descriptive trends, and did not jointly evaluate efficiency gaps relative to development levels, or project future burden. Using the updated GBD 2021 dataset, the present study offers several contributions. First, it provides the most recent and comprehensive assessment of diarrheal disease burden attributable to unsafe water across 204 countries through 2021. Second, by incorporating Social Development Index (SDI)-based frontier analysis, the gap between observed burden and the minimum achievable burden at comparable development levels is quantified, highlighting unrealized potential for improvement. Third, a Bayesian age-period-cohort (BAPC) model is applied to project the future burden from 2022 to 2035, offering forward-looking evidence to inform long-term policy planning. Together, these approaches extend previous GBD analyses by integrating retrospective assessment with prospective projections and efficiency-oriented evaluation. The findings will provide a robust scientific foundation for the development of more effective global and regional public health policies, advancing efforts to ensure safe water access and improved sanitation, and ultimately reducing the global burden of diarrheal diseases.
-
The study utilized the disease burden data from the Global Health Data Exchange (
http://ghdx.healthdata.org/gbd-results-tool ). The 2021 GBD study integrated data from multiple sources, including vital registration systems, household surveys, and surveillance data. In settings where data are sparse or incomplete, GBD applies advanced statistical modeling to generate estimates. Uncertainty arising from data limitations, model specification, and parameter estimation is quantified through repeated draws from the posterior distribution. The reported 95% uncertainty intervals (UIs) represent the 2.5th and 97.5th percentiles of these draws, and reflect the combined uncertainty in the underlying data and modeling process.In the GBD study, exposure to unsafe water is defined by the household primary water source, and whether water treatment is used to improve water quality before consumption. The theoretical minimum risk exposure level is the use of high-quality piped water (water entering the household uncontaminated). Unsafe sanitation is the monitoring of facilities/excreta management; partial overlap across water, sanitation, and hygiene risks may remain despite GBD procedures to minimize double-counting. In this study, the dataset included the numbers and crude rates of deaths and DALYs attributable to diarrheal diseases caused by unsafe water across 204 countries from 1990 to 2021. Age-standardized mortality rates (ASMR), and age-standardized DALY rates (ASDR) were analyzed to facilitate comparisons across populations with different age structures. All data was stratified by region, sex, age group, year, and SDI categories. The SDI is a composite indicator that reflects fertility, educational attainment, and income[14]. Countries and territories were classified into five SDI levels: low, low-middle, middle, high-middle, and high, with SDI values ranging from 0 to 1. Higher values indicate higher levels of socio-demographic development.
Statistical analysis
-
Percentage change was calculated to describe variations in the number of deaths and DALYs in 2021 relative to 1990, using the following formula: percentage change = (variable2021 − variable1990)/variable1990 × 100%. Trends in ASMR and ASDR from 1990 to 2021 were quantified using estimated annual percentage change (EAPC). A linear model was fitted to the natural logarithm of the rates over time, using the equation, y = α + βx + ε, where x represents year, y represents the natural logarithm of the rates, α represents the intercept, and β represents the random error. The EAPC was calculated as 100 × (eβ − 1), with a 95% confidence interval (CI)[15]. Trends in ASRs were considered upward if the 95% CI for EAPC > 0, downward if the 95% CI < 0, and stable if the 95% CI included 0.
Frontier analysis establishes a theoretical minimum for ASR that a country or territory can achieve given its current level of development. This serves as a benchmark for optimal performance, quantifying the gap between the current disease burden and its potential minimum, and highlighting priority areas for improvement. The relationship between the burden of diarrheal diseases attributable to unsafe water and socio-demographic development levels was evaluated using frontier analysis. ASR-based frontier models incorporating the Socio-Demographic Index (SDI) were developed. Locally weighted polynomial regression, with smoothing spans of 0.3, 0.4, and 0.5, was applied to model the non-linear relationship and generate smooth frontier lines. This range is commonly used in locally weighted regression to balance bias and variance: smaller spans allow greater flexibility in capturing local structure, while larger spans provide a smoother, more stable frontier. We compared frontier curves generated under all three spans. For presentation, the results used a smoothing span of 0.3. Model robustness was ensured using 100 bootstrap samples to calculate the average ASR for each SDI. The potential for improvement in each country or territory was quantified as the absolute difference between its ASR in 2021, and the corresponding frontier line is defined as the effective difference. Final estimates represent the mean estimate across 100 bootstrap samples.
To project the future burden of diarrheal diseases attributable to unsafe water from 2022 to 2035, a BAPC model is applied. The model decomposes temporal trends into age, period, and cohort effects, allowing flexible estimation of non-linear temporal patterns, while accounting for uncertainty. Specifically, age-specific deaths and DALYs were assumed to follow a Poisson distribution, with the logarithm of the expected rates modeled as the sum of age, period, and cohort effects. Second-order random walk priors were assigned to the age, period, and cohort effects to ensure smoothness across adjacent age groups and calendar years, a common approach in disease-burden forecasting. Weakly informative Gaussian priors with mean zero and large variance were specified for the intercept term. Model estimation was performed within a Bayesian framework using Integrated nested Laplace approximation (INLA). Model convergence and goodness-of-fit were assessed using the deviance information criterion (DIC) and a visual inspection of the fitted versus observed values.
-
In 2021, the global burden of diarrheal diseases attributable to unsafe water was assessed across 204 countries and territories. The total number of deaths attributable to unsafe water was 802,486 (95% UI: 1,673−1,215,503), corresponding to 41,718,708 DALYs (95% UI: 21,351,085−57,788,564). The ASMR was 10.66 (95% UI: 5.03−15.80) per 100,000 population, and the ASDR was 593.00 (95% UI: 309.18−823.91) per 100,000 population (Tables 1 and 2). The burden was predominantly observed among children under five years of age, and was slightly higher in males than in females (Figs 1 and 2). Stratification by SDI revealed substantial disparities across regions. Low-SDI quintile regions experienced the highest burden, with 358,394.65 deaths (95% UI: 190,233.73−502,311.01), and 23,005,435.06 DALYs (95% UI: 13,133,771.54−32,197,961.86) in 2021. It also exhibited the highest ASMR and ASDR (Tables 1 and 2). Across SDI quintile regions, a consistent inverse association was observed between disease burden and socio-demographic development, with both ASMR and ASDR declining as SDI increased (Fig. 3).
Table 1. The deaths and DALYs in diarrheal diseases attributable to unsafe water from 1990 to 2021
Characteristics Deaths number DALYs number 1990 2021 Change
(%, 95% CI)1990 2021 Change
(%, 95% CI)Both (95% UI) Both (95% UI) Both (95% UI) Both (95% UI) Global 2,173,550.83
(1,265,813.61−2,913,015.18)802,486.17
(371,672.74−1,215,503.48)−63.08
(−72.25 to −53.88)142,377,712.19
(8,395,2630.63−188,159,938.20)41,718,708.11
(21,351,085.13−57,788,563.73)−70.70
(−76.86 to −64.31)Sex Male 1,105,856.12
(596,876.00−1,520,100.15)390,178.23
(181,559.47−612,241.42)−64.72
(−73.73 to −53.64)74,426,248.47
(41,771,343.32−101,108,721.56)21,776,420.55
(11,071,141.91−31,455,889.18)−70.74
(−77.61 to −62.69)Female 1,067,694.71
(580,734.52−1,596,669.06)412,307.93
(162,776.83−741,530.31)−61.38
(−74.34 to −47.41)67,951,463.72
(40,252,756.12−93,560,756.74)19,942,287.55
(9,544,451.73−29,087,230.38)−70.65
(−78.41 to −62.57)SDI High 1,978.94
(613.66−3,508.45)2,080.22
(382.72−4,970.10)5.12
(−42.21 to 49.51)160,563.35
(50,996.07−295,725.67)72,820.24
(14,755.20−170,439.01)−54.65
(−72.34 to −37.50)High-middle 30,538.27
(14,371.26−44,365.95)6,094.53
(1,586.14−11,323.31)−80.04
(−89.36 to −73.05)2,494,596.80
(1,195,348.64−3,487,882.78)320,392.15
(98,318.66−528,024.04)−87.16
(−91.96 to −83.70)Middle 344,945.32
(172,811.24−493,314.13)95,468.82
(29,990.31−160,261.60)−72.32
(−82.83 to −63.20)23,232,889.29
(11,865,015.17−32,122,015.36)4,253,213.68
(158,0247.15−6,361,599.01)−81.69
(−86.88 to −77.37)Low-middle 1,102,218.96
(629,940.29−1,500,805.50)339,997.20
(149,025.02−580,965.60)−69.15
(−78.57 to −57.60)67,480,802.58
(38,837,083.72−89,533,812.60)14,037,755.28
(6,669,543.76−20,824,787.05)−79.20
(−84.41 to −73.68)Low 692,802.62
(428,612.36−909,643.20)358,394.65
(190,233.73−502,311.01)−48.27
(−61.34 to −33.23)48,929,794.52
(30,739,225.74−64,623,156.08)23,005,435.06
(13,133,771.54−32,197,961.86)−52.98
(−65.45 to −38.14)Region Andean Latin America 5,820.63
(1,663.59−8,757.82)745.47
(114.59−1,443.35)−87.19
(−92.87 to −81.10)492,561.26
(141,422.75−741,160.83)46,480.43
(7,569.21−8,3258.70)−90.56
(−94.43 to −87.35)Australasia 27.32
(5.41−61.71)41.43
(7.66−105.54)51.66
(−4.93 to 129.31)1,835.64
(353.28−4,256.47)1,051.29
(189.33−2,569.36)−42.73
(−63.35 to −12.55)Caribbean 1,0941.85
(5,792.49−1,4579.06)4,274.85
(2,151.83−6,309.51)−60.93
(−73.28 to −47.61)904,349.92
(479,888.75−1,202,405.89)317,886.31
(162,046.97−469,514.54)−64.85
(−75.94 to −52.70)Central Asia 8,044.87
(2,590.13−12,256.51)1,017.41
(289.45−1,727.36)−87.35
(−91.38 to −82.84)728,702.81
(234,597.55−1,109,981.71)94,543.92
(27,303.94−157,861.29)−87.03
(−91.03 to −82.71)Central Europe 516.65
(182.29−806.38)745.73
(163.66−1,529.22)44.34
(−10.32 to 94.13)41,903.08
(14,937.85−6,5481.87)16,989.62
(3,941.75−3,3970.44)−59.45
(−74.23 to −46.18)Central Latin America 32,238.47
(12,997.12−47,386.68)5,631.99
(1,658.38−9,041.68)−82.53
(−87.34 to −78.00)2,490,565.13
(1,001,901.12−3,659,972.86)281,822.84
(84,989.91−457,297.19)−88.68
(−91.45 to −85.83)Central Sub-Saharan Africa 60,607.06
(35,230.65−82,223.69)21,867.24
(9,850.00−34,501.00)−63.92
(−75.51 to −49.49)4,769,718.71
(2,832,273.87−6,479,902.51)1,482,475.07
(704,747.66−2,291,717.83)−68.92
(−78.17 to −56.11)East Asia 65,863.34
(34,602.64−89,614.90)2,451.62
(854.94−4668.36)−96.28
(−98.03 to −93.84)5,554,494.29
(2,841,091.81−7,424,873.67)172,910.44
(58,621.31−274,634.53)−96.89
(−98.18 to −95.63)Eastern Europe 891.60
(289.27−1,462.84)163.72
(40.49−317.08)−81.64
(−88.23 to −76.28)101,173.08
(32,242.18−168,930.22)18,228.23
(4,480.50−35,261.81)−81.98
(−88.34 to −76.41)Eastern Sub-Saharan Africa 231,021.38
(136,591.38−326,786.86)113,609.09
(57,337.38−164,273.06)−50.82
(−67.45 to −28.29)17,300,906.43
(10,120,719.70−24,609,743.56)7,550,896.85
(4,175,069.54−10,891,729.64)−56.36
(−70.64 to −37.03)High-income Asia Pacific 306.19
(53.09−722.18)602.75
(101.56−1,521.67)96.86
(15.41−198.25)21,376.87
(4,165.77−49,228.27)19,478.99
(3,209.43−50,406.67)−8.88
(−46.25 to 42.72)High-income North America 112.11
(18.92−300.80)469.92
(69.47−1,360.02)319.17
(133.26−554.00)10,162.33
(1,677.85−25,905.98)8,223.49
(1,215.78−23,718.17)−19.08
(−57.28 to 27.85)North Africa and Middle East 63,037.13
(28,631.62−92,533.45)8,873.49
(3,534.49−14,386.76)−85.92
(−89.57 to −82.12)5,627,664.02
(2,556,543.77−8,284,532.71)822,689.60
(341,327.31−1,315,801.76)−85.38
(−88.92 to −81.74)Oceania 2,395.16
(1,297.84−3,484.32)2,564.78
(1,320.98−3,791.17)7.08
(−18.25 to 33.65)167,548.22
(95,496.95−244,901.72)167,577.90
(89,478.60−257,595.12)0.02
(−29.46 to 34.36)South Asia 1,116,409.02
(629,736.85−1,559,075.95)393,585.16
(157,173.28−697,979.92)−64.75
(−76.17 to −51.77)62,691,034.12
(36,270,019.06−83,185,946.27)14,067,207.04
(6,377,761.43−22,326,580.60)−77.56
(−83.99 to −70.55)Southeast Asia 225,006.39
(107,758.05−346,945.41)5,0475.73
(17,836.56−79,782.95)−77.57
(−86.85 to −67.67)14,424,539.42
(7,335,671.51−20,331,546.41)2,188,950.93
(834,374.29−3,212,055.23)−84.82
(−89.61 to −79.32)Southern Latin America 896.23
(336.10−1,315.41)304.12
(63.88−637.46)−66.07
(−82.23 to −51.24)74,649.36
(28,027.53−109,779.32)10,304.41
(2,284.18−21,372.03)−86.20
(−92.70 to −80.03)Southern Sub-Saharan Africa 25,792.84
(12,406.49−35,702.28)15,276.66
(6,083.74−23,405.46)−40.77
(−54.80 to −26.45)1,910,957.12
(938,227.72−2,562,049.32)902,425.21
(391,017.67−1295,772.80)−52.78
(−62.85 to −41.91)Tropical Latin America 25,272.08
(13,257.83−34,513.23)2,854.92
(795.55−4,671.74)−88.70
(−93.72 to −85.05)2,104,926.88
(1,104,644.04−2,901,207.76)114,404.79
(33,109.39−182,123.89)−94.56
(−96.95 to −92.87)Western Europe 225.93
(39.31−600.68)476.26
(73.36−1,291.83)110.80
(46.68−172.79)17,183.64
(3,047.47−44,333.23)13,089.31
(1,928.28−37,189.87)−23.83
(−45.21 to −2.87)Western Sub-Saharan Africa 298,124.58
(183,737.02−399,382.60)176,453.83
(101,431.92−259,136.37)−40.81
(−55.46 to −22.36)22,941,459.85
(14,210,087.39−30,183,132.14)13,421,071.41
(7,793,817.58−19,283,985.98)−41.50
(−56.85 to −21.52)Table 2. The ASMR and ASDR for diarrheal diseases attributable to unsafe water from 1990 to 2021
Characteristics ASMR (per 100,000 population) ASDR (per 100,000 population) 1990 2021 EAPC (95%CI) 1990 2021 EAPC (95% CI) Both (95% UI) Both (95%UI) Both (95%UI) Both (95%UI) Global 44.84 (25.74−61.80) 10.66 (5.03−15.80) −4.57 (−4.76 to −4.37) 2,468.55 (1,453.28−3,242.23) 593.00 (309.18−823.91) −4.55 (−4.76 to −4.33) Sex Male 48.68 (26.21−70.74) 11.05 (5.17−16.95) −4.72 (−4.94 to −4.49) 2,559.89 (1,422.98−3,467.49) 617.31 (317.69−904.27) −4.54 (−4.74 to −4.34) Female 42.37 (22.46−64.43) 10.30 (4.36−17.58) −4.49 (−4.68 to −4.31) 2,388.92 (1,419.75−3,346.52) 567.56 (278.93−803.57) −4.58 (−4.82 to −4.34) SDI High 0.26 (0.08−0.46) 0.10 (0.02−0.23) −2.50 (−2.81 to −2.18) 23.39 (7.49−42.93) 6.55 (1.40−14.62) −3.68 (−3.97 to −3.39) High-middle 3.40 (1.60−4.96) 0.43 (0.12−0.76) −6.95 (−7.34 to −6.56) 271.47 (130.60−379.64) 31.37 (9.85−50.18) −7.17 (−7.46 to −6.88) Middle 28.49 (12.91−42.50) 4.45 (1.42−7.35) −5.89 (−5.98 to −5.81) 1,335.16 (672.15−1,859.03) 204.62 (79.10−304.03) −6.00 (−6.08 to −5.92) Low-middle 138.82 (75.45−201.62) 27.00 (11.70−46.98) −5.21 (−5.36 to −5.06) 5,210.81 (3,049.65−6,993.99) 852.67 (402.19−1,310.25) −5.72 (−5.88 to −5.55) Low 175.42 (99.97−252.35) 52.52 (25.24−80.94) −3.82 (−4.05 to −3.59) 7,167.67 (4,370.53−9,471.28) 1,973.12 (1,063.01−2,757.62) −4.09 (−4.33 to −3.84) Region Andean Latin America 14.23 (4.15−21.53) 1.27 (0.19−2.46) −8.08 (−8.38 to −7.78) 995.59 (284.67−1,501.24) 75.10 (12.19−134.27) −8.63 (−8.88 to −8.37) Australasia 0.13 (0.03−0.30) 0.07 (0.01−0.18) −0.03 (−1.35 to 1.30) 9.53 (1.84−21.99) 2.78 (0.49−6.66) −3.50 (−3.92 to −3.07) Caribbean 28.14 (14.75−37.44) 10.26 (5.21−15.09) −3.05 (−3.51 to −2.59) 2,186.95 (1,158.97−2,909.15) 802.92 (410.70−1,192.05) −2.95 (−3.42 to −2.47) Central Asia 8.75 (2.82−13.33) 1.03 (0.29−1.75) −7.97 (−8.37 to −7.56) 780.43 (251.25−1,188.68) 95.46 (27.58−159.35) −7.79 (−8.17 to −7.40) Central Europe 0.56 (0.20−0.87) 0.40 (0.09−0.81) −0.69 (−2.39 to 1.03) 47.66 (17.07−74.05) 15.93 (3.93−31.31) −3.44 (−4.66 to −2.20) Central Latin America 20.44 (8.15−29.80) 2.49 (0.74−4.02) −6.44 (−7.00 to −5.87) 1,206.82 (484.96−1,765.24) 128.58 (39.21−209.45) −6.91 (−7.38 to −6.44) Central Sub-Saharan Africa 114.53 (59.62−158.97) 28.50 (12.55−47.97) −4.45 (−5.17 to −3.72) 5,543.25 (3,175.23−7,412.14) 1,096.27 (505.76−1,690.77) −5.14 (−5.91 to −4.36) East Asia 6.48 (3.36−9.04) 0.18 (0.07−0.31) −12.08 (−12.55 to −11.62) 490.80 (252.67−656.09) 15.92 (5.55−24.53) −11.80 (−12.31 to −11.27) Eastern Europe 0.51 (0.17−0.84) 0.07 (0.02−0.14) −7.88 (−8.61 to −7.14) 59.78 (19.28−99.20) 11.64 (2.93−22.27) −5.97 (−6.37 to −5.57) Eastern Sub-Saharan Africa 140.88 (72.43−213.99) 45.28 (21.06−67.25) −3.74 (−3.89 to −3.59) 6,312.91 (3,741.13−9,005.66) 1,761.55 (905.71−2,513.91) −4.16 (−4.28 to −4.03) High-income Asia Pacific 0.20 (0.04−0.47) 0.10 (0.02−0.25) −1.43 (−1.88 to −0.98) 14.86 (2.92−34.45) 10.60 (1.73−27.28) −0.42 (−0.75 to −0.10) High-income North America 0.04 (0.01−0.10) 0.07 (0.01−0.20) 2.51 (0.94−4.10) 4.01 (0.65−10.23) 1.46 (0.22−4.19) −2.55 (−3.24 to −1.86) North Africa and Middle East 14.12 (6.52−20.62) 1.72 (0.68−2.79) −6.88 (−7.14 to −6.62) 1,128.60 (510.43−1,652.20) 140.22 (57.77−223.78) −6.76 (−7.03 to −6.50) Oceania 60.42 (29.51−89.15) 29.79 (14.23−44.58) −1.91 (−2.12 to −1.71) 2,255.43 (1,229.54−3,217.16) 1,130.42 (605.14−1,642.04) −1.82 (−2.01 to −1.63) South Asia 172.95 (91.59−252.11) 32.71 (13.11−59.48) −5.30 (−5.48 to −5.11) 5,728.10 (3,265.20−7,845.74) 931.02 (421.82−1,503.95) −5.75 (−5.93 to −5.58) Southeast Asia 69.60 (30.14−116.69) 9.51 (3.28−15.31) −6.18 (−6.40 to −5.95) 2,990.15 (1,489.73−4,374.25) 368.33 (140.06−542.87) −6.56 (−6.76 to −6.35) Southern Latin America 1.95 (0.73−2.87) 0.37 (0.08−0.77) −4.66 (−5.23 to −4.09) 149.17 (56.01−219.54) 16.57 (3.69−33.95) −6.19 (−6.54 to −5.84) Southern Sub-Saharan Africa 55.92 (25.37−84.25) 25.35 (9.90−40.35) −2.23 (−2.56 to −1.89) 3,022.43 (1,464.65−4,144.68) 1,207.18 (518.72−1,750.86) −2.66 (−3.03 to −2.30) Tropical Latin America 18.41 (9.63−24.91) 1.24 (0.35−2.03) −8.52 (−8.86 to −8.19) 1,341.77 (703.37−1,842.29) 55.09 (16.07−87.37) −10.17 (−10.37 to −9.96) Western Europe 0.04 (0.01−0.12) 0.04 (0.01−0.11) 0.66 (−0.07 to 1.40) 5.23 (0.93−13.60) 2.54 (0.36−7.14) −1.69 (−2.11 to −1.27) Western Sub-Saharan Africa 147.97 (80.78−212.44) 43.60 (23.12−64.06) −3.94 (−4.25 to −3.63) 7,551.69 (4,648.12−10,118.39) 2,126.27 (1,222.17−3,074.01) −4.00 (−4.34 to −3.66) 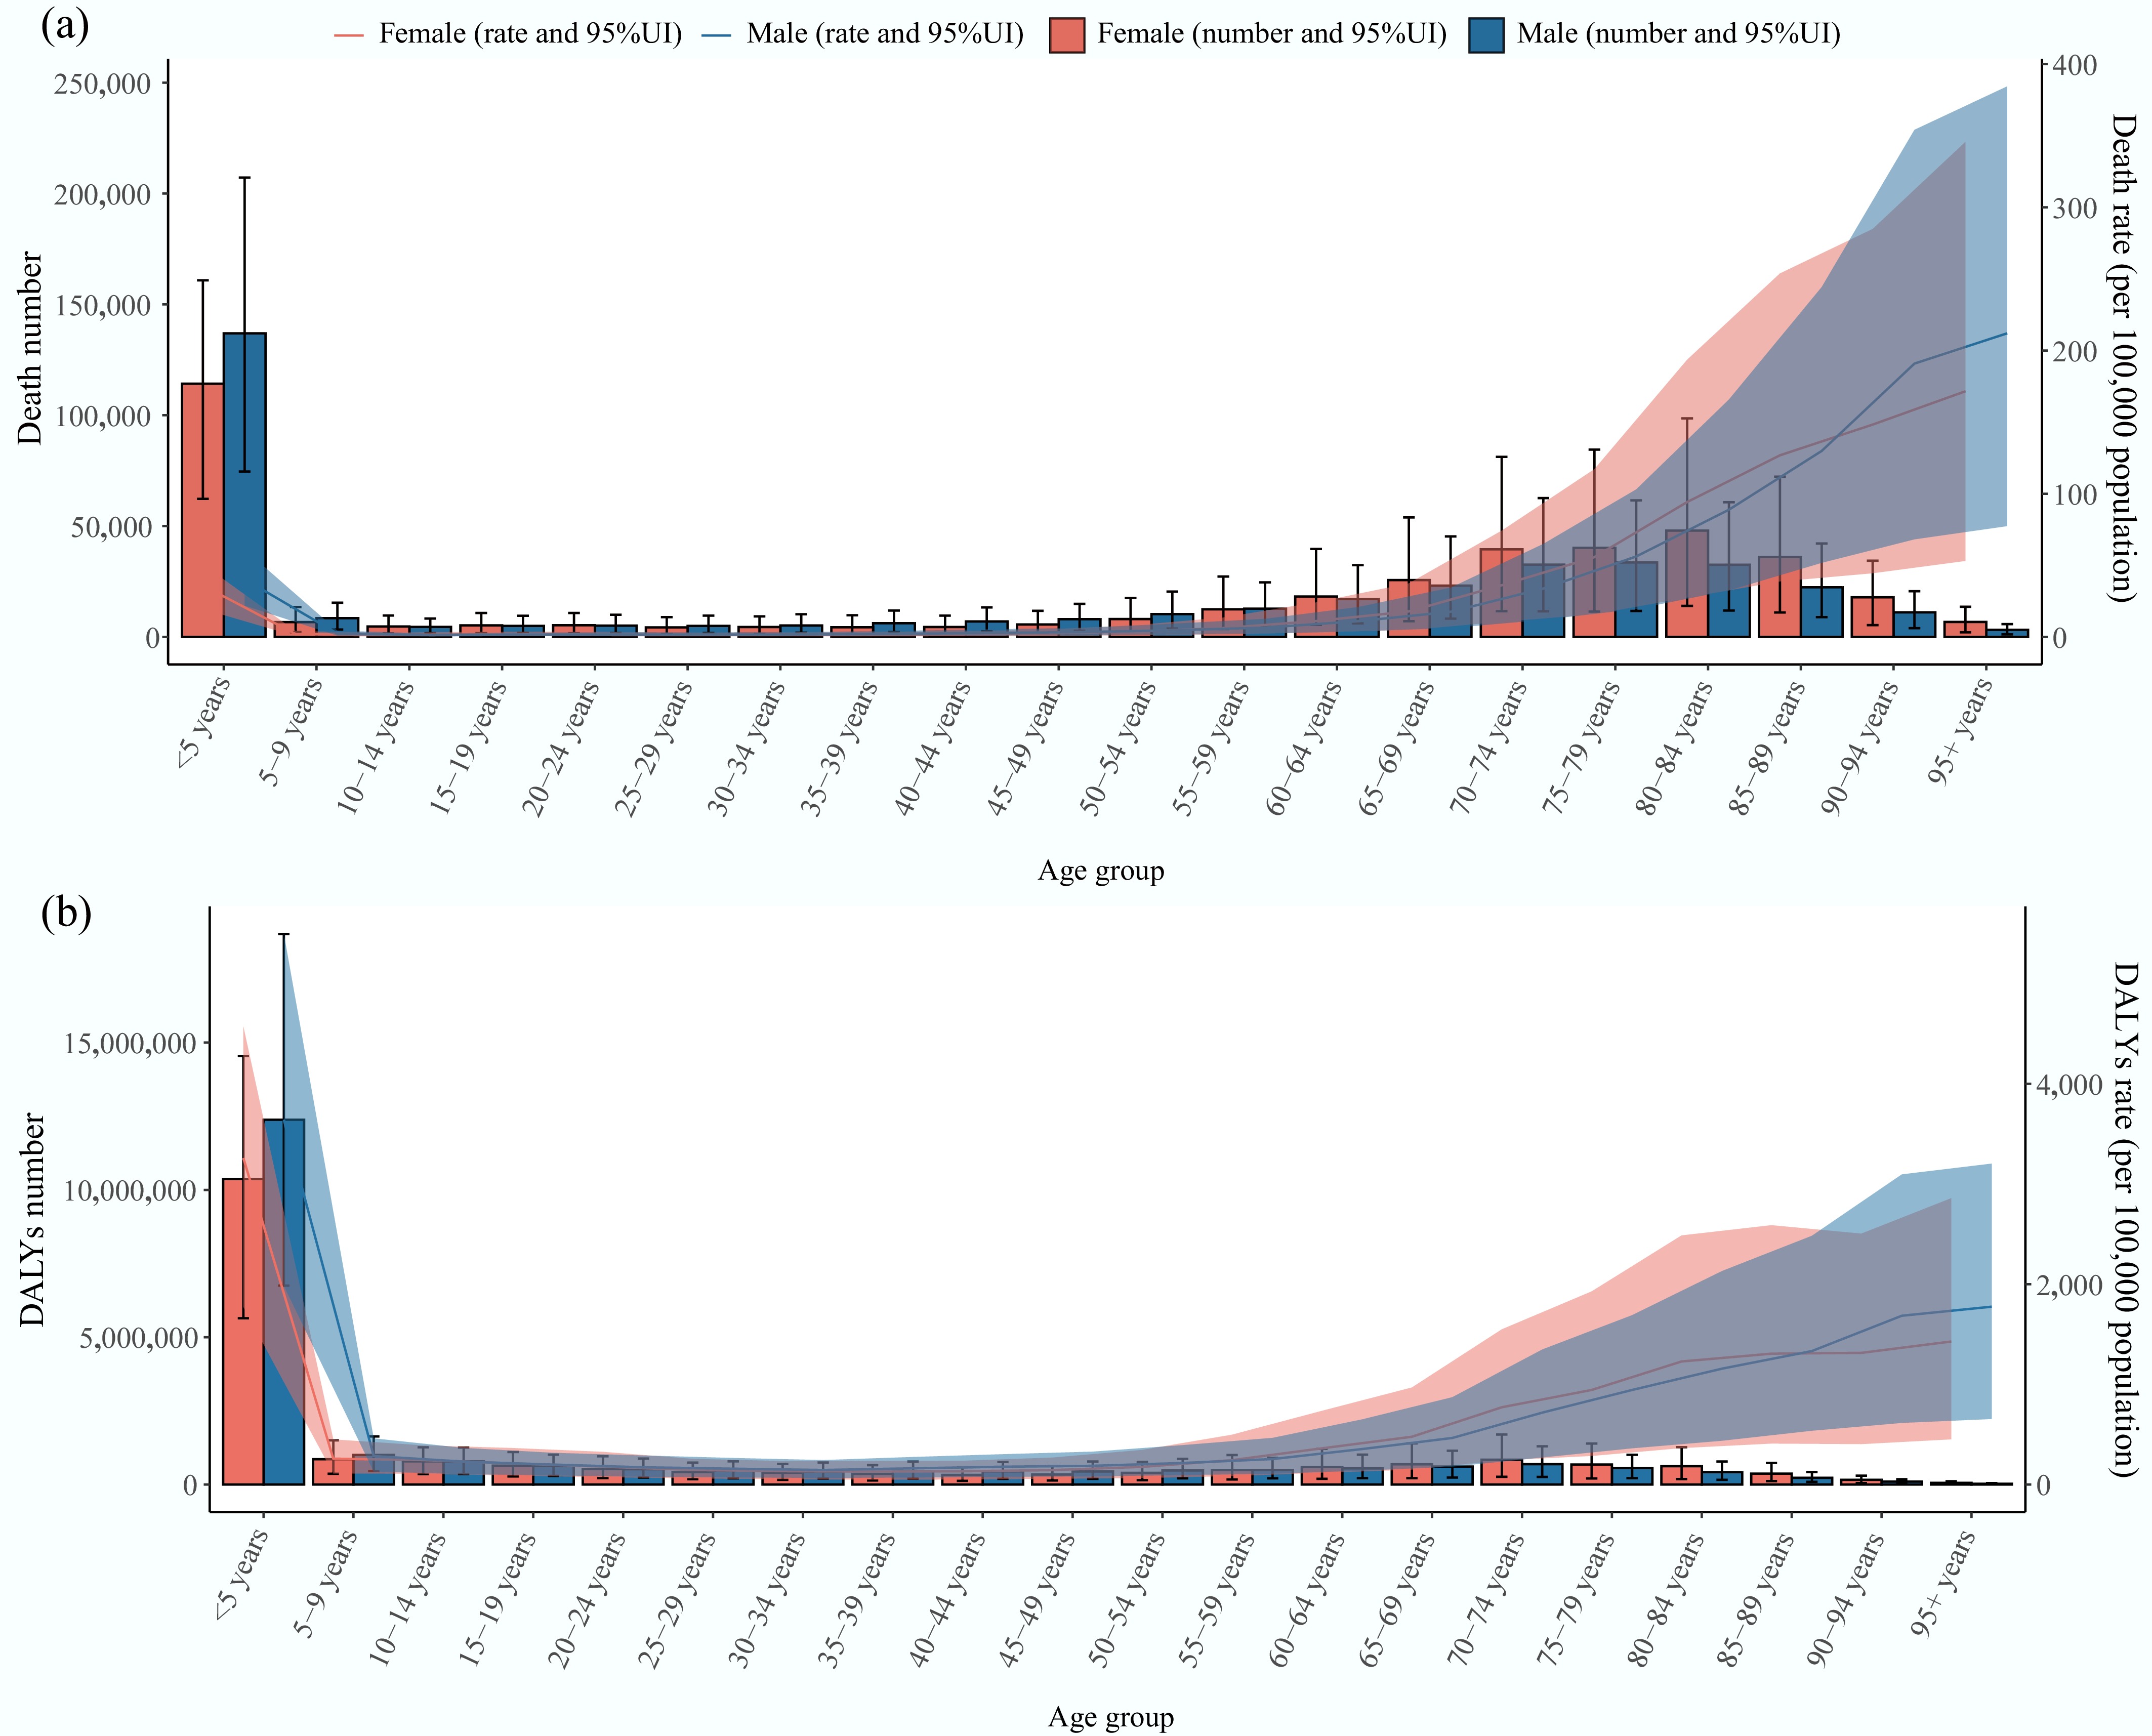
Figure 1.
Global burden of diarrheal diseases attributable to unsafe water by age group and sex in 2021. (a) Deaths number and the rate with their 95% UI. (b) DALYs number and rate with their 95% UI. DALYs: disability-adjusted life years; UI: uncertainty intervals.
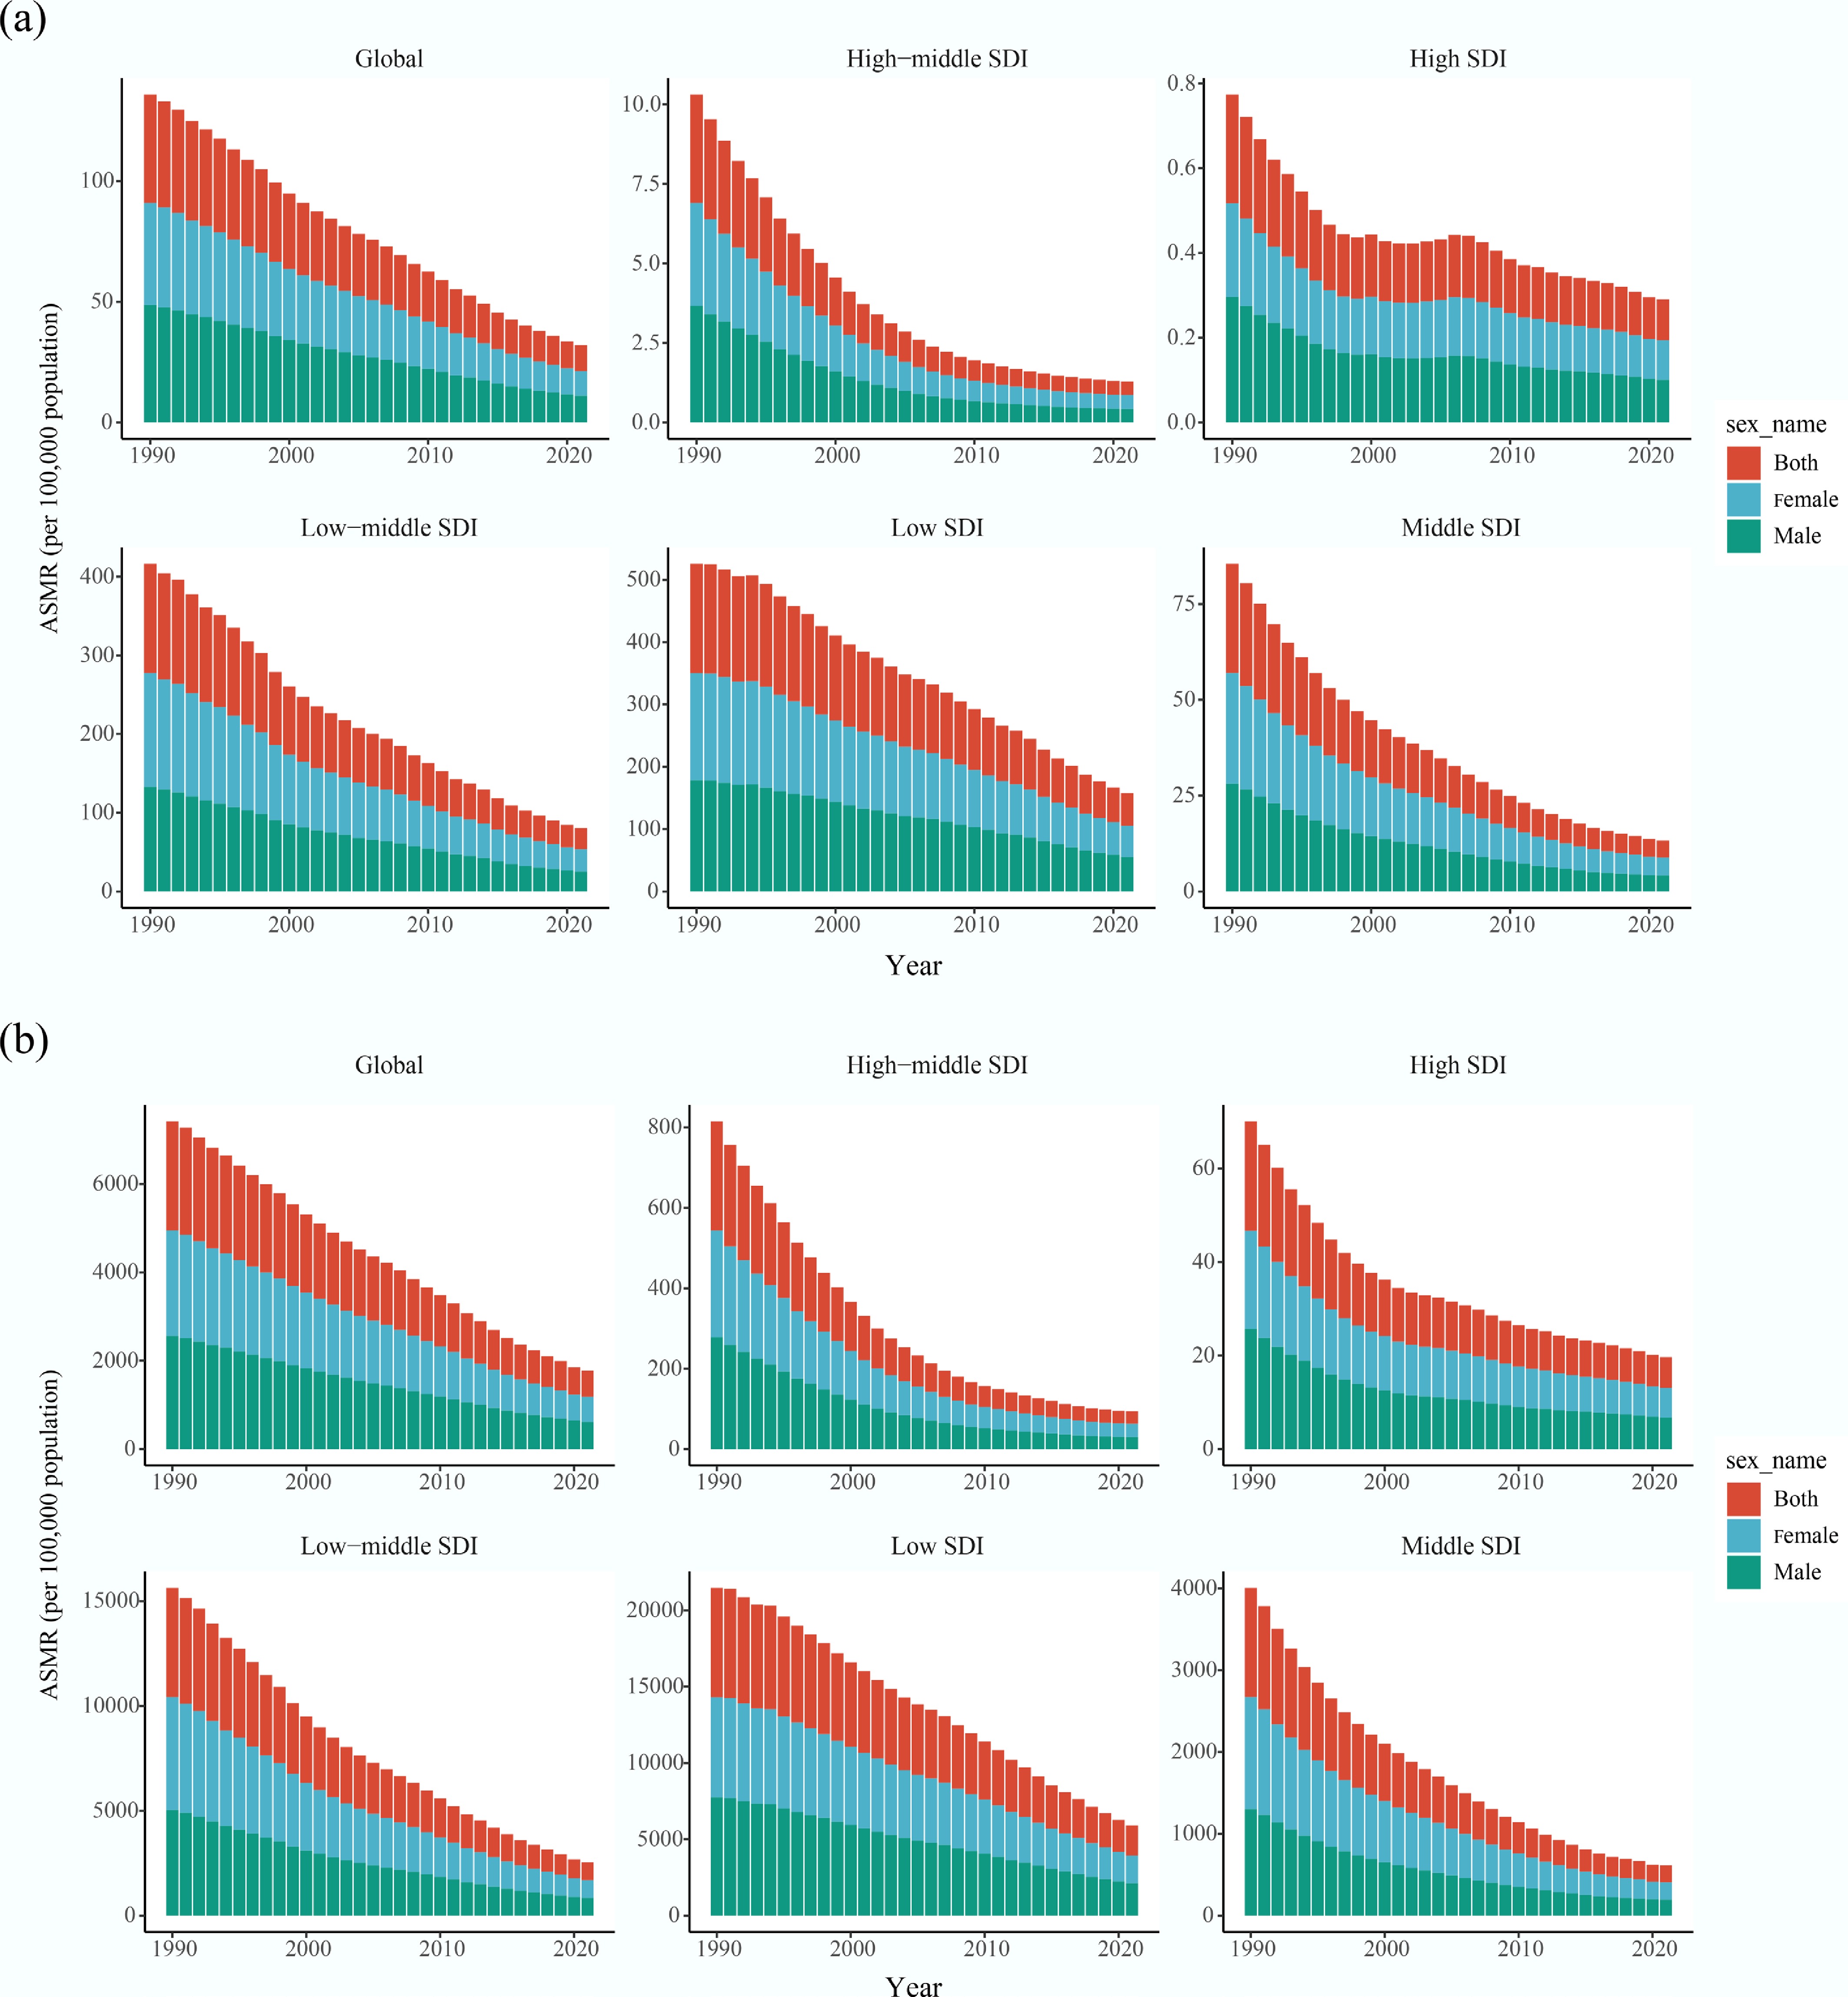
Figure 2.
Temporal trends in the burden of diarrheal diseases attributable to unsafe water in global and different SDI quintile regions from 1990 to 2021. (a) ASMR for both male and female. (b) ASDR for both male and female. ASMR: age-standardized mortality rate; ASDR: age-standardized disability-adjusted life years rate; SDI: socio-demographic index.
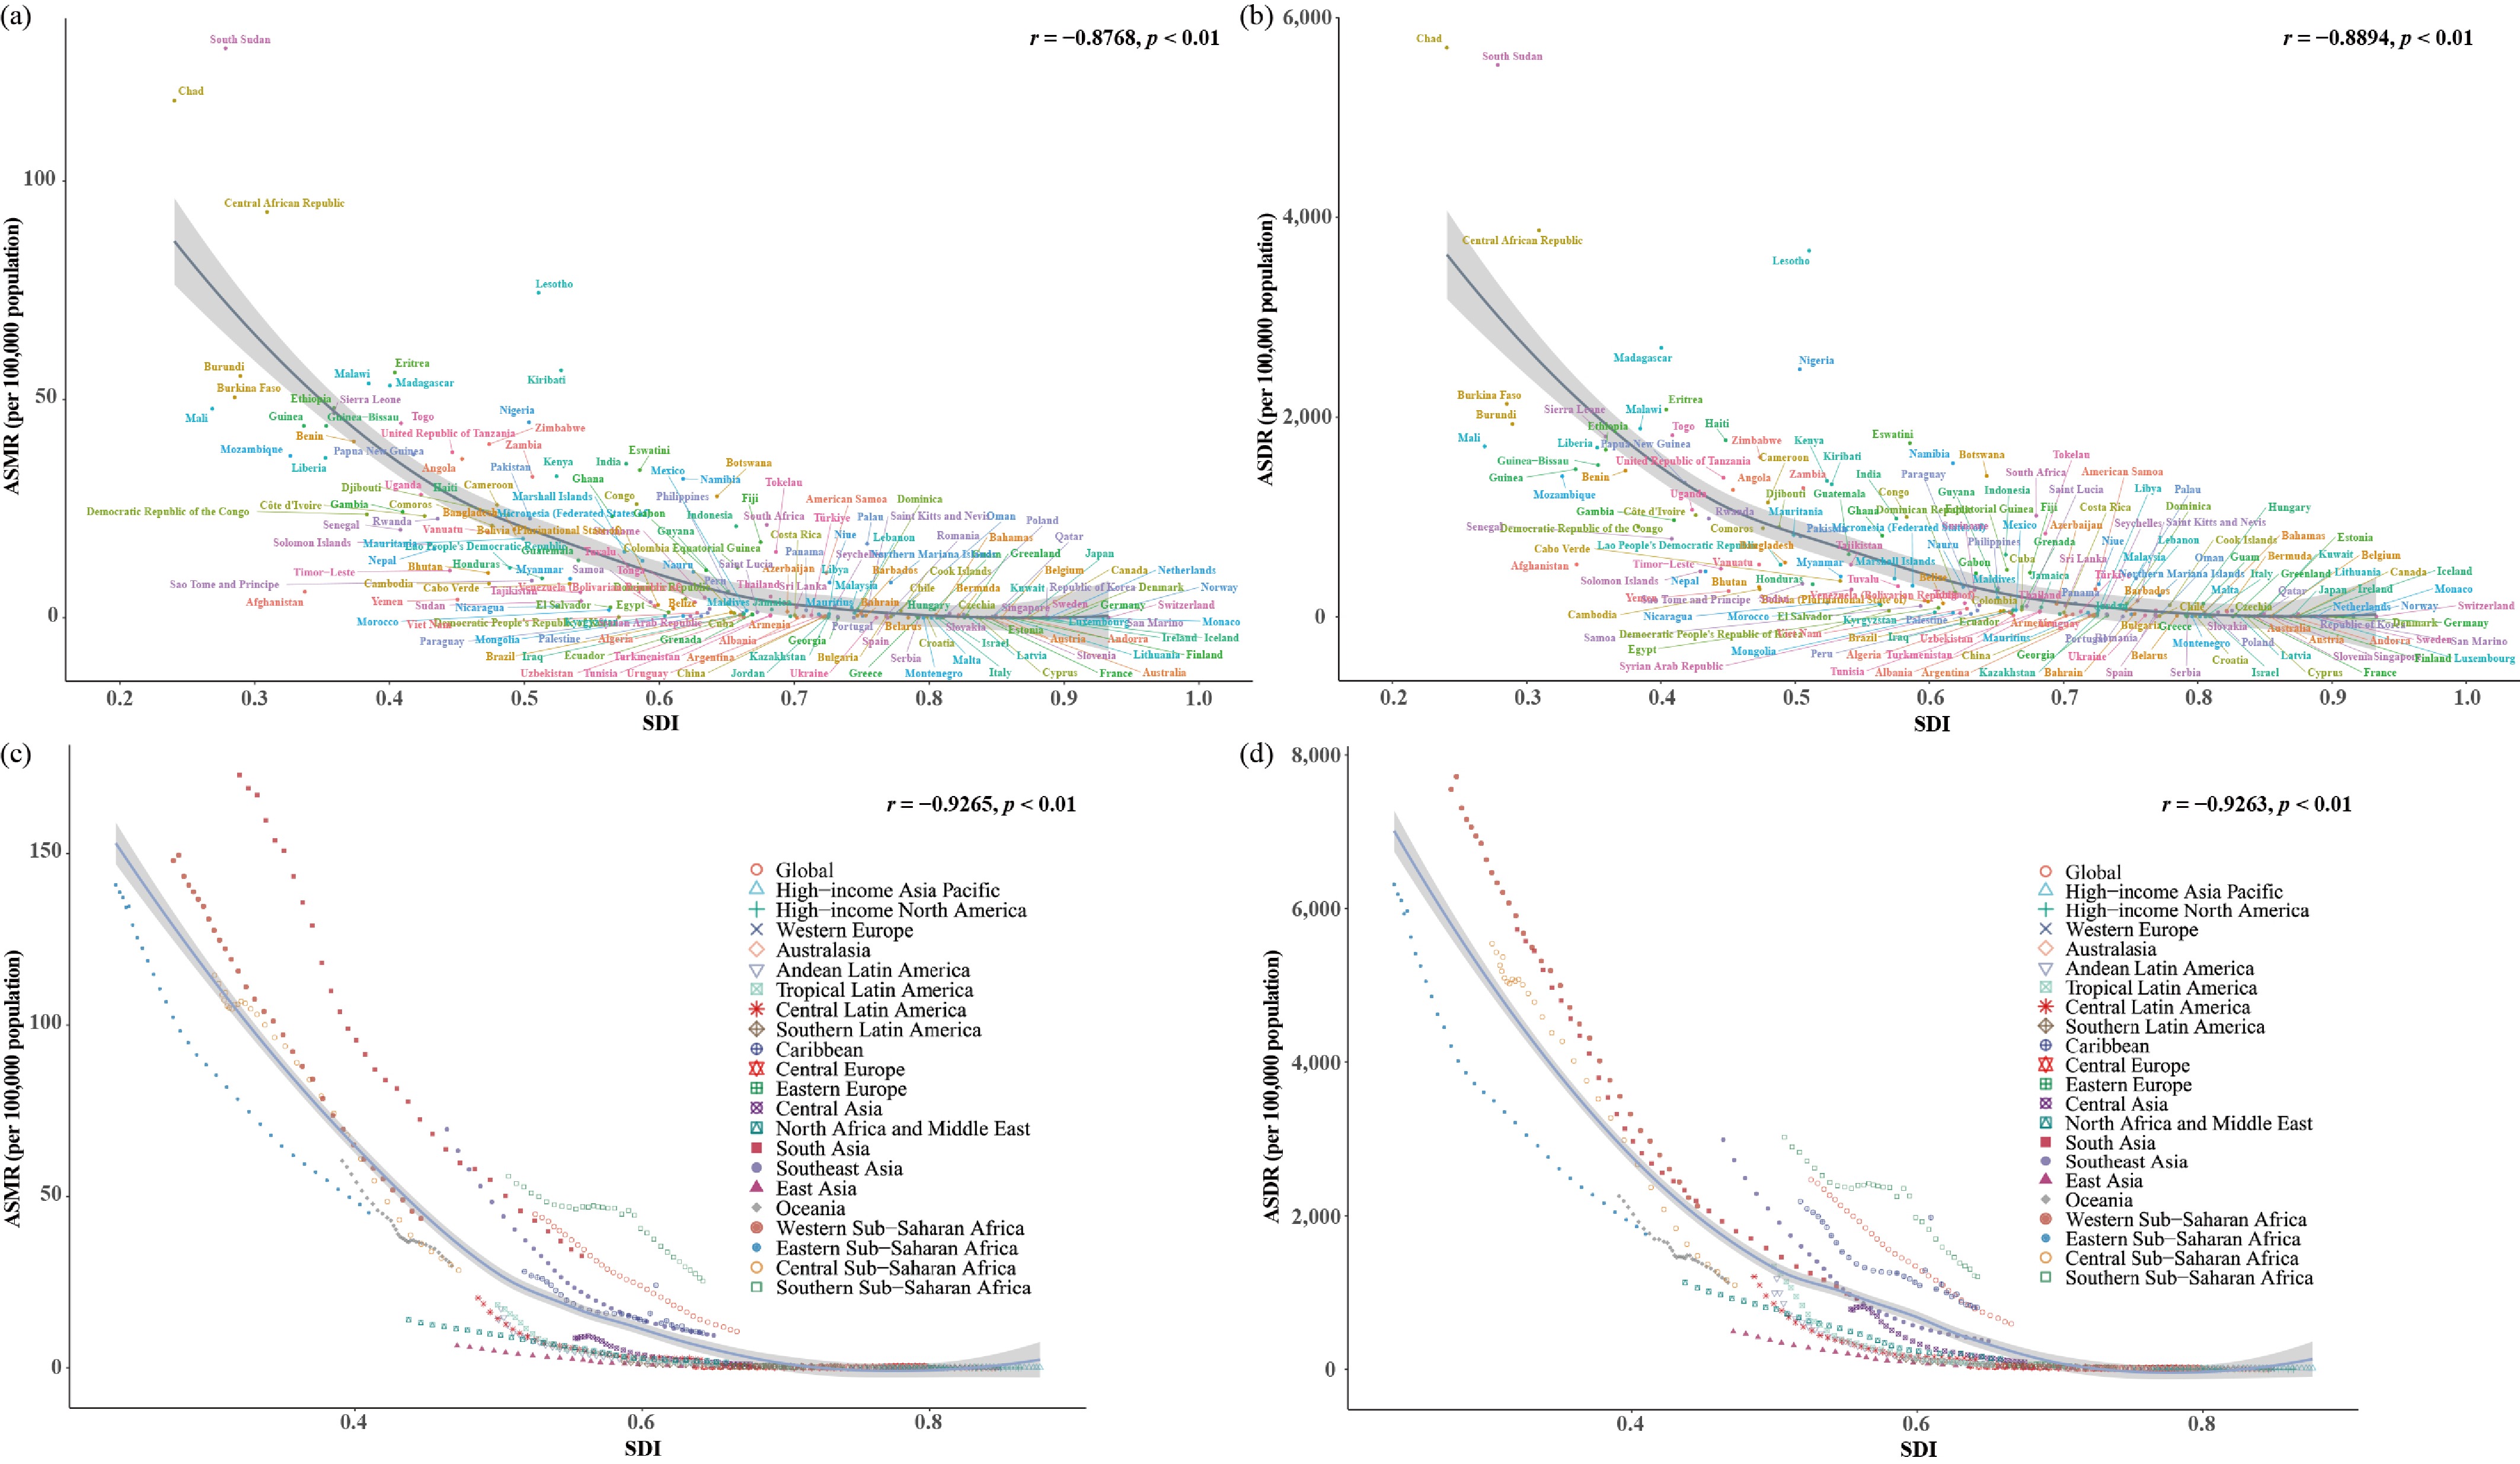
Figure 3.
The burden of diarrheal disease attributable to unsafe water globally and for 21 GBD regions by SDI from 1990 to 2021, and for 204 countries and territories by SDI in 2021. (a) ASMR and (b) ASDR for 204 countries and territories. The dots depict the estimated values in 2021. The black lines show the expected ASRs based solely on SDI. (c) ASMR and (d) ASDR globally, and in 21 GBD regions. The dots from left to right depict the estimated values for each year from 1990 to 2021. ASMR: age-standardized mortality rate; ASDR: age-standardized disability-adjusted life years rate; SDI: socio-demographic index.
At the GBD regional level, substantial heterogeneity in the burden of diarrheal diseases attributable to unsafe water was observed in 2021. South Asia and Western Sub-Saharan Africa experienced the highest absolute burden of diarrheal diseases due to unsafe water. South Asia reported deaths of 393,585.16 (95% UI: 157,173.28−697,979.92), and DALYs of 1,4067,207.04 (95% UI: 6,377,761.43−22,326,580.60), while Western Sub-Saharan Africa recorded deaths of 176,453.83 (95% UI: 101,431.92−259,136.37) and DALYs of 13,421,071.41 (95% UI: 7,793,817.58−19,283,985.98). Eastern Sub-Saharan Africa exhibited the highest ASMR of 45.28 per 100,000 population, and Western Sub-Saharan Africa exhibited the highest ASDR of 2,126.27 per 100,000 population. In contrast, Australasia and high-income North America had the lowest disease burden across both absolute numbers and age-standardized indicators (Tables 1 and 2).
At the national level, the burden varied markedly across 204 countries and territories. In 2021, India recorded the highest number of deaths (338,521), followed by Nigeria (98,102). South Sudan had the highest ASMR, reaching 130 per 100,000 population. India accounted for the highest number of DALYs (11,414,141), while Chad had the highest ASDR at 5,700 per 100,000 population. Conversely, countries such as San Marino and Andorra exhibited a very low disease burden, with values approaching zero (Fig. 4, Supplementary Tables S1 and S2).
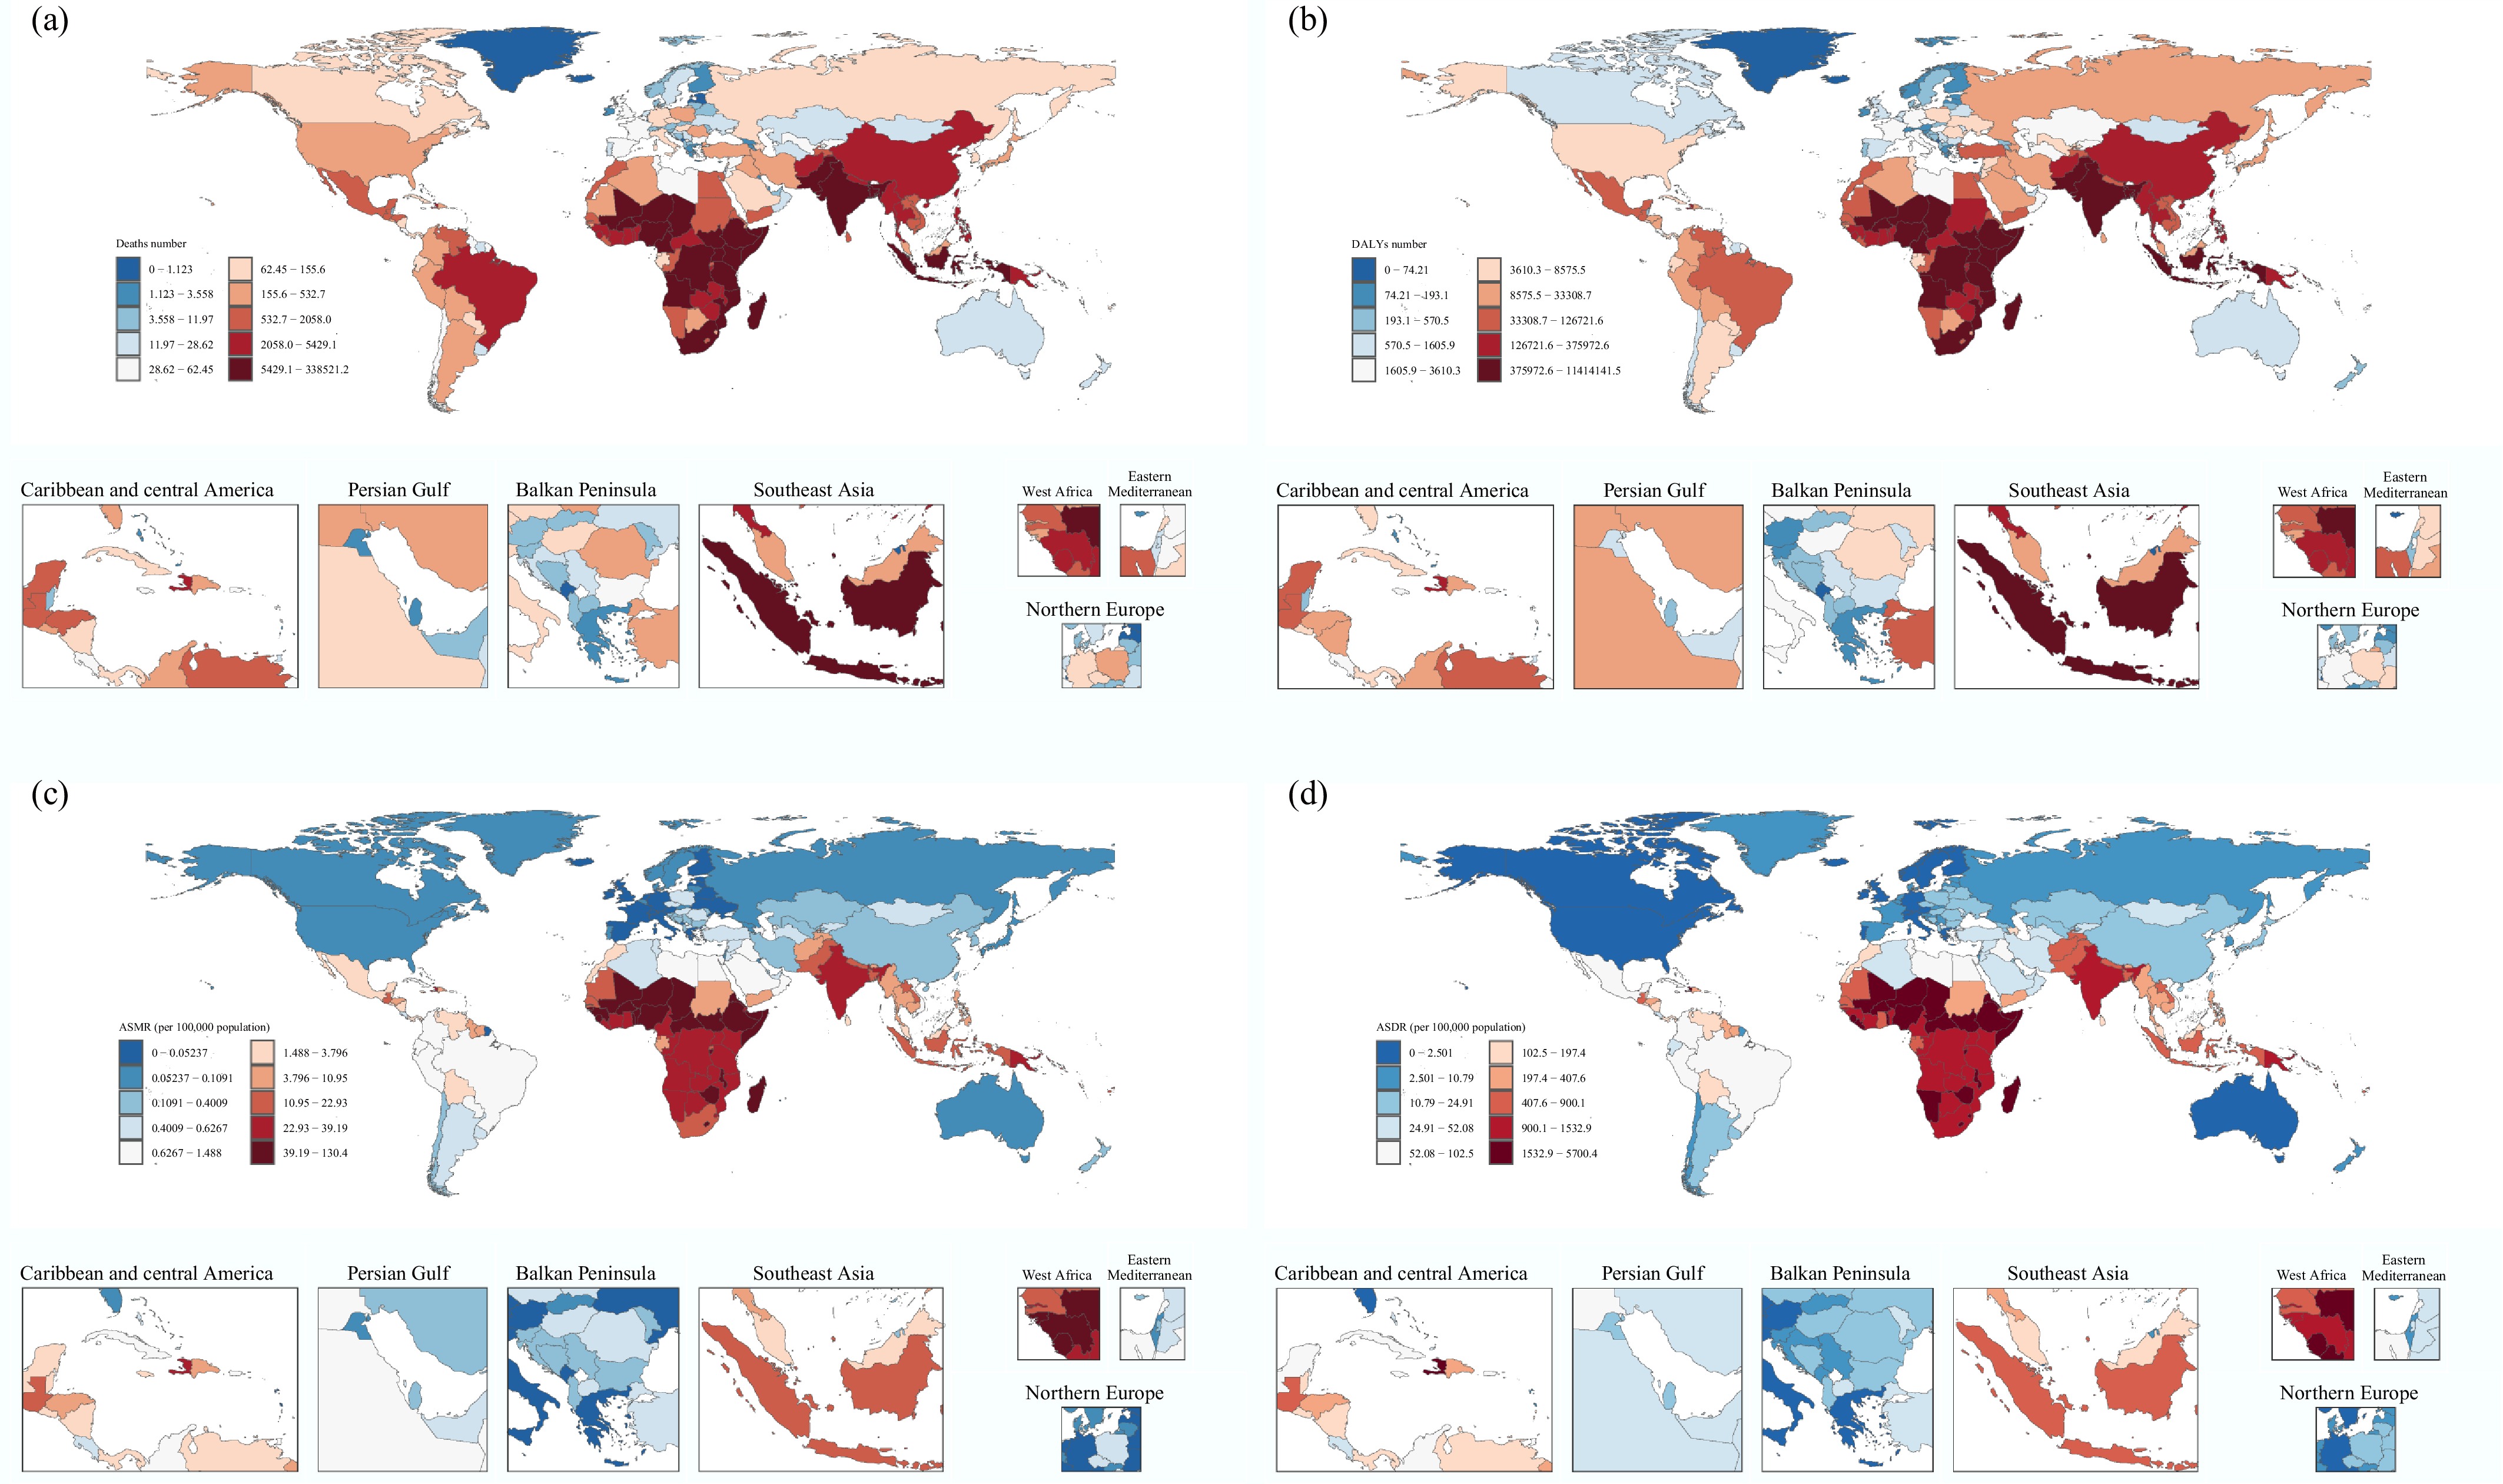
Figure 4.
The burden of diarrheal diseases attributable to unsafe water across countries and territories in 2021. (a) Deaths number; (b) DALYs number; (c) ASMR; (d) ASDR. DALYs: disability-adjusted life years rate; ASMR: age-standardized mortality rate; ASDR: age-standardized disability-adjusted life years rate.
Temporal trends in the burden of diarrheal diseases attributable to unsafe water from 1990 to 2021
-
From 1990 to 2021, the global burden of diarrheal diseases attributable to unsafe water declined substantially. The number of deaths decreased from 2,173,550.83 (95% UI: 1,265,813.61−2,913,015.18) in 1990, to 802,486.17 (95% UI: 371,672.74−1,215,503.48) in 2021, representing a 63% reduction. Over the same period, the ASMR declined by 76%. Similarly, DALYs attributable to unsafe water dropped from 142,377,712.19 (95% UI: 83,952,630.63−188,159,938.20), to 41,718,708.11 (95% UI: 21,351,085.13−57,788,563.73), corresponding to a 71% reduction, while the ASDR also fell by 76% (Tables 1 and 2). These downward trends were observed across both sexes and most age groups, although the magnitude of decline varied.
Across SDI quintile regions, most experienced consistent reductions in deaths, DALYs, ASMR, and ASDR, with particularly pronounced declines in low- and middle-SDI quintiles. However, high-SDI quintile regions showed a distinct pattern, characterized by a slight increase in the absolute number of deaths despite concurrent declines in DALYs and ASRs (Tables 1, 2 and Fig. 5). EAPC analyses further supported these temporal patterns. For ASMR, East Asia experienced the most pronounced decline (EAPC: −12.08), whereas high-income North America showed a modest increase (EAPC: 2.51). Trends in ASDR were broadly consistent with those observed for ASMR (Tables 1 and 2).
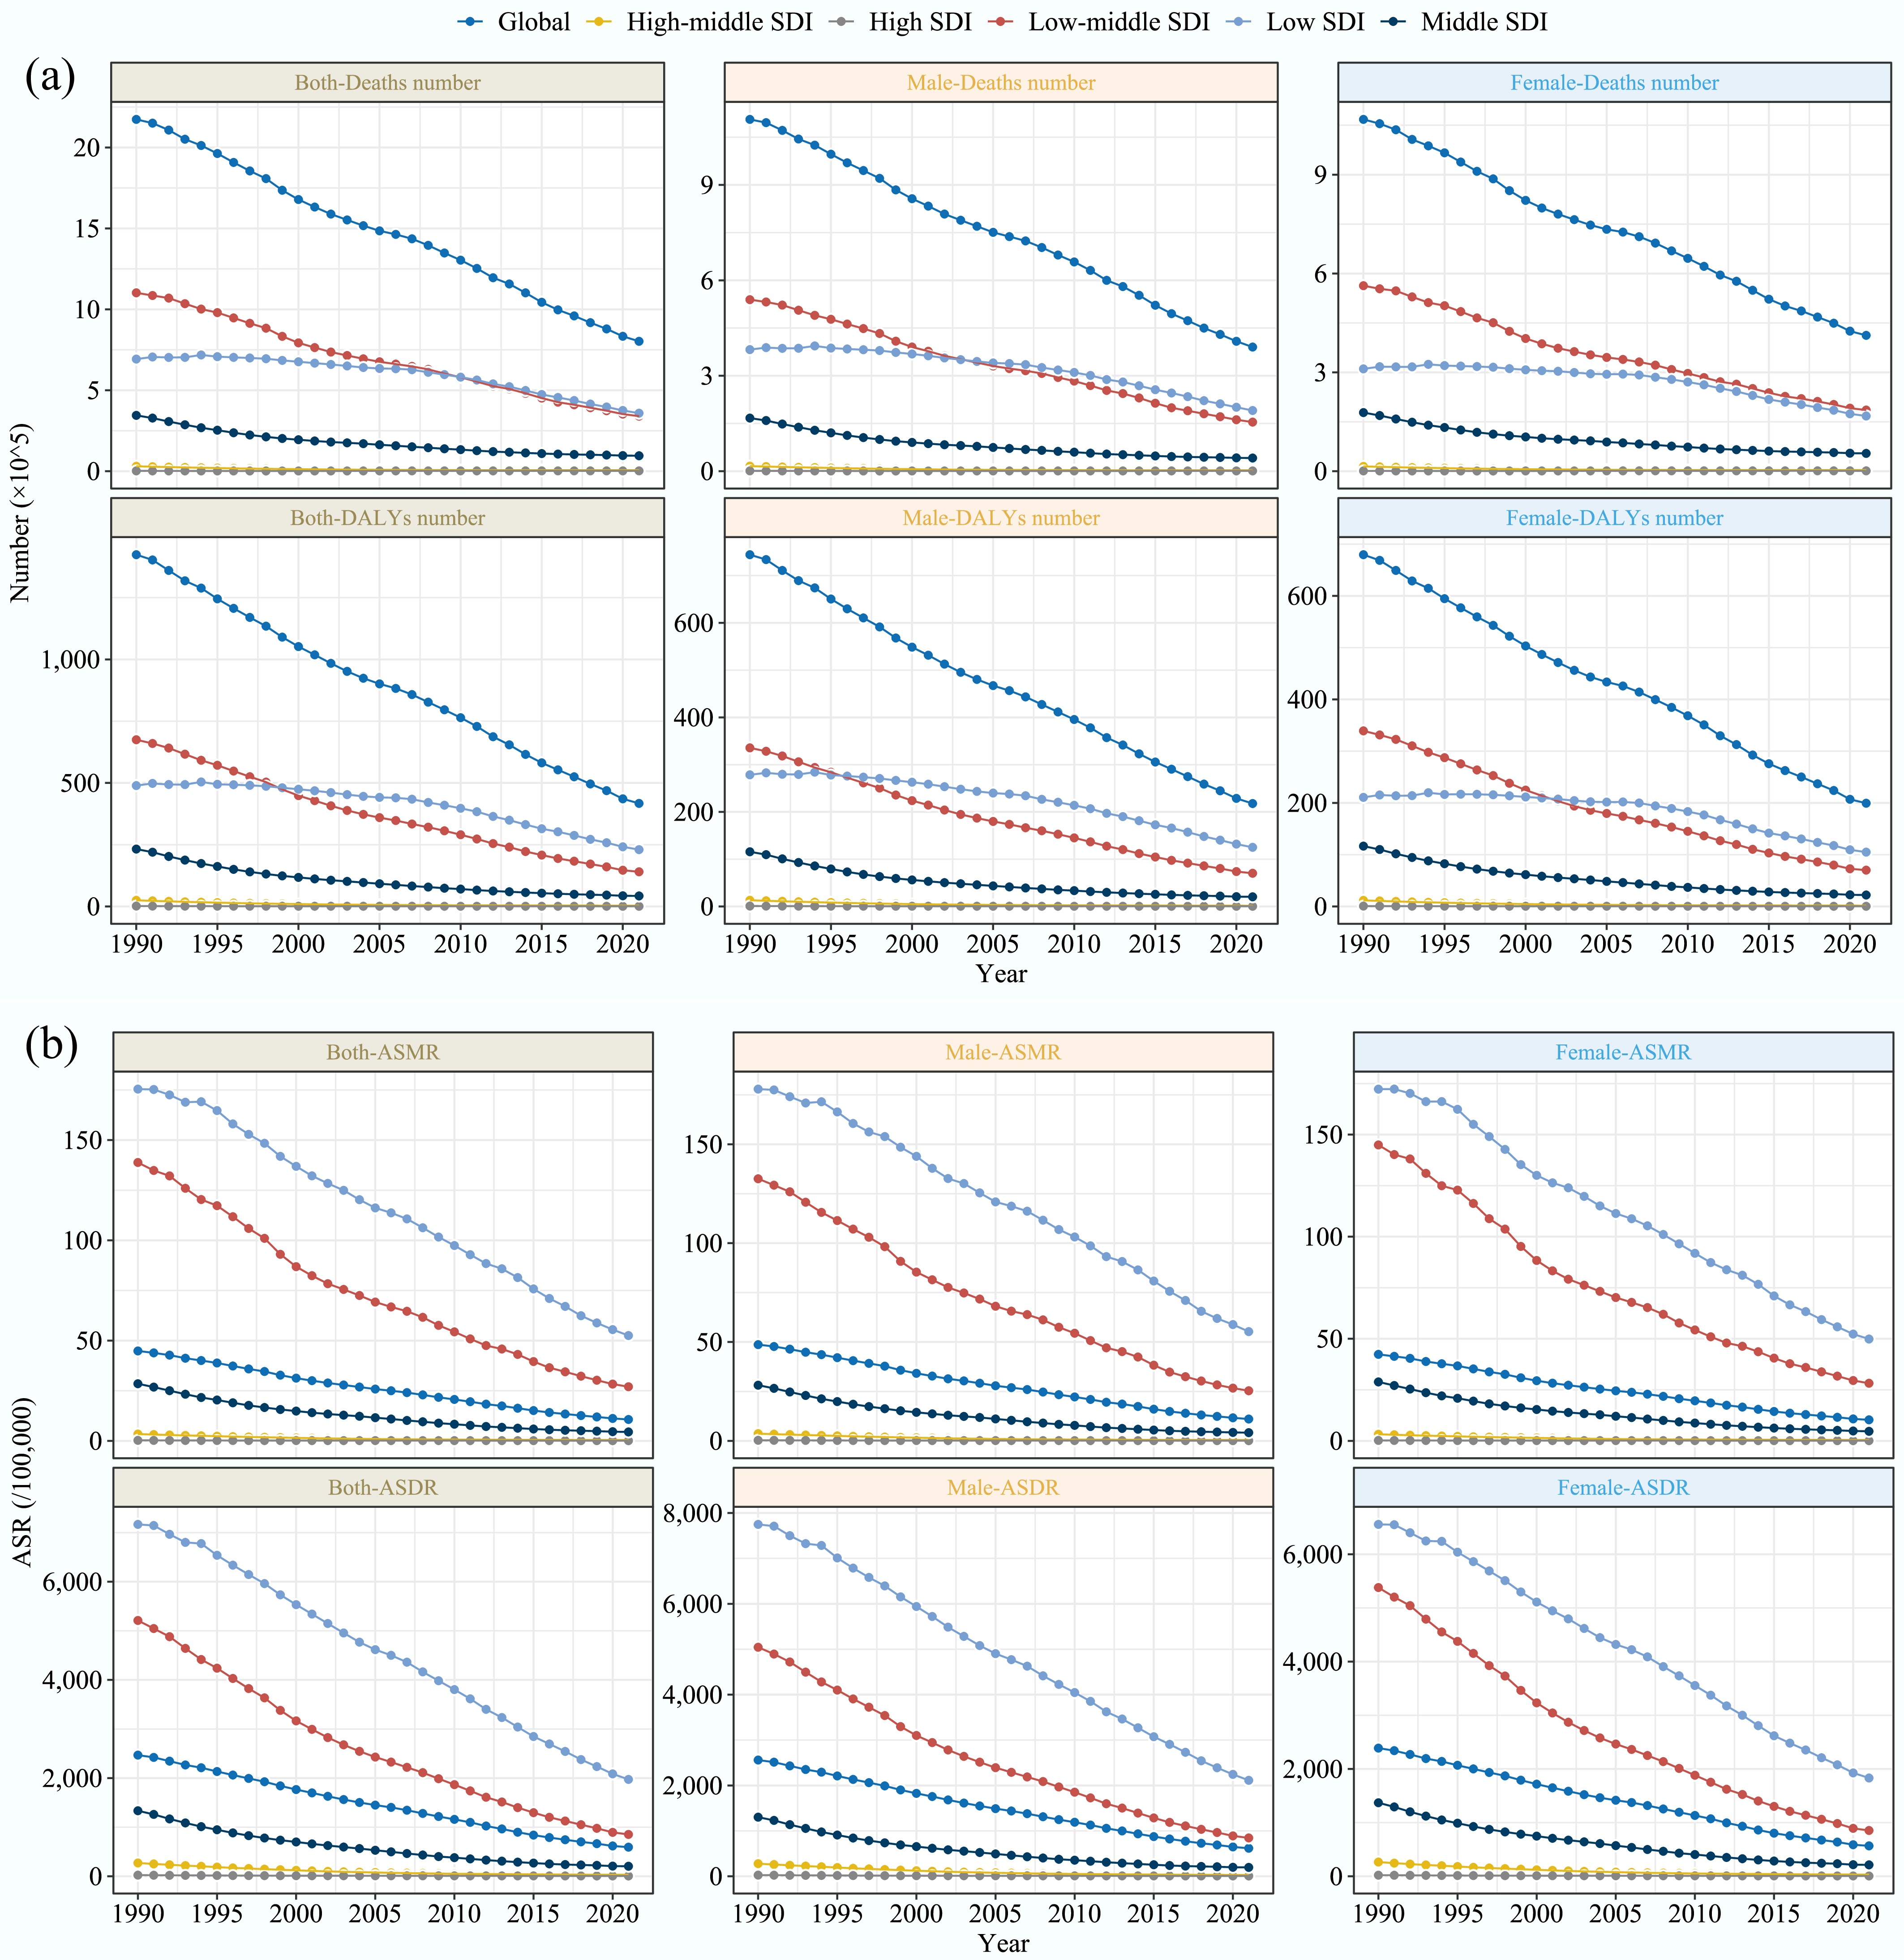
Figure 5.
Temporal trends in the burden of diarrheal diseases attributable to unsafe water globally, and different SDI quintile regions from 1990 to 2021. (a) Number of deaths and DALYs for both male and female. (b) ASMR and ASDR for both male and female. DALYs: disability-adjusted life years rate; ASMR: age-standardized mortality rate; ASDR: age-standardized disability-adjusted life years rate; SDI: socio-demographic index.
At the country level, the most substantial absolute reductions in disease burden were observed in Armenia, with deaths and DALYs decreasing by 98.95% and 98.73%, respectively. Conversely, Sweden experienced the most significant increase in disease burden, with a 1,231% rise in deaths, and a 123% increase in DALYs. Italy recorded the largest increase in ASMR (EAPC: 8.35), whereas Armenia experienced the largest decrease (EAPC: −15.06). For ASDR, the Democratic People's Republic of Korea showed the largest increase (EAPC: 2.43), while Armenia had the most significant decrease (EAPC: −13.76) (Supplementary Tables S1, S2 and Fig. 6).
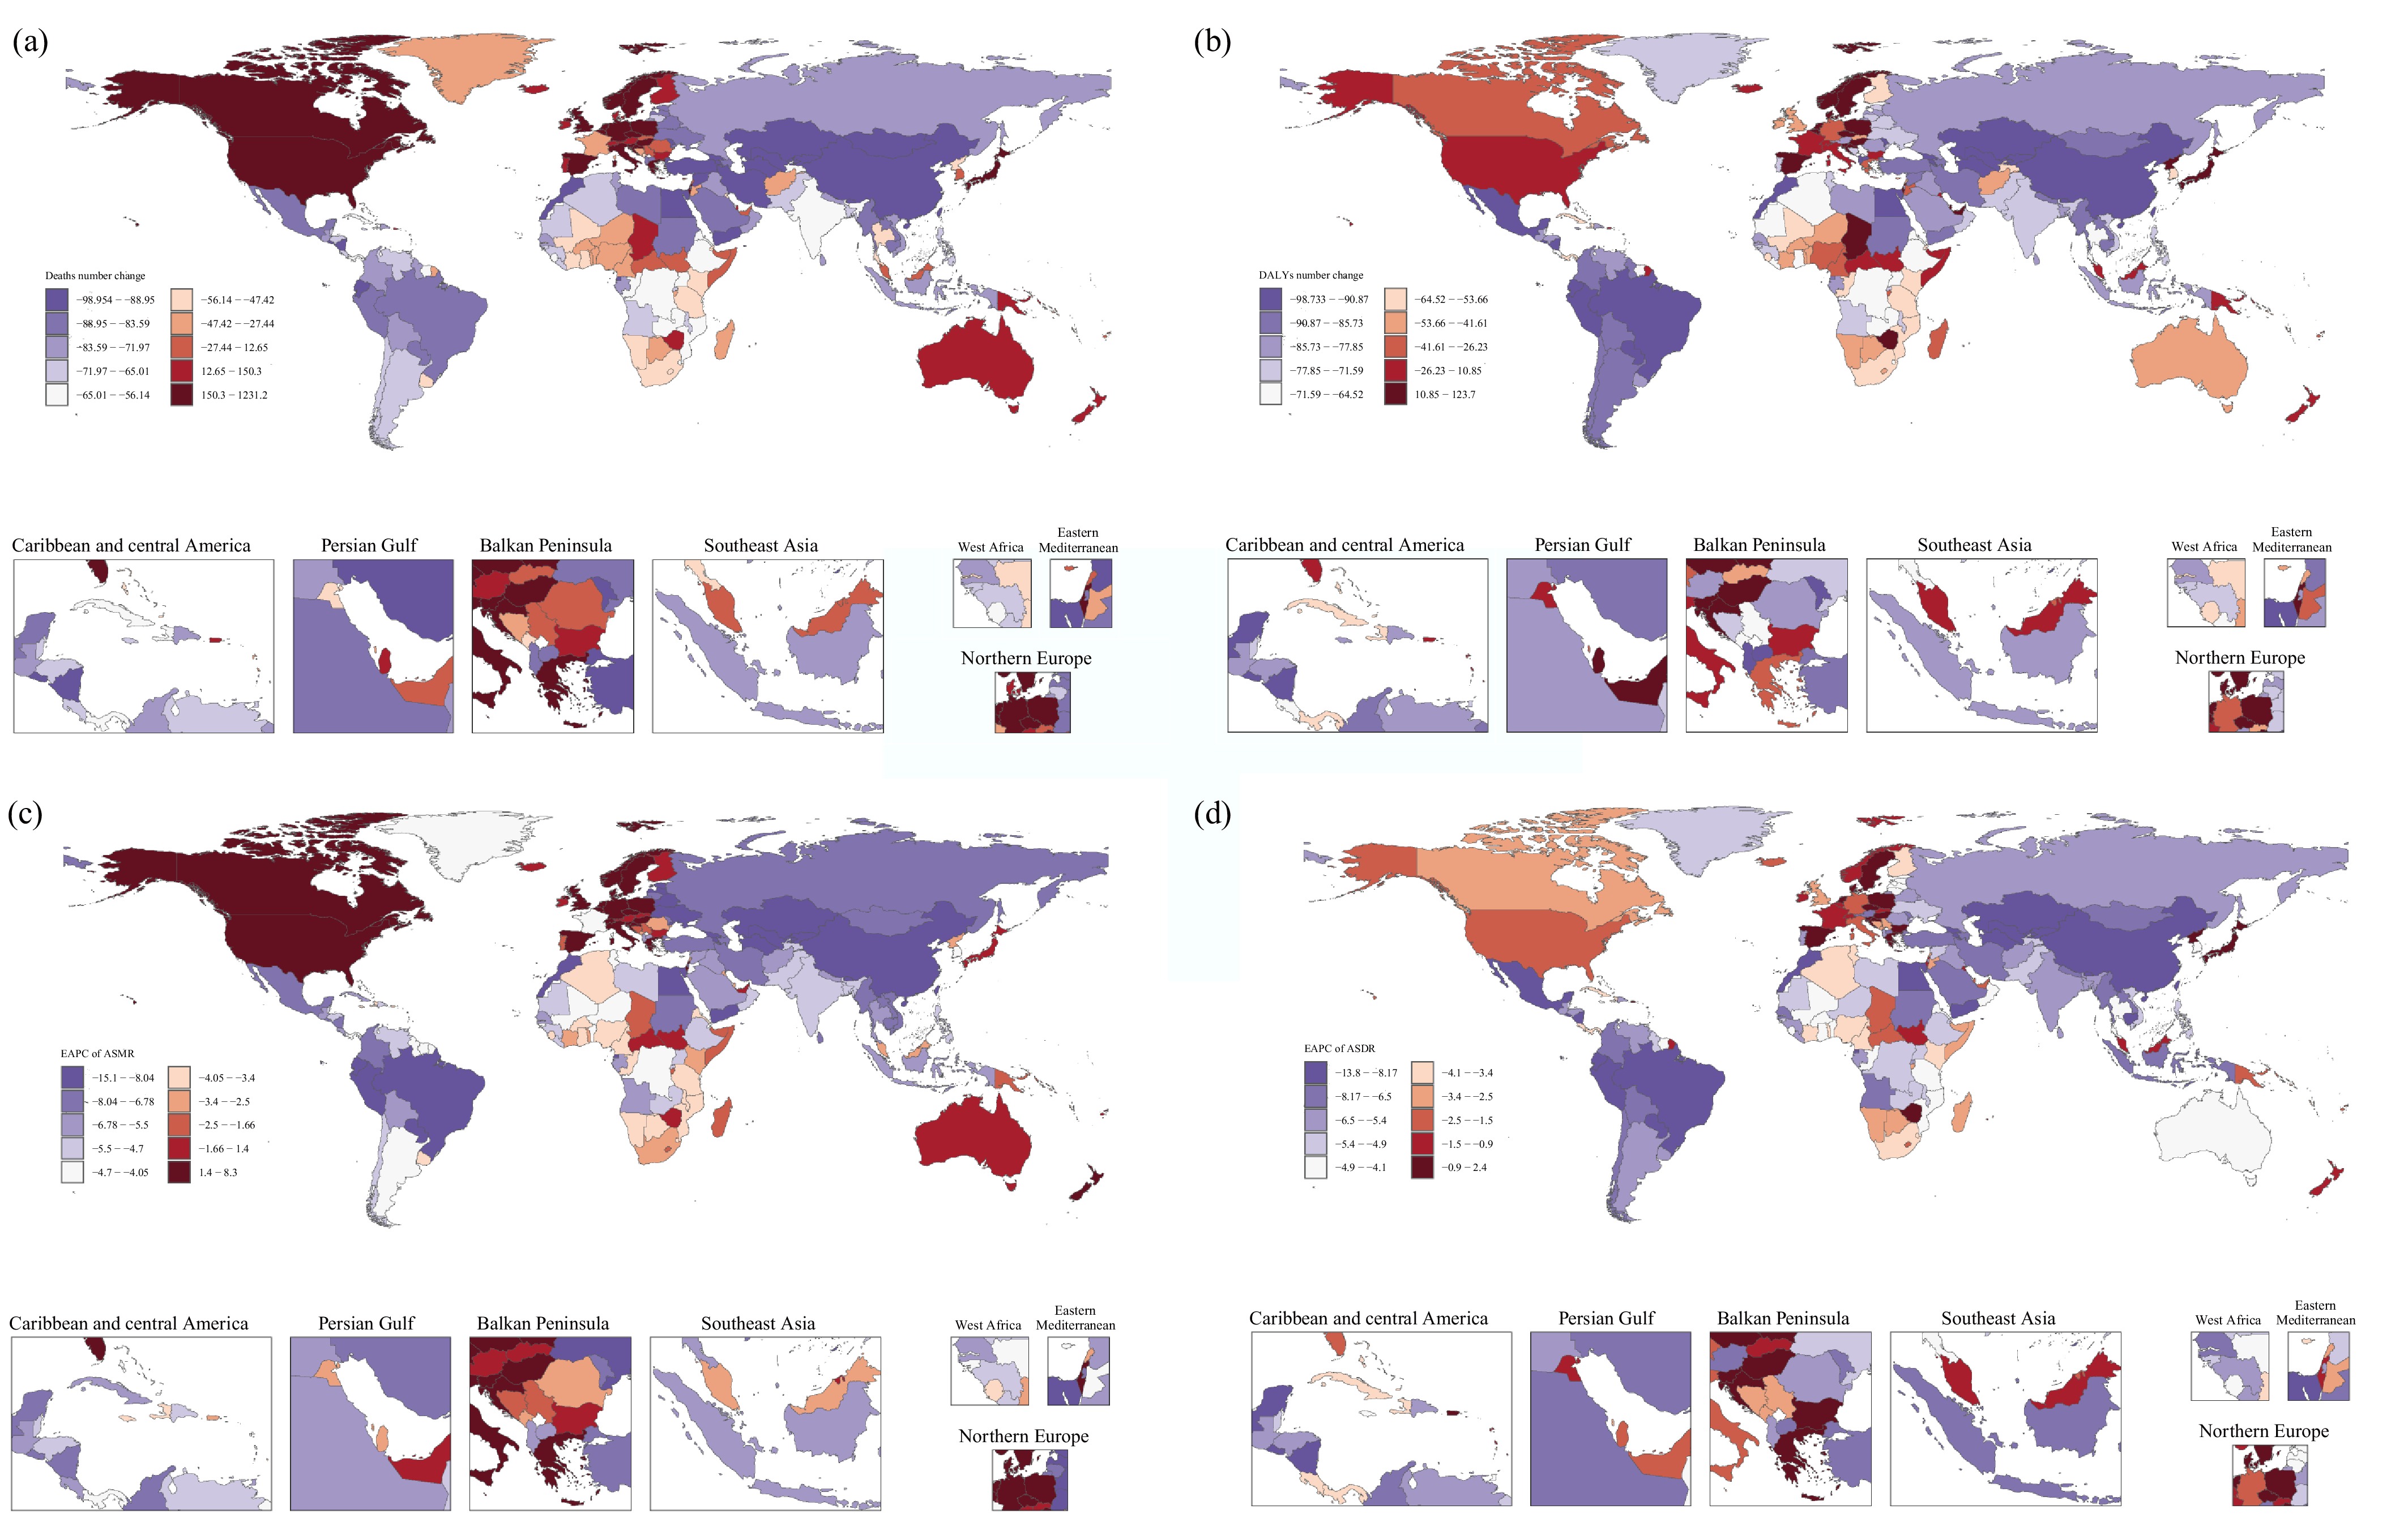
Figure 6.
The number change and EAPC of ASR for diarrheal diseases attributable to unsafe water deaths from 1990 to 2021 in 204 countries and territories. (a) Deaths number change. (b) DALYs number change. (c) EAPC of ASMR. (d) EAPC of ASDR. EAPC: estimated annual percentage change; ASR: age-standardized rate; ASMR: age-standardized mortality rate; ASDR: age-standardized disability-adjusted life years rate.
Frontier analysis of the association between ideal burden of diarrheal diseases attributable to unsafe water, and SDI
-
We used a frontier analysis to estimate the ideal annual burden of diarrheal diseases attributable to unsafe water for each country, accounting for each country's SDI. For ASMR, countries with low SDI values closest to the frontier line were highlighted in blue, indicating they were closer to the ideal burden scenario. In contrast, countries with high SDI values that were farthest from the frontier line were marked in red, signaling a divergence from the ideal burden. Additionally, the 15 countries most distant from the frontier line across all SDI levels were labeled in black. High SDI countries such as Japan and the Republic of Korea demonstrated a disease burden more aligned with the ideal scenario, reflecting effective management and control measures. On the other hand, African countries such as South Sudan and Chad exhibited a significant potential for improvement, as their actual burdens were far above the ideal (Fig. 7a and Supplementary Table S3). The analysis of ASDR corroborated these findings, further highlighting the disparity and potential for targeted interventions (Fig. 7b and Supplementary Table S4).
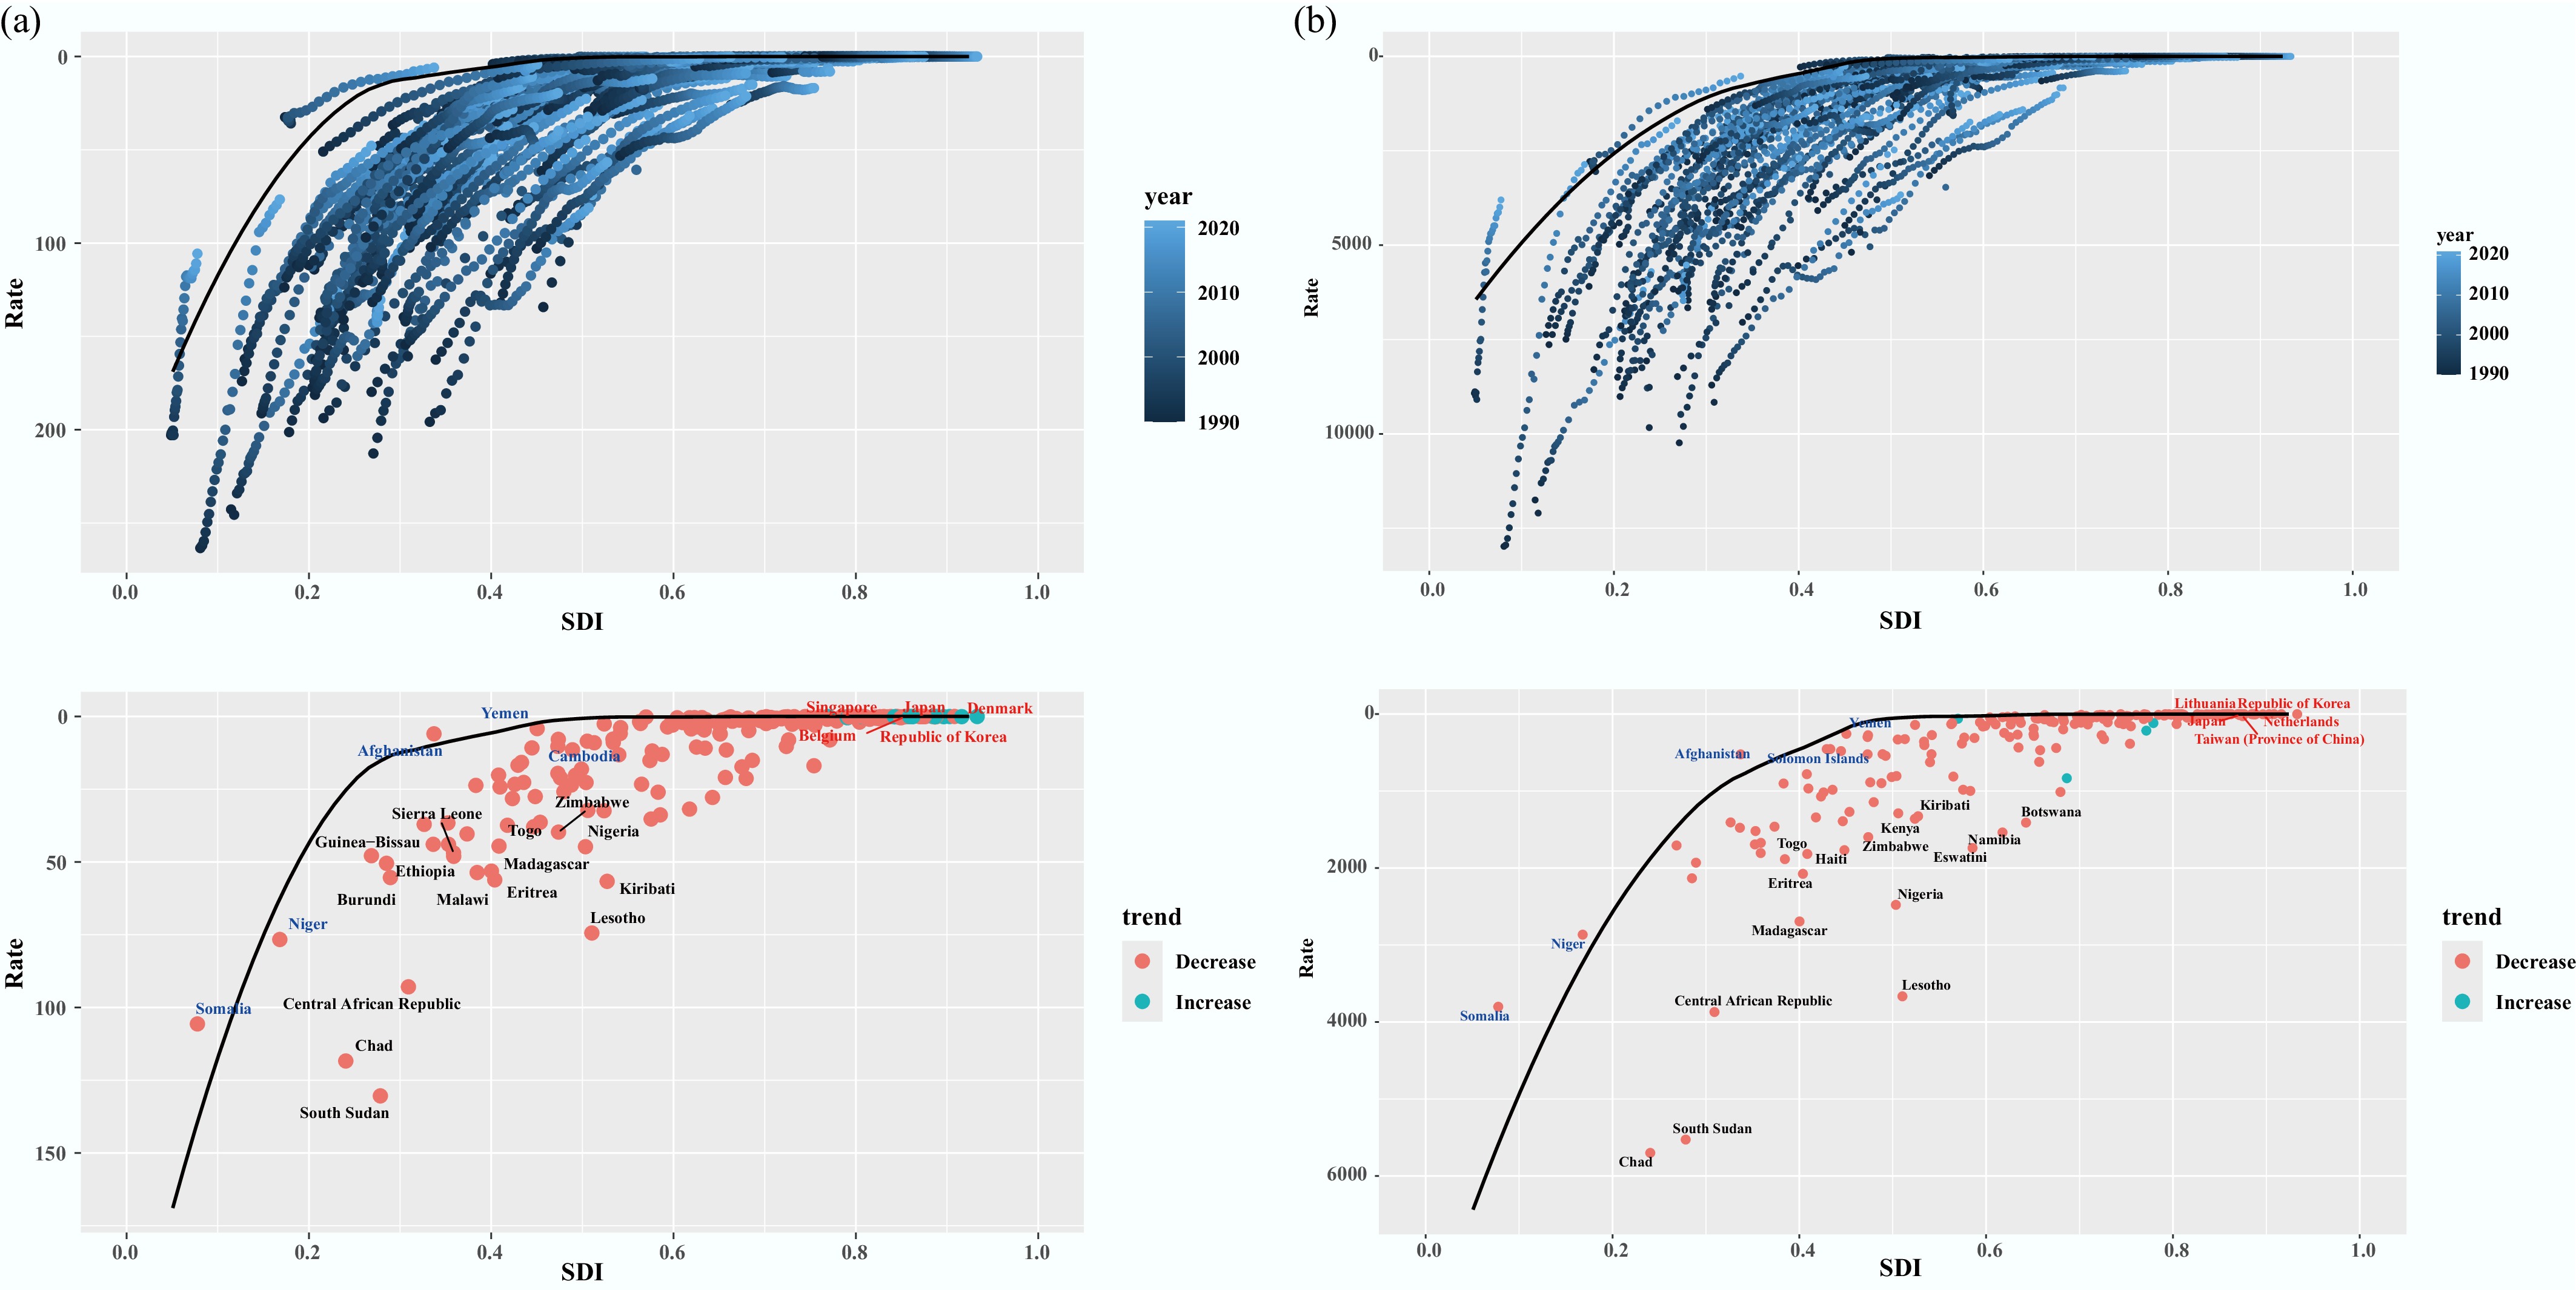
Figure 7.
Frontier analysis based on SDI and the burden of diarrheal diseases attributable to unsafe water from 1990 to 2021. (a) ASMR. (b) ASDR. ASMR: age-standardized mortality rate; ASDR: age-standardized disability-adjusted life years rate; SDI: socio-demographic index.
Prediction of diarrheal disease burden attributable to unsafe water
-
Using the BAPC model, the burden of diarrheal diseases attributable to unsafe water from 2022 to 2035 is projected. Overall, the projections indicated a continued decline in total deaths and DALYs, as well as in ASMR and ASDR (Fig. 8). However, age-specific analyses revealed a distinct pattern in the oldest age groups. Specifically, among individuals aged 95 years and older, the absolute number of deaths and DALYs was projected to increase, despite a gradual decline in the rate of deaths and DALYs across all age groups (Supplementary Figs S1 and S2). This apparent divergence might reflect demographic effects rather than worsening age-specific risk, as rapid population ageing at advanced ages increases the population at risk, leading to higher absolute counts even as age-specific rates continue to improve.
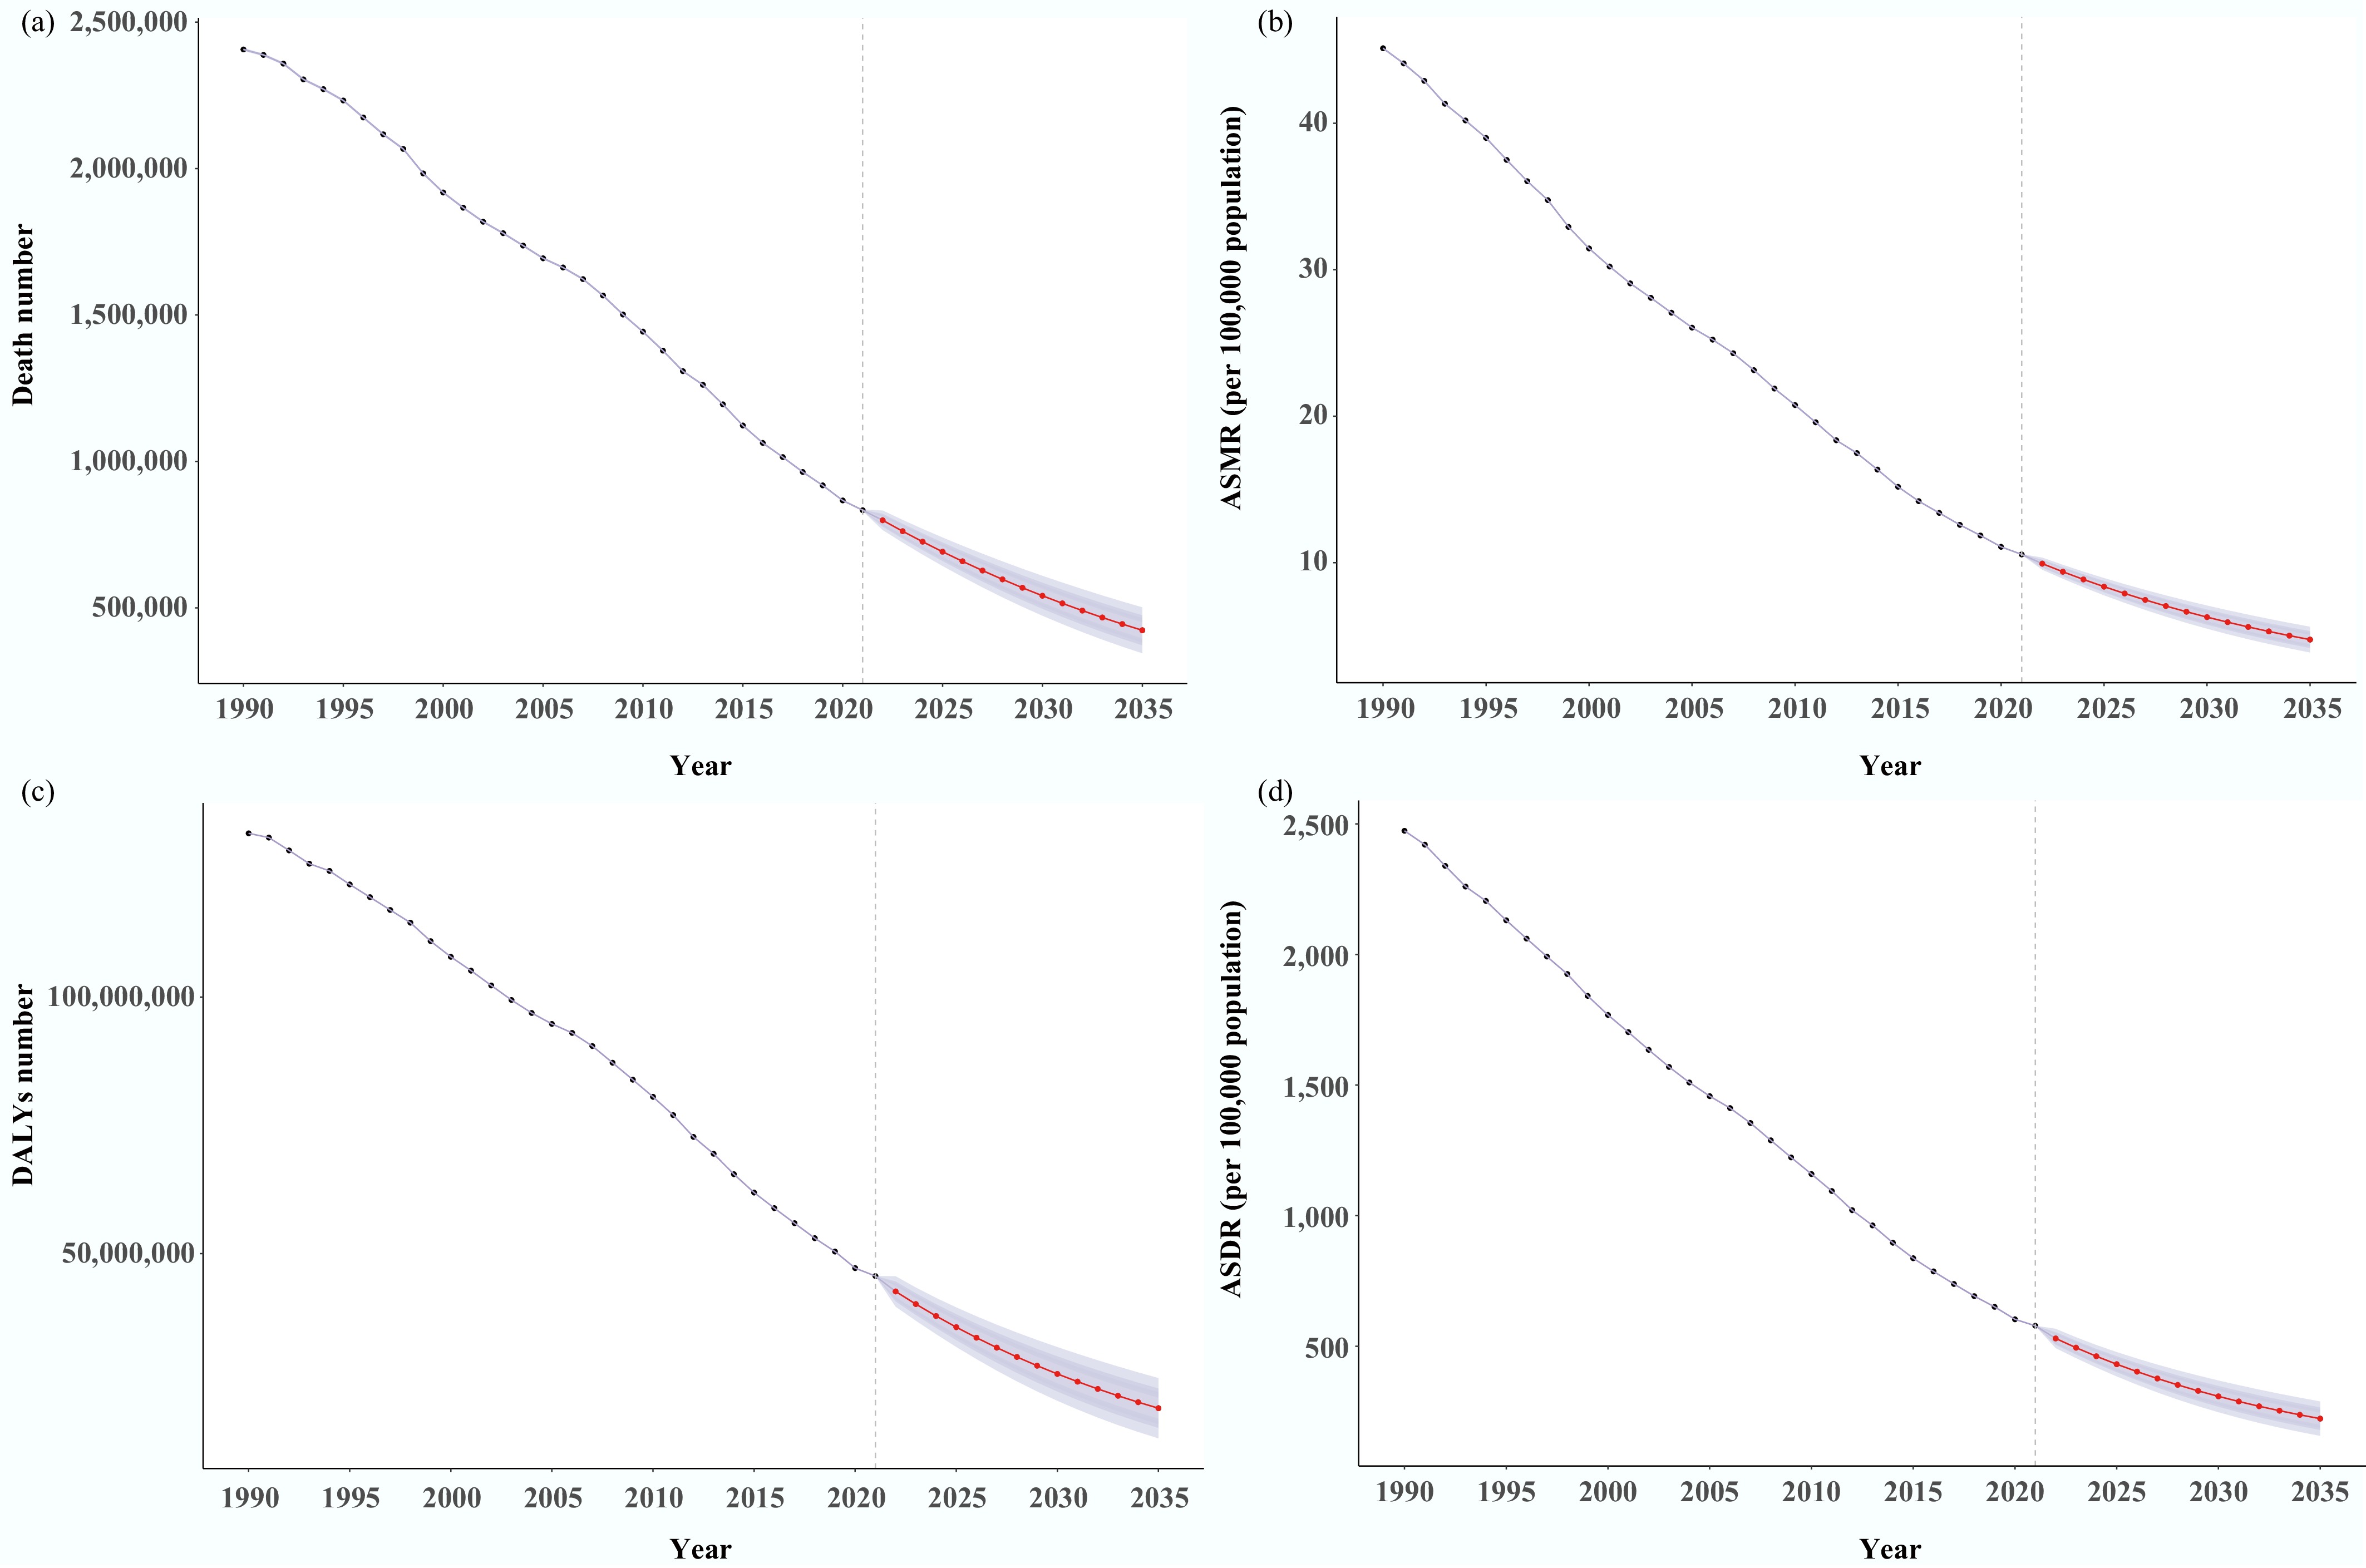
Figure 8.
The predicted global burden of diarrheal diseases attributable to unsafe water from 2022 to 2035 of the BAPC model. (a) Deaths number. (b) DALYs number. (c) ASMR. (d) ASDR. BAPC: Bayesian Age-Period-Cohort; DALYs: disability-adjusted life years rate; ASMR: age-standardized mortality rate; ASDR: age-standardized disability-adjusted life years rate.
-
This study comprehensively analyses the burden of diarrheal diseases attributable to unsafe water across 21 GBD regions and 204 countries from 1990 to 2021, marking the first time this issue has been extracted and analyzed from GBD 2021 data. Our findings indicate a year-on-year decline in the associated disease burden; however, unsafe water sources continue to exert a significant global impact, particularly in low- and low-middle SDI quintile regions such as Asia and Africa. Significant differences in disease burden were observed across sex, age, SDI quintile regions, GBD regions, and countries. Projections suggest a continued decline in disease burden in the coming years. While some previous studies have addressed the impact of unsafe water on diarrheal diseases, most have been region-specific[16,17]. It has been shown that access to high-quality drinking water can reduce the risk of diarrheal disease by 52%[11]. Pathogens such as bacteria and parasites in unsafe water can proliferate in the host's intestinal tract, leading to diarrheal diseases upon ingestion[18]. Additionally, unsafe water exacerbates gastrointestinal inflammation and compromises immunity, potentially leading to further declines in gastrointestinal function[19]. The observed decrease in the burden of diarrheal diseases from 1990 to 2021 may be attributed to efforts by international organizations and governments, which have increasingly invested in improving water quality and sanitation[20]. Investments in water and sewerage infrastructure have improved access to safe piped water, particularly in urban areas[21]. This underscores the need for continued investment and international cooperation in water security and sanitation infrastructure.
The slightly higher burden of diarrheal diseases attributable to unsafe water observed among males may reflect a combination of behavioral, occupational, and biological factors. In many settings, males are more likely to engage in outdoor or labor-intensive occupations, such as agriculture, construction, or informal work, which may increase exposure to unsafe water sources and contaminated environments. Behavioral differences, including lower healthcare-seeking behavior and delayed treatment, may further contribute to higher disease severity and mortality. In addition, sex-based differences in immune responses have been reported, with males exhibiting relatively weaker immune responses to certain infectious diseases, potentially increasing susceptibility and adverse outcomes.
Young children are disproportionately affected by waterborne diarrheal diseases. Their susceptibility stems from two key factors: immature immune systems[22], and poor hand hygiene practices, which increases the risk of pathogen transmission from unsafe water sources[23]. Additionally, a lack of education and awareness about water safety in some communities may leave parents uncertain about how to ensure water safety or recognize unsafe water[24]. Beyond the immediate effects of dehydration and acute infection, repeated or severe diarrheal episodes during early childhood can impair nutrient absorption, disrupt gut integrity, and contribute to growth faltering and undernutrition. These processes are closely linked to delayed cognitive development through mechanisms such as chronic inflammation, micronutrient deficiencies, and altered brain development during critical periods[10,25]. Prolonged and persistent diarrheal diseases can lead to severe dehydration, which greatly increases the risk of child mortality. As demographic changes reduce the number of children, it becomes increasingly important to invest in each child's basic living conditions. Thus, global policies should be tailored to prioritize children's health and safety, particularly during early childhood.
While socio-demographic development plays a central role in shaping the burden of diarrheal diseases attributable to unsafe water, the observed disparities across regions and countries are likely mediated through more specific and tangible determinants. In particular, the status of basic drinking water infrastructure, including access to safely managed water services and the extent of piped water supply coverage appears to be a critical underlying factor. Our analysis revealed a significant negative correlation between SDI and the burden of diarrheal diseases attributable to unsafe water sources. The highest disease burden remains in less developed countries such as Asia and Africa, likely due to differences in economic development, health infrastructure, public health policies, and education levels[26]. In low- and low-middle SDI quintile regions, limited investment in centralized water systems, inadequate protection of water sources, and low household-level access to improved water infrastructure substantially increase population exposure to unsafe water. Urban-rural disparities in pipeline coverage further exacerbate these risks, as rural populations often rely on unimproved or intermittently available water sources.
Conversely, higher SDI regions typically have more resources to invest in infrastructure, and near-universal access to piped water and improved sanitation has substantially reduced exposure at the population level. However, residual disease burden may persist due to aging infrastructure, localized system failures, or inequities affecting vulnerable subpopulations, rather than solely due to broad economic development deficits. The increase in the absolute number of deaths in some high-SDI regions was observed, such as high-income North America. First, population aging plays a critical role, as older adults are more vulnerable to severe outcomes of diarrheal diseases, even at low exposure levels[27]. As life expectancy increases in high-SDI settings, a growing elderly population may contribute to higher death counts despite declining ASMR. Second, the presence of vulnerable subpopulations may partly explain the residual and increasing mortality burden. These groups may be at heightened risk of waterborne infections and related complications. In addition, improved diagnostic capacity and surveillance in high-income settings may increase recognition of enteric infections in older adults. Finally, changes in diagnostic practices, surveillance systems, and cause-of-death coding over time may also influence the observed trends. Improved reporting accuracy and greater attribution of deaths to specific causes in recent years could contribute to apparent increases in recorded deaths without reflecting a true rise in underlying risk. Together, these factors suggest that increases in death counts in high-SDI quintile regions likely reflect demographic and methodological influences, rather than worsening population-level exposure to unsafe water.
The extreme trends observed in certain countries, such as the substantial decline in Armenia and the marked increase in Sweden, likely reflect a combination of contextual, policy-related, and data-related factors, rather than isolated changes in water safety alone. In Armenia, the pronounced reduction in deaths and DALYs may be partly attributable to improvements in drinking water quality and sanitation infrastructure, strengthened public health systems, and broader socioeconomic stabilization, which may have accelerated declines from relatively high baseline levels in the early 1990s. In contrast, a large relative increase was observed in Sweden. This pattern may reflect a very low baseline burden in earlier years, making relative changes highly sensitive to small, absolute increases. In addition, demographic aging, increased recognition of vulnerable subpopulations, and improvements in disease surveillance and cause-of-death attribution may have contributed to higher recorded counts without indicating a true deterioration in water safety.
Frontier analysis suggested that countries with smaller gaps to the frontier could consider reducing economic investment in sanitation and rationalizing the allocation of resources, while countries with larger gaps should further designate better public sanitation policies, including strict drinking water standards and extensive health education programs, to effectively increase the population's awareness of water safety and self-protection[2,28]. Thus, with the increase in SDI, the implementation of integrated socioeconomic development and public health measures significantly reduced the burden of diarrheal diseases attributable to unsafe water, highlighting the critical role of economic development, optimized education, enhanced infrastructure, and strengthened public health policies in controlling and preventing disease[11]. Furthermore, frontier analysis provided important insights for tailoring policy interventions according to countries' relative distance from the SDI-based efficiency frontier.
For countries located far from the frontier, particularly in low- and low-middle SDI quintile regions, the excess burden likely reflected fundamental structural gaps in access to safe drinking water and basic sanitation[29]. These gaps may include limited access to piped and safely managed drinking water, inadequate protection of surface and groundwater sources, insufficient water treatment capacity, and heavy reliance on unimproved or intermittently available water sources, particularly in rural areas. In these settings, priority should be given to large-scale infrastructure investment, including expanding piped water supply, improving sanitation facilities, and protecting water sources. In parallel, household water filtration, chlorination and safe water storage can provide immediate health benefits where centralized infrastructure remains limited[20]. Strengthening public health education on hygiene practices and water safety is also essential to reduce exposure risks[5].
In contrast, countries located close to the frontier had largely minimized the burden achievable at their current level of development. In these settings, the remaining disease burden is more likely attributable to limitations in system efficiency, rather than broad infrastructure deficits. Further reductions may therefore depend on measures such as enhanced water quality monitoring, early-warning systems for contamination events, rapid outbreak detection and response, and refined risk-based regulation of drinking water systems, particularly for vulnerable subpopulations. Together, these findings suggest that a differentiated policy approach will be essential for achieving equitable and sustainable reductions in the global burden of diarrheal diseases attributable to unsafe water.
Our projections indicated that the burden of diarrheal diseases attributable to unsafe water was likely to continue declining from 2022 to 2035, largely reflecting sustained improvements in public health systems, medical care, and access to safer water sources. The projections to 2035 assume continuity of past trends, and unexpected changes in climate conditions, policy priorities, or large-scale interventions could alter future trajectories. Emerging evidence suggests that climate change and rapid urbanization may pose additional challenges to further reductions in diarrheal diseases attributable to unsafe water. According to recent IPCC assessments, climate-related extremes, such as flooding and drought, can disrupt water supply systems and degrade source water quality, while the World Health Organization has highlighted that rapid urbanization may increase exposure to unsafe drinking water and waterborne diseases[30,31].
Nevertheless, several limitations should be acknowledged. First, as an ecological analysis based on aggregate-level data, this study is subject to the risk of ecological fallacy, and population-level associations may not reflect individual-level relationships between unsafe water exposure, and diarrheal disease outcomes. Second, residual confounding cannot be fully excluded. In particular, concurrent health interventions may have influenced diarrheal disease burden independently of changes in water safety, such as improvements in healthcare access, vaccination coverage, nutrition, or hygiene promotion. Third, the GBD-defined 'unsafe water' risk factor may partially overlap with other water, sanitation, and hygiene-related risks. Although GBD applies standardized methods to minimize double-counting, some uncertainty remains in attributing the exact proportion of disease burden to unsafe water alone.
-
In conclusion, this study demonstrates the significant global burden of diarrheal diseases attributable to unsafe water sources, with the greatest impact observed in regions with low economic development, despite a downward trend in recent decades. This persistent public health challenge underscores the necessity for robust water quality monitoring and sanitation improvements. These interventions are essential not only for reducing the burden of diarrheal diseases, but also for advancing broader global health and wellbeing. By integrating frontier analysis and long-term projections, the findings indicate that substantial reductions in diarrheal disease burden remain attainable, particularly in high-burden countries. Sustained policy commitment and infrastructure investment will be essential to maintain the projected downward trend through 2035.
We thank the staff of the Institute for Health Metrics and Evaluation and its collaborators.
-
It accompanies this paper at: https://doi.org/10.48130/biocontam-0026-0002.
-
Not applicable.
-
The authors confirm their contributions to the paper as follows: Lichun Qiao: writing − original draft, data curation. Liangjia Wang: conceptualization. Shaoteng Shi: writing − original draft, methodology. Ping Wan: software. Miaoqian Li and Ziyi Zheng: visualization. Qingsong Li: visualization. Xiongbo Liu: methodology. Yingjie Cai: visualization. Hejia Wan: resources. Jing-Xuan Zhou: writing − review and editing. All authors reviewed the results and approved the final version of the manuscript.
-
The data that support the findings of this study are publicly available from http://ghdx.healthdata.org/gbd-results-tool.
-
This work was supported by the project of the Environmental Science Academy of Shaanxi Province (Grant No. 202208146).
-
The authors declare that they have no known competing financial interests or personal relationships that could influence the work reported in this study.
-
# Authors contributed equally: Lichun Qiao, Liangjia Wang, Shaoteng Shi
Full list of author information is available at the end of the article. - The supplementary files can be downloaded from here.
- Copyright: © 2026 by the author(s). Published by Maximum Academic Press, Fayetteville, GA. This article is an open access article distributed under Creative Commons Attribution License (CC BY 4.0), visit https://creativecommons.org/licenses/by/4.0/.
-
About this article
Cite this article
Qiao L, Wang L, Shi S, Wan P, Li M, et al. 2026. Global burden of diarrheal diseases attributable to unsafe water: an analysis from 1990 to 2021 in the Global Burden of Disease study. Biocontaminant 2: e005 doi: 10.48130/biocontam-0026-0002 

Global burden of diarrheal diseases attributable to unsafe water: an analysis from 1990 to 2021 in the Global Burden of Disease study
- Received: 05 November 2025
- Revised: 08 February 2026
- Accepted: 04 March 2026
- Published online: 25 March 2026
Abstract: Diarrheal diseases pose a significant public health challenge worldwide, with contaminated water sources being a major category of causes, leading to increased morbidity and mortality. This study aimed to systematically assess the burden of diarrheal diseases caused by unsafe water worldwide, providing a scientific basis for the development of global and regional public health policies. This study used the Global Burden of Disease 2021 database, which includes data on diarrheal disease deaths and disability-adjusted life years (DALYs), across 204 countries and territories. Estimated annual percentage change was used to quantify trends in age-standardized rates from 1990 to 2021; frontier analysis was used to assess the potential for reducing the burden of disease across countries, and Bayesian age-period-cohort (BAPC) modeling was used to project the burden of disease from 2022 to 2035. In 2021, diarrheal diseases attributable to unsafe water resulted in 802,486 deaths, and 41,718,708 DALYs globally, with the greatest burden observed in low social development index (SDI) quintiles. Since 1990, there has been a decline in the burden, marked by a 63% reduction in deaths, and a 71% reduction in DALYs. Despite this progress, Sub-Saharan Africa and South Asia remain regions of high disease prevalence, with substantial potential for further improvement. Projections using BAPC modeling suggest that the burden of disease will continue to decline through 2035. Nevertheless, a high burden of disease persists in regions with low SDI quintiles. To achieve equitable global health development, countries must strengthen infrastructure and set long-term development goals.
-
Key words:
- Diarrheal diseases /
- Unsafe water /
- Disease burden /
- Socio-demographic indexes