-
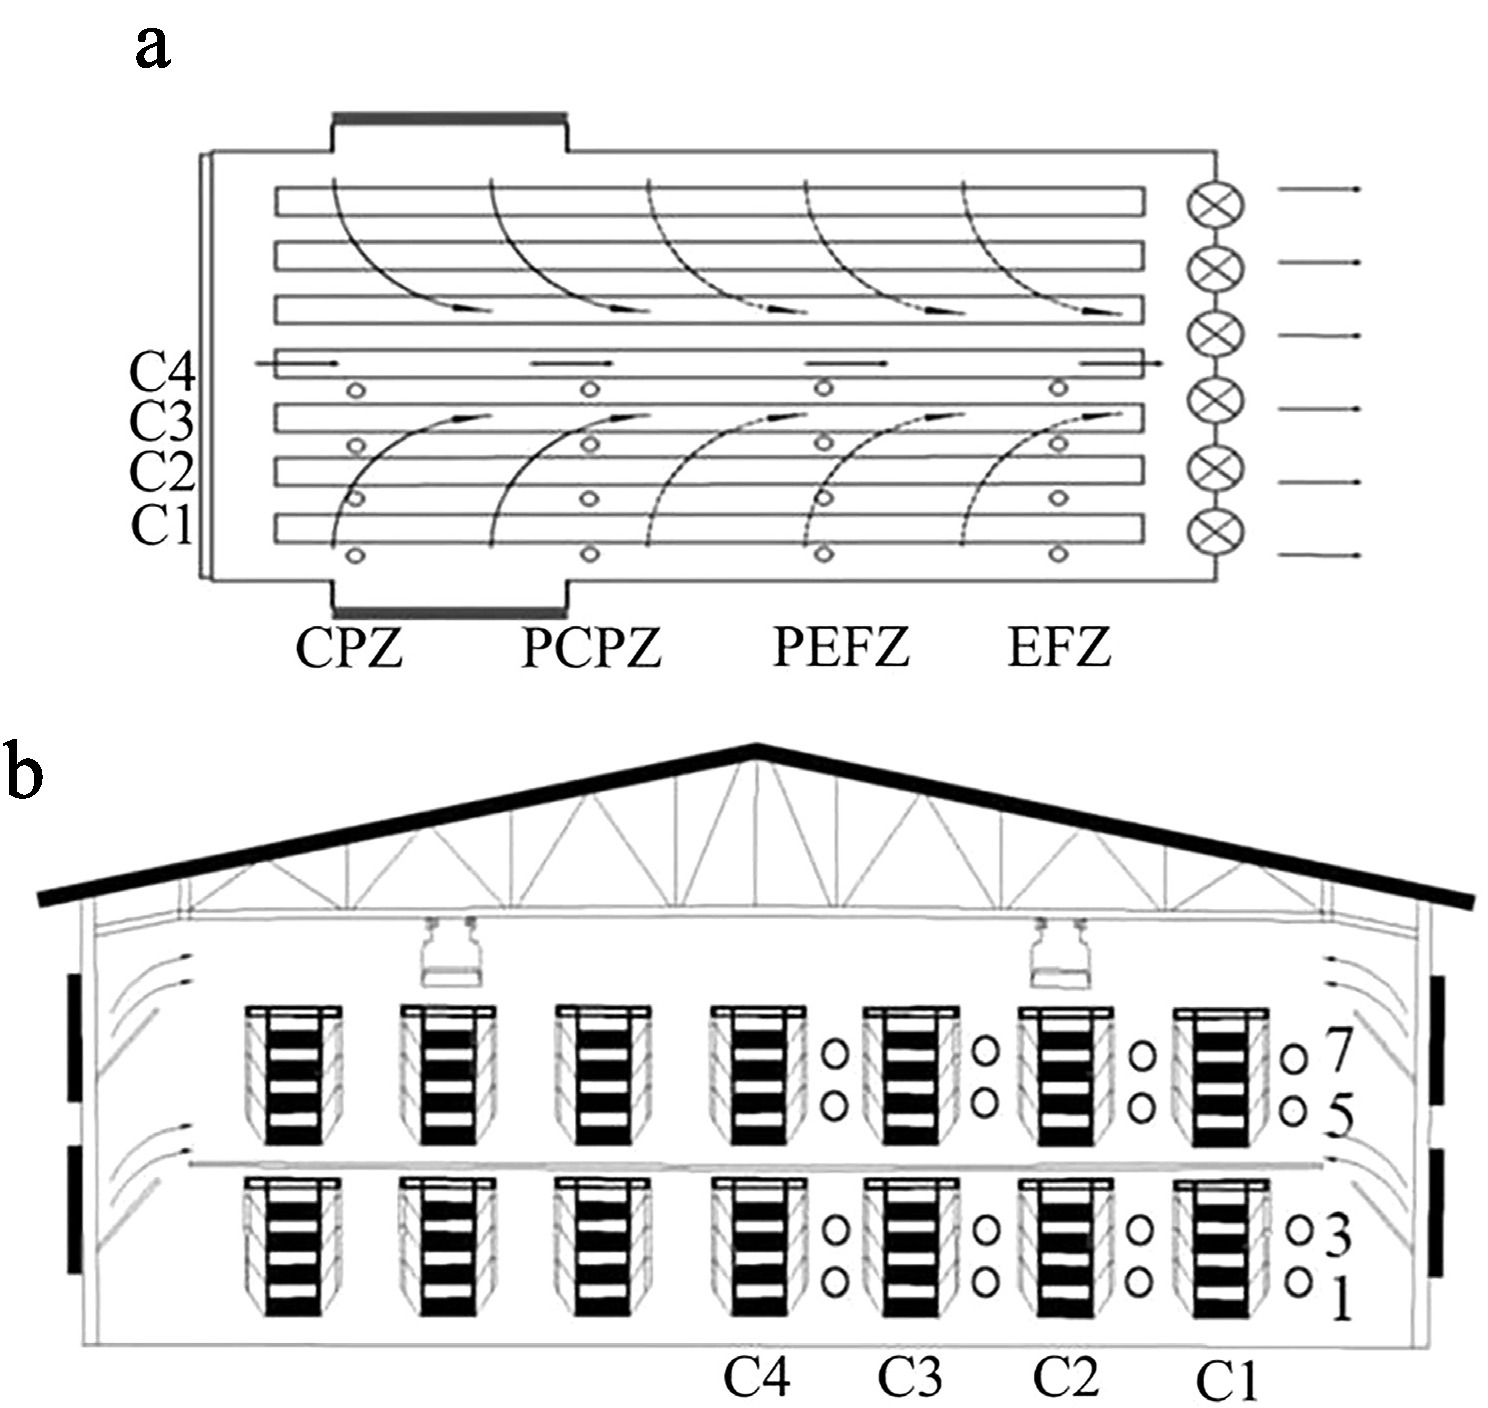
Figure 1.
Spatial layout of measurement locations. (a) Cages numbered 22 to 24 were assigned to the cooling pad zone (CPZ); Cages 67 to 69 represented the proximal cooling pad zone (PCPZ). Similarly, Cages 112 to 114 corresponded to the proximal exhaust fan zone (PEFZ), and Cages 157 to 159 were categorized as being in the exhaust fan zone (EFZ). (b) Vertically, tiers were denoted by the numerals 1, 3, 5, and 7, indicating the first, third, fifth, and seventh levels. The column positions were marked as C1–C4, where C1 refers to the column closest to the henhouse wall.
-
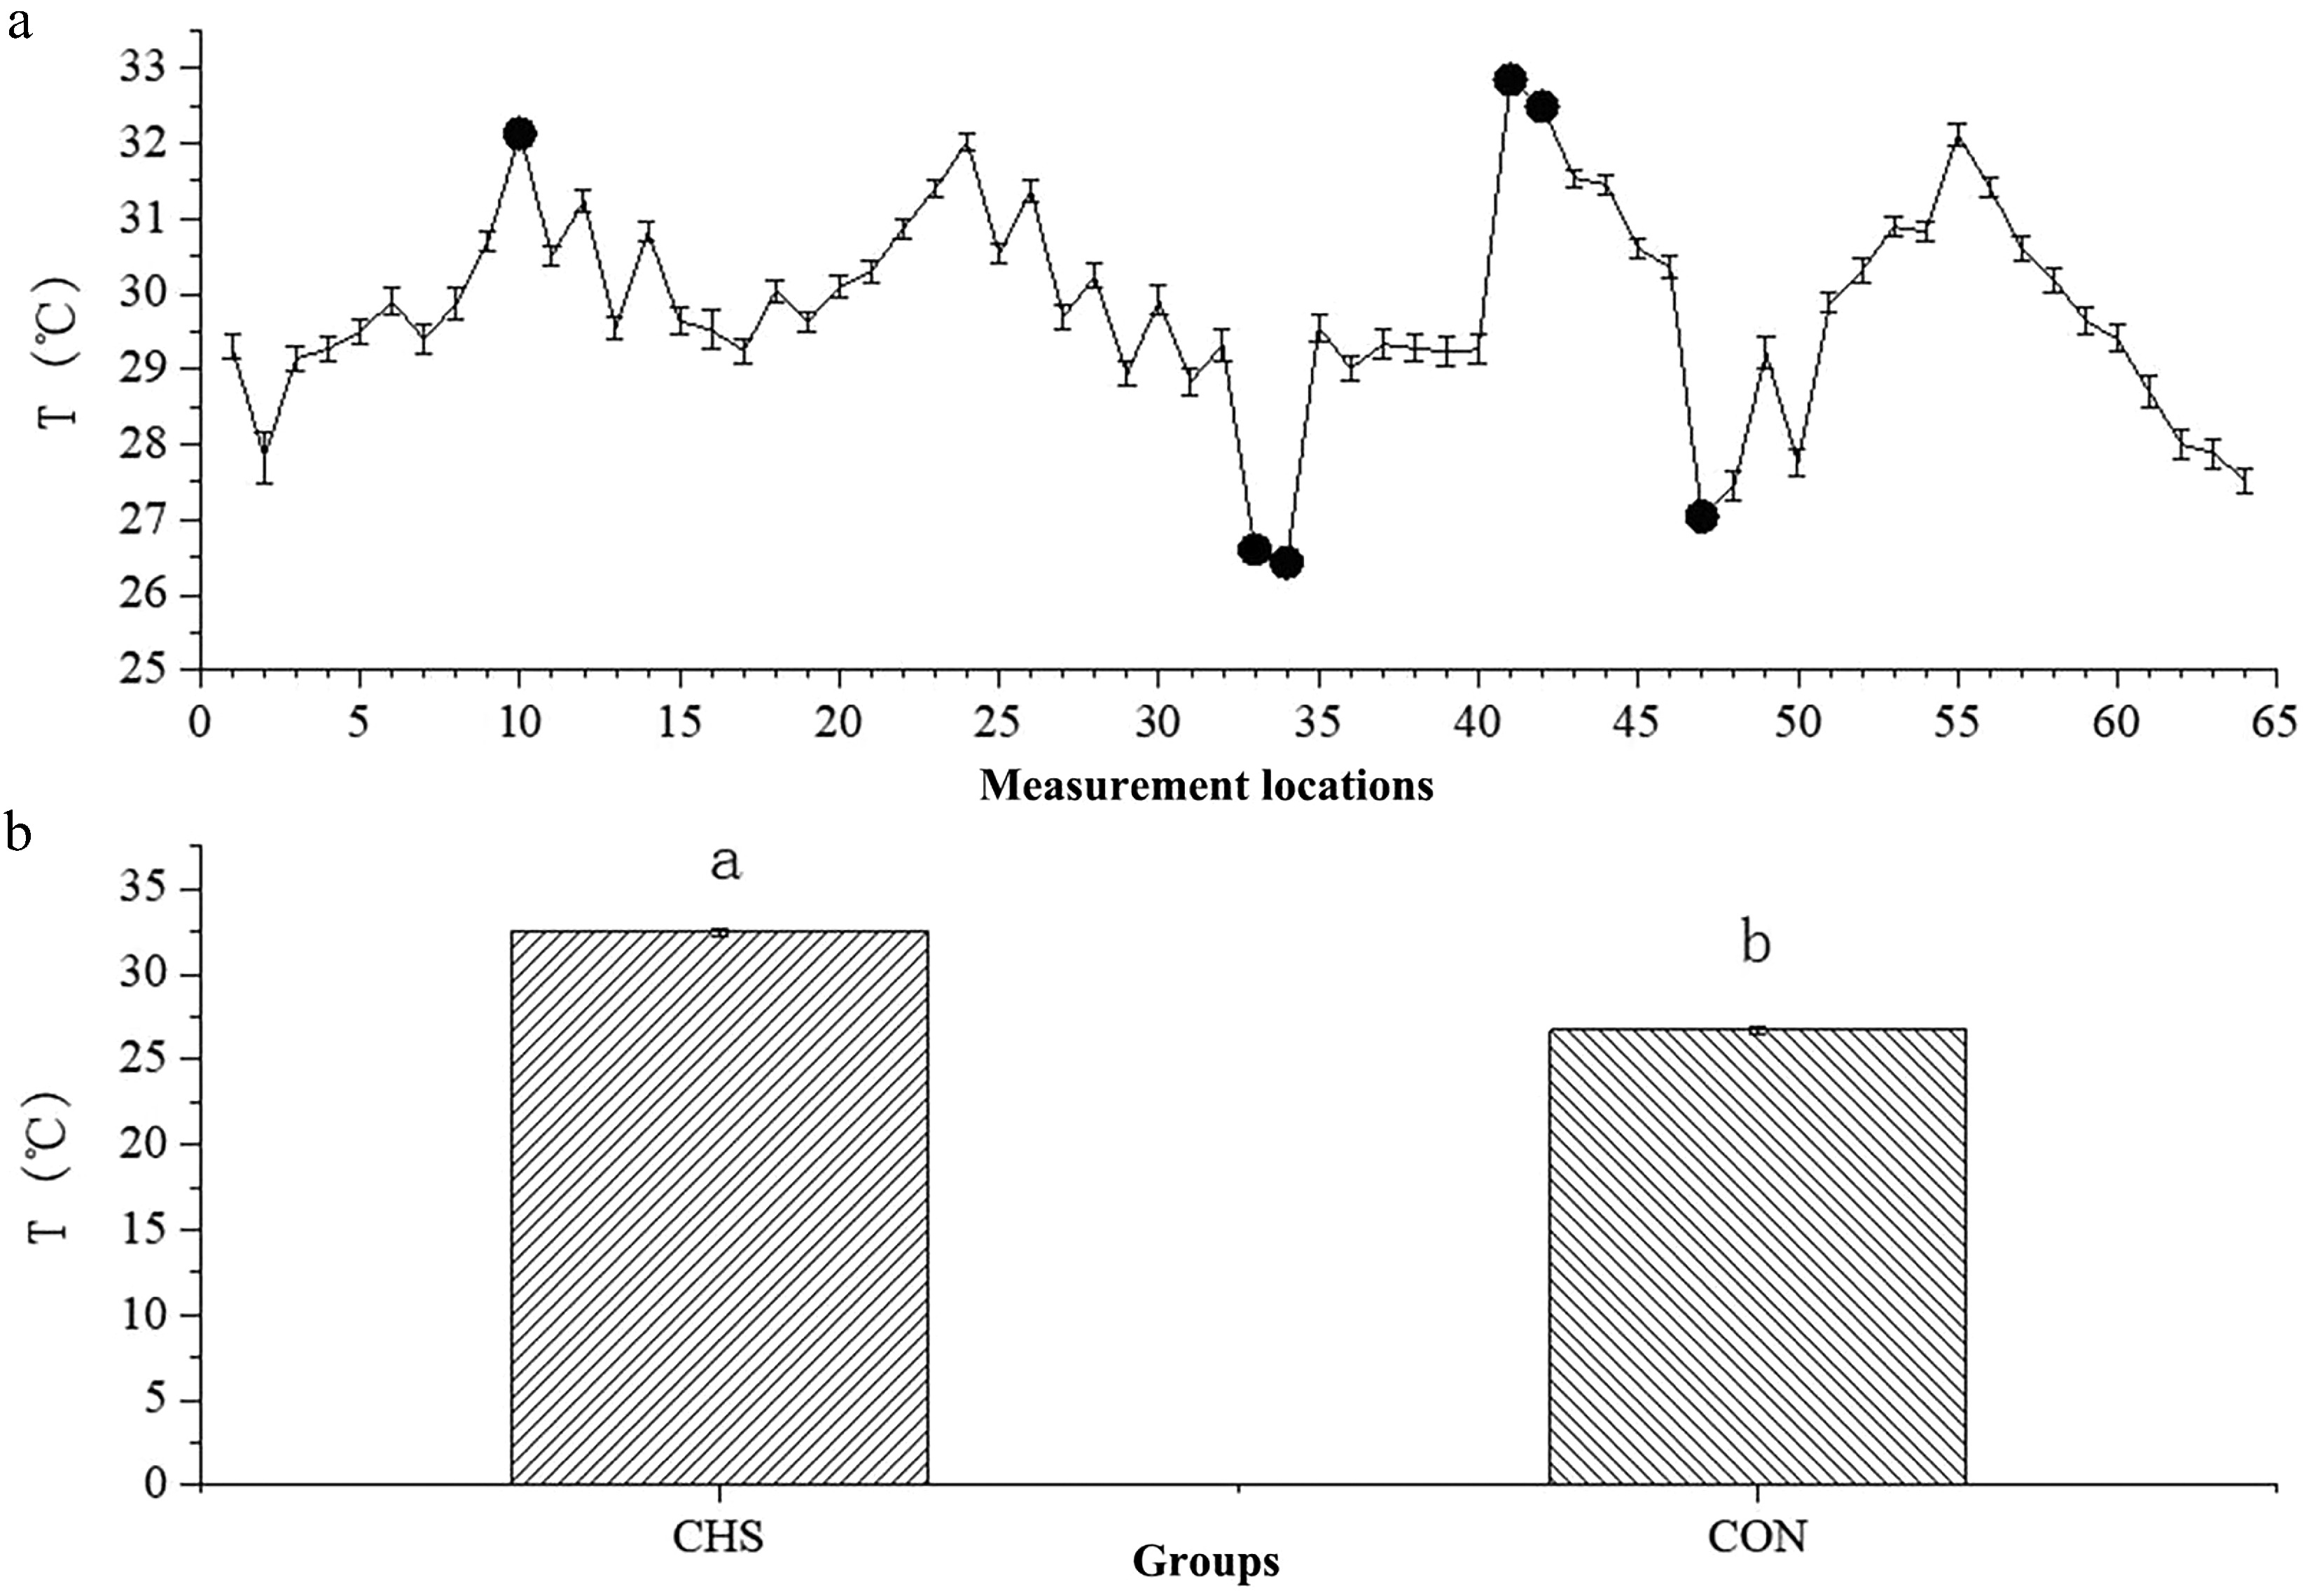
Figure 2.
Average temperatures at different measurement locations (a) and between the CHS and CON groups (b). (a) The x-axis denotes the sequential order of the 64 sampling locations, whereas the y-axis depicts the temperature measurements obtained at each location. Highlighted points indicate sites selected for further investigation. (b) A comparison of the average temperatures between the CHS and CON groups. Abbreviations: CHS, chronic heat stress group; CON, control group.
-
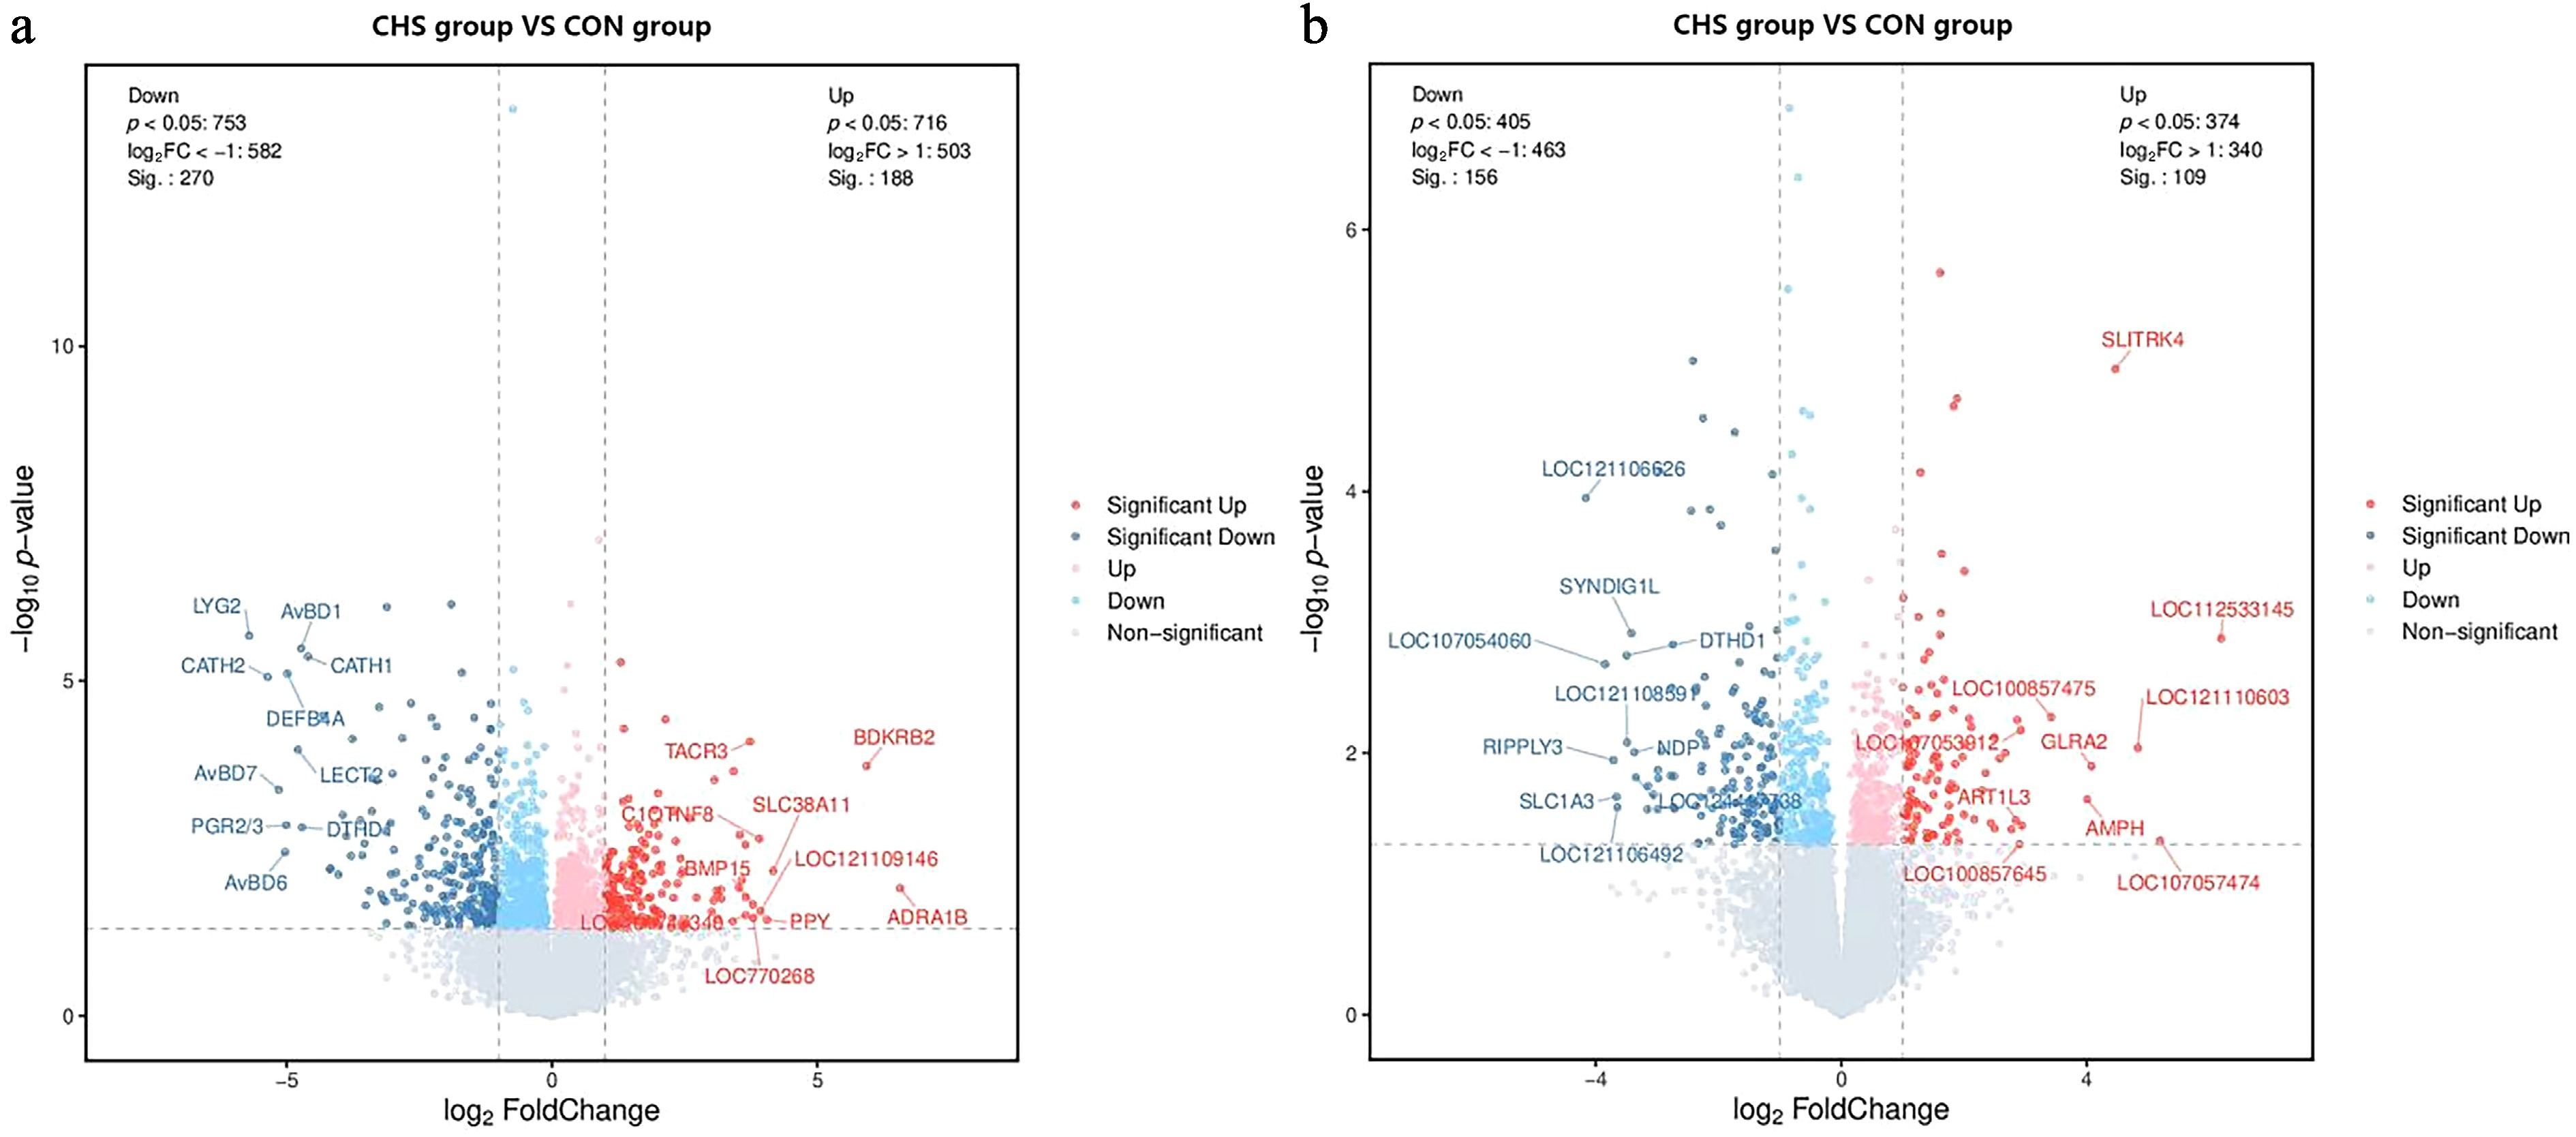
Figure 3.
Volcano plots illustrating differentially expressed genes (DEGs) in the (a) pituitary and (b) liver samples. Red and blue dots denote upregulated and downregulated genes, respectively; gray dots indicate those without significant differential expression.
-
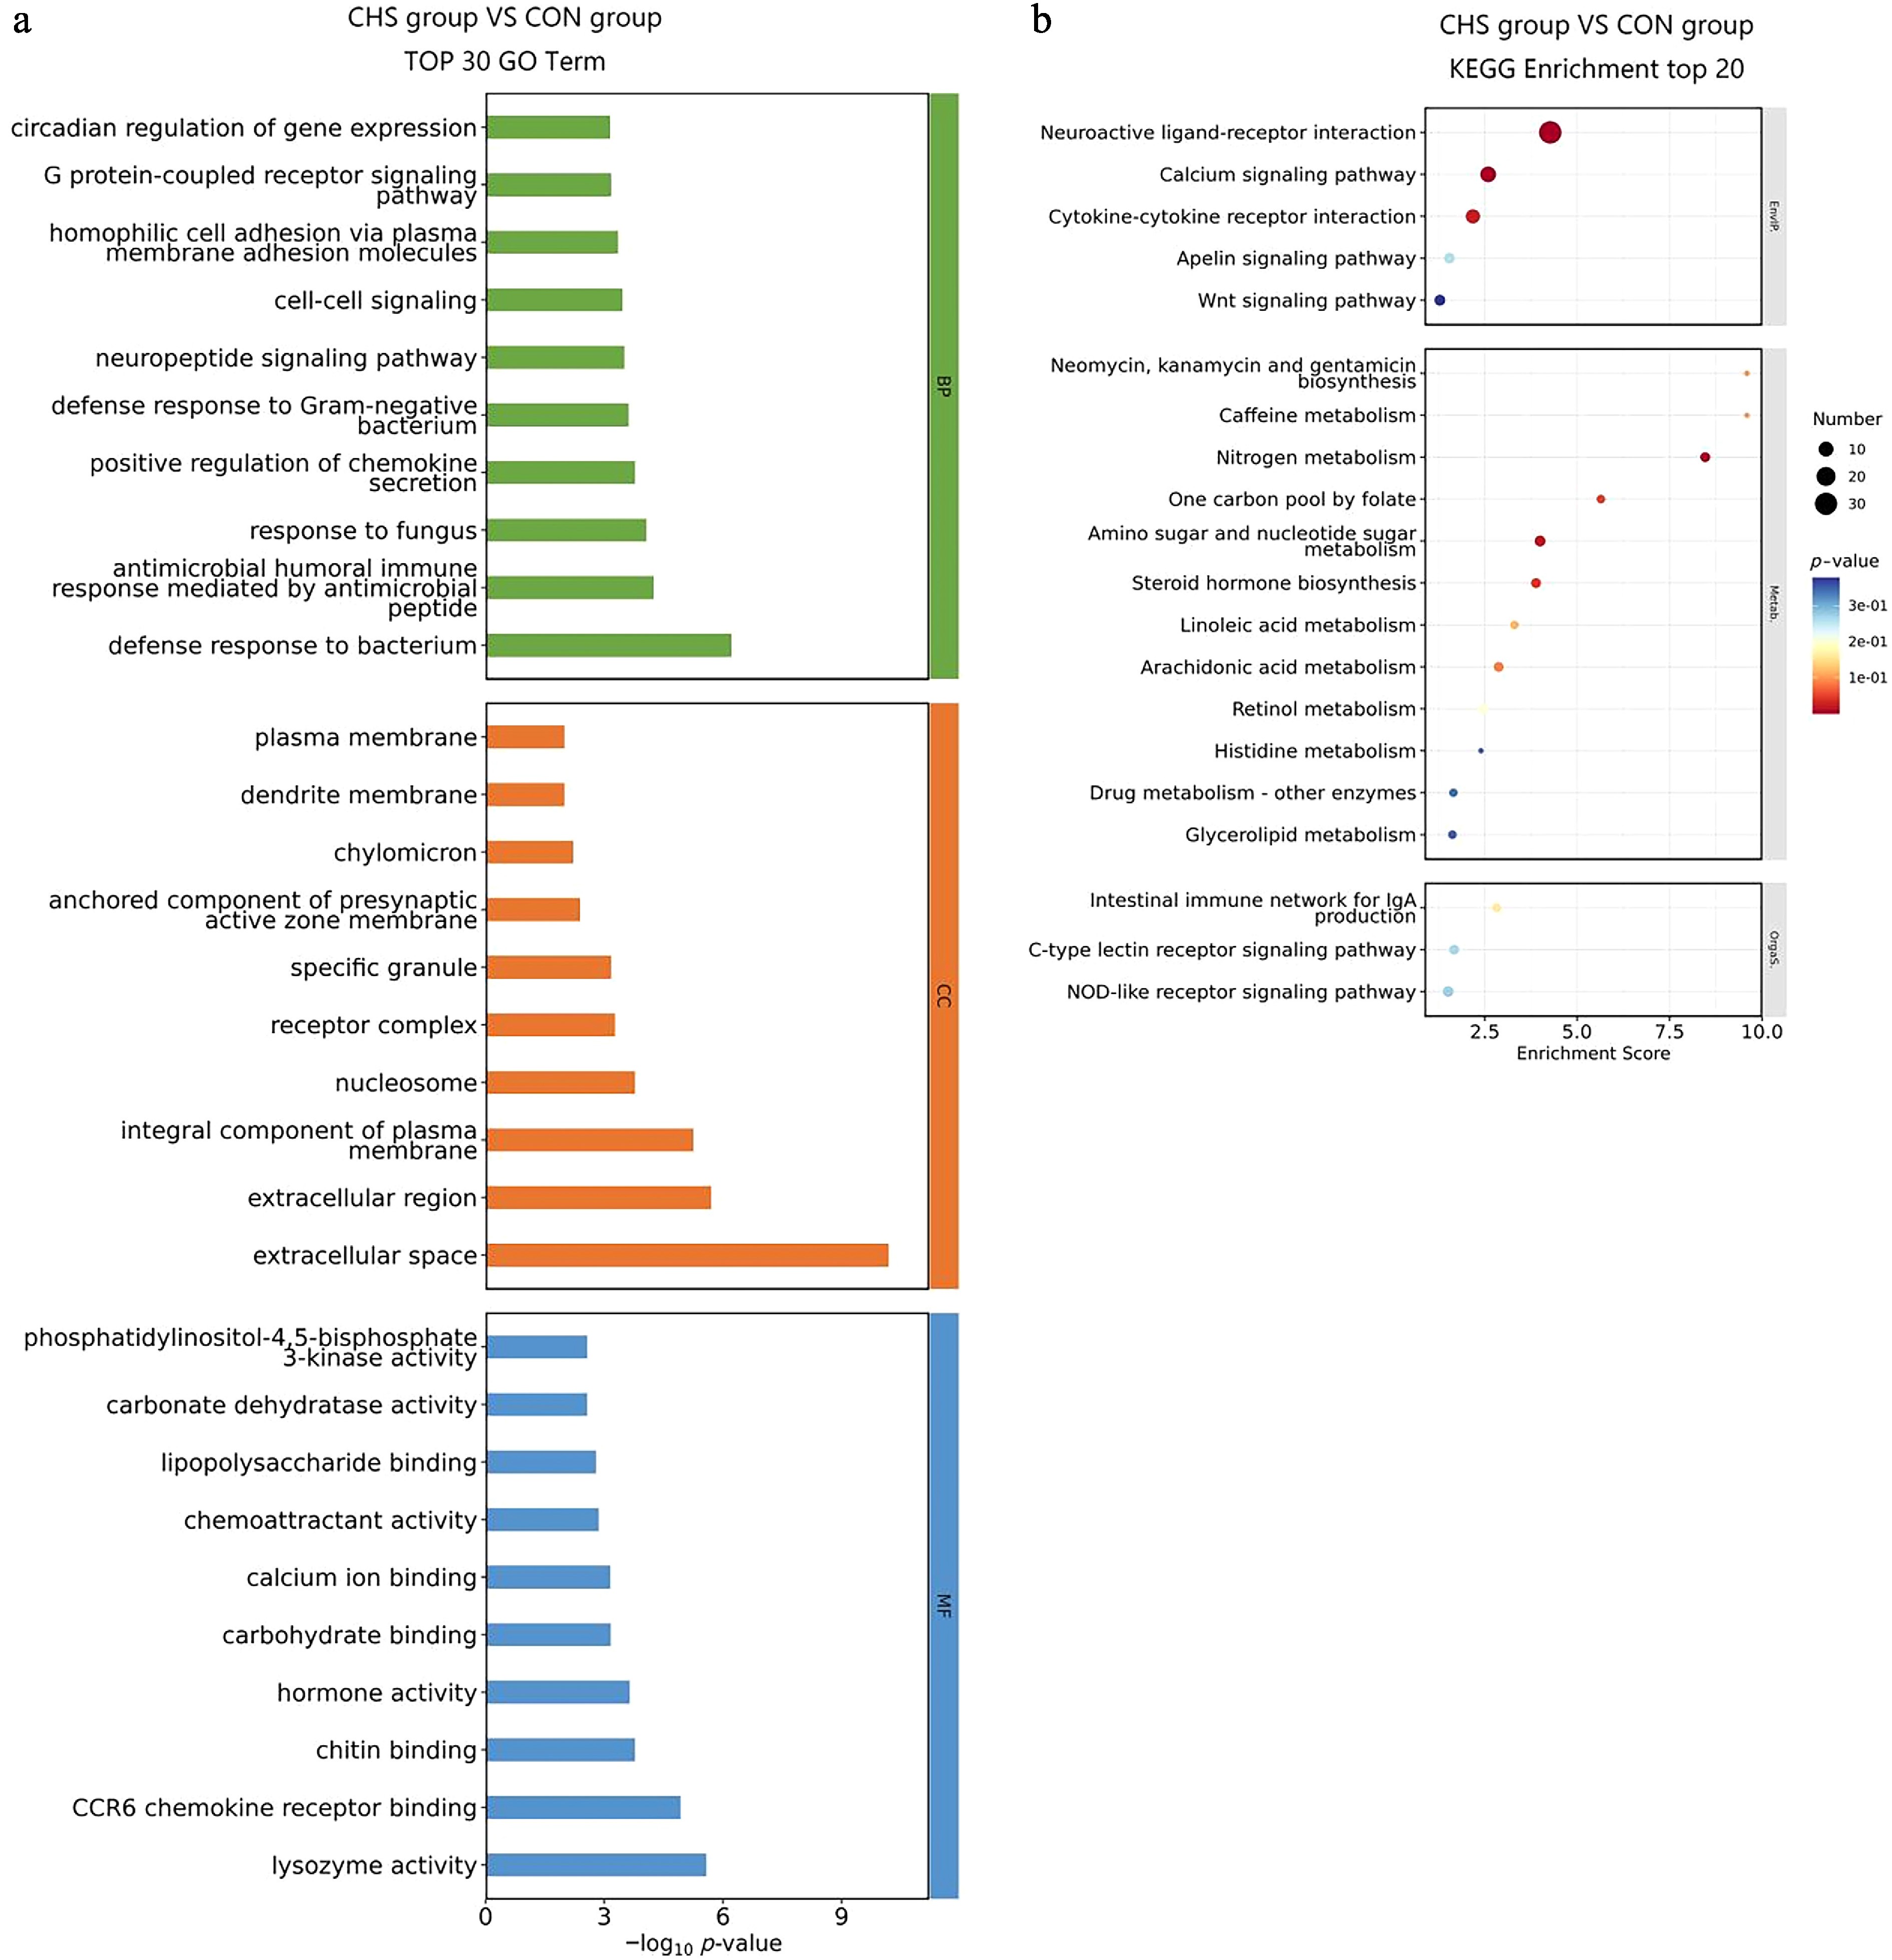
Figure 4.
GO and KEGG enrichment analysis of DEGs in pituitary tissues. (a) Top 30 GO terms of the DEGs. (b) Top 20 significantly enriched KEGG pathways of the DEGs.
-
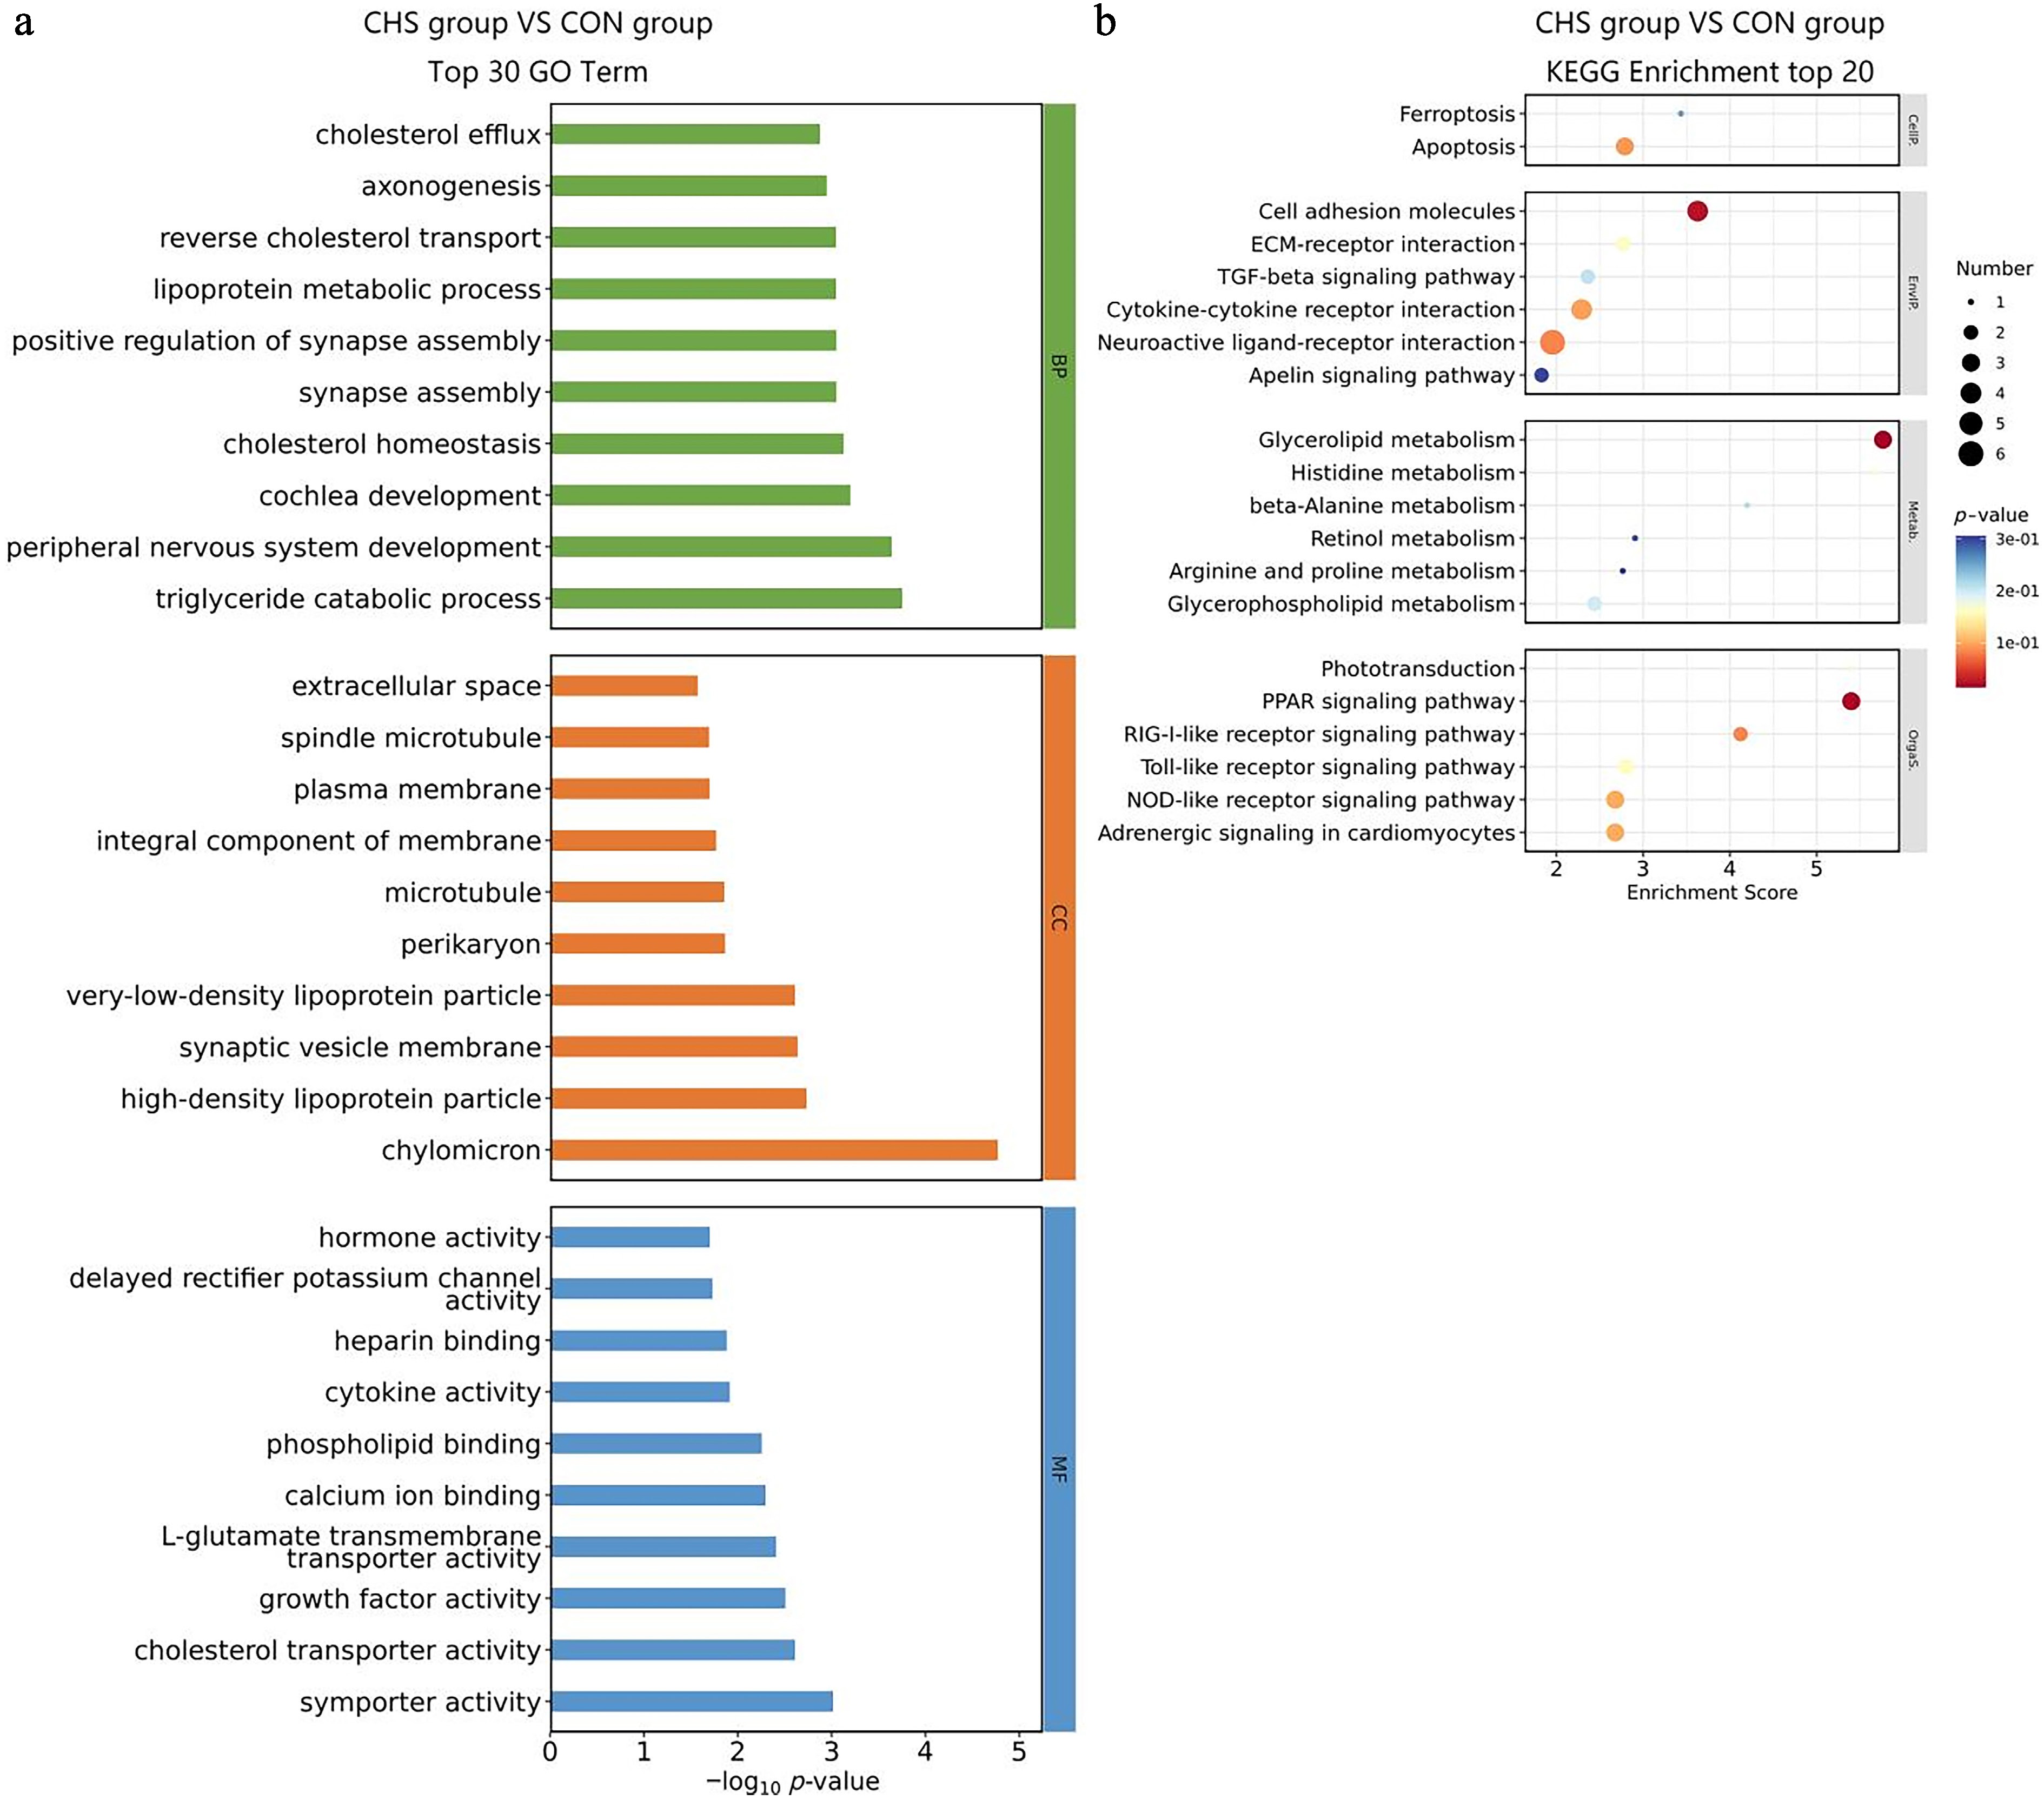
Figure 5.
GO and KEGG enrichment analysis of DEGs in liver tissues. (a) Top 30 GO terms of the DEGs. (b) Top 20 significantly enriched KEGG pathways of the DEGs.
-
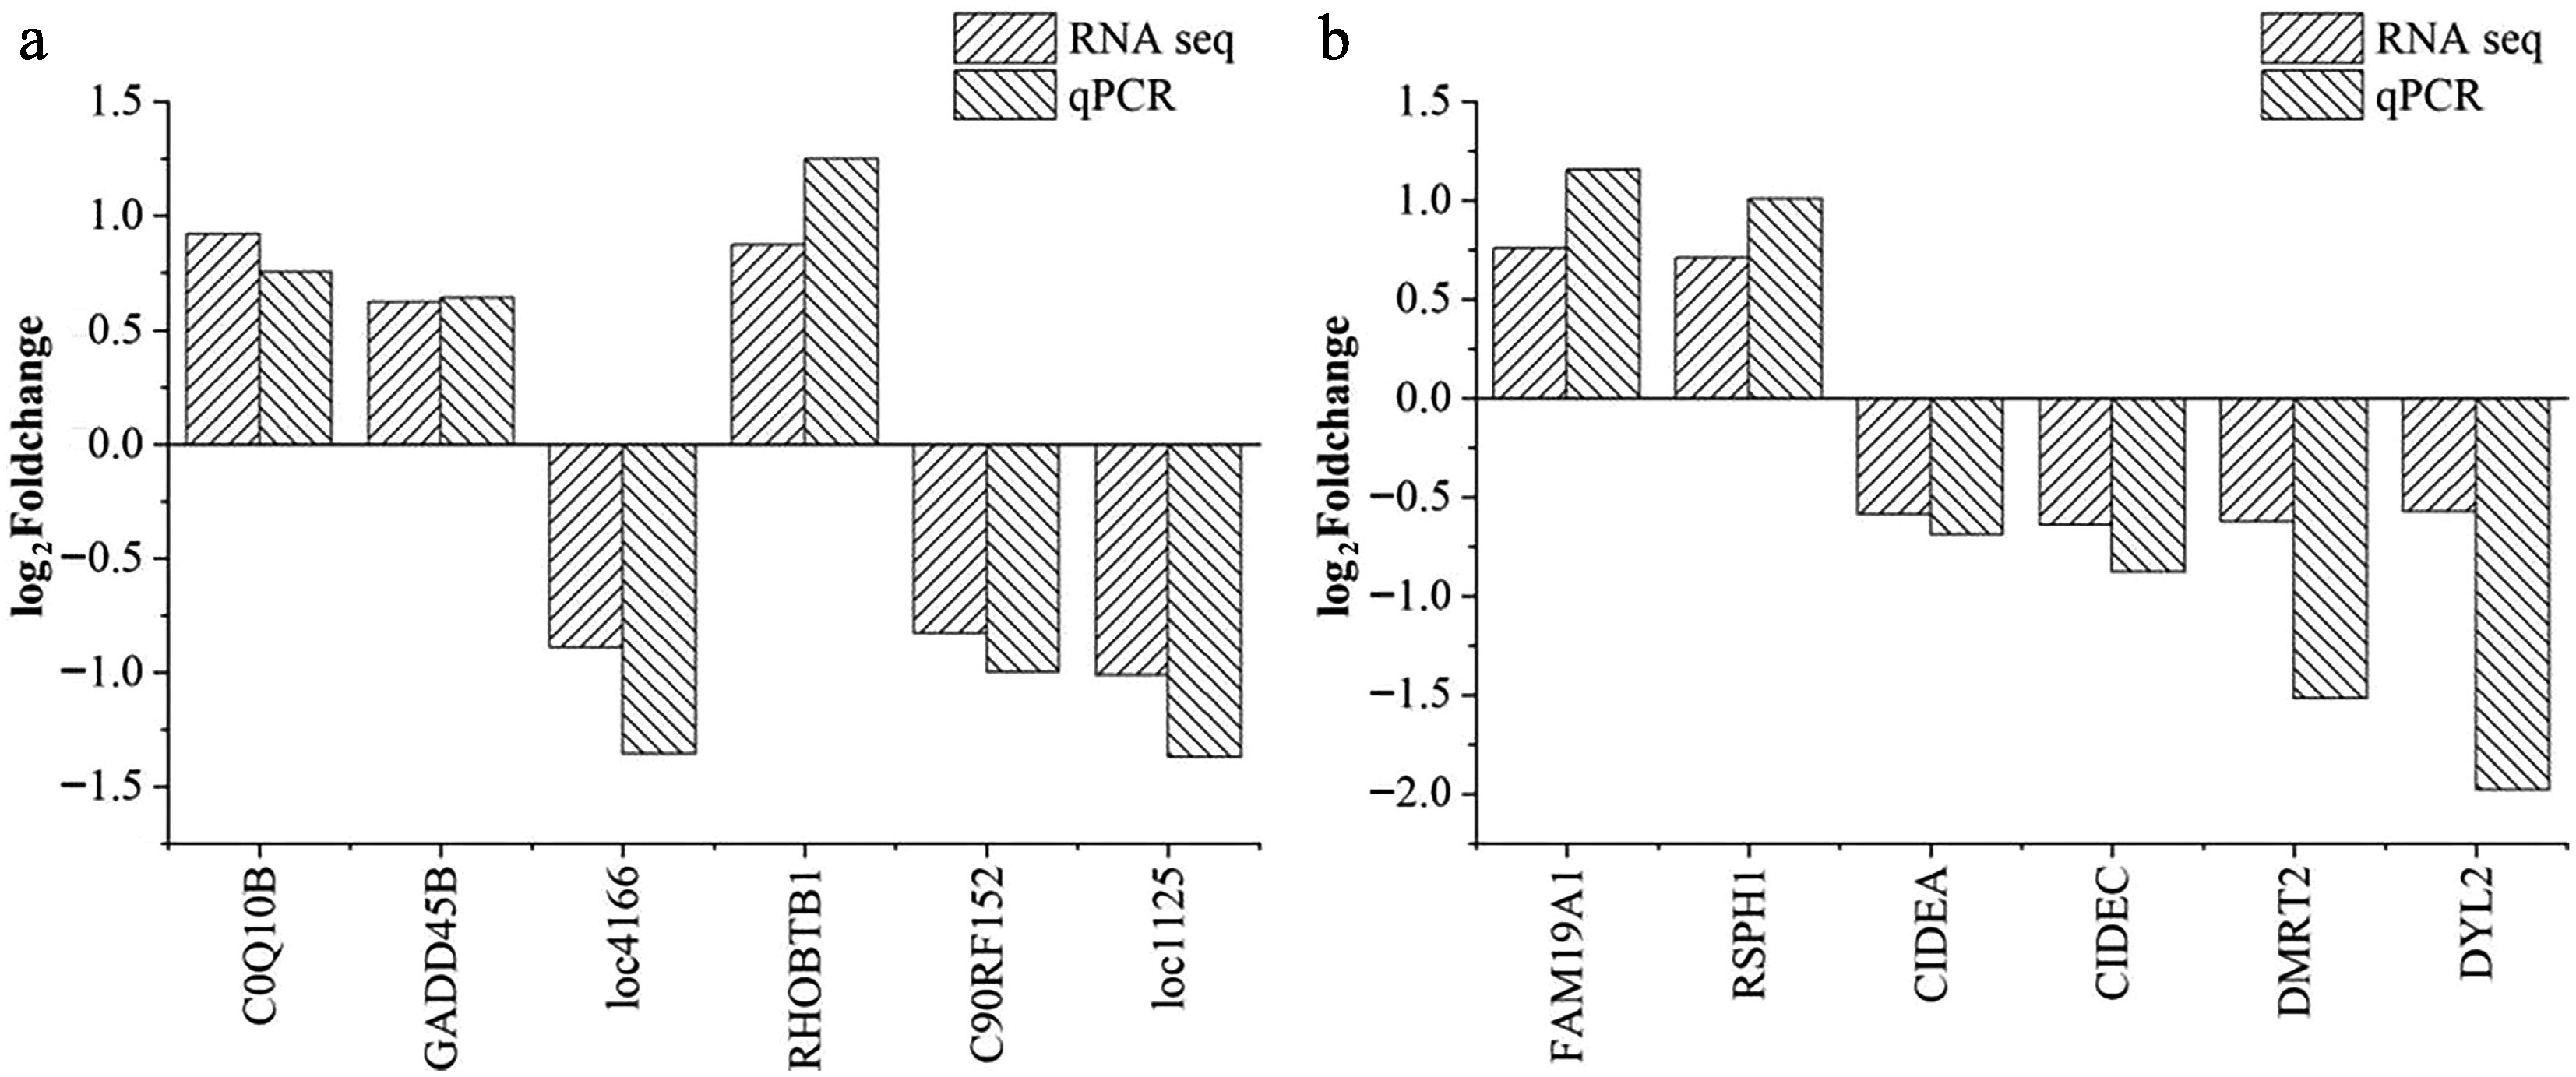
Figure 6.
Validation of the differentially expressed genes in (a) pituitary and (b) liver samples. The horizontal axis indicates the DEGs selected for the qPCR analysis; the vertical axis represents the log2(fold change) values between the CHS and CON groups. Abbreviations: CHS group, chronic heat stress group; CON group, control group.
-
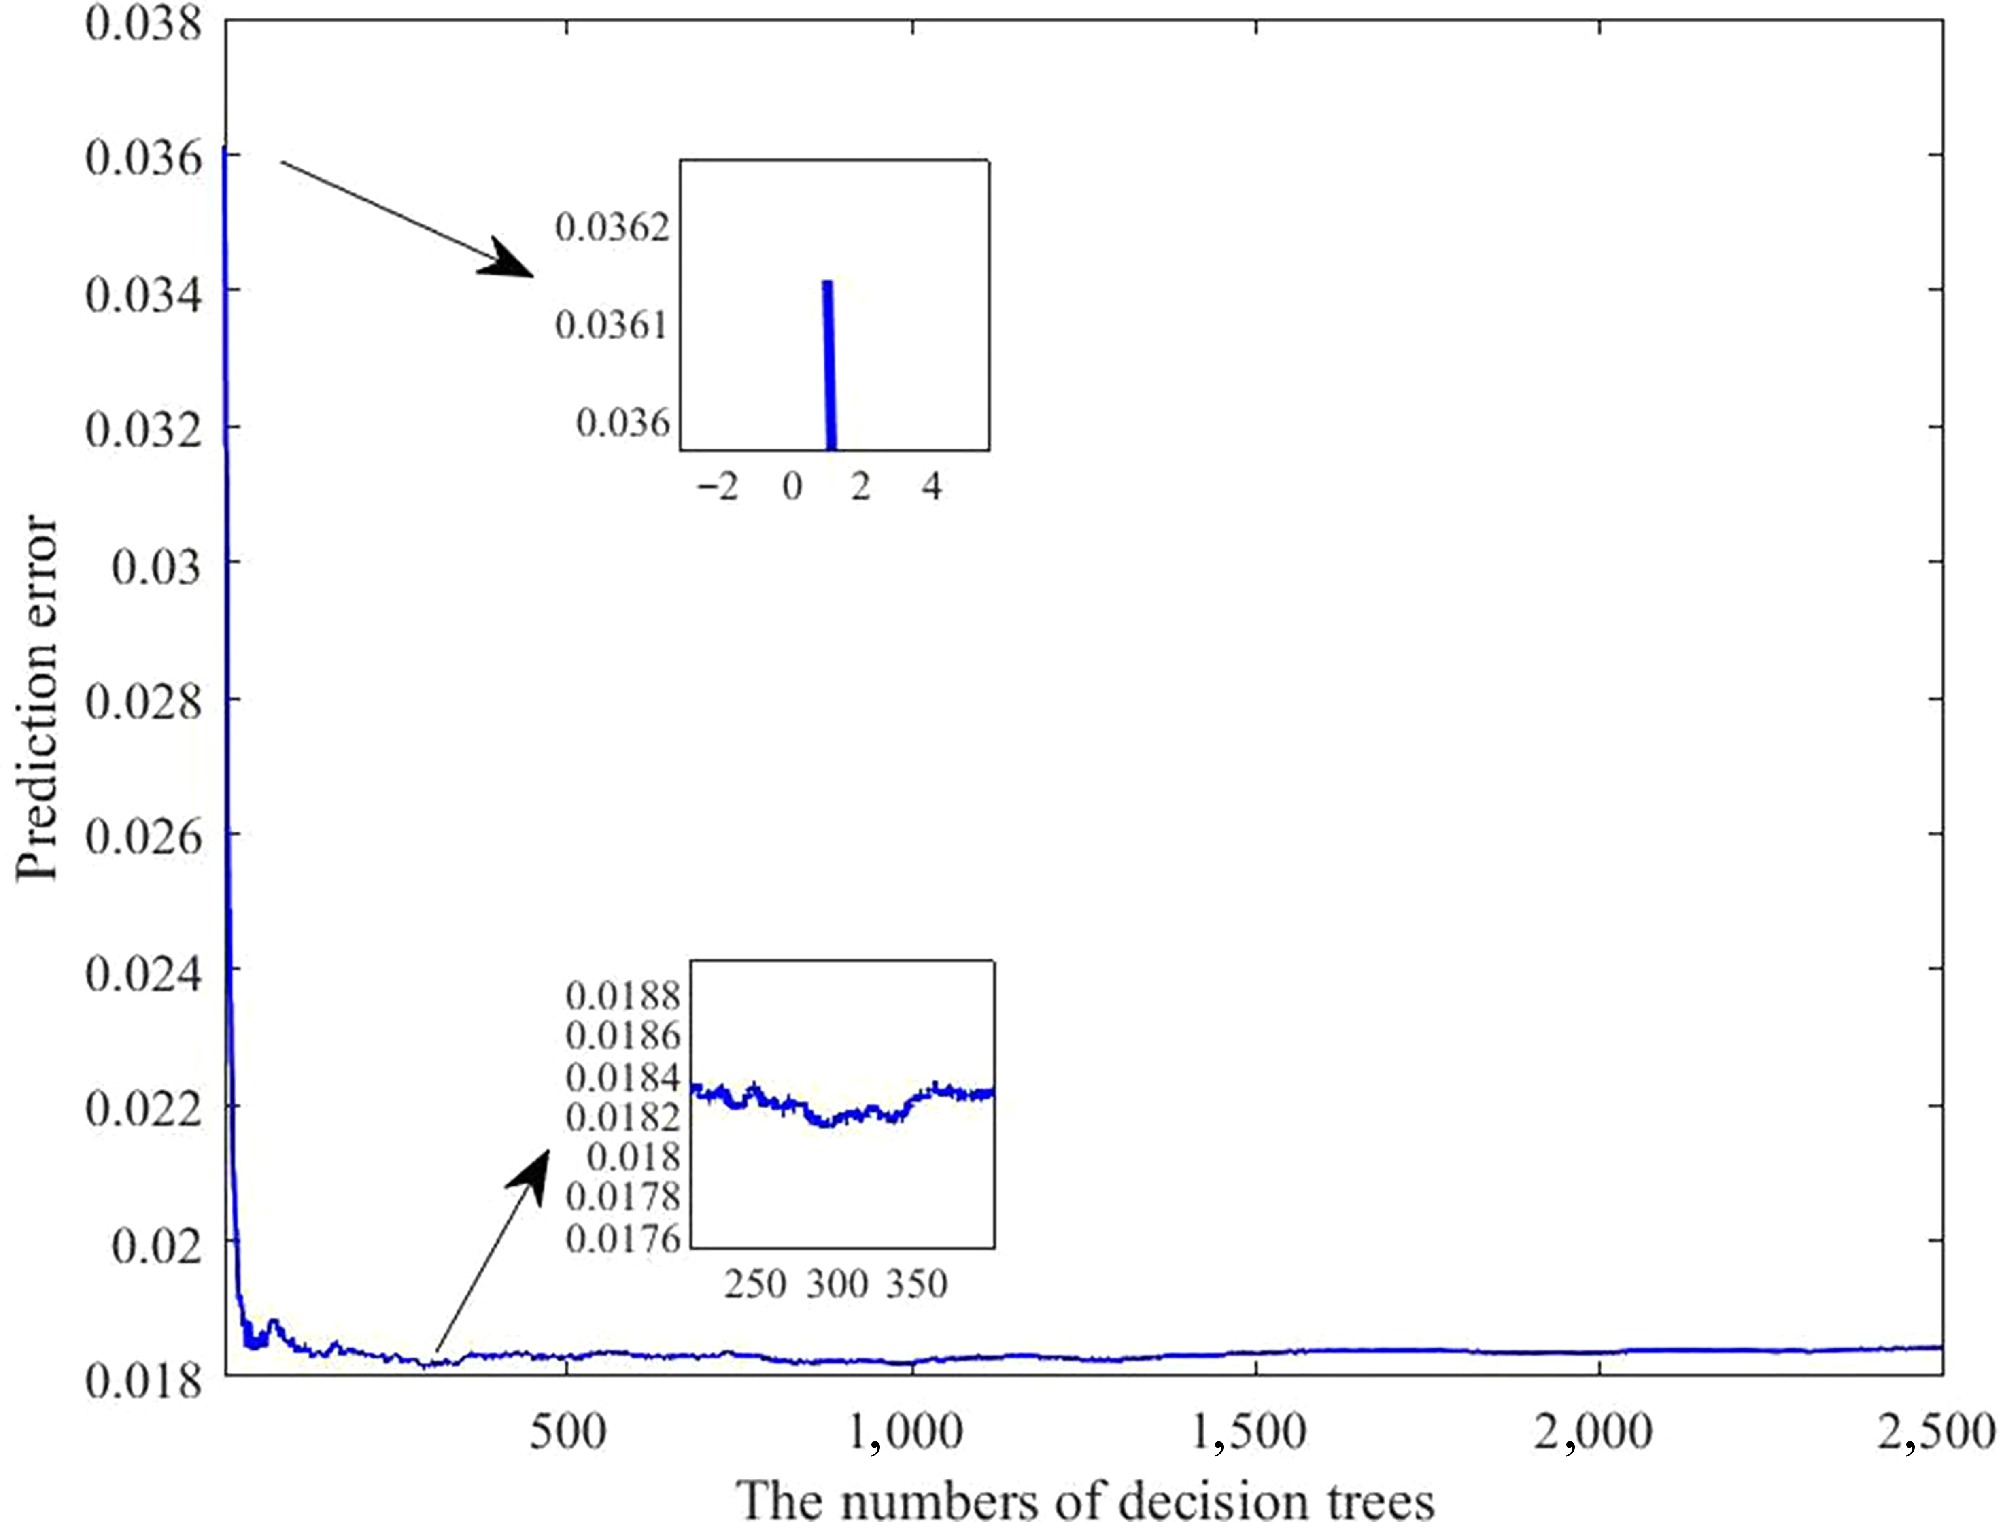
Figure 7.
Error curves of the laying rate prediction model under varying numbers of decision trees. The horizontal axis indicates the number of trees; the vertical axis denotes the prediction error.
-
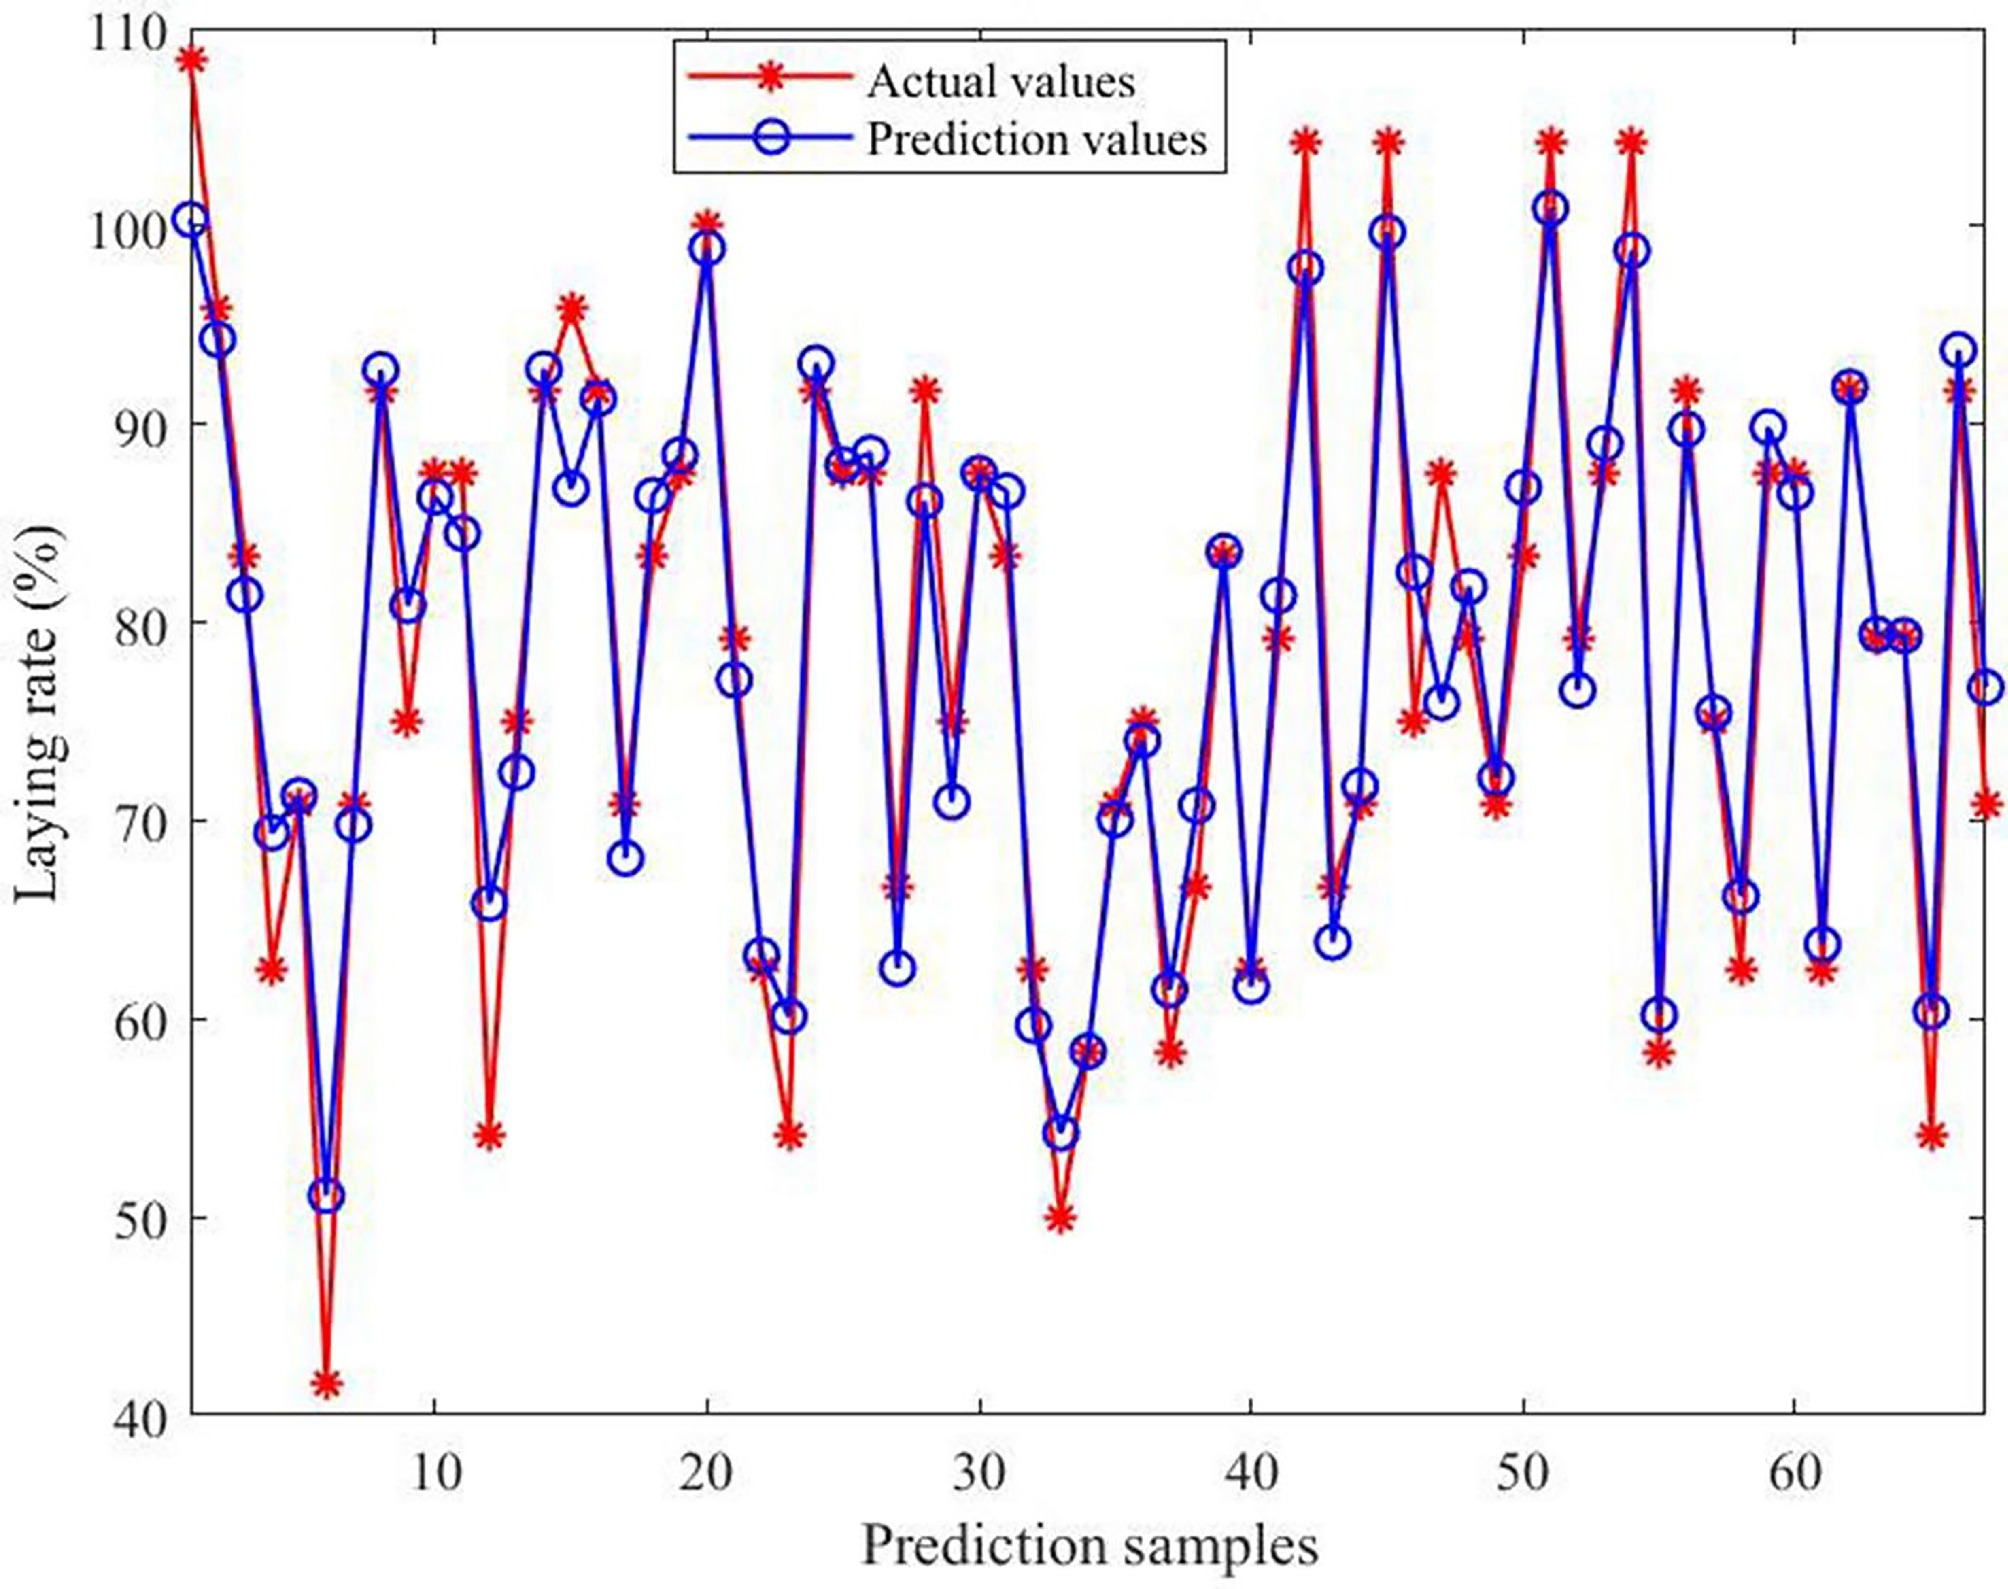
Figure 8.
Comparison of actual and predicted values of the model. The horizontal axis indicates the number of predicted samples; the vertical axis indicates the laying rate.
-
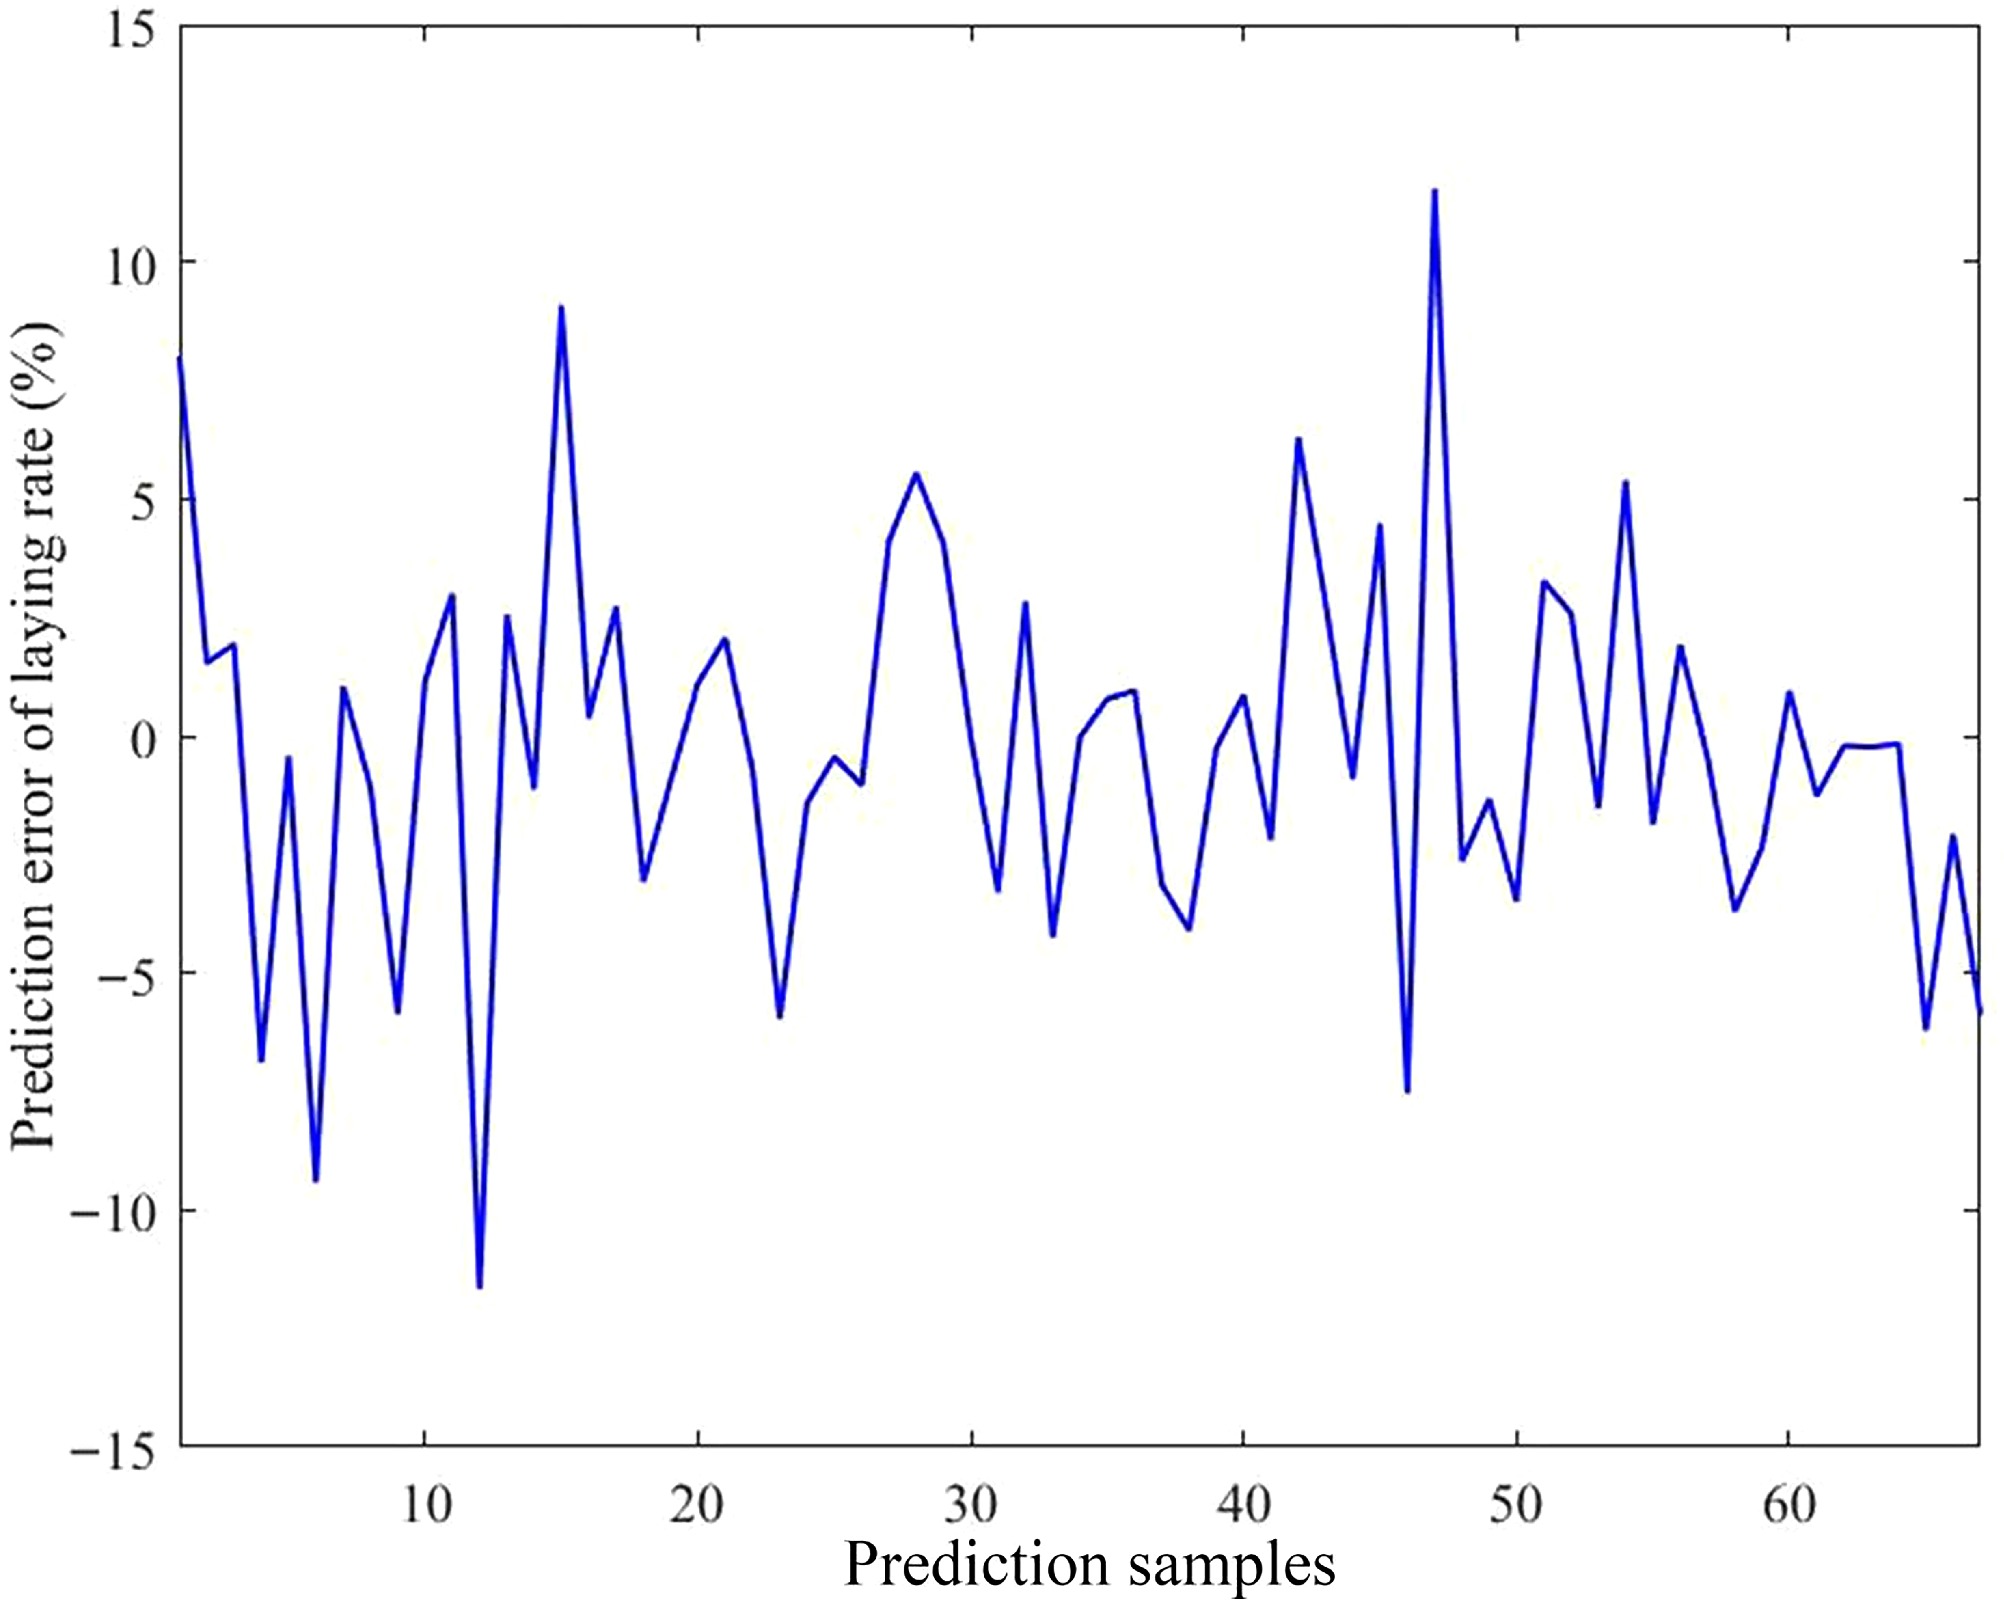
Figure 9.
Prediction error of the model. The horizontal axis indicates the number of predicted samples; the vertical axis indicates the prediction error of the laying rate.
-
Columns Vertical direction
(tiers)Horizontal direction CPZ PCPZ PEFZ EFZ C1 7 34 36 38 40 5 33 35 37 39 3 2 4 6 8 1 1 3 5 7 C2 7 48 46 44 42 5 47 45 43 41 3 16 14 12 10 1 15 13 11 9 C3 7 50 52 54 56 5 49 51 53 55 3 18 20 22 24 1 17 19 21 23 C4 7 64 62 60 58 5 63 61 59 57 3 32 30 28 26 1 31 29 27 25 CPZ, cooling pad zone; PCPZ, proximal cooling pad zone; PEFZ, proximal exhaust fan zone; EFZ, exhaust fan zone. C1, first column; C2, second column; C3, third column; C4, fourth column (numbered sequentially from the henhouse wall). Table 1.
The specific mapping of each number to the measurement location.
-
Target gene GenBank number Primer sequence (5'–3') T (°C) Product size (bp) FAM19A1 XM_046926508.1 F: GCTCTGCTCTTGGCTGGATTAC 58.52 129 R: GCTGCTGGAAAGTGTGATGGAG 58.92 129 RSPH1 XM_040659723.2 F: TGTTGGTGGTTGGGTAAATGGAATC 57.46 108 R:TTGCCACGACCTACAGGAGTTC 59.47 108 CIDEA NM_001195123.2 F: CATCTGCCTCTGAACCACATACATC 57.56 104 R: TTCTACAGGAACACCATTGGAAACTAC 56.28 104 CIDEC XM_046925330.1 F: TGGAGACGGAGGCTTTCTTCTG 59.3 130 R: CGGCGGGACGGCTTGTG 64.34 130 DMRT2 XM_046936552.1 F: ACCGCCCTATTCCAGCAGATG 60.08 118 R: AGCATAATGTTCTCCAACTCCTTATCG 56.2 118 DYL2 XM_040684994.2 F: AGGGAGTTTGACAGGCGGTAC 59.84 102 R: GTAGGCGAAGATGAAGTGGTTGG 58.21 102 COQ10B NM_001389593.2 F: CCAAGGAGGCAACTACATACTACAC 57.07 116 R: GCTGTGGGAGGAGGGAGAATG 60.73 116 GADD45B XM_046933968.1 F: GGACGGATTCGGCTGAACATC 58.9 106 R: TCCCAGCGGCTCCAATGC 62.21 106 LOC416655 XM_040684134.2 F: AGAAGAGGAGGAGGAGGAGGATG 59.92 109 R: CAGGAGCCGCAGTGTGGTC 62.49 109 RHOBTB1 XM_046920122.1 F: TTACAAGGCAAGCAAGCGACAG 58.38 119 R: ATCACTGACCAAGAATTAAGGAGACTG 55.95 119 C9ORF152 XM_046910132.1 F: GATCAACCTGTCTCCTATTAGCCAAG 56.84 100 R: TGCAGTCCAACATCTTCCTTACAAC 57.08 100 LOC112532115 XR_005848662.1 F: TGTCCATTCCTGCTCCTCTTCTC 58.73 109 R: TGCACACGTCTGGTCCATCC 60.62 109 β-actin NM_205518.1 F: TATTGCTGCGCTCGTTGTTG 56.39 127 R: ACCAACCATCACACCCTGAT 56.34 127 Table 2.
Details of the target genes and the corresponding primer sequences used in qPCR.
-
Performances CHS group CON group p-Value Body weight (g) 1,629.32 ± 45.06b 1,836.52 ± 39.99a 0.002 Laying rate (%) 67.80 ± 1.18b 86.53 ± 1.11a < 0.001 Egg weight (g) 53.77 ± 0.27b 61.16 ± 0.16a < 0.001 Egg shape index (mm:mm) 1.33 ± 0.01 1.31 ± 0.01 0.056 Shell color 47.92 ± 0.93 48.94 ± 0.78 0.403 Shell thickness (mm) 0.31 ± 0.01b 0.35 ± 0.00a < 0.001 Shell strength (kg/cm2) 3.50 ± 0.12b 4.44 ± 0.09a < 0.001 Yolk weight (g) 14.09 ± 0.35b 16.99 ± 0.24a < 0.001 Yolk color 10.98 ± 0.15 11.20 ± 0.16 0.309 Albumen height (mm) 6.57 ± 0.18a 6.07 ± 0.17b 0.043 Haugh units 81.73 ± 1.23a 75.13 ± 1.70b 0.003 CHS group, chronic heat stress group; CON group, control group. Results within a row with different superscripts differ significantly (p < 0.05) Table 3.
Comparison of production performances and egg quality between the CHS and CON groups.
-
Indicators CHS group CON group p-Value Biochemical indicators FSH (ng/mL) 30.99 ± 0.95b 41.83 ± 3.54a 0.018 LH (pg/mL) 2,965.8 ± 150.41b 3,735.43 ± 185.42a 0.006 HSP 70 (ng/mL) 12.5 ± 1.12 14.62 ± 1.34 0.245 CORT 49.75 ± 6.91 52.07 ± 5.96 0.803 Antibody titers H5 Re-13 (log2) 7.25 ± 0.31 7.89 ± 0.23 0.100 H5 Re-14 (log2) 8.13 ± 0.24b 9.05 ± 0.24a 0.010 H7 (log2) 7.50 ± 0.31 8.20 ± 0.29 0.120 H9 (log2) 9.81 ± 0.26 10.05 ± 0.18 0.460 ND (log2) 7.63 ± 0.35 7.74 ± 0.35 0.820 CHS group, chronic heat stress group; CON group, control group. Results within a row with different superscripts differ significantly (p < 0.05)). Table 4.
Comparison of biochemical indicators and antibody titers between the CHS and CON groups.
-
Environmental variables CHS group CON group p-Value T (°C) 32.17 ± 0.07a 27.60 ± 0.13b < 0.001 RH (%) 73.31 ± 0.38b 89.04 ± 0.73a < 0.001 AV (m/s) 1.72 ± 0.03a 1.43 ± 0.06b < 0.001 LI (lx) 8.93 ± 0.27a 8.06 ± 0.26b 0.021 NH3 (mg/m3) 0.97 ± 0.09a 0.24 ± 0.05b < 0.001 CO2 (mg/m3) 2,686.75 ± 17.34a 1,714.74 ± 13.38b < 0.001 PM2.5 (ug/m3) 2.48 ± 0.05a 1.52 ± 0.04b < 0.001 CHS group, chronic heat stress group; CON group, control group. Results within a row with different superscripts differ significantly (p < 0.05). Table 5.
Comparison of the local environment between the CHS and CON groups.
-
Perfomance T RH AV LI NH3 CO2 PM2.5 Laying rate −0.65233* 0.55789* −0.27821* −0.07959 −0.16376* −0.6208* −0.52812* The asterisk (*) indicates significant correlation. Table 6.
Correlation between environmental variables and laying rate.
-
Dataset R2 MSE RMSE MAE Training subset 0.92926 18.5262 4.3042 3.2353 Testing subset 0.92339 16.5915 4.0733 3.0166 Table 7.
Error statistics of model predictions
Figures
(9)
Tables
(7)