


-
Heat stress (HS) has increasingly been recognized as a critical environmental threat to modern poultry production. It arises when birds fail to regulate thermal equilibrium, with insufficient capacity to counteract endogenous heat generation through environmental dissipation. Chickens are highly vulnerable to HS, primarily because their plumage restricts effective heat dissipation and they lack functional sweat glands[1,2]. The sensory signs of HS in poultry include reduced feeding time, increased drinking, panting, wing elevation, and a tendency to move towards cooler surfaces[3,4]. HS causes substantial economic losses worldwide. Therefore, the study of HS is of great significance.
Extensive studies have demonstrated that HS profoundly compromises poultry by reducing their productive efficiency, impairing egg and meat characteristics, and weakening immune function. Prolonged HS has been demonstrated to significantly impair growth performance particularly by reducing body weight[5,6], lowering egg production[7,8], compromising egg[3,7] and meat quality[9], decreasing fertility[8], weakening immunity and welfare[10], and inducing intestinal barrier dysfunction[11] in poultry. At the molecular level, HS activates the sympathetic adrenomedullary system and hypothalamic–pituitary–adrenal axes, thereby promoting the release of catecholamines and glucocorticoids, respectively[8,12]. Furthermore, HS may impair the regulatory function of the hypothalamic–pituitary–gonadal axis, consequently disrupting the secretion patterns of gonadotropin-releasing hormone, luteinizing hormone (LH), and follicle stimulating hormone (FSH)[8,13]. Although the negative impacts and mechanisms of HS on poultry have been extensively studied, the HS models used by researchers have been artificially constructed and differ from the actual conditions experienced by chickens in practice. Therefore, a more realistic investigation of HS is required.
The henhouse microenvironment within a constitutes a multifaceted and dynamic system, shaped by interrelated variables such as temperature (T), relative humidity (RH), airflow velocity (AV), and airborne particulate matter (PM). Laying hens, confined to these environments throughout their productive lives, are inevitably influenced by these factors. Naturally, hens experiencing HS are subject to a comprehensive interaction of these environmental factors. Several management strategies have also been proposed to alleviate HS, based on this understanding. For instance, implementing an intermittent light regimen has been reported to reduce heat production in poultry[14]. Providing water-fortified feed, with 1.5 parts water per unit feed for broilers and equal parts for laying hens, has been shown to improve bird performance during HS conditions[15]. Furthermore, augmenting ventilation facilitates convective heat dissipation, thereby reducing the birds' body temperature[16]. Therefore, to develop targeted strategies for mitigating HS, it is crucial to thoroughly consider the environmental factors, especially for establishing the intrinsic relationship between production performance and these factors. However, the inherent complexity, dynamic nature, and unclear relationships among these factors and production outcomes make predictions particularly challenging when using traditional methods. To date, limited research has provided little insight into the relationships between these determinants and production performance. Gratifyingly, scholars have increasingly incorporated artificial intelligence methodologies into scientific research, leveraging more advanced algorithms to solve complex problems. Within the spectrum of computational learning techniques, the random forest regression (RFR) approach has been recognized as a highly reliable method for making predictions. RFR constitutes a robust nonparametric ensemble technique, in which a multitude of conventional decision trees is systematically generated throughout the training phase, and the model derives its final predictions by computing the averaged outputs across all constituent trees[17]. Its advantages include its efficient processing of large-scale datasets, robustness against noise and overfitting, and ability to handle a vast number of input variables, RFR operates with relatively fewer tunable parameters, simplifying model configuration and preserving reliable predictive performance[18,19]. It has been widely used for various prediction tasks[17,19,20]. In the present study, we used this method to address our problem.
The current study focused closely on production practices and constructed a HS model that better reflects real-world conditions. This model was then used to comprehensively evaluate the impact of chronic heat stress (CHS) on laying hens' performance and to investigate the associated molecular pathways. Ultimately, we developed a laying rate prediction model that establishes the intrinsic relationship between the laying rate and environmental factors, which provides valuable references for optimizing the henhouse environment and offers practical precaution strategies against HS in poultry.
-
The study was performed at Xunwu Deqingyuan Agricultural Technology Co. Ltd. (Ganzhou City, Jiangxi Province). The experimental animals (47-week-old Hy-Line Grey laying hens) were housed in stacked-cage systems comprising seven parallel rows with eight tiers per row. Each row contained 180 cages (60 cm × 64 cm × 46 cm; length × width × height) arranged symmetrically on both sides of the tier. Eight hens were housed per cage, resulting in an estimated total population of approximately 160,000 birds within the facility. The poultry facility uses a longitudinal ventilation system, whereby fresh air is introduced via inlets installed along both gable-side walls and subsequently discharged through exhaust units at the terminal end of the house (Fig. 1). Illumination was regulated through light-emitting diode (LED) strips to sustain a photoperiod schedule of 17 h light and 7 h dark. During the study, birds were given continuous access to feed and water, and their diets were administered in mash form.
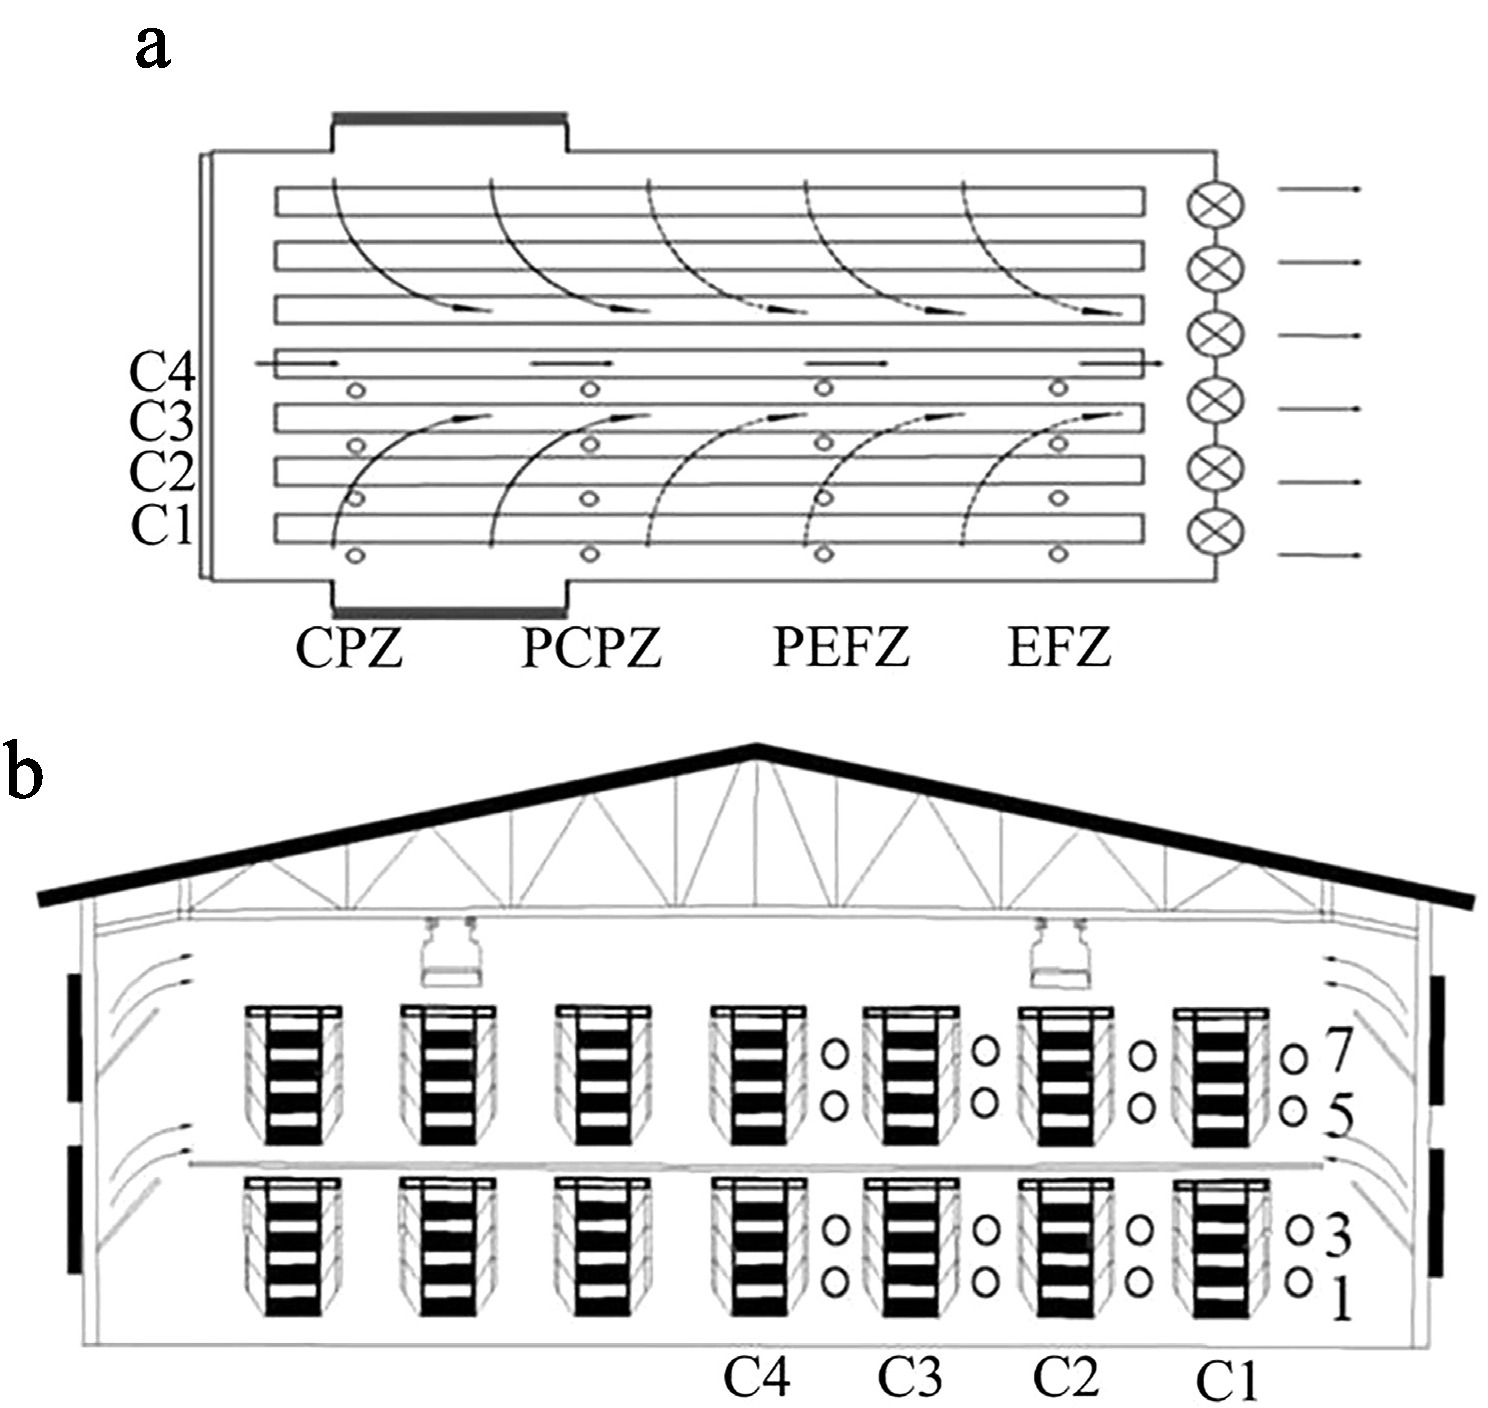
Figure 1.
Spatial layout of measurement locations. (a) Cages numbered 22 to 24 were assigned to the cooling pad zone (CPZ); Cages 67 to 69 represented the proximal cooling pad zone (PCPZ). Similarly, Cages 112 to 114 corresponded to the proximal exhaust fan zone (PEFZ), and Cages 157 to 159 were categorized as being in the exhaust fan zone (EFZ). (b) Vertically, tiers were denoted by the numerals 1, 3, 5, and 7, indicating the first, third, fifth, and seventh levels. The column positions were marked as C1–C4, where C1 refers to the column closest to the henhouse wall.
All dietary formulations were designed in accordance with the nutritional standards for laying hens outlined by the National Research Council[21]. The experimental protocols were approved by the Animal Care and Use Committee of the Anhui Academy of Agricultural Sciences (approval number A19-CS20; date of approval: February 16, 2020).
Given the excessive length of each column and the limited time available for measurements, it was impractical to measure all cages. Therefore, the henhouse was divided into four equal parts to facilitate statistical analysis. For each part, three horizontally central cages were designated as representative units for measurement purposes. The investigation involved 1,536 laying hens, which were equally allocated to 64 sampling locations within the henhouse. For the convenience of statistics, each measurement location was assigned a number from 1 to 64. The spatial layout of the measurement locations is illustrated in Fig. 1, and the numerical mapping is detailed in Table 1. In terms of spatial layout, cages numbered 22 to 24 were assigned to the cooling pad zone (CPZ), whereas Cages 67 to 69 represented the proximal cooling pad zone (PCPZ). Similarly, Cages 112 to 114 corresponded to the proximal exhaust fan zone (PEFZ), and Cages 157 to 159 were categorized as being in the exhaust fan zone (EFZ). Vertically, the tiers were denoted by the numerals 1, 3, 5, and 7, indicating the first, third, fifth, and seventh levels. The column positions were marked as C1–C4, where C1 refers to the column closest to the henhouse wall. The experimental period spanned one month.
Table 1. The specific mapping of each number to the measurement location.
Columns Vertical direction
(tiers)Horizontal direction CPZ PCPZ PEFZ EFZ C1 7 34 36 38 40 5 33 35 37 39 3 2 4 6 8 1 1 3 5 7 C2 7 48 46 44 42 5 47 45 43 41 3 16 14 12 10 1 15 13 11 9 C3 7 50 52 54 56 5 49 51 53 55 3 18 20 22 24 1 17 19 21 23 C4 7 64 62 60 58 5 63 61 59 57 3 32 30 28 26 1 31 29 27 25 CPZ, cooling pad zone; PCPZ, proximal cooling pad zone; PEFZ, proximal exhaust fan zone; EFZ, exhaust fan zone. C1, first column; C2, second column; C3, third column; C4, fourth column (numbered sequentially from the henhouse wall). Temperature (T) was recorded daily at 6:00, 12:00, and 18:00 hours at each measurement location, and the mean temperature at each location was recorded and computed as the representative final value. The values of T were then sorted in descending order. Measurement locations 10, 41, and 42, with the highest average temperatures (32.17 ± 0.07 °C), were designated as the chronic heat stress (CHS) group, whereas measurement locations 33, 34, and 47, with the lowest average temperatures (27.60 ± 0.13 °C), were designated as the control (CON) group. The production performance of laying hens was recorded daily for both the CHS and CON groups. Finally, eggs and blood samples were collected, and the birds were humanely euthanized by cervical dislocation to obtain pituitary and liver tissues for subsequent analysis.
Measurement of the production performance and egg quality characteristics
-
The daily production performance of laying hens (including hen-day egg production, mortality, and defective eggs) was monitored at each measurement location. In total, 60 eggs were manually collected from the CHS and CON groups, with 20 qualified eggs per measurement location, before the completion of the experiment, to evaluate egg quality characteristics. Subsequently, egg weight, yolk color, albumen height, and Haugh unit values were measured using an egg analyzer (EA-01, Tenovo International Co., Ltd., Beijing, China) following the manufacturer's instructions. Shell color was assessed using a reflectance measuring device (PRS-Evans Electroselenium Ltd., Halstead, Essex). Readings were recorded at the top, middle, and bottom portions of each egg, and their average was used to indicate the overall shell coloration. Eggshell thickness was measured at the appropriate positions using a digital shell thickness gauge (ESTG-1, ORKA Food Technology Co., Ltd., Ramat Hasharon, Israel). The egg dimensions (length and width) were determined with a high-precision vernier caliper (DL91150, Deli Group Ltd., Ningbo, China), and the shape index was subsequently computed. Finally, the yolk was carefully isolated and immediately weighed.
Determination of serum biochemical indicators and antibody titers
-
Approximately 3 mL of blood was collected from the brachial vein of each bird (15 individuals per group). Immediately after collection, the samples were centrifuged at 4,000 rpm for 10 min, and the supernatants were gently pipetted into fresh microcentrifuge tubes for the analysis of serum biochemical indicators and antibody titers, following the method described by Li et al.[22]. Serum biochemical indicators comprised FSH, LH, heat shock protein 70 (HSP70), and cortisol (CORT), whereas antibody titers were assessed for the H5 (Re-13 and Re-14), H7, and H9 subtypes of avian influenza virus (AIV), as well as Newcastle disease virus (NDV).
-
Prior to the end of the experiment, pituitary and liver tissues were harvested from seven randomly selected hens in each group. All of the samples were snap-frozen in liquid nitrogen and subsequently delivered to OE Biotech Co., Ltd. (Shanghai, China) for RNA sequencing (RNA-seq).
RNA-seq library constructions and analysis
-
Total RNA was isolated from the pituitary and liver samples using RNA extraction kits (Takara Biotechnology Co., Ltd., Dalian, China). The purity and concentration of RNA was assessed with a NanoDrop 2000 system (Thermo Fisher Scientific, Wilmington, USA). Transcriptome libraries were prepared and subjected to high-throughput sequencing on the Illumina NovaSeq 6000 system (OE Biotech Co., Ltd., Shanghai, China). The sequencing process produced 150-bp paired-end reads, yielding approximately 49 million raw reads for each sample. The clean reads were then mapped to the Gallus gallus reference genome (NCBI accession: GCF_000002315.6_GRCg6a) using HISAT2 (v2.0.4), a splice-aware alignment tool based on hierarchical indexing.
Identification of differentially expressed genes and functional enrichment analysis
-
Differentially expressed genes (DEGs) between the two groups were identified through a multi-step bioinformatics workflow. Gene expression levels were first quantified using the RPKM (reads per kilobase of transcript per million mapped reads) method. DEG identification was subsequently carried out with the DESeq2 package in R, applying the significance thresholds of p < 0.05 and |log2(fold change)| > 1. Functional annotation and pathway enrichment analyses of the DEGs were conducted based on the Gene Ontology (GO) and Kyoto Encyclopedia of Genes and Genomes (KEGG) databases. The statistical significance of enrichment was evaluated using the Benjamini–Hochberg-adjusted Fisher's exact test, and GO terms or KEGG pathways with an adjusted p-value ≤ 0.05 were regarded as significantly enriched.
Validation via quantitative polymerase chain reaction
-
To validate the accuracy of the RNA-seq data, six representative genes was randomly chosen from each group for quantitative polymerase chain reaction (qPCR) analysis. The primer sequences applied in this study are presented in Table 2. The qPCR analyses were carried out with M5 HiPer qPCR SuperMix (Mei5bio, Beijing, China) on the Roche LightCycler system (Mannheim, Germany). Each 20-µL reaction mixture consisted of 2 µL of the cDNA template, 7.0 µL of nuclease-free water, 10 µL of the aforementioned Super Mix, and 0.5 µL each of forward and reverse gene-specific primers. The amplification program followed the protocol previously described by Li et al. Each sample was assayed in triplicate. Relative mRNA expression was quantified by the 2−ΔΔCᴛ method, with normalization to β-actin as the endogenous control.
Table 2. Details of the target genes and the corresponding primer sequences used in qPCR.
Target gene GenBank number Primer sequence (5'–3') T (°C) Product size (bp) FAM19A1 XM_046926508.1 F: GCTCTGCTCTTGGCTGGATTAC 58.52 129 R: GCTGCTGGAAAGTGTGATGGAG 58.92 129 RSPH1 XM_040659723.2 F: TGTTGGTGGTTGGGTAAATGGAATC 57.46 108 R:TTGCCACGACCTACAGGAGTTC 59.47 108 CIDEA NM_001195123.2 F: CATCTGCCTCTGAACCACATACATC 57.56 104 R: TTCTACAGGAACACCATTGGAAACTAC 56.28 104 CIDEC XM_046925330.1 F: TGGAGACGGAGGCTTTCTTCTG 59.3 130 R: CGGCGGGACGGCTTGTG 64.34 130 DMRT2 XM_046936552.1 F: ACCGCCCTATTCCAGCAGATG 60.08 118 R: AGCATAATGTTCTCCAACTCCTTATCG 56.2 118 DYL2 XM_040684994.2 F: AGGGAGTTTGACAGGCGGTAC 59.84 102 R: GTAGGCGAAGATGAAGTGGTTGG 58.21 102 COQ10B NM_001389593.2 F: CCAAGGAGGCAACTACATACTACAC 57.07 116 R: GCTGTGGGAGGAGGGAGAATG 60.73 116 GADD45B XM_046933968.1 F: GGACGGATTCGGCTGAACATC 58.9 106 R: TCCCAGCGGCTCCAATGC 62.21 106 LOC416655 XM_040684134.2 F: AGAAGAGGAGGAGGAGGAGGATG 59.92 109 R: CAGGAGCCGCAGTGTGGTC 62.49 109 RHOBTB1 XM_046920122.1 F: TTACAAGGCAAGCAAGCGACAG 58.38 119 R: ATCACTGACCAAGAATTAAGGAGACTG 55.95 119 C9ORF152 XM_046910132.1 F: GATCAACCTGTCTCCTATTAGCCAAG 56.84 100 R: TGCAGTCCAACATCTTCCTTACAAC 57.08 100 LOC112532115 XR_005848662.1 F: TGTCCATTCCTGCTCCTCTTCTC 58.73 109 R: TGCACACGTCTGGTCCATCC 60.62 109 β-actin NM_205518.1 F: TATTGCTGCGCTCGTTGTTG 56.39 127 R: ACCAACCATCACACCCTGAT 56.34 127 Determination of environmental parameters and preliminary analysis of their relationship with laying rate
-
To evaluate the effects of microenvironmental factors on the laying rate, a series of environmental variables, including T, RH, AV, light intensity (LI), ammonia (NH3), carbon dioxide (CO2), and PM2.5, were monitored three times daily. Measurements were taken at 06:00, 12:00, and 18:00 houtd using an intelligent monitoring system co-developed by the Anhui Academy of Agricultural Sciences and the Chinese Academy of Sciences. This system integrates a multi-parameter sensor (CG-01 type, Hefei Hengfu Electronic Technology Co., Ltd., China) for T, RH, LI, and CO2; an AV sensor (TM-FS type, DELTA, Italy); an NH3 sensor (TM-AQ, Handan Yimeng Electronics Co., Ltd., China); and a PM2.5 sensor (JXBS-3001-PM2.5, Weihai Jingxun Changtong Electronic Technology Co., Ltd., China). The mean of three measurements for each parameter was used for further analysis. Finally, the preliminary relationships between the environmental factors and the laying rate were analyzed using correlation analysis.
Construction and evaluation of the laying rate prediction model
-
To gain deeper insight into the underlying relationship between the environmental variables and the laying rate, and to improve the predictive accuracy, a RFR-based multivariate predictive model was developed. The modeling workflow primarily involved three key steps: Dataset partitioning, model parameterization, and model evaluation. A detailed description is presented below.
Dataset partitioning
-
The dataset was randomly divided at the outset into a training subset (accounting for 70%) and a testing subset (accounting for 30%). Input variables comprised T, RH, AV, LI, NH3, CO2, and PM2.5, with the laying rate defined as the output variable. The model was executed in MATLAB R2019a software (Mathworks Inc., Matick, MA).
Model parametrization
-
The RFR model was constructed using the TreeBagger function, with key parameters such as the number of trees and minimum leaf size carefully optimized and adjusted as needed during training. This algorithm integrates the outputs of multiple decision trees, each trained on different subsets of the dataset, to enhance the predictions' stability and accuracy. After several rounds of tuning, the final configuration was determined as follows: Number of trees = 300; minimum leaf size = 1. Regression was selected as the prediction mode.
Model evaluation
-
The model's performance was evaluated using four metrics: The coefficient of determination (R2), MSE (mean square error), root mean square error (RMSE), and mean absolute error (MAE). The specific formulations of these indices were provided in Li et al.[22]. Given the inherent randomness of the random forest algorithm, the model was executed multiple times (no fewer than 10), and the best-performing result was retained.
Statistical analysis
-
Statistical analyses were performed with OriginPro version 8.0 (OriginLab Corp., Northampton, MA, USA), and the independent-sample t-test was applied to assess differences among groups. The laying rate prediction model was developed using the TreeBagger algorithm in MATLAB R2019a. The results are presented as the mean ± standard error (SE), and significance was set at p < 0.05.
-
Figure 2 demonstrates that the thermal conditions differed substantially among sampling locations, with recorded temperatures ranging from 26.43 to 32.85 °C. Notably, Locations 10, 41, and 42 showed the highest temperature readings, whereas Locations 33, 34, and 47 displayed the lowest. To further investigate the potential mechanisms, we established the CHS group (32.17 ± 0.07 °C) and the CON group (27.60 ± 0.13 °C).
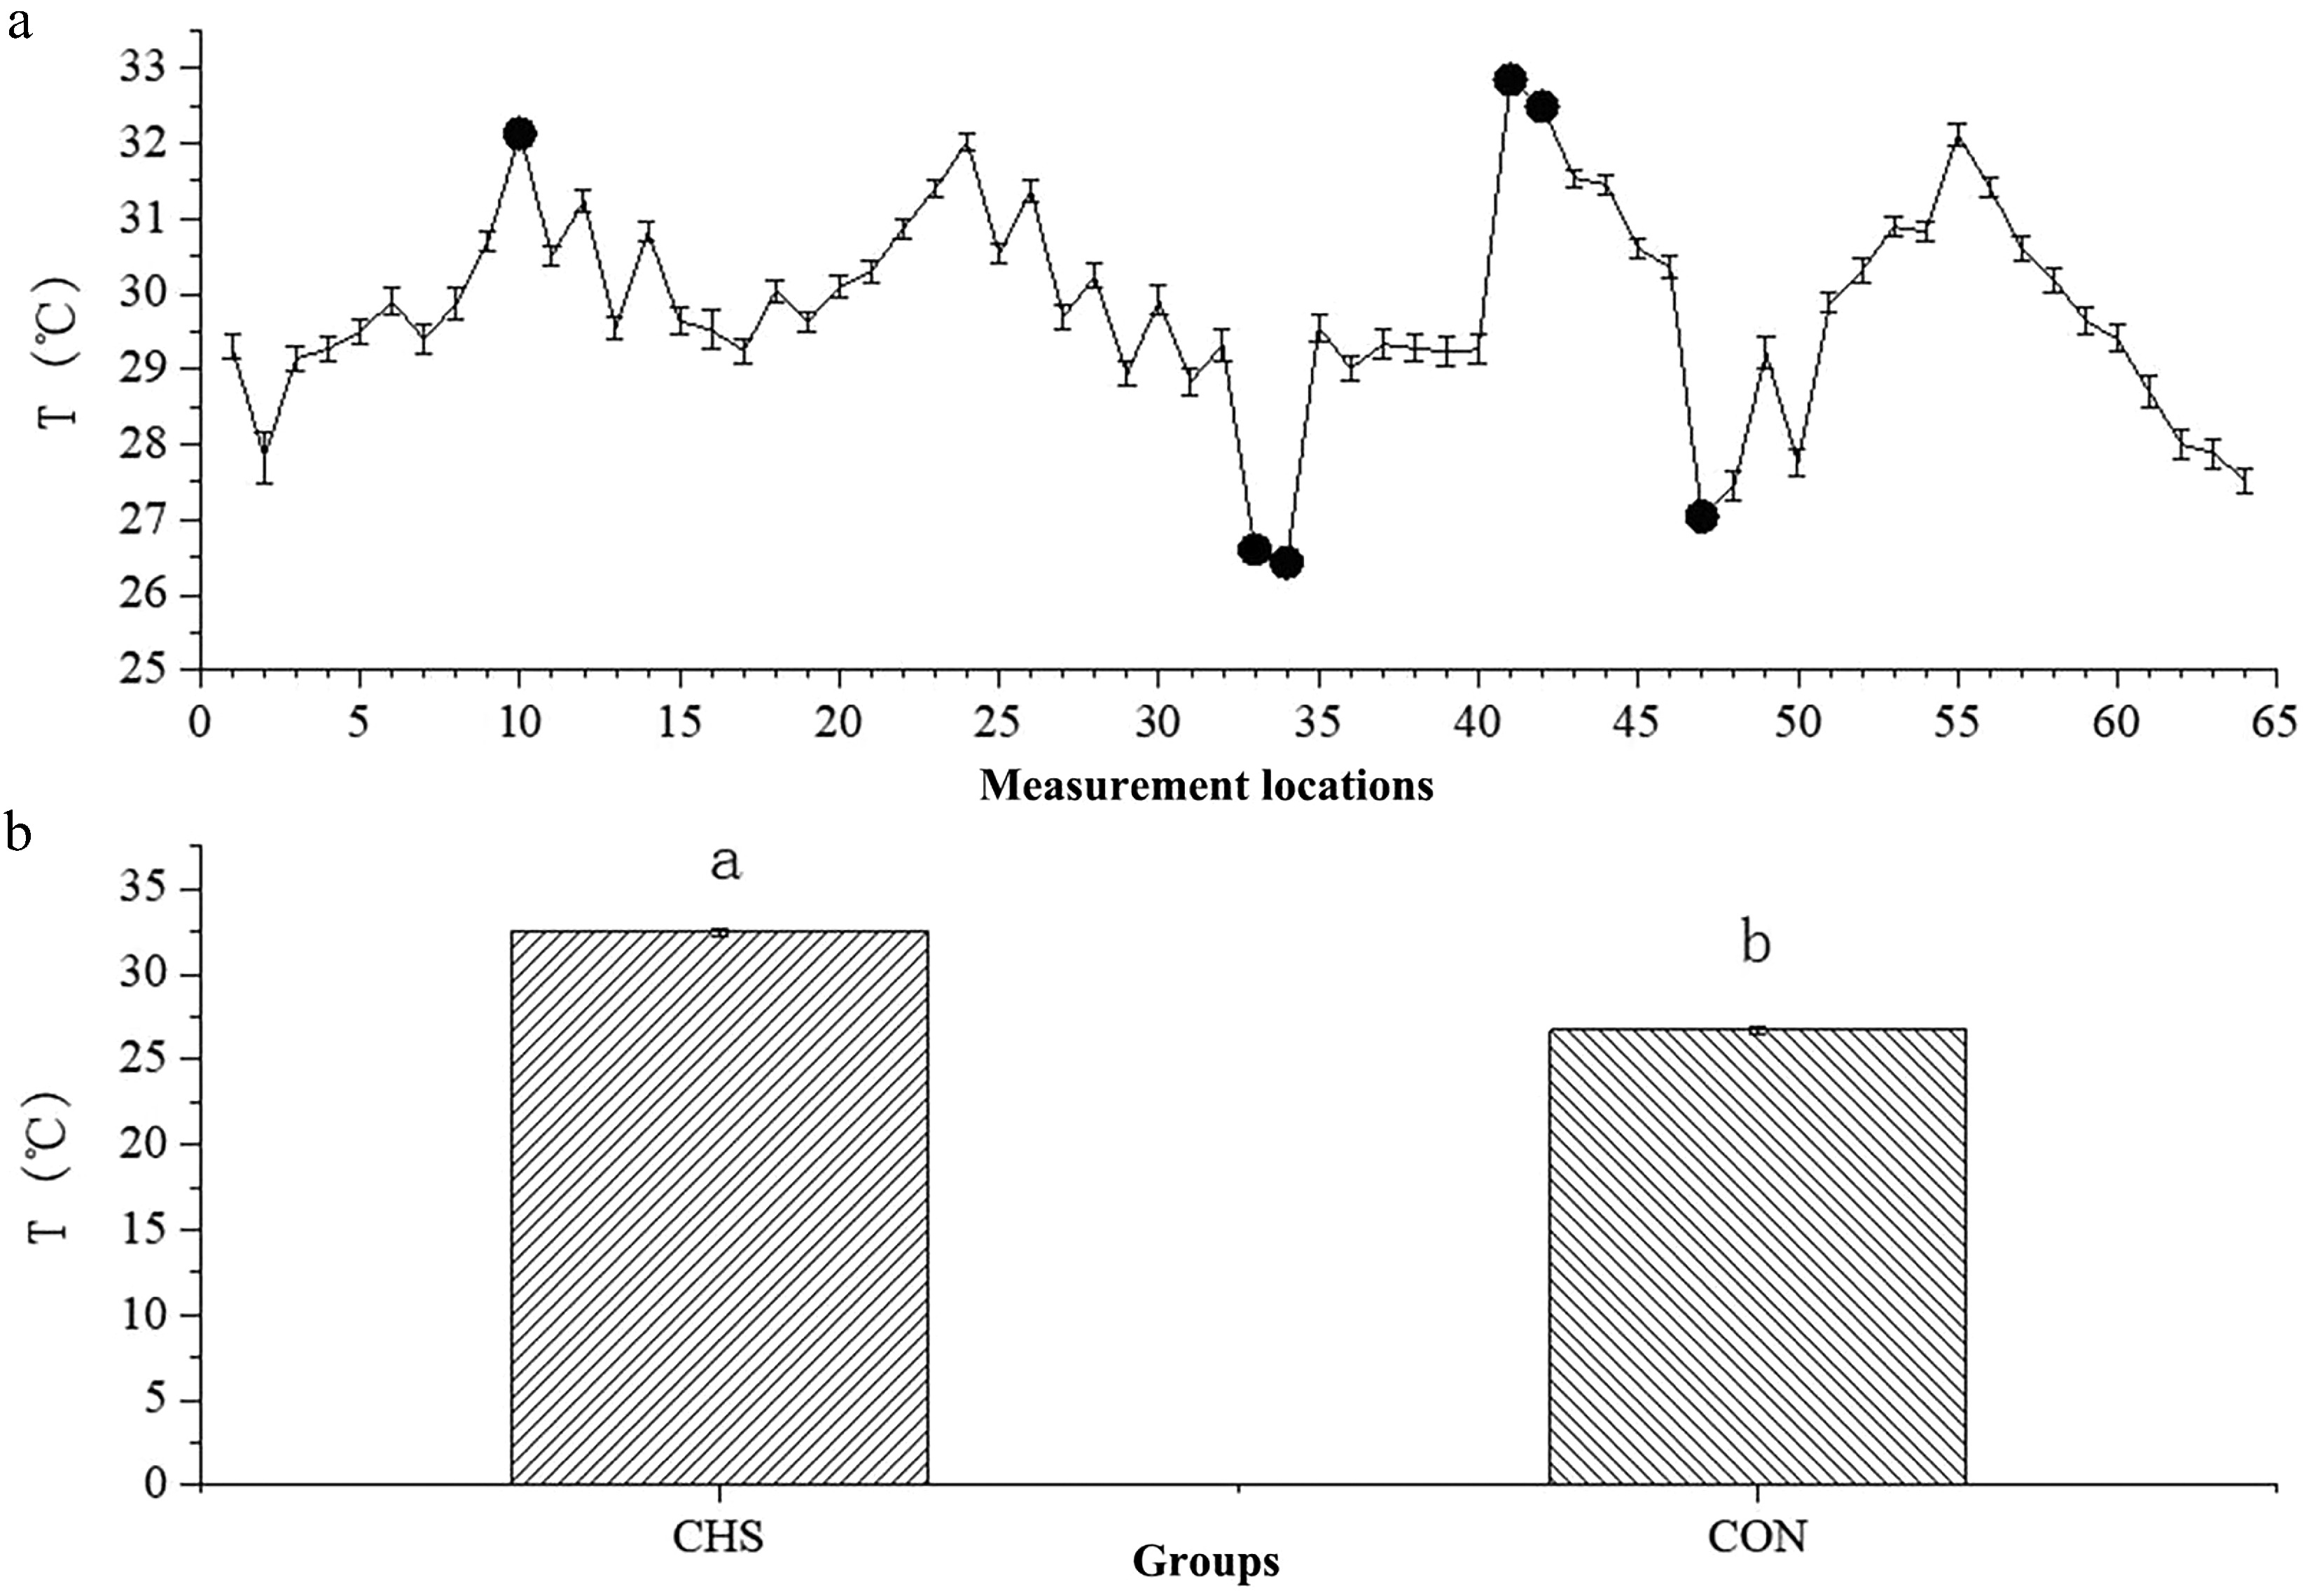
Figure 2.
Average temperatures at different measurement locations (a) and between the CHS and CON groups (b). (a) The x-axis denotes the sequential order of the 64 sampling locations, whereas the y-axis depicts the temperature measurements obtained at each location. Highlighted points indicate sites selected for further investigation. (b) A comparison of the average temperatures between the CHS and CON groups. Abbreviations: CHS, chronic heat stress group; CON, control group.
Production performance and egg quality
-
Compared with the CON group, the CHS group exhibited significant reductions in body weight, laying rate, egg weight, eggshell quality traits, including shell thickness and strength, and yolk weight (p < 0.05, Table 3). Conversely, the CHS group showed elevated albumen height and Haugh unit values relative to the CON group (p < 0.05, Table 3).
Table 3. Comparison of production performances and egg quality between the CHS and CON groups.
Performances CHS group CON group p-Value Body weight (g) 1,629.32 ± 45.06b 1,836.52 ± 39.99a 0.002 Laying rate (%) 67.80 ± 1.18b 86.53 ± 1.11a < 0.001 Egg weight (g) 53.77 ± 0.27b 61.16 ± 0.16a < 0.001 Egg shape index (mm:mm) 1.33 ± 0.01 1.31 ± 0.01 0.056 Shell color 47.92 ± 0.93 48.94 ± 0.78 0.403 Shell thickness (mm) 0.31 ± 0.01b 0.35 ± 0.00a < 0.001 Shell strength (kg/cm2) 3.50 ± 0.12b 4.44 ± 0.09a < 0.001 Yolk weight (g) 14.09 ± 0.35b 16.99 ± 0.24a < 0.001 Yolk color 10.98 ± 0.15 11.20 ± 0.16 0.309 Albumen height (mm) 6.57 ± 0.18a 6.07 ± 0.17b 0.043 Haugh units 81.73 ± 1.23a 75.13 ± 1.70b 0.003 CHS group, chronic heat stress group; CON group, control group. Results within a row with different superscripts differ significantly (p < 0.05) Serum biochemical indicators and antibody titers
-
The CHS group exhibited markedly lower serum FSH and LH levels compared with the CON group (p < 0.05, Table 4), whereas HSP70 and CORT levels showed no significant difference (p > 0.05). Furthermore, the CHS group displayed a pronounced reduction in H5 Re-14 antibody titers (p < 0.05), whereas antibody titers for H5 Re-13, H7, H9, and ND remained statistically unchanged between the CHS and CON groups (p > 0.05).
Table 4. Comparison of biochemical indicators and antibody titers between the CHS and CON groups.
Indicators CHS group CON group p-Value Biochemical indicators FSH (ng/mL) 30.99 ± 0.95b 41.83 ± 3.54a 0.018 LH (pg/mL) 2,965.8 ± 150.41b 3,735.43 ± 185.42a 0.006 HSP 70 (ng/mL) 12.5 ± 1.12 14.62 ± 1.34 0.245 CORT 49.75 ± 6.91 52.07 ± 5.96 0.803 Antibody titers H5 Re-13 (log2) 7.25 ± 0.31 7.89 ± 0.23 0.100 H5 Re-14 (log2) 8.13 ± 0.24b 9.05 ± 0.24a 0.010 H7 (log2) 7.50 ± 0.31 8.20 ± 0.29 0.120 H9 (log2) 9.81 ± 0.26 10.05 ± 0.18 0.460 ND (log2) 7.63 ± 0.35 7.74 ± 0.35 0.820 CHS group, chronic heat stress group; CON group, control group. Results within a row with different superscripts differ significantly (p < 0.05)). -
Raw sequencing data metrics, including raw reads, valid bases, and total mapped reads, are presented in Supplementary Table S1. After data filtering, the average Q30 percentage of high-quality clean data in the pituitary tissues exceeded 96.63%. Each pituitary sample yielded 48.31 million trimmed reads aligned to the reference genome, achieving a mean mapping efficiency of 94.12%. For liver tissues, the average Q30 percentage of high-quality clean data surpassed 96.24%. The sequencing process generated approximately 46.15 million high-quality reads per liver sample, with about 95.97% of these reads accurately mapped to the reference genome.
Analysis of DEGs
-
Compared with the CON group, transcriptomic analysis identified 458 DEGs in the pituitary tissue, comprising 188 upregulated and 270 downregulated genes in the CHS group. In the liver, 267 DEGs were detected, including 109 upregulated and 156 downregulated genes under CHS conditions (Fig. 3).
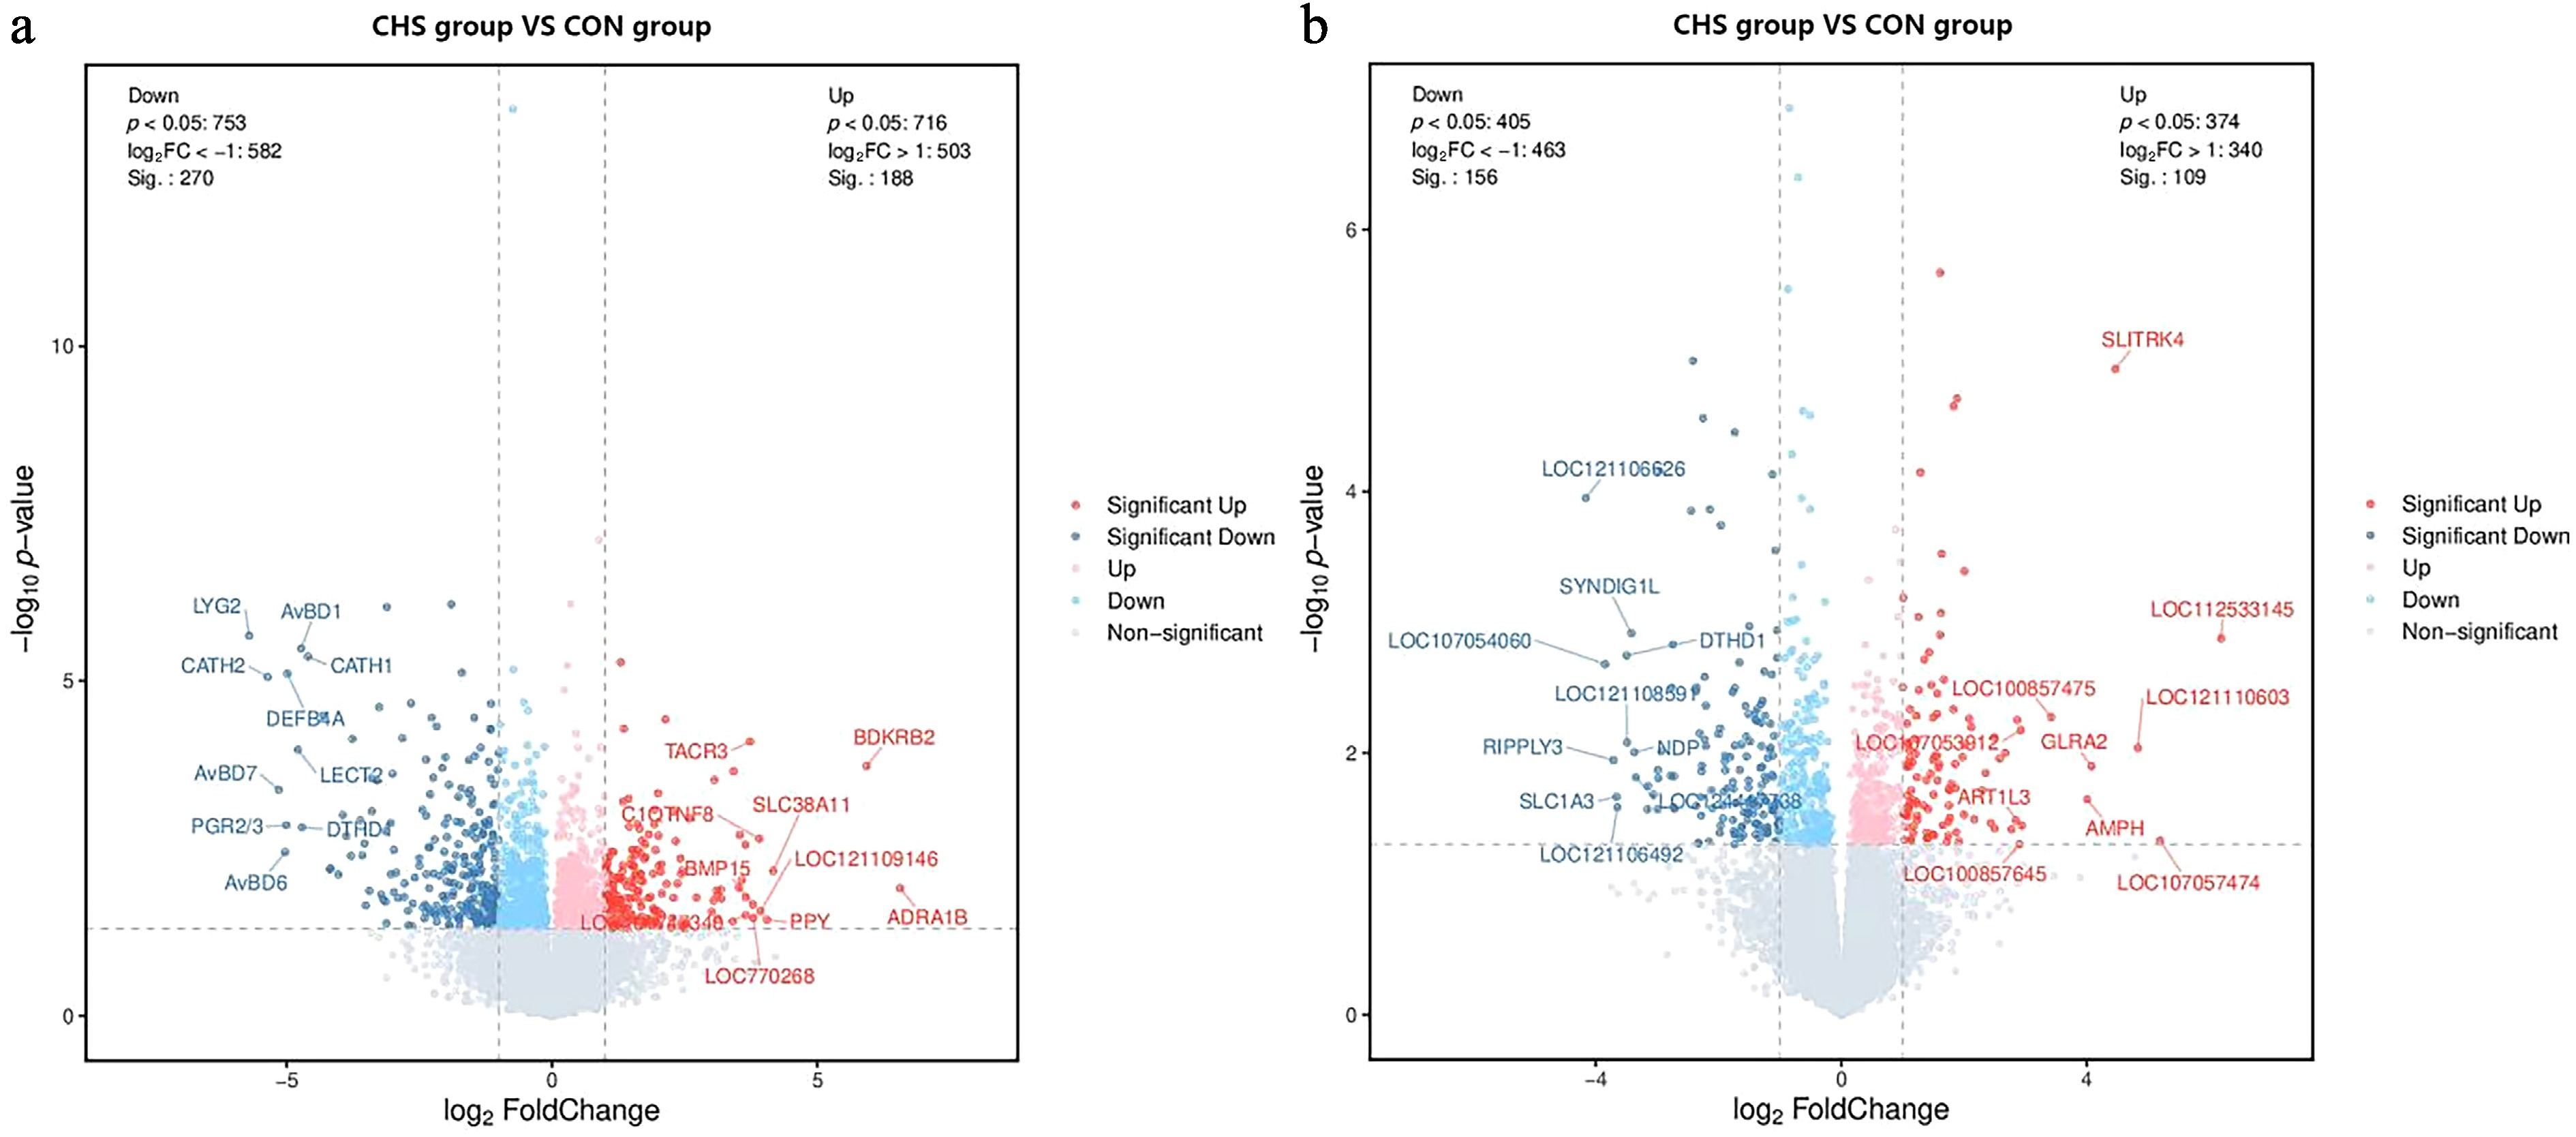
Figure 3.
Volcano plots illustrating differentially expressed genes (DEGs) in the (a) pituitary and (b) liver samples. Red and blue dots denote upregulated and downregulated genes, respectively; gray dots indicate those without significant differential expression.
Functional annotation and pathway enrichment of DEGs
-
To clarify the biological significance of DEGs in pituitary tissue, GO and KEGG enrichment analyses were performed (Fig. 4, Supplementary Tables S2, S3). Among the "biological process" (BP) terms, the five most significantly enriched categories included defense response to bacterium, antimicrobial humoral immune response mediated by antimicrobial peptides, response to fungus, positive regulation of chemokine secretion, and defense response to Gram-negative bacterium (Fig. 4a). With regard to the "cellular component" (CC) classification, DEGs were mainly distributed in the extracellular space, extracellular region, integral components of the plasma membrane, nucleosomes, and receptor complexes. In the "molecular function" (MF) domain, DEGs exhibited significant enrichment in lysozyme activity, CCR6 chemokine receptor binding, chitin binding, hormone activity, and carbohydrate binding (Fig. 4a). Moreover, KEGG pathway analysis revealed notable enrichment in neuroactive ligand–receptor interaction, calcium signaling pathway, nitrogen metabolism, amino sugar and nucleotide sugar metabolism, cytokine–cytokine receptor interaction, steroid hormone biosynthesis, and the one-carbon pool by folate pathway (Fig. 4b).
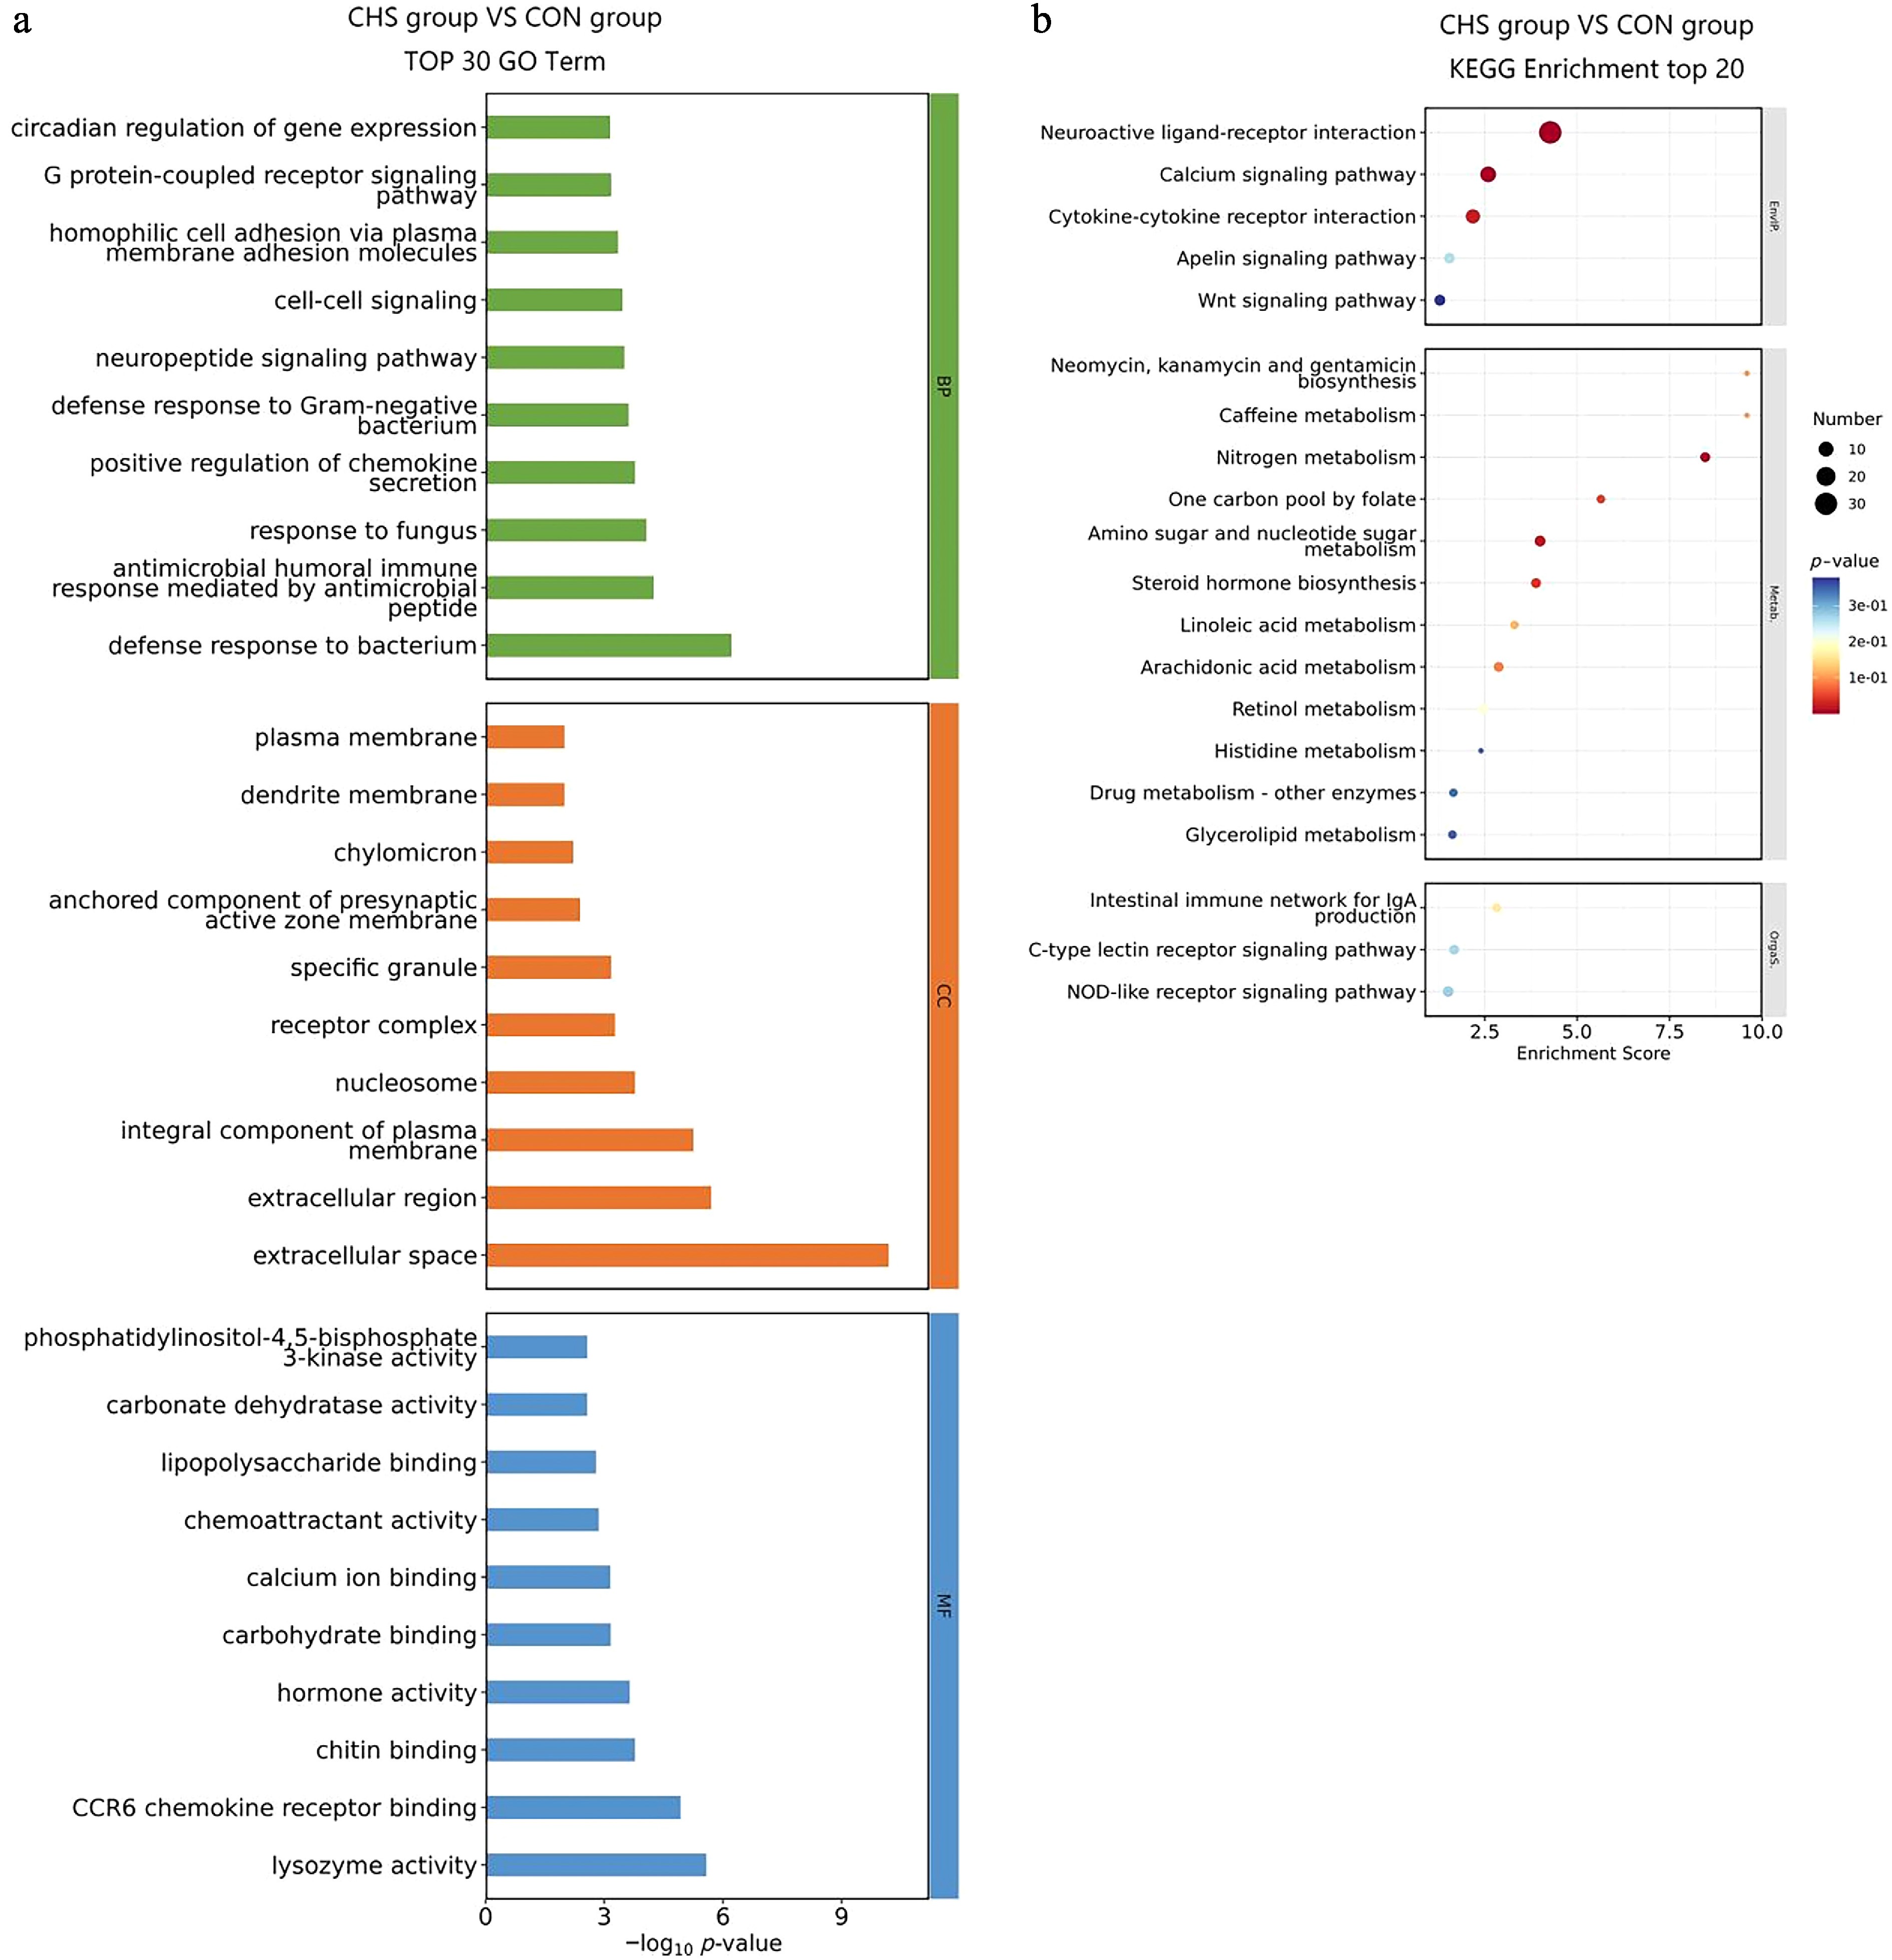
Figure 4.
GO and KEGG enrichment analysis of DEGs in pituitary tissues. (a) Top 30 GO terms of the DEGs. (b) Top 20 significantly enriched KEGG pathways of the DEGs.
Similarly, among the BP terms, the five most significantly enriched categories identified in the liver tissue were triglyceride catabolic process, peripheral nervous system development, cochlea development, cholesterol homeostasis, andsynapse assembly (Fig. 5a). With regard to the CC classification, DEGs were mainly for the chylomicron, high-density lipoprotein particle, synaptic vesicle membrane, very-low-density lipoprotein particle, and perikaryon (Fig. 5a). In the MF domain, DEGs exhibited significant enrichment in symporter activity, cholesterol transporter activity, growth factor activity, L-glutamate transmembrane transporter activity, and calcium ion binding (Fig. 5a, Supplementary Table S4). KEGG pathway analysis demonstrated notable enrichment in the glycerolipid metabolism, peroxisome proliferator-activated receptors (PPAR) signaling pathway, and cell adhesion molecules (Fig. 5b, Supplementary Table S5).
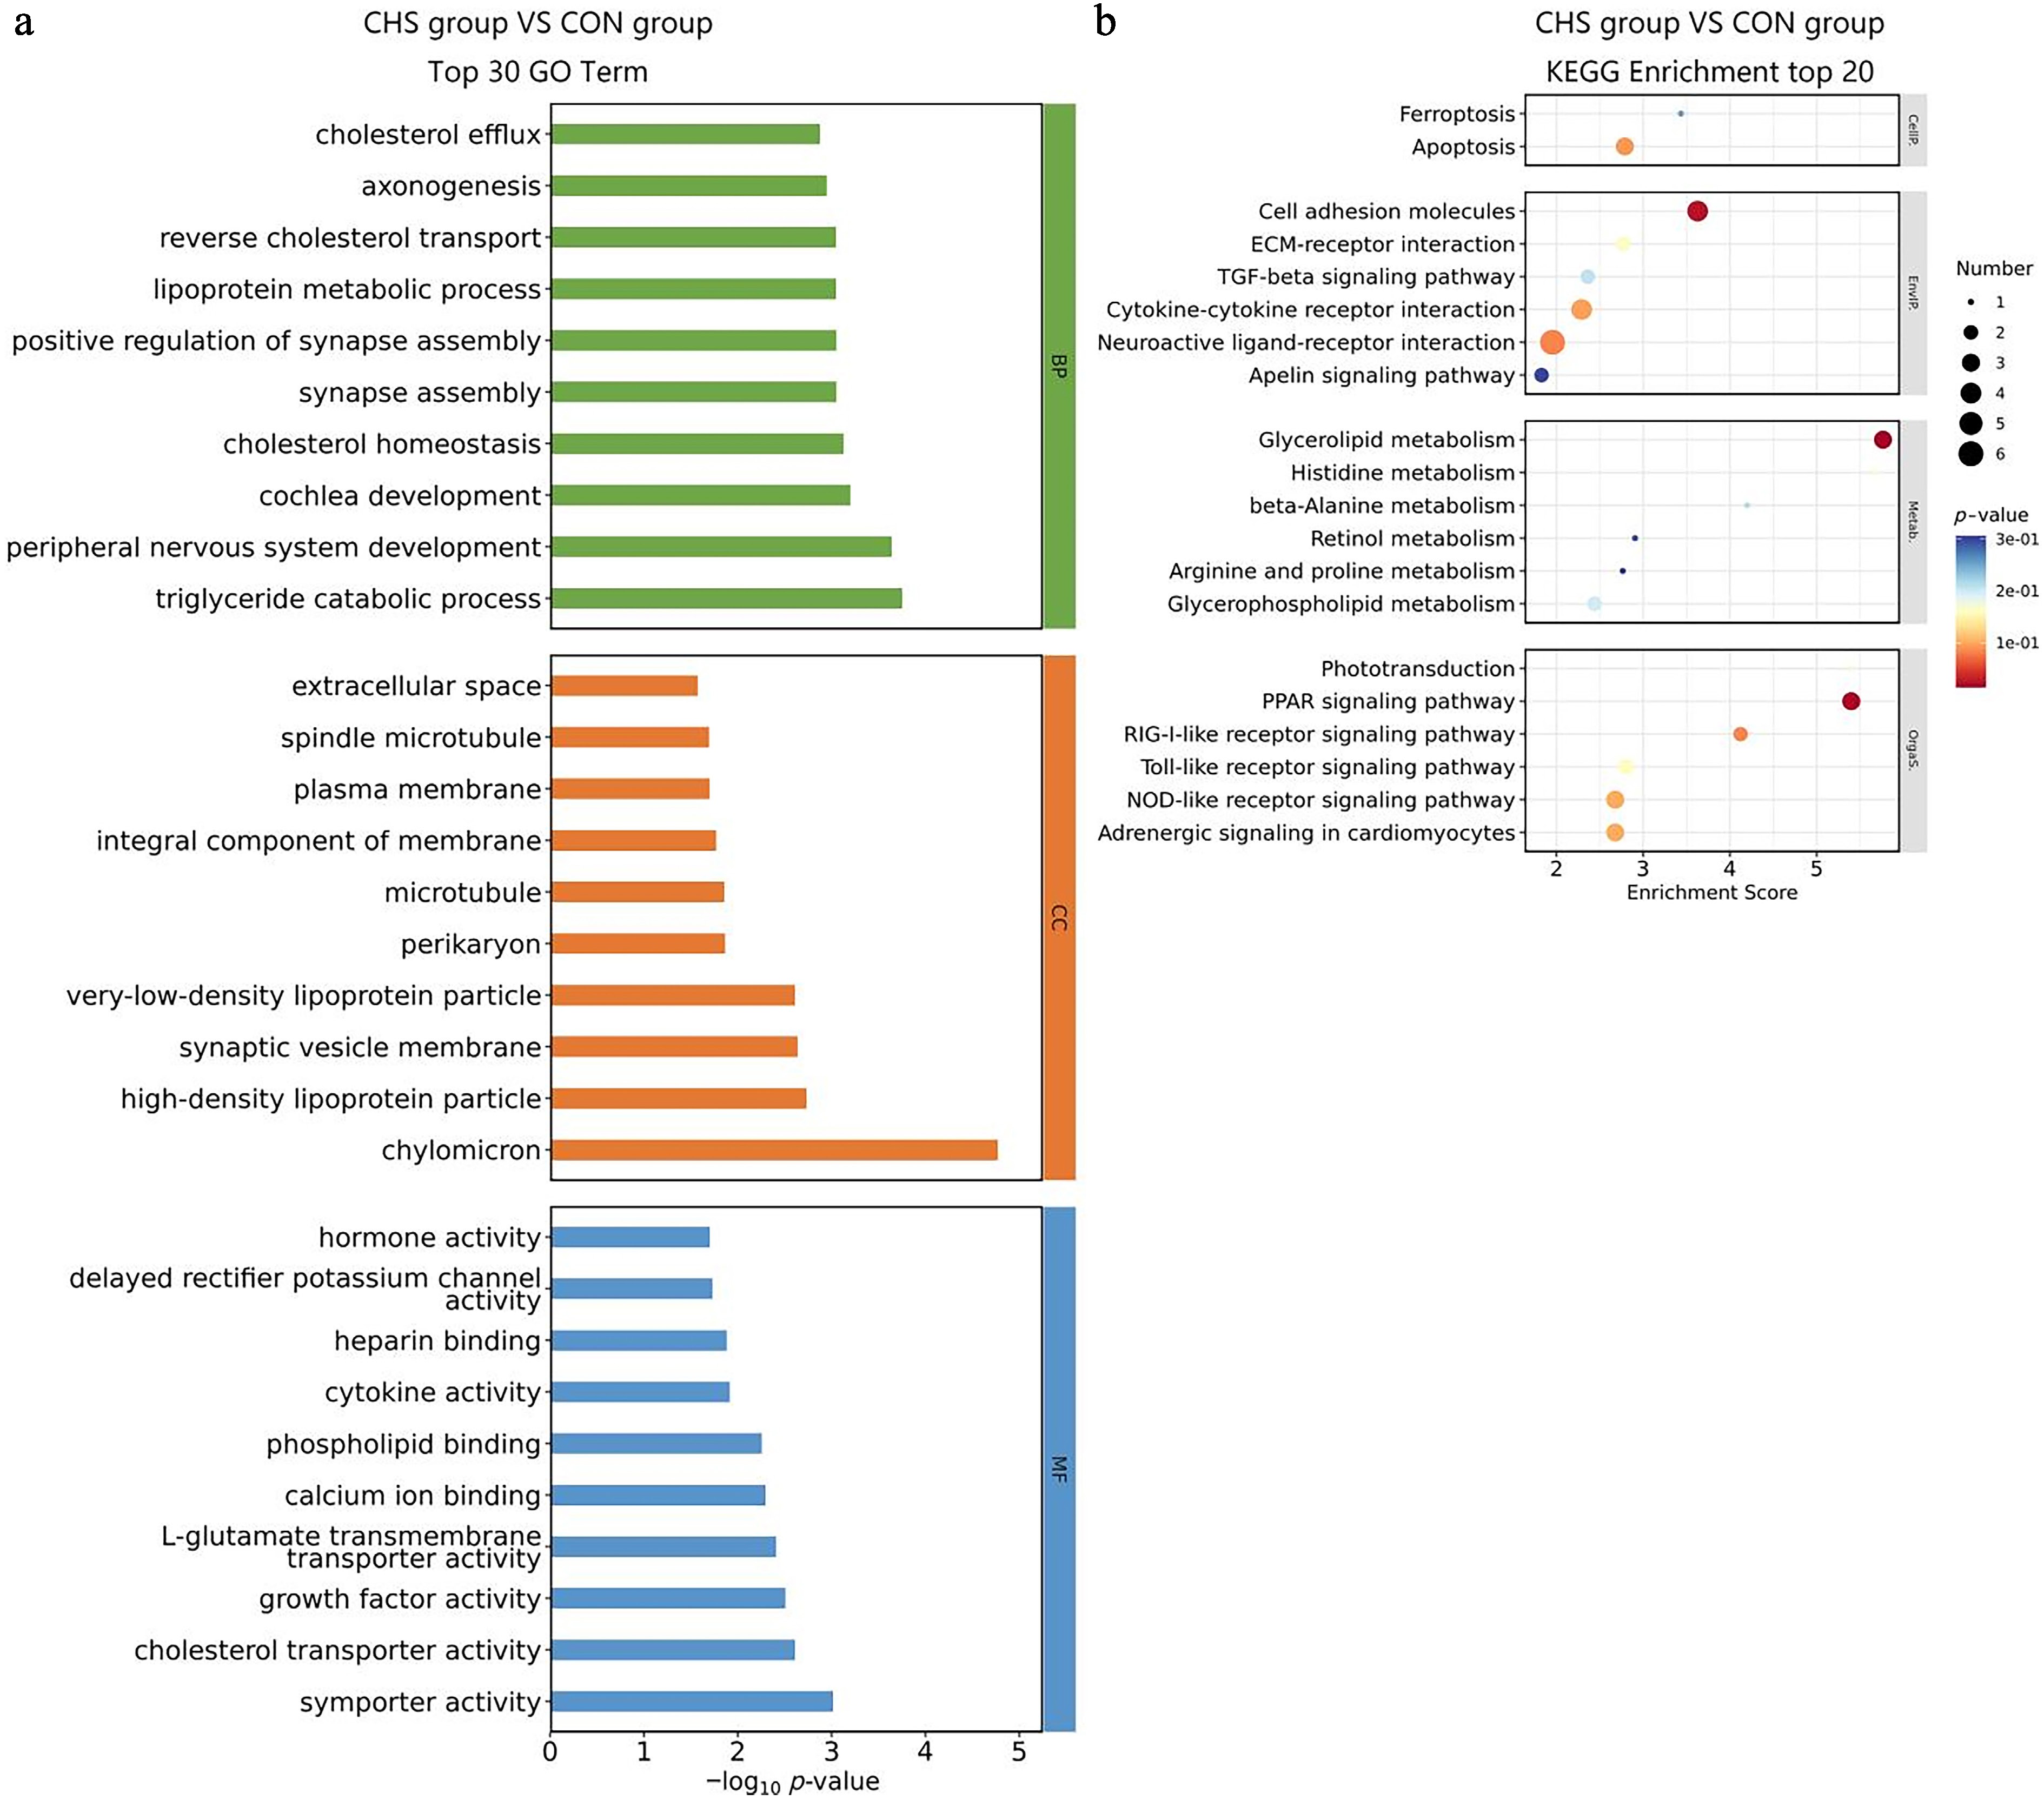
Figure 5.
GO and KEGG enrichment analysis of DEGs in liver tissues. (a) Top 30 GO terms of the DEGs. (b) Top 20 significantly enriched KEGG pathways of the DEGs.
Validation of RNA-seq
-
To validate the RNA-seq results, 12 DEGs (six from pituitary tissue and six from liver tissue) were randomly selected for qPCR analysis using the same samples as RNA-seq. The selected DEGs exhibited the same expression trends in both RNA-seq and qPCR, validating the robustness and reproducibility of the RNA-seq findings (Fig. 6).
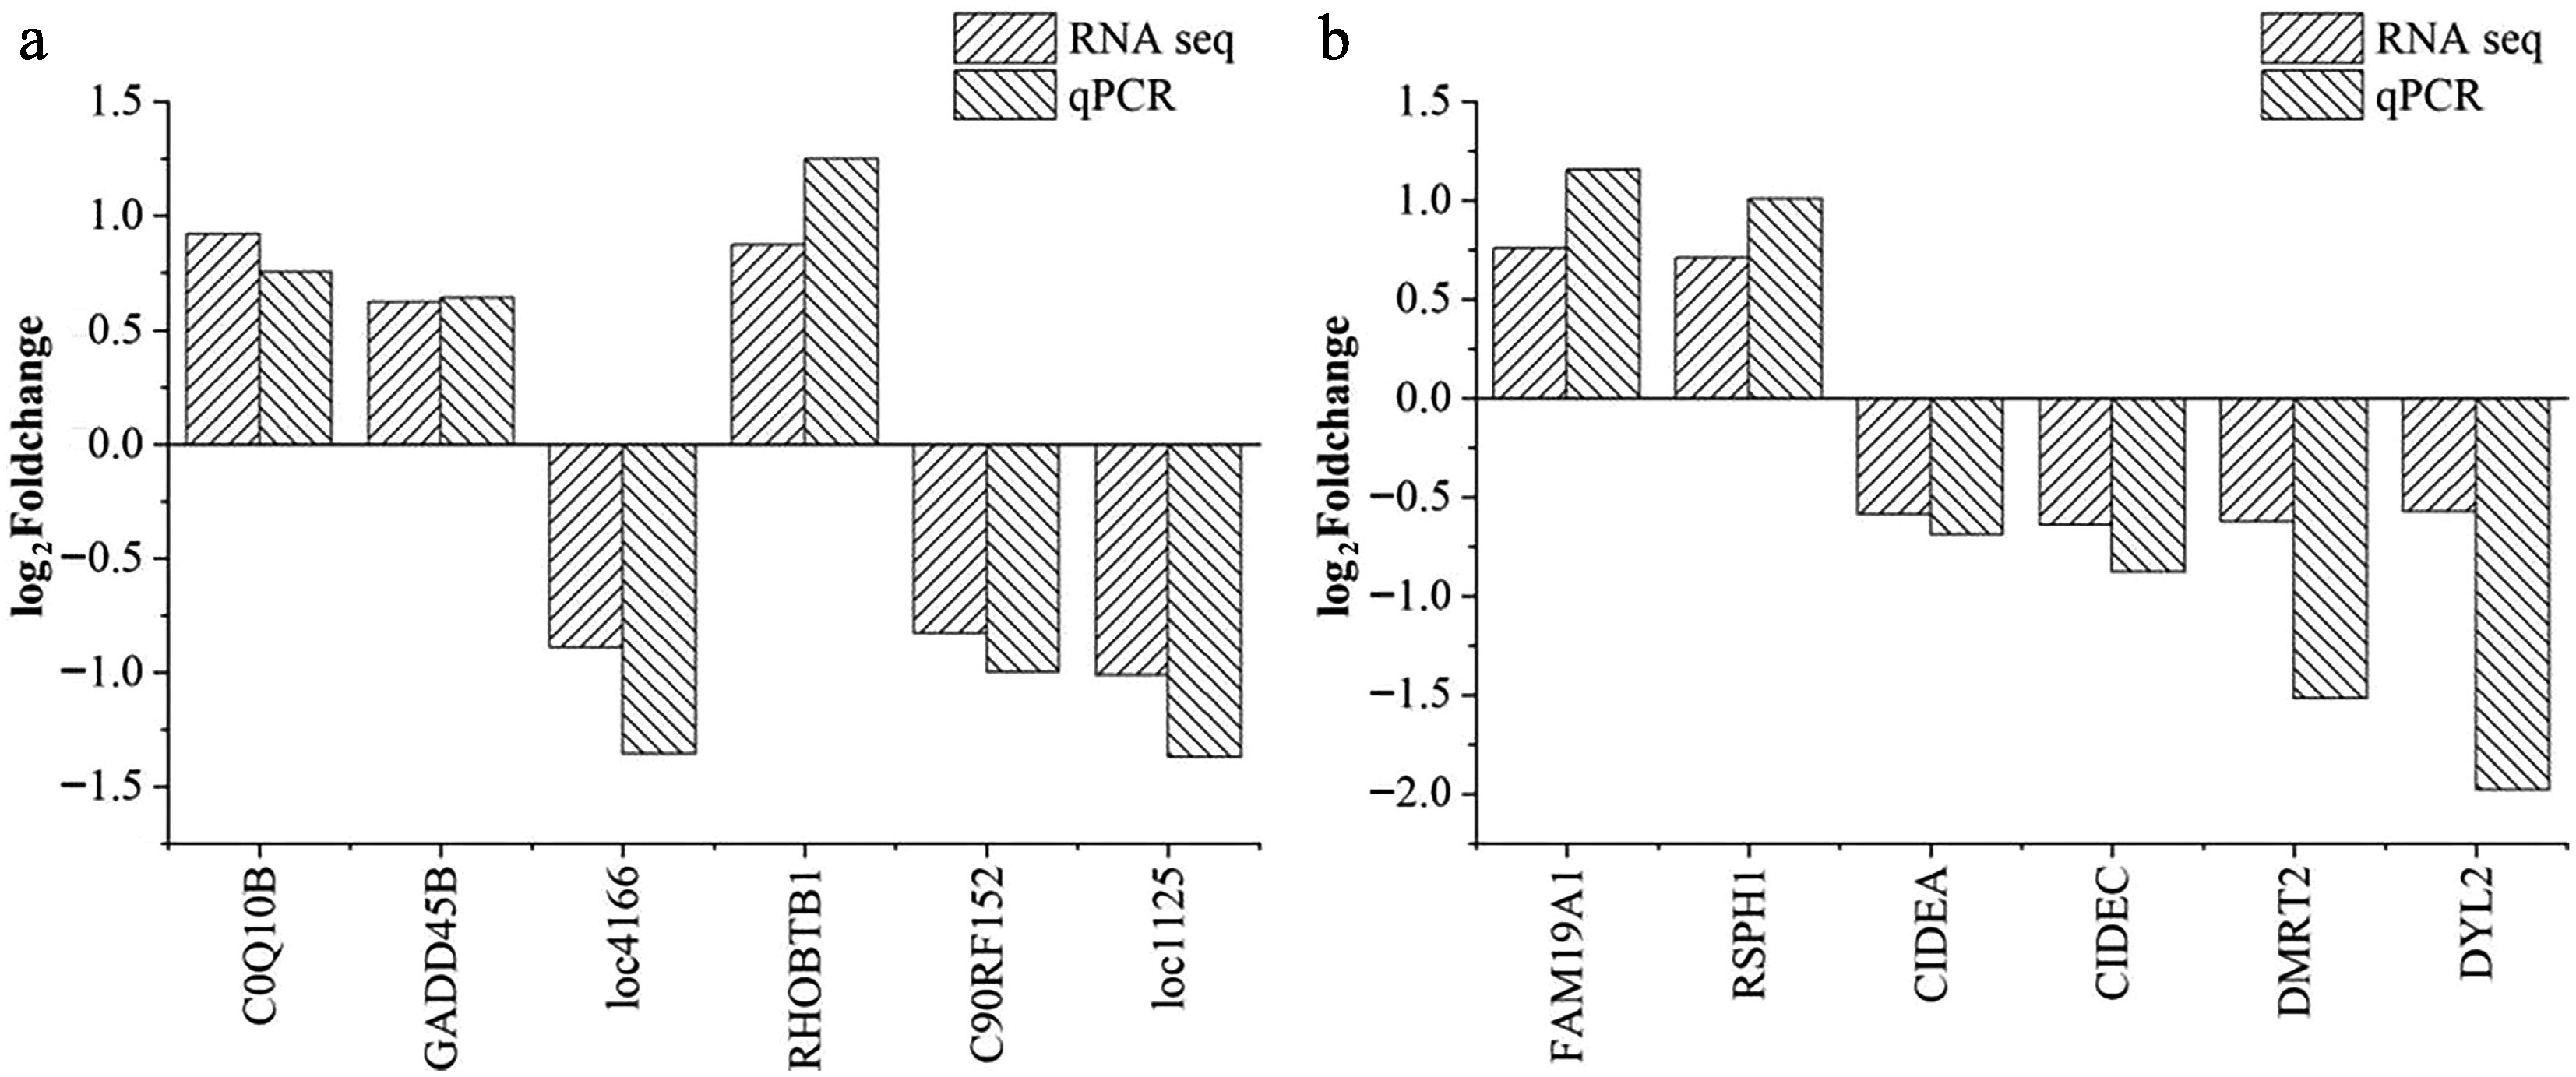
Figure 6.
Validation of the differentially expressed genes in (a) pituitary and (b) liver samples. The horizontal axis indicates the DEGs selected for the qPCR analysis; the vertical axis represents the log2(fold change) values between the CHS and CON groups. Abbreviations: CHS group, chronic heat stress group; CON group, control group.
Correlation between environmental variables and the laying rate
-
Compared with the CON group, the CHS group exhibited elevated levels of AV, LI, NH3, CO2, and PM2.5 (p < 0.05). In contrast, RH was markedly reduced in the CHS group (p < 0.05, Table 5). Correlation analysis indicated that laying rate was negatively correlated with T, AV, NH3, CO2, and PM2.5, but it was positively associated with RH (Table 6).
Table 5. Comparison of the local environment between the CHS and CON groups.
Environmental variables CHS group CON group p-Value T (°C) 32.17 ± 0.07a 27.60 ± 0.13b < 0.001 RH (%) 73.31 ± 0.38b 89.04 ± 0.73a < 0.001 AV (m/s) 1.72 ± 0.03a 1.43 ± 0.06b < 0.001 LI (lx) 8.93 ± 0.27a 8.06 ± 0.26b 0.021 NH3 (mg/m3) 0.97 ± 0.09a 0.24 ± 0.05b < 0.001 CO2 (mg/m3) 2,686.75 ± 17.34a 1,714.74 ± 13.38b < 0.001 PM2.5 (ug/m3) 2.48 ± 0.05a 1.52 ± 0.04b < 0.001 CHS group, chronic heat stress group; CON group, control group. Results within a row with different superscripts differ significantly (p < 0.05). Table 6. Correlation between environmental variables and laying rate.
Perfomance T RH AV LI NH3 CO2 PM2.5 Laying rate −0.65233* 0.55789* −0.27821* −0.07959 −0.16376* −0.6208* −0.52812* The asterisk (*) indicates significant correlation. -
As shown in Fig. 7, the prediction error was highest when a single decision tree was used. With an increasing number of trees, the error gradually decreased. After iterative optimization, the ensemble containing about 300 trees achieved the highest predictive accuracy.
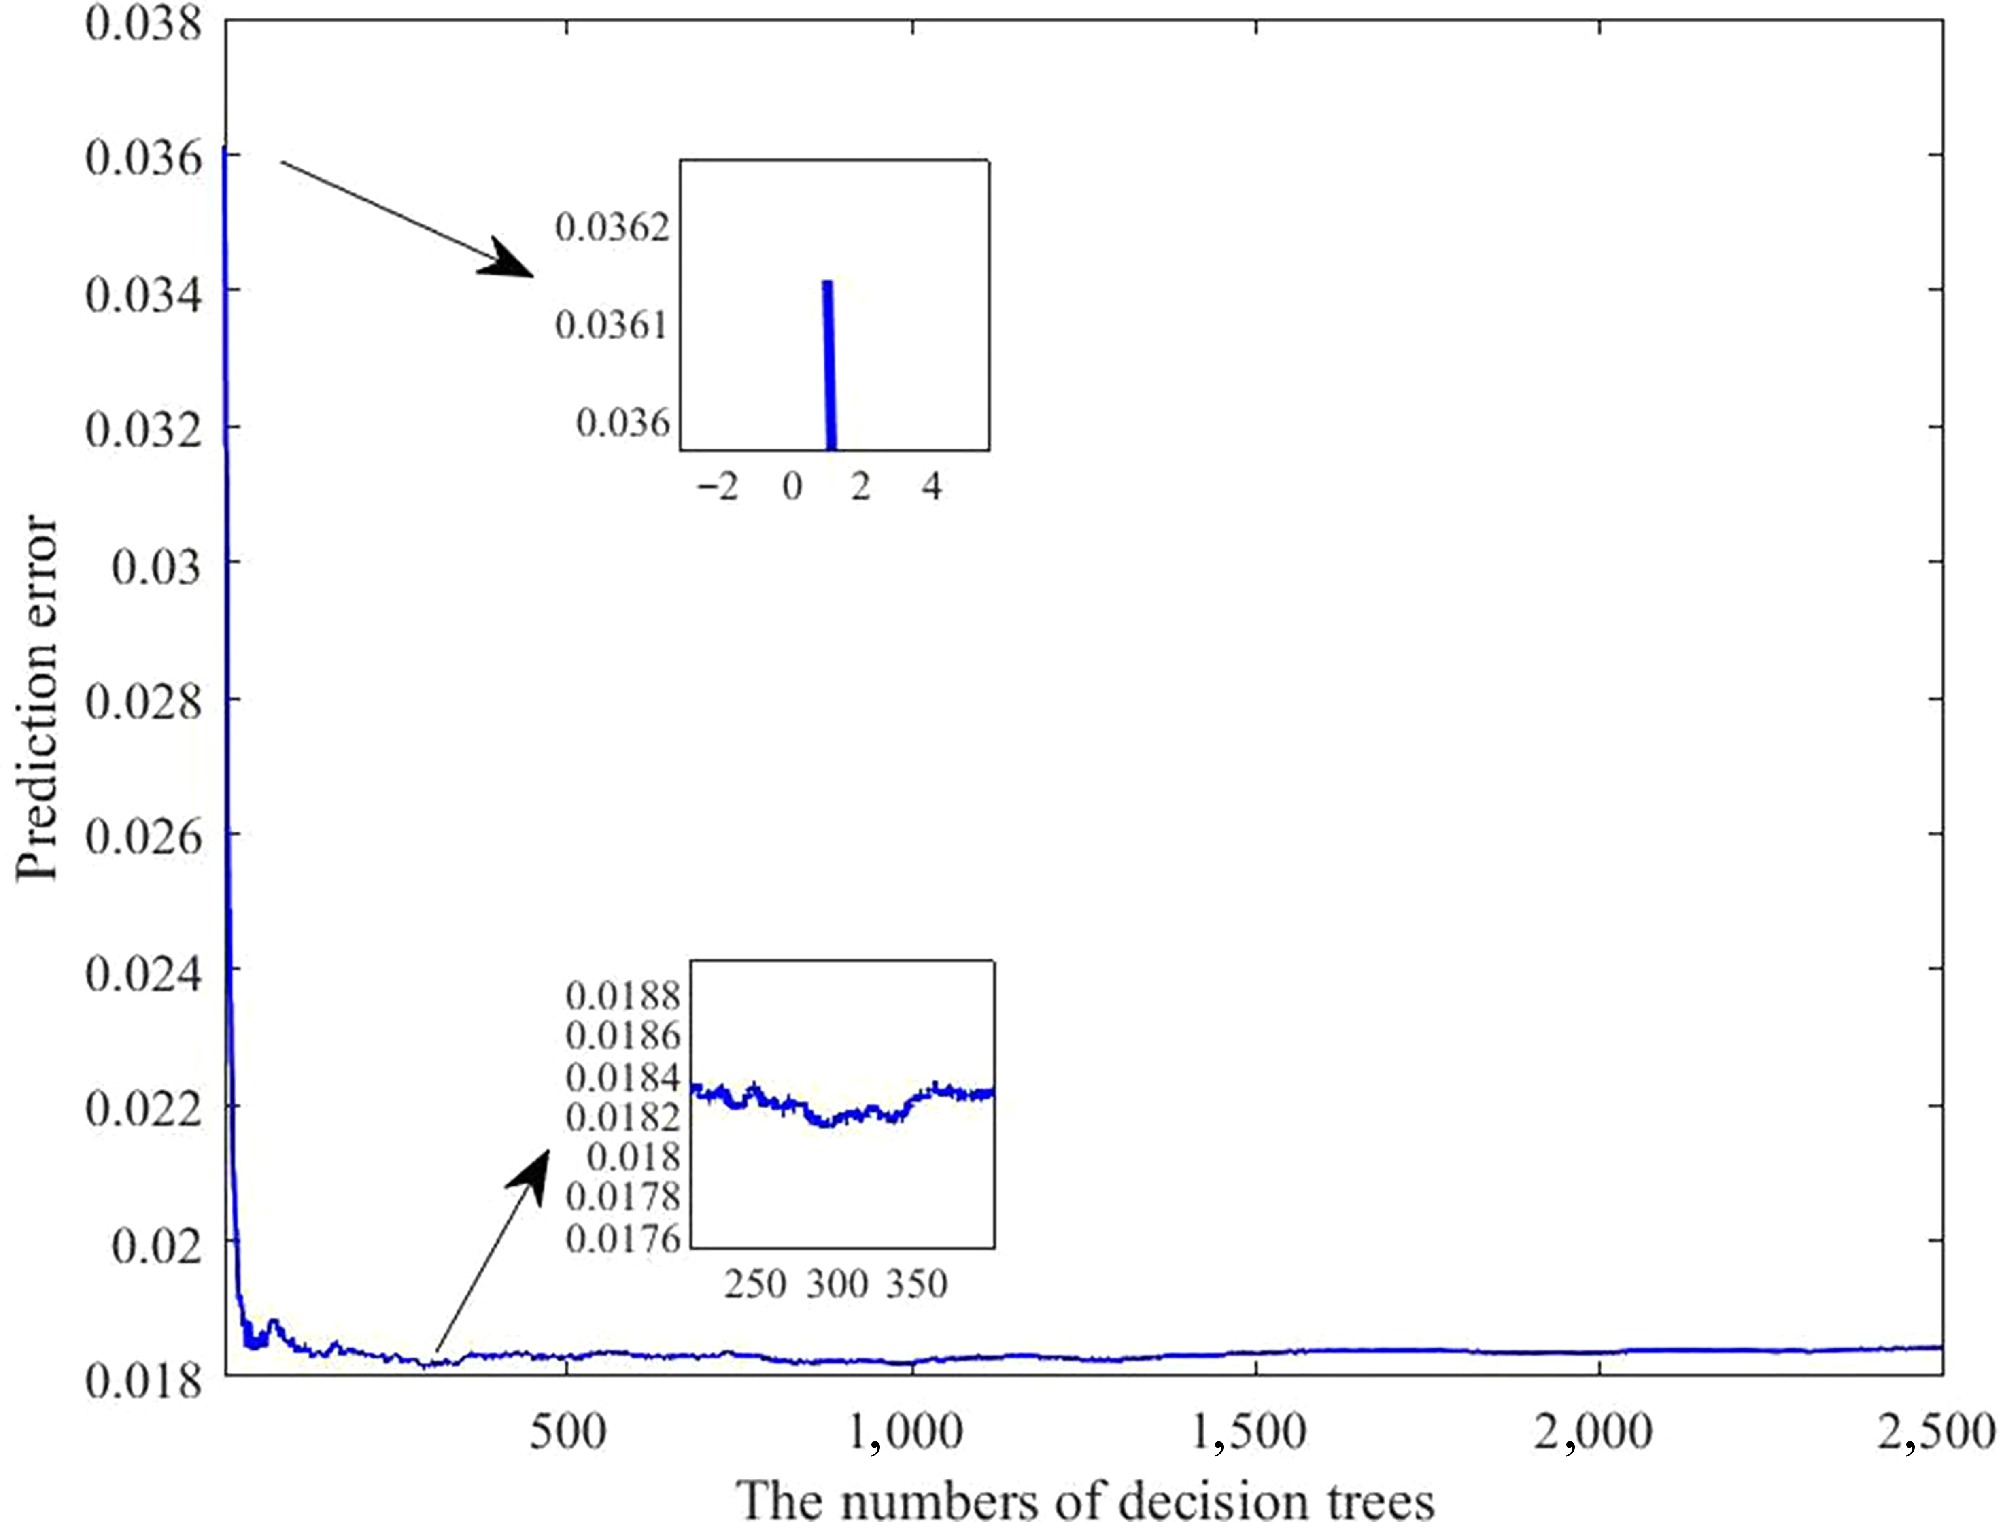
Figure 7.
Error curves of the laying rate prediction model under varying numbers of decision trees. The horizontal axis indicates the number of trees; the vertical axis denotes the prediction error.
Predictive effect of laying rate model
-
The predictive effect and error of the model are presented in Figs. 8 and 9, respectively. The comparison between the predicted and actual values indicated strong consistency, with errors ranging from −11.67% to 11.55%. Moreover, approximately 86.57% of the samples exhibited deviations within 6%.
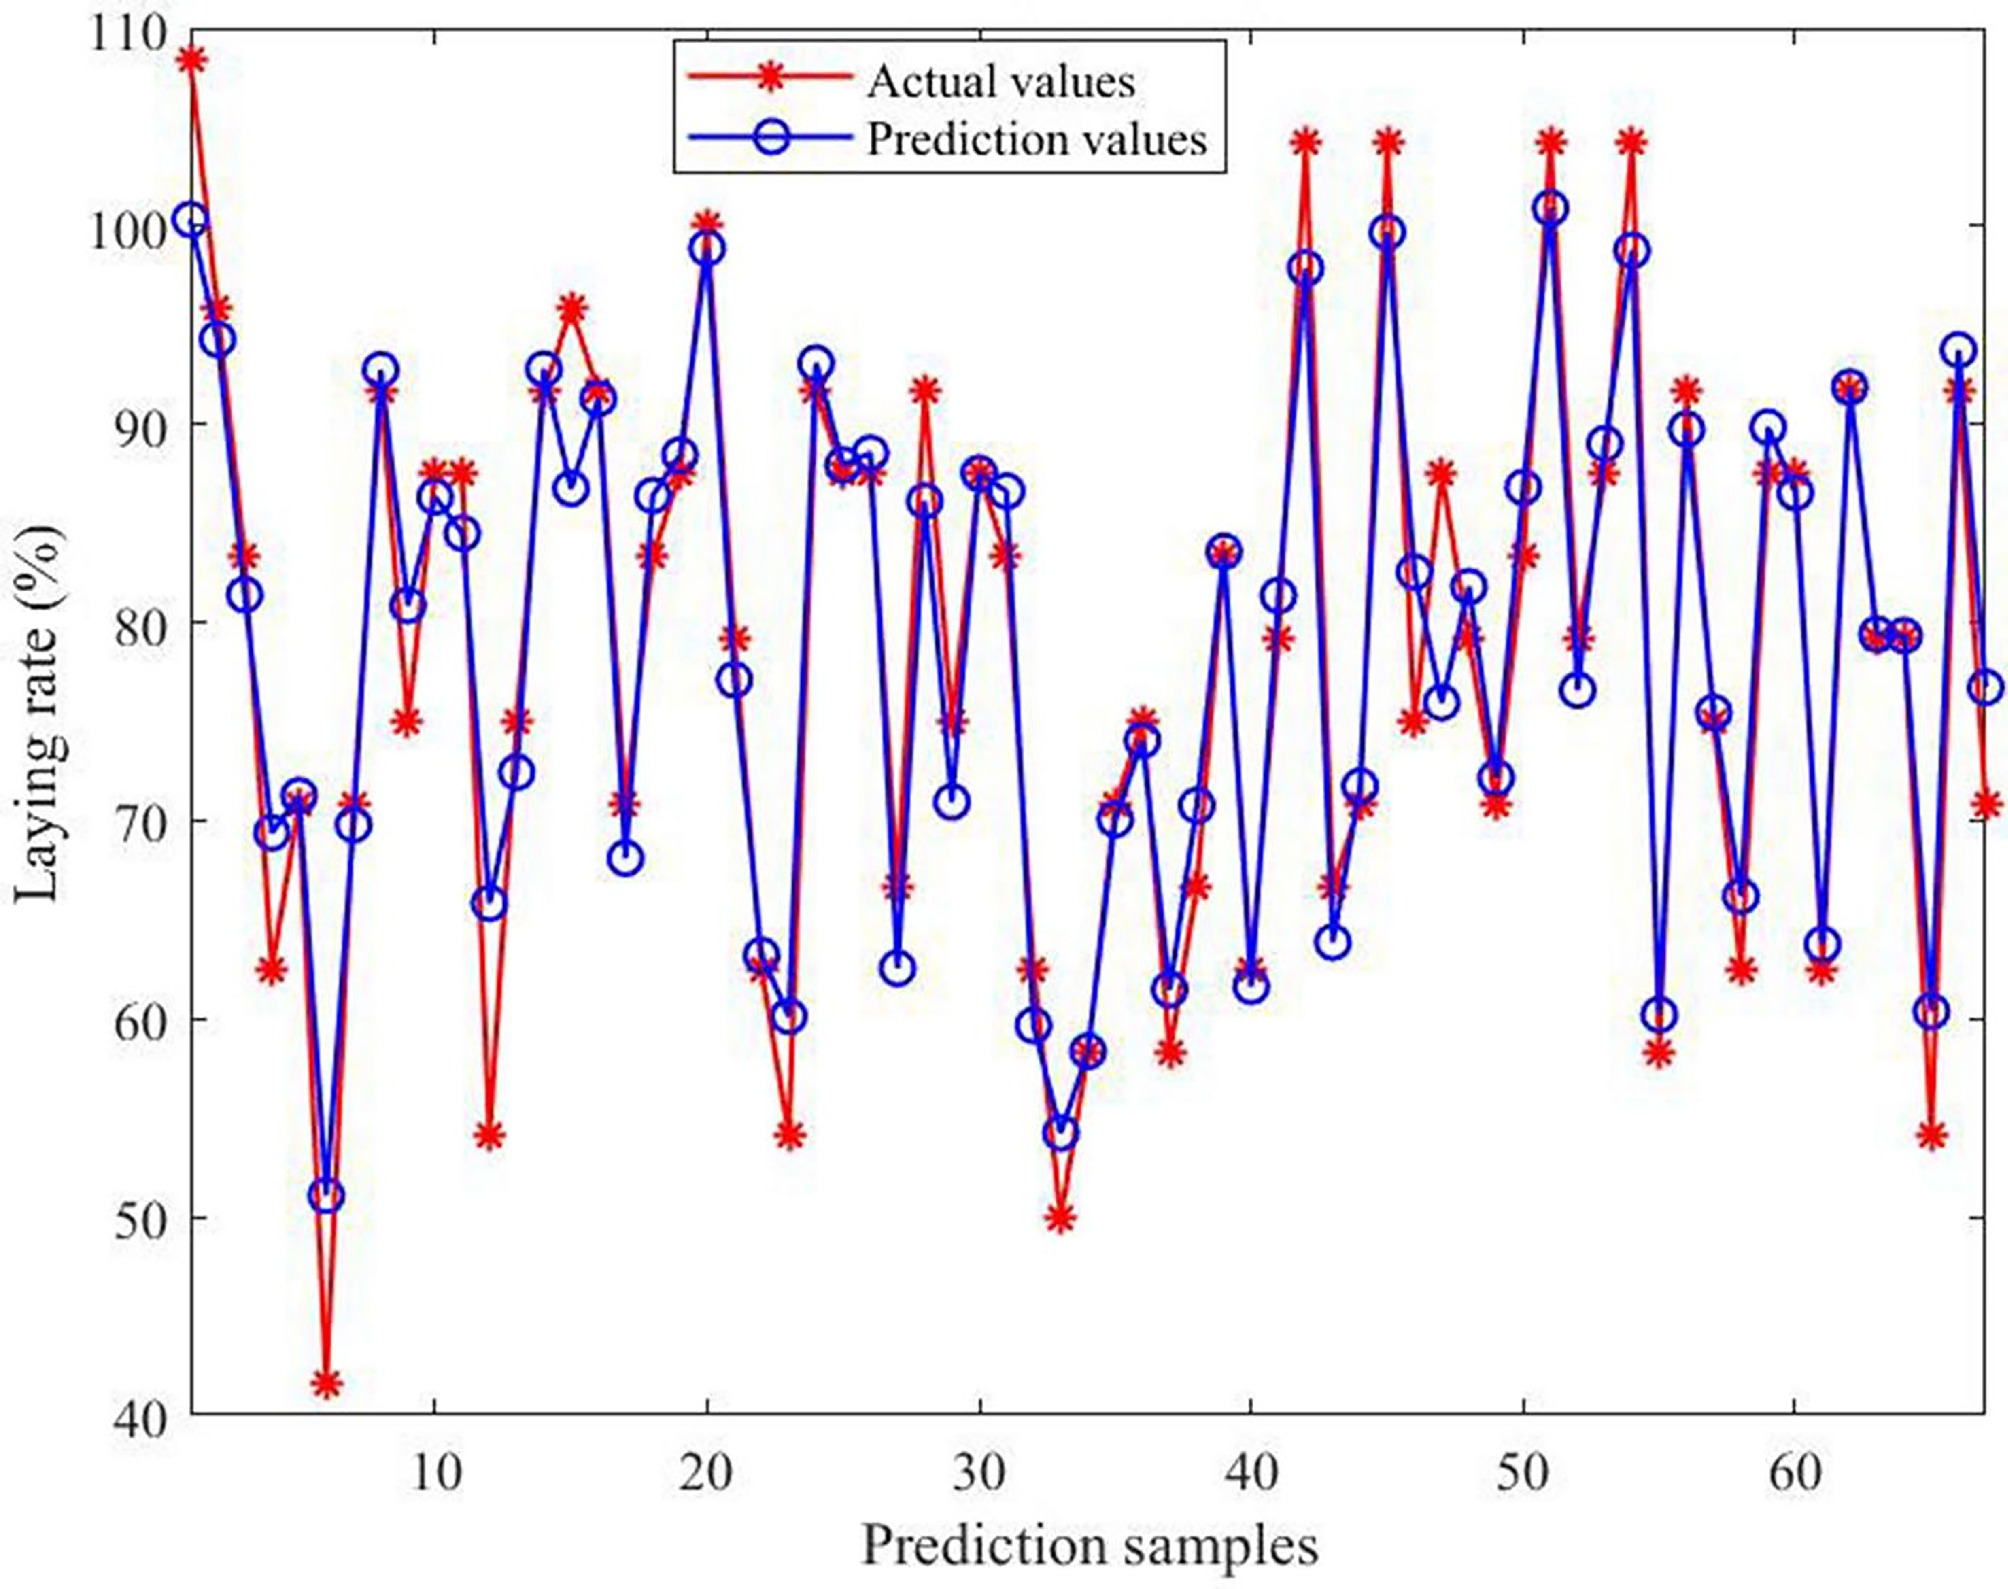
Figure 8.
Comparison of actual and predicted values of the model. The horizontal axis indicates the number of predicted samples; the vertical axis indicates the laying rate.
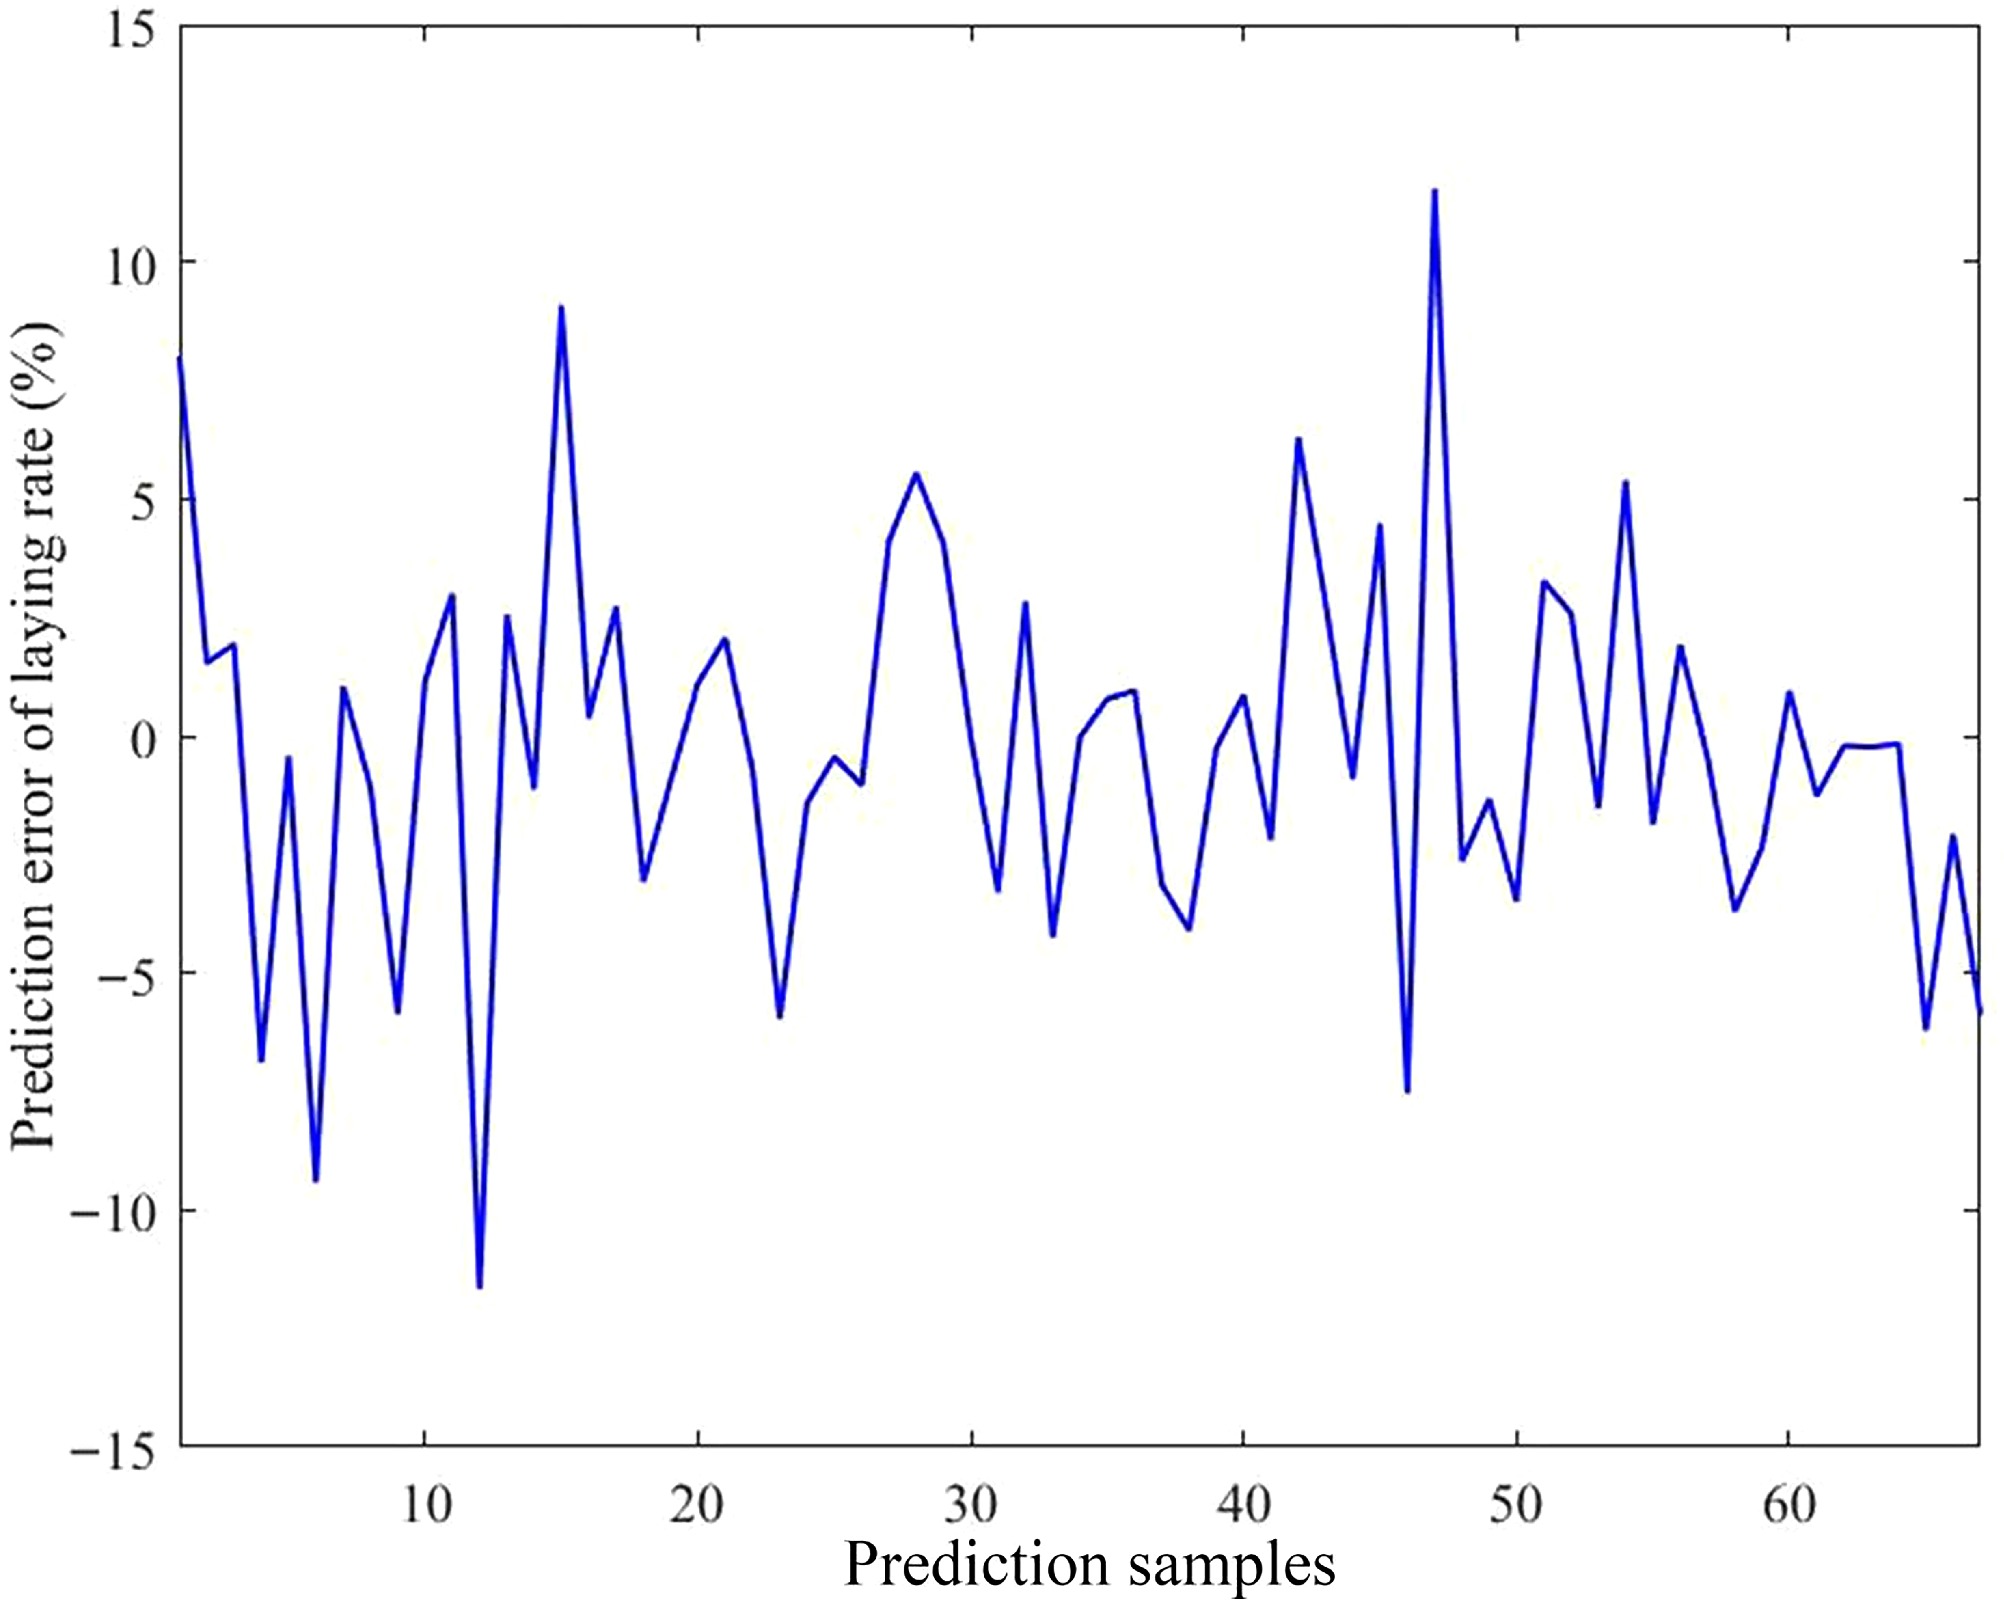
Figure 9.
Prediction error of the model. The horizontal axis indicates the number of predicted samples; the vertical axis indicates the prediction error of the laying rate.
Performance of the laying rate prediction model
-
An evaluation of the performance of the laying rate prediction model indicated that R2, MSE, RMSE, and MAE for the training subset were 0.92926, 18.5262, 4.3042, and 3.2353, respectively (Table 7). Similarly, for the testing subset, R2, MSE, RMSE, and MAE were 0.92339, 16.5915, 4.0733, and 3.0166, respectively (Table 7).
Table 7. Error statistics of model predictions
Dataset R2 MSE RMSE MAE Training subset 0.92926 18.5262 4.3042 3.2353 Testing subset 0.92339 16.5915 4.0733 3.0166 -
High temperatures serve as a key environmental stressor that leads to considerable economic losses in poultry production. Although HS has been extensively studied, much of the existing literature has primarily relied on theoretical models, which are often somewhat disconnected from real-world production practices. To effectively address this issue, the present study focused on the high temperatures during the summer months, a period particularly conducive to HS. Under hot and humid conditions, the microclimate within poultry houses often surpasses optimal thresholds, leading to HS among birds. This environmental constraint remains a major challenge for modern poultry production. In this study, we innovatively identified chicken herds suffering from HS in seemingly random flocks within the henhouse. The results showed that temperatures at different measurement locations fluctuated between 26.43 and 32.85 °C, indicating that chicken flocks experienced varying degrees of temperature effects at different areas. Further analysis revealed that Locations 10, 41, and 42 recorded the highest temperatures, whereas Locations 33, 34, and 47 exhibited the lowest values. This is consistent with our expectations, since the former were farthest from the cooling zone and the latter were the closest. In poultry, exposure to HS typically occurs within a temperature range of about 27 to 38 °C, during, which acute HS episodes may last 1 to 24 hours, moderate stress usually persists for around one week, and chronic exposure extends beyond seven days[23,24]. In this study, the mean temperature in the CHS group was 32.17 °C, meeting the criteria for chronic exposure to heat stress. The current model represents the most common form of HS in production. It is characterized by environmental conditions that often occur during periods of extreme summer temperatures and by a range of adverse physiological and performance effects in exposed birds. For this reason, we also refer to it as productive HS. It should be emphasized that although the average temperature in the CON group was slightly higher than ideal, it still reflected the lowest achievable condition under real-world production constraints. Overall, the constructed model provides a foundation for further investigation into CHS.
In this experiment, laying hens exposed to HS had significantly lower body weight, reduced laying rate, decreased egg weight, thinner shell thickness, weaker shell strength, and lower yolk weight compared with the CON group. The result of reduced body weight agrees with the findings of some researchers[5,25]. Numerous studies have also shown that high temperatures primarily reduce egg production by decreasing feed intake, which, in turn, impairs nutrient absorption and lowers the digestibility of dietary components. This could explain the decline in production[3,6,26]. Similar to previous findings, birds in the CHS group produced eggs with a lower weight compared with the CON group, accompanied by significant reductions in shell thickness and shell strength under HS conditions. These findings agreed with the results of earlier studies[3,6,26]. Under high-temperature conditions, laying hens experience disruptions in blood acid–base homeostasis caused by hyperventilation, which leads to excessive CO2 loss from the lungs. The resulting decrease in blood CO2 elevates blood pH, thereby limiting the availability of Ca2+ ions for the shell gland and ultimately causing poor egg quality[27,28]. Therefore, a decline in eggshell quality can occur shortly after hens are exposed to HS[26,29]. Our findings of decreased yolk weight with exposure to HS were mostly parallel to previous findings[8,30]. We speculate that the potential reason is similar to that of the decline in the laying rate, primarily resulting from reduced feed intake, which limits the energy and nutrients available for yolk synthesis. In our study, the CHS group exhibited greater albumen height relative to the CON group, which contradicts the conclusions of Gharaghani et al.[31], who found that high temperatures reduced albumen height. The finding that the Haugh units in the CHS group exceeded those observed in the CON group may result from the increased albumen viscosity in the eggs[32] and the fact that Haugh units, which are positively correlated with albumen height, are based on it[33]. One possible explanation is that the reduced egg production in heat-stressed hens imparted greater quality to fewer eggs[6]. However, our findings contradicted the conclusions of other researchers[8,26], who observed a reduction in Haugh units when hens experienced HS. The differences may be attributed to various factors, including variations in the intensity and duration of HS, other environmental conditions, chicken breeds, and the limited sample size of eggs analyzed. To identify the specific causes and underlying mechanisms, further investigation into these factors is required.
The CHS group exhibited markedly lower serum FSH and LH levels compared with the CON group. The present findings align with those of Nidamanuri et al.[34], who demonstrated that HS impairs the functions of both the hypothalamus and pituitary glands. HS exposure in poultry disrupts hypothalamic neuroendocrine activity, resulting in a reduced frequency of the gonadotropin-releasing hormone pulse generation and a subsequent decline in FSH and LH secretion from the pituitary gland[1,8,23,34]. Since FSH and LH function as well-recognized hormonal indicators associated with laying performance, these results align with the aforementioned findings on the laying rate. HSP70 expression was used as the primary indicator of heat resistance and is known to be affected by HS[35]. Unexpectedly, no significant changes in HSP70 expression were observed between the two groups. Similarly, although accumulating evidence indicates that HS markedly elevates circulating CORT levels in birds, no statistically significant differences in CORT levels were found here. We speculate that these results may be caused by differences between artificial heat stress models and real-world production conditions, particularly regarding the duration and frequency of HS, as well as the influence of other environmental factors. Birds in the CHS group were not exposed to continuous heat but to periodic high-temperature fluctuations, with temperatures remaining relatively low in the morning, gradually rising to a peak at noon, and then declining in the evening. This process also involved cyclical fluctuations in other environmental factors. Research has also shown that prolonged exposure to stressors can disrupt physiological processes in birds, potentially leading to harmful effects. To counteract these effects, the neuroendocrine system activates various organs to restore homeostasis[36,37]. Thus, these periodic high temperatures likely induced self-adaptability in the chickens, preventing deaths caused by HS. This speculation is consistent with the observations of Scanes et al.[38], who demonstrated that plasma CORT concentrations exhibit circadian fluctuations. The timing of sampling should be considered. Our results clearly indicate the possibility of differences between the artificially established HS model and the HS model based in production practice, and their mechanisms may also differ slightly.
Extensive evidence indicates that HS compromises the host's immunological response to vaccination, leading to a marked reduction in antibody synthesis[39,40]. In the current study, antibody titers of AIV and NDV were detected. The results showing that the CHS group exhibited a marked reduction in H5 Re-14 antibody titers were consistent with the findings of Di Meng et al.[39]. Fortunately, antibody titers in the birds' serum exceeded 6, thereby reaching the protective immunity threshold and playing a key role in defending against infection.
The pituitary gland, an essential element of the neuroendocrine system, performs critical functions in metabolism, growth, reproduction, and stress responses, making it an attractive target for investigating the effects of stress. Similarly, the liver, a central organ for maintaining homeostasis under stress, is also an ideal target for exploring the molecular effects of HS. In the present study, we employed RNA-seq technology to systematically profile the transcriptomes of pituitary and liver tissues from both the CHS and CON groups, with the aim of deepening our understanding of CHS. Our results displayed that the average Q30 percentage of high-quality clean data exceeded 96% in both the pituitary and liver tissues. Moreover, the mean mapping efficiency in both tissues surpassed 94%. The high-quality data, together with the superior mapping rate, facilitated precise and dependable downstream analysis of differences in gene expression.
Compared with the CON group, transcriptomic analysis identified 458 DEGs in the pituitary tissue, comprising 188 upregulated and 270 downregulated genes in the CHS group. In the liver, 267 DEGs were detected, including 109 upregulated and 156 downregulated genes under CHS conditions. To validate the RNA-seq results, a subset of the DEGs was randomly chosen for qPCR validation. The results revealed concordant expression trends between RNA-seq and qPCR, supporting the reliability and reproducibility of the sequencing data. Functional enrichment analyses are commonly applied to interpret RNA-seq datasets, providing critical biological insights.
After functional enrichment analyses, the majority of GO terms and KEGG pathways identified in pituitary tissues were predominantly associated with signaling molecules and interaction, signal transduction, energy metabolism, carbohydrate metabolism, signaling molecules and interaction, etc. These DEGs are likely to play pivotal roles in modulating HS by affecting the associated biological processes. Given the complexity and volume of the genes involved, it is impractical to discuss all the DEGs. Therefore, we focused on the target genes of interest, exploring their potential functions within the functional pathways associated with HS. Calcium functions as a secondary messenger in cells, converting extracellular signals into intracellular activities that regulate cell survival, development, gene expression, and differentiation[41]. In chickens, calcium is essential for eggshell mineralization, whereas high temperatures adversely influence calcium-dependent traits, such as eggshell shape, structure, thickness, and weight[42]. Several studies have demonstrated that HS affects the calcium signaling pathway. Interestingly, our findings also confirmed that the DEGs identified in this study were preferentially enriched in the calcium signaling pathway, including the genes for adrenergic receptor alpha-1B (ADRA1B), bradykinin receptor B2 (BDKRB2), 5-hydroxytryptamine receptor 7 (HTR7), oxytocin receptor (OXTR), tachykinin receptor 3 (TACR3), glutamate ionotropic receptor NMDA type subunit 2C (GRIN2C), and purinergic receptor P2X1 (P2RX1). These genes are directly or indirectly associated with the G protein-coupled receptor family. Growing evidence indicates that HS can perturb the calcium signaling cascade, leading to imbalanced calcium homeostasis and excessive intracellular Ca2+ accumulation, which ultimately triggers cellular toxicity and programmed cell death via mitochondrial mechanisms[43,44]. For example, ADRA1B is a key receptor for α-adrenergic signaling. Activation of this receptor increases cytosolic Ca2+ through two mechanisms: Mobilizing Ca2+ from intracellular stores and promoting the influx of extracellular Ca2+ (or Ca2+ loosely bound to superficial sites)[45]. We speculate that the upregulation of ADRA1B contributes to calcium overload under HS conditions. Similarly, BDKRB2 regulates calcium levels primarily through activiating Gq (heterotrimeric G protein alpha subunit q) protein. This activation triggers phospholipase C, resulting in the production of inositol trisphosphate (IP3) and diacylglycerol (DAG). IP3 induces the release of calcium from the endoplasmic reticulum, whereas DAG activates protein kinase C to amplify calcium-dependent signaling cascades. Additionally, BDKRB2 couples with Gi (heterotrimeric G protein alpha subunit i) protein to inhibit adenylate cyclase, indirectly modulating calcium signaling pathways[46−48]. These regulatory processes exert a pronounced influence on the performance of laying hens, particularly on egg quality. Furthermore, HS has also been shown to affect lipid metabolism[49−51]. In this study, we identified three DEGs involved in glycerolipid metabolism, namely the genes encoding epatic triacylglycerol lipase (LIPC), endothelial lipase (LIPG), and lipoprotein lipase (LPL). LIPC, LIPG, and LPL belong to the lipase gene family, exhibiting similar structural and functional features. One of the principal functions of LIPC is to convert intermediate-density lipoprotein to low-density lipoprotein. Unlike LIPC, LIPG primarily hydrolyzes high-density lipoprotein phospholipids. LPL, a water-soluble enzyme, facilitates the hydrolysis of triglycerides within lipoproteins, producing two molecules of free fatty acids and one molecule of monoacylglycerol[52−54]. These genes play a crucial role in lipid metabolism, making them essential for the regulation and functioning of this process. Therefore, the upregulation of LIPC, LIPG, and LPL in the CHS group further supports the conclusion that CHS significantly affects lipid metabolism in laying hens.
HS is a complex environmental system that encompasses not only temperature but also other environmental factors[1,25]. However, limited information is available on integrated assessments of the environmental parameters involved in HS. To better evaluate the roles of different environmental factors, our experiment systematically investigated various aspects of the environment. Compared with the CON group, the CHS group experienced elevated levels of AV, LI, NH3, CO2, and PM2.5. In contrast, RH was markedly reduced for the CHS group. Apparently, these findings supported our hypothesis that HS is a complex interaction of environmental factors. As mentioned earlier, the measurement location of the CHS group is closer to the exhaust fan, which likely contributed to the increase in the AV value. Similarly, the rise in the LI value could be explained by the infiltration of sunlight into the henhouse through the ventilation openings. The concentrations of NH3, CO2, and PM2.5 for the CHS group were higher, primarily caused by the gradual accumulation of chickens and manure toward the rear section of the henhouse. NH3 is primarily generated by the microbial degradation of uric acid in poultry excreta, with its concentration closely linked to manure management and air exchange efficiency. Exposure to elevated NH3 concentrations can compromise the integrity of the respiratory mucosal lining, elicit oxidative damage and inflammatory responses, and suppress microtubule activity, ultimately leading to reduced production performance[55]. Particulate matter is commonly produced by chickens and primarily consists of feathers, skin flakes, manure, feed particles, litter material, and mineral crystals from urine, collectively referred to as "poultry dust". High concentrations of airborne PM in livestock and poultry houses have been shown to contribute to respiratory disorders in animals. Specifically, fine particulate matter (PM2.5, with an aerodynamic diameter of less than 2.5 µm) poses a serious hazard because of its ability to adsorb harmful compounds and microorganisms and penetrate deeply into the lungs. Although NH3 and PM2.5 levels differed significantly between the two groups, they remained within the acceptable limits outlined in national guidelines[56], indicating a minimal impact on avian health. Nevertheless, this highlights the necessity of regularly monitoring NH3 and PM2.5 levels and implementing proactive measures, such as frequent manure removal and improved ventilation, to mitigate the risk of excessive accumulation. Moreover, CO2 originates from various sources within the poultry house, including the metabolic and respiratory activities of hens, the microbial decomposition of litter and manure, accumulated waste on manure belts, and fuel combustion during the operation of gas heating systems. Elevated CO2 levels have been demonstrated to significantly impair poultry growth by disrupting respirationory function and metabolic processes[57,58]. CO2 is frequently used as a reference gas for assessing indoor air quality and serves as a key parameter in the design and evaluation of minimum ventilation systems. In this study, the average CO2 concentration exceeded 1,500 mg/m3, surpassing the recommended threshold[56]. This finding underscores the necessity of implementing measures, such as improved ventilation, to reduce CO2 levels and ensure a healthy environment for poultry. Furthermore, when air streams move across the wet curtain installed at the intake of the longitudinal ventilation system in the henhouse, the circulating water extracts sensible heat from the incoming air, thereby releasing moisture into the indoor environment. As a result, the ambient temperature declines and RH rises for the CON group. Correlation analysis further revealed that laying rate was negatively correlated with T. This is conceivable because heat-stressed birds usually reduce their feeding activity and intake, which may ultimately lead to a reduction in production[3,6,37]. It is worth noting that we observed a negative correlation between laying rate and AV. This is because birds in the fan area are subjected to HS, which is a primary cause of their relatively low laying rate. Increasing AV can alleviate heat stress and improve animal comfort. Laying rate negatively correlated with NH3, CO2, and PM2.5. In the fan area, chickens suffered from HS, leading to a lower laying rate. Additionally, the accumulation of NH3, CO2, and PM2.5 occurred because of the increasing number of chickens and the buildup of feces, resulting in a negative correlation. Finally, our findings revealed a significant positive linkage between laying rate and RH. As discussed above, this phenomenon is closely linked to the spatial distribution of the chicken flock within the henhouse. However, in light of the considerable intricacy of the henhouse environment, more advanced algorithms should be applied to reveal deeper insights into the underlying relationships.
To gain a deeper understanding of the relationship between environmental variables and the laying rate, and to establish a reliable predictive framework, a multivariate model was developed using RFR. The results showed that the prediction error was the highest when a single decision tree was applied. As the number of decision trees progressively grew, the prediction error gradually decreased. After extensive parameter optimization, the refined model exhibited superior performance across four evaluation metrics when approximately 300 trees were incorporated into the ensemble. Therefore, a configuration of 300 trees was selected for subsequent analyses. Further analysis revealed that the predicted outcomes were highly consistent with the actual data, with prediction errors ranging from –11.67% to 11.55%. Approximately 86.57% of the samples exhibited deviations within 6%, demonstrating that the model possesses strong predictive accuracy for the laying rate. Next, four evaluation metrics were used to assess the model's predictive performance. The R2 values were 0.92926 for the training subset and 0.92339 for the testing subset. Furthermore, all other indicators remained within acceptable error limits, thereby reinforcing the model's robustness and strong predictive capacity. In practical applications, practitioners simply input specific environmental variable values, and the model automatically calculates the corresponding laying rate. The importance of the model lies in its capacity to provide a scientific basis for predicting production performance, using external environmental inputs as key parameters. This capability enables the early prediction of potential risks, timely implementation of preventive measures, the formulation of scientific feeding and management strategies, and the assurance of long-term stability and sustainability of the production performance of laying hens. However, despite the model's high predictive accuracy, its stability and accuracy need further improvement because of the inherent randomness of the algorithm. Conclusively, the findings of this study may help researchers and practitioners accurately predict laying rates using various environmental variables, and offer valuable insights for developing management strategies and optimizing henhouse environments.
-
In conclusion, we innovatively identified chicken herds suffering from HS in seemingly random flocks within the henhouse. Our results revealed that CHS significantly adversely impacted the performance of laying hens, leading to reduced body weight, decreased laying rate, and compromised egg quality. Additionally, HS reduced the levels of FSH and LH, impaired immune responses, and modulated the expression of various biological pathways, including calcium signaling and glycerolipid metabolism. Furthermore, correlation analysis indicated that the laying rate was negatively correlated with T, AV, NH3, CO2, and PM2.5 but it was positively associated with RH. Finally, the constructed multivariable environmental model demonstrates strong predictive performance, offering practical insights to assist practitioners in formulating targeted management strategies and optimizing the henhouse environment.
This work was supported by China Agriculture Research System of Ministry of Finance (MOF) and Ministry of Agriculture and Rural Affairs (MARA) (CARS-40-K21), and the Youth Elite Project of Anhui Academy of Agricultural Sciences (QNYC-202510 and QNYC-202107).
-
All procedures were reviewed and preapproved by the Animal Care and Use Committee of the Anhui Academy of Agricultural Sciences (approval number A19-CS20; date of approval: February 16, 2020). The research followed the "replacement, reduction, and refinement" principles to minimize harm to animals. This article provides details on the housing conditions, care, and pain management used for the animals, ensuring that the impact on the animals was minimized during the experiment.
-
The authors confirm their contributions to the paper as follows: study conception and design: Li Y, Zhan K; data collection: Li Y, Ma R, Qi R, Liu Z, Li J, Liu W, Wan Y, Li S, Chang X, Bao J, Zhang Y; analysis and interpretation of results: Li Y, Liu Z, Wan Y; writing − original draft: Li Y; writing − review and editing: Li Y, Zhan K, Yuan Z, Liu X, Wang X. All authors reviewed the results and approved the final version of the manuscript.
-
The data that support the study findings are available from the authors upon reasonable request.
-
The authors declare that they have no conflict of interest.
- Supplementary Table S1 Summary of sequencing reads mapping to the reference genome and quality parameters.
- Supplementary Table S2 Top 30 GO terms of DEGs in pituitary tissues.
- Supplementary Table S3 Top 20 significantly enriched KEGG pathways of DEGs in pituitary tissues.
- Supplementary Table S4 Top 30 GO terms of DEGs in liver tissues.
- Supplementary Table S5 Top 20 significantly enriched KEGG pathways of DEGs in liver tissues.
- Copyright: © 2026 by the author(s). Published by Maximum Academic Press on behalf of Nanjing Agricultural University. This article is an open access article distributed under Creative Commons Attribution License (CC BY 4.0), visit https://creativecommons.org/licenses/by/4.0/.
-
About this article
Cite this article
Li Y, Ma R, Qi R, Liu Z, Li J, et al. 2026. Novel insights into chronic heat stress in laying hens and construction of the laying rate prediction model. Animal Advances 3: e012 doi: 10.48130/animadv-0026-0001 

Novel insights into chronic heat stress in laying hens and construction of the laying rate prediction model
- Received: 29 October 2025
- Revised: 23 December 2025
- Accepted: 30 December 2025
- Published online: 27 March 2026
Abstract: Heat stress (HS) is recognized as a major environmental stressor that causes substantial economic losses in poultry production. However, most previous studies relied on artificial models that did not reflect real conditions and often ignored other environmental factors. This study aimed to establish a heat stress model that accurately reflects real-world conditions, evaluate its effects on laying hens' performance, investigate the underlying mechanisms, and develop a multivariable model to predict laying rate. Compared with the control (CON) group, the chronic heat stress (CHS) group exhibited significant reductions in body weight; laying rate; egg weight; eggshell quality traits, including shell thickness and strength; and yolk weight (p < 0.05). Conversely, the CHS group showed elevated albumen height and Haugh unit values (p < 0.05). Levels of follicle-stimulating hormone (FSH) and luteinizing hormone (LH) and H5 Re-14 antibody titers were also lower in the CHS group (p < 0.05). We identified 458 differentially expressed genes (DEGs) associated with CHS in pituitary tissue and 267 DEGs in liver tissue, primarily enriched in calcium signaling, neuroactive ligand–receptor interaction, glycerolipid metabolism, and peroxisome proliferator-activated receptor signaling. Values for airflow velocity (AV), light intensity (LI), NH3, CO2, and particulate matter (PM2.5) were higher and the relative humidity (RH) value was lower in the CHS group (p < 0.05). Correlation analysis indicated that the laying rate was negatively associated with temperature (T), AV, NH3, CO2, and PM2.5 (p < 0.05), whereas it was positively associated with RH (p < 0.05). Finally, the newly constructed multivariable environmental model demonstrates strong predictive performance, offering practical insights to assist practitioners in formulating targeted management strategies and optimizing the henhouse environment.