-
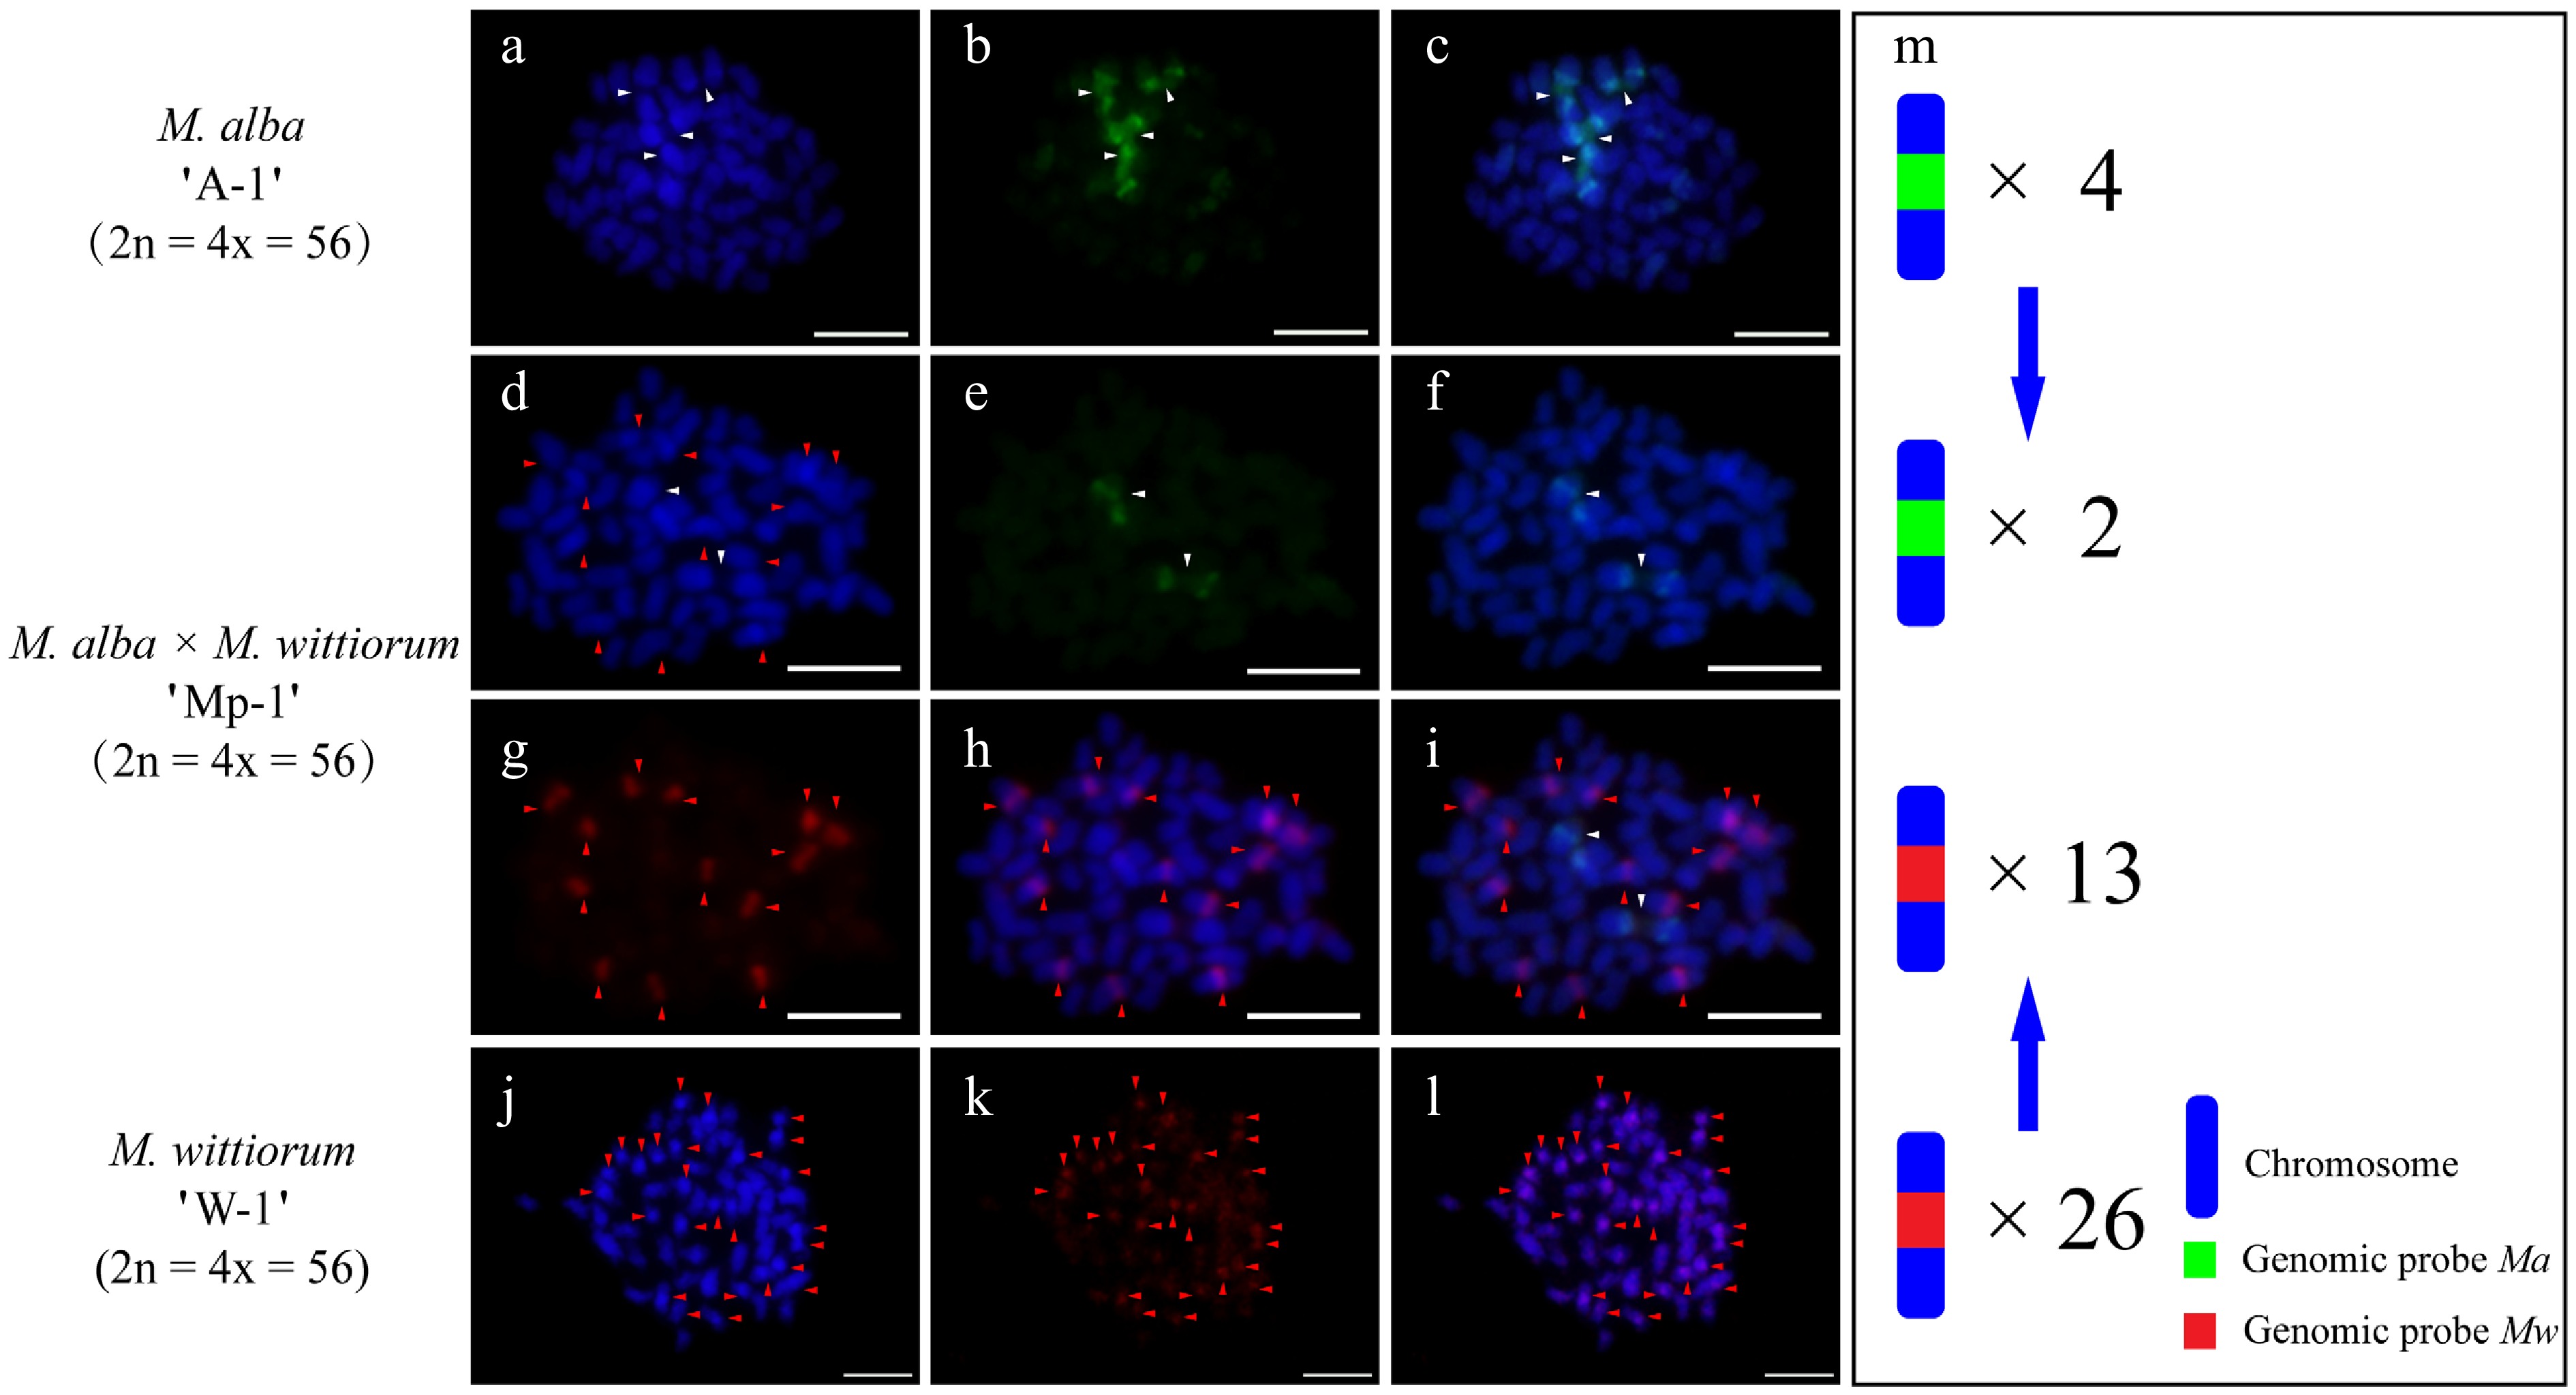
Figure 1.
The cGISH signal patterns in M. alba 'A-1', M. wittiorum 'W-1', and their hybrid M. alba × M. wittiorum 'Mp-1'. cGISH signals using the genomic probe from M. alba (Ma) (green) with blocking DNA from M. wittiorum (Mw) were detected in (a)−(c) M. alba 'A-1' and (d)−(f) the hybrid 'Mp-1'. cGISH signals using the genomic probe from Mw (red) with blocking DNA from Ma were detected in (g), (h) the hybrid 'Mp-1' and (j)−(l) M. wittiorum 'W-1'. (i) The two-round cGISH showing overlapping signals from Ma (green) and Mw (red) genomic probes with reciprocal blocking DNA. (m) Ideogram summarizing chromosome counts with different genomic probes' signals. White and red arrows point to chromosomes with Ma and Mw signals, respectively. Blue arrows indicate transmission of the parental chromosome to the hybrid. Scale bars represent 5 μm.
-
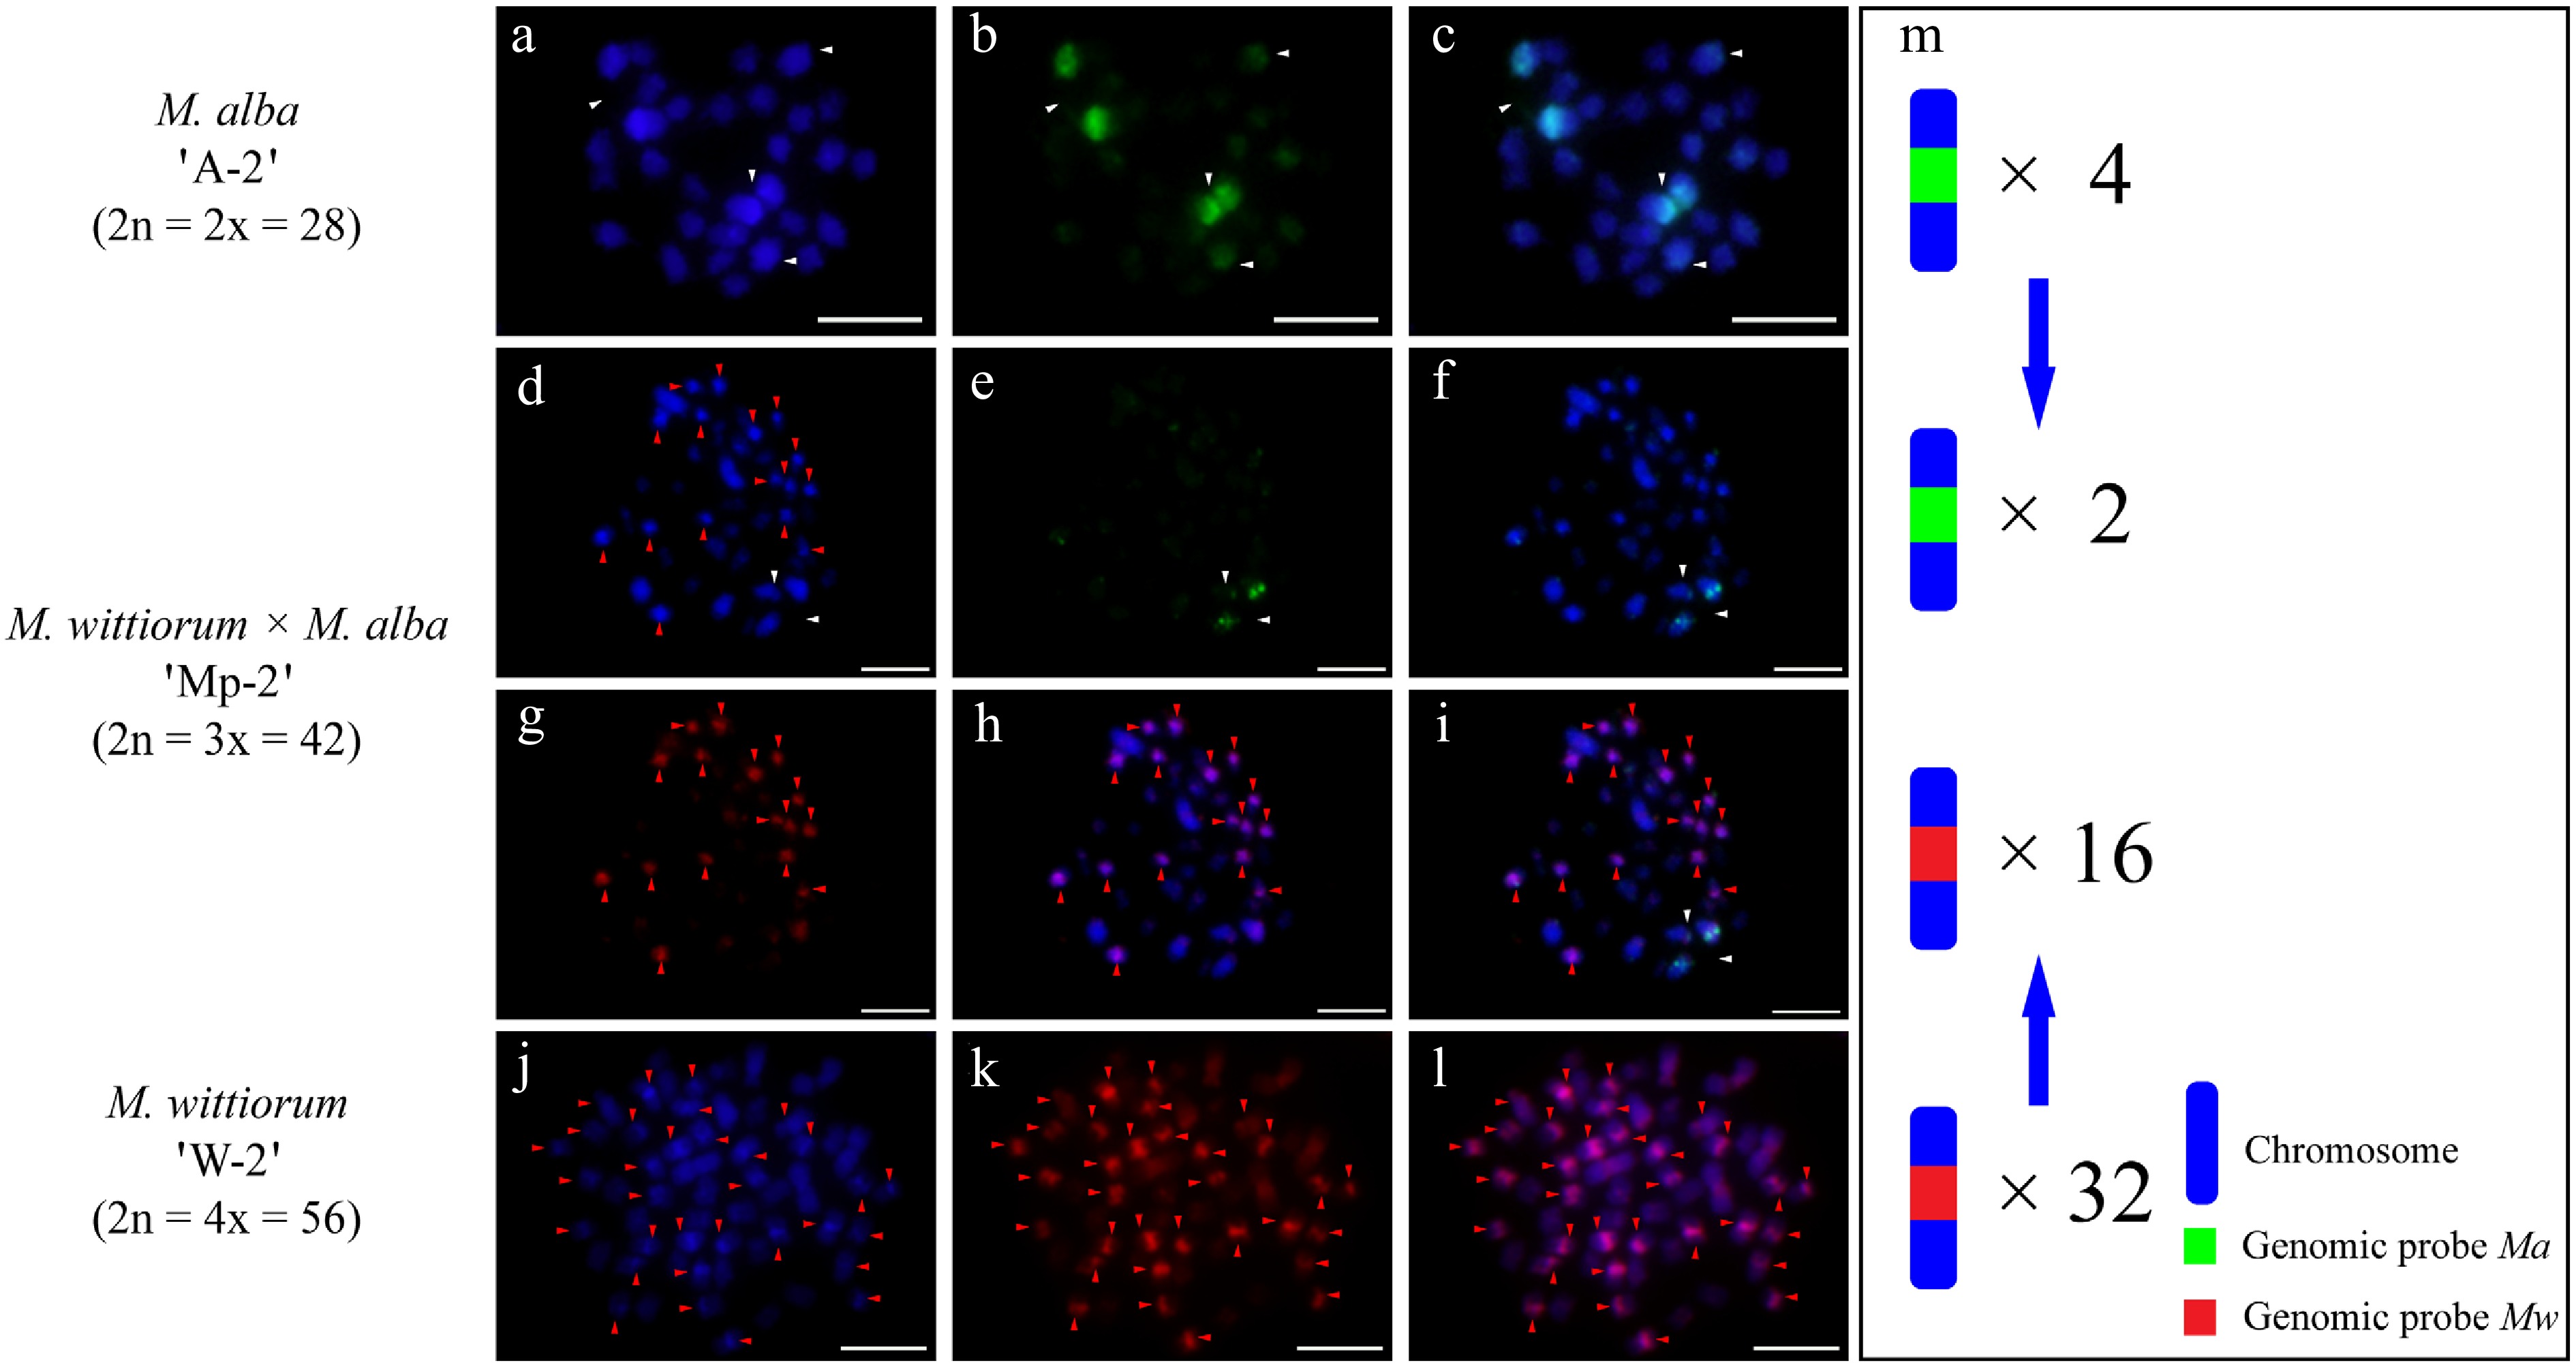
Figure 2.
cGISH signal patterns in M. alba 'A-2', M. wittiorum 'W-2', and their hybrid M. wittiorum × M. alba 'Mp-2'. cGISH signals using the genomic probe from Ma (green) with blocking DNA from Mw were detected in (a)−(c) M. alba 'A-2' and (d)−(f) the hybrid 'Mp-2'. cGISH signals using the genomic probe from Mw (red) with blocking DNA from Ma were detected in (g), (h) the hybrid 'Mp-2' and (j)−(l) M. wittiorum 'W-2'. (i) The two-round cGISH showing overlapping signals from Ma (green) and Mw (red) genomic probes with reciprocal blocking DNA. (m) Ideogram summarizing the chromosome counts with different genomic probes' signals. White and red arrows point to the chromosomes with Ma and Mw signals, respectively. Blue arrows indicate the transmission of parental chromosome to the hybrid. Scale bars represent 5 μm.
-
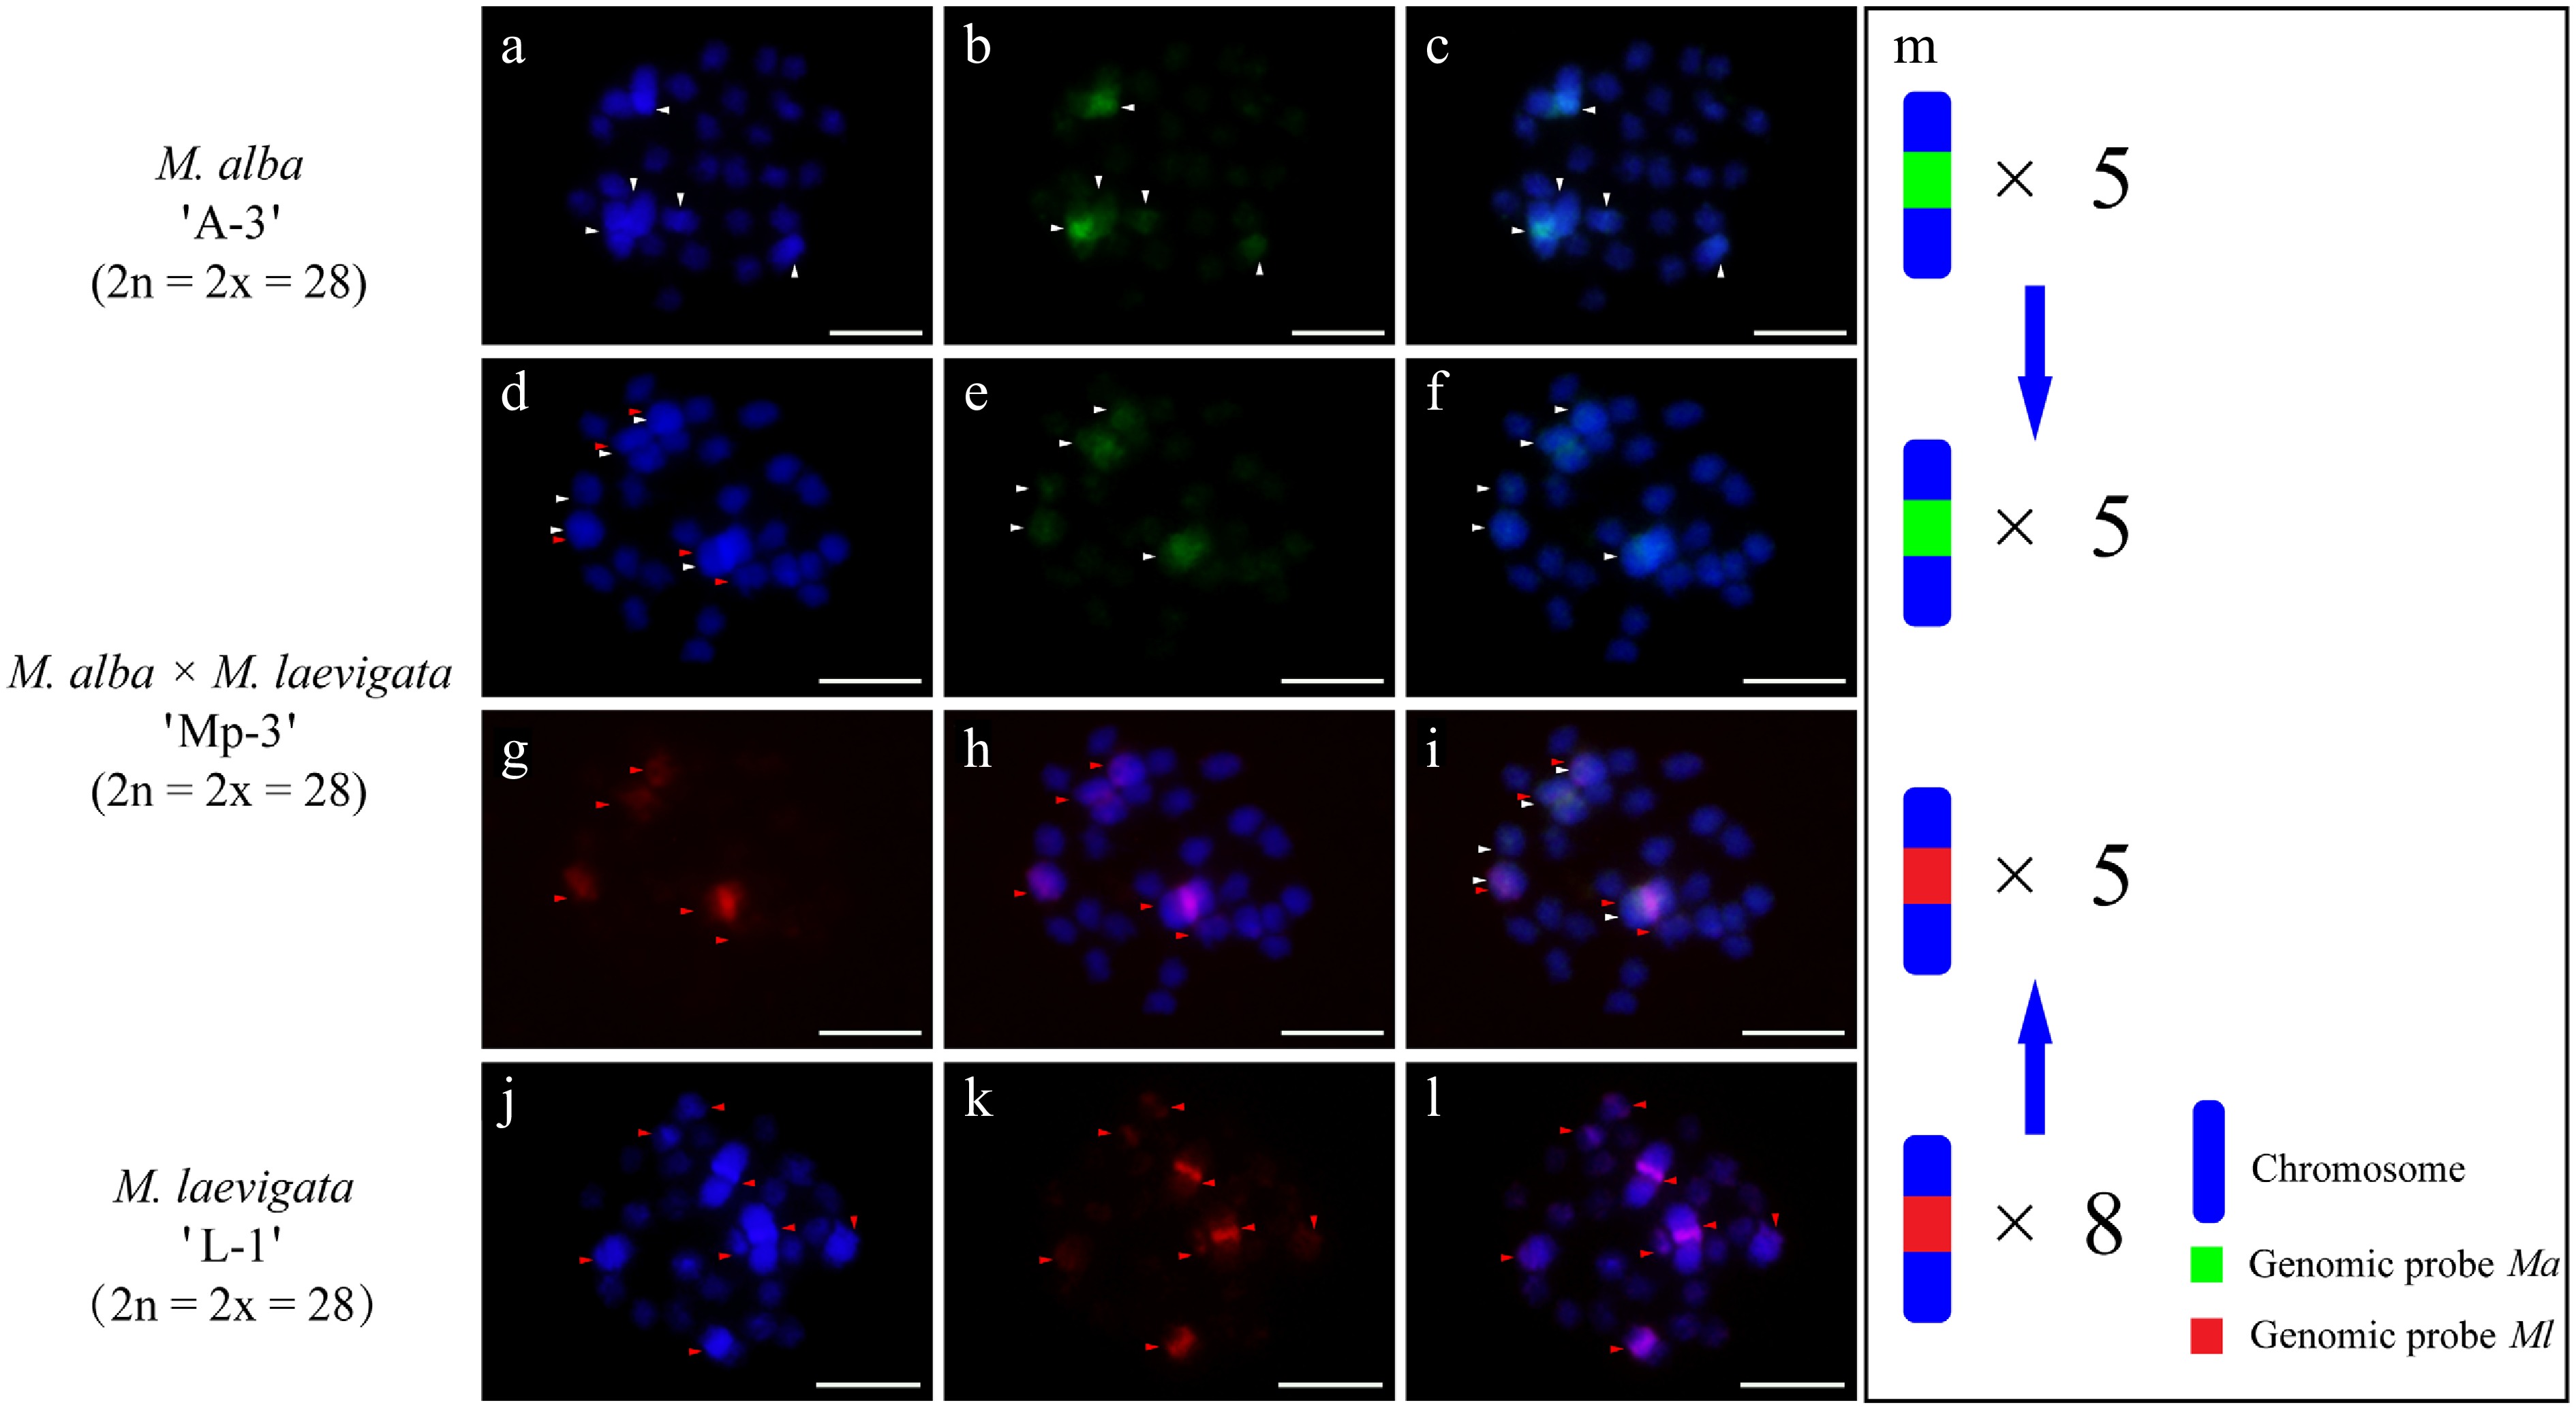
Figure 3.
cGISH signal patterns in M. alba 'A-3', M. laevigata 'L-1', and their hybrid M. alba × M. laevigata 'Mp-3'. cGISH signals using the genomic probe from Ma (green) with blocking DNA from M. laevigata (Ml) were detected in (a)−(c) M. alba 'A-3' and (d)−(f) the hybrid 'Mp-3'. cGISH signals using the genomic probe from Ml (red) with blocking DNA from Ma were detected in (g), (h) the hybrid 'Mp-3' and (j)−(l) M. laevigata 'L-1'. (i) The two-round cGISH showing overlapping signals from the Ma (green) and Ml (red) genomic probes with reciprocal blocking DNA. (m) Ideogram summarizing chromosome counts with different genomic probes' signals. White and red arrows point to the chromosomes with Ma and Ml signals, respectively. Blue arrows indicate the transmission of parental chromosome to the hybrid. Scale bars represent 5 μm.
-
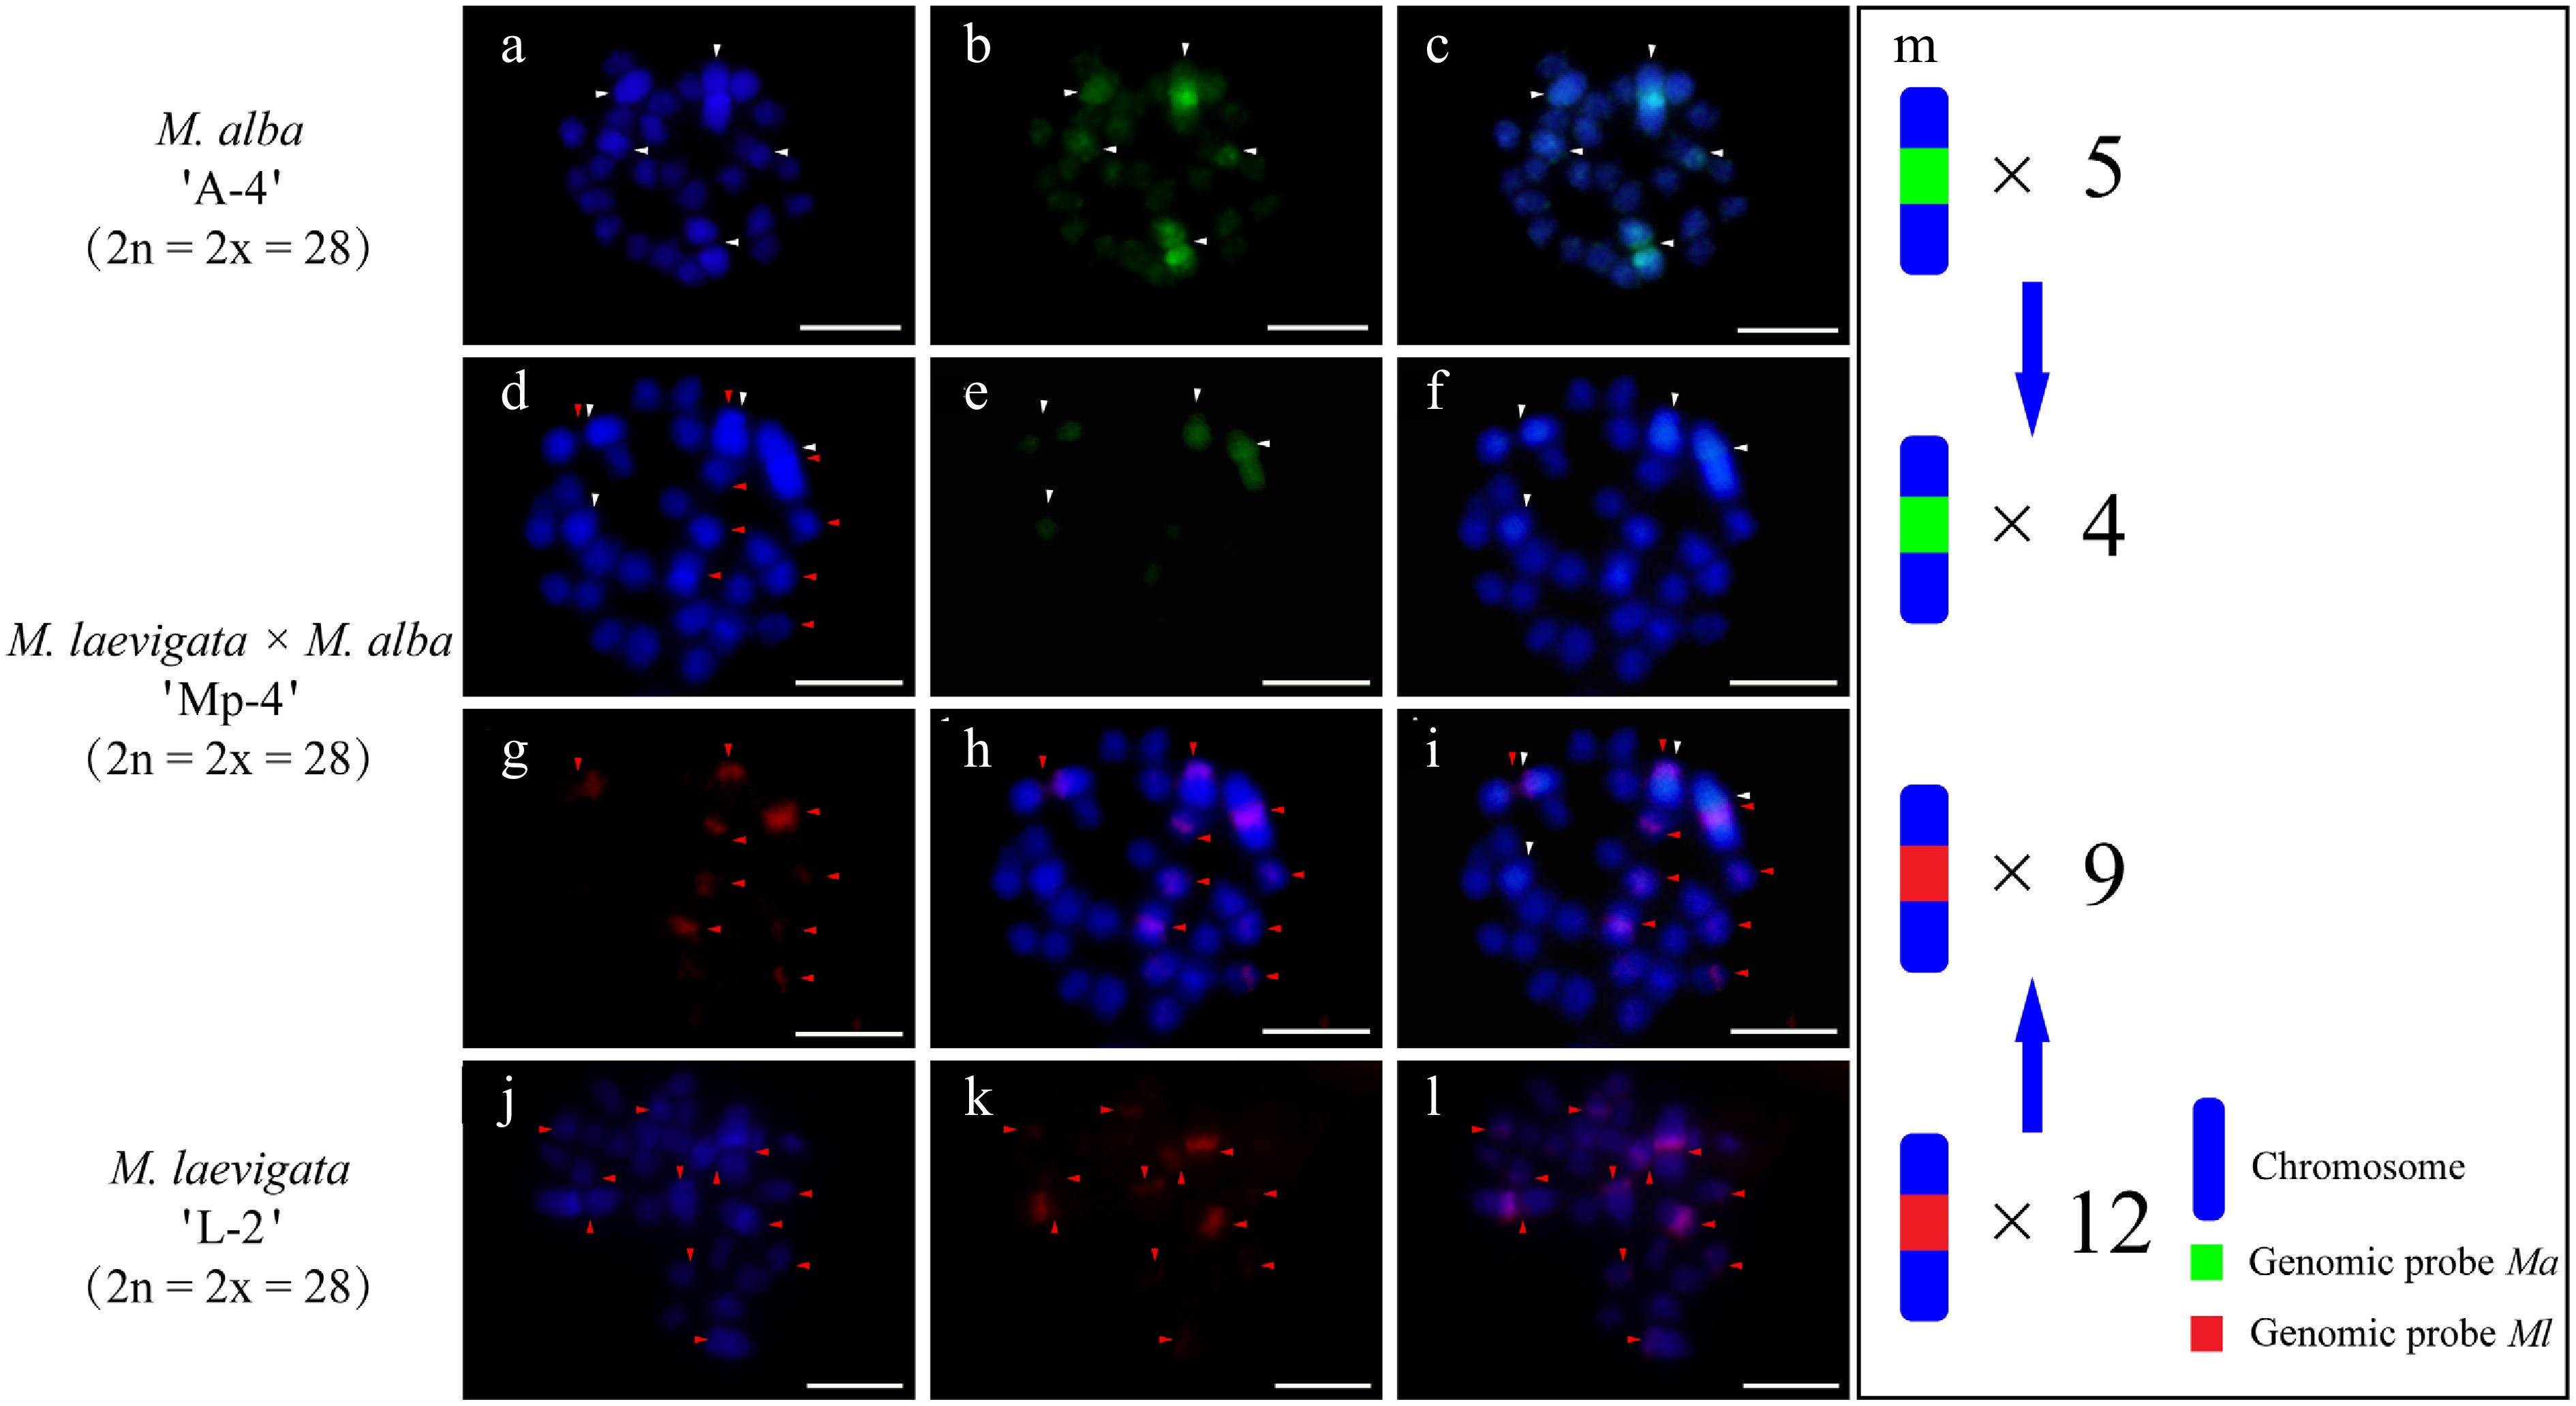
Figure 4.
cGISH signal patterns in M. alba 'A-4', M. laevigata 'L-2', and their hybrid M. laevigata × M. alba 'Mp-4'. cGISH signals using the genomic probe from Ma (green) with blocking DNA from M. laevigata (Ml) were detected in (a)−(c) M. alba 'A-4' and (d)−(f) the hybrid 'Mp-4'. cGISH signals using the genomic probe from Ml (red) with blocking DNA from Ma were detected in (g), (h) the hybrid 'Mp-4' and (j)−(l) M. laevigata 'L-2'. (i) The two-round cGISH showing overlapping signals from the Ma (green) and Ml (red) genomic probes with reciprocal blocking DNA. (m) Ideogram summarizing chromosome counts with different genomic probes' signals. White and red arrows point to chromosomes with the Ma and Ml signals, respectively. Blue arrows indicate the transmission of parental chromosome to the hybrid. Scale bars represent 5 μm.
-
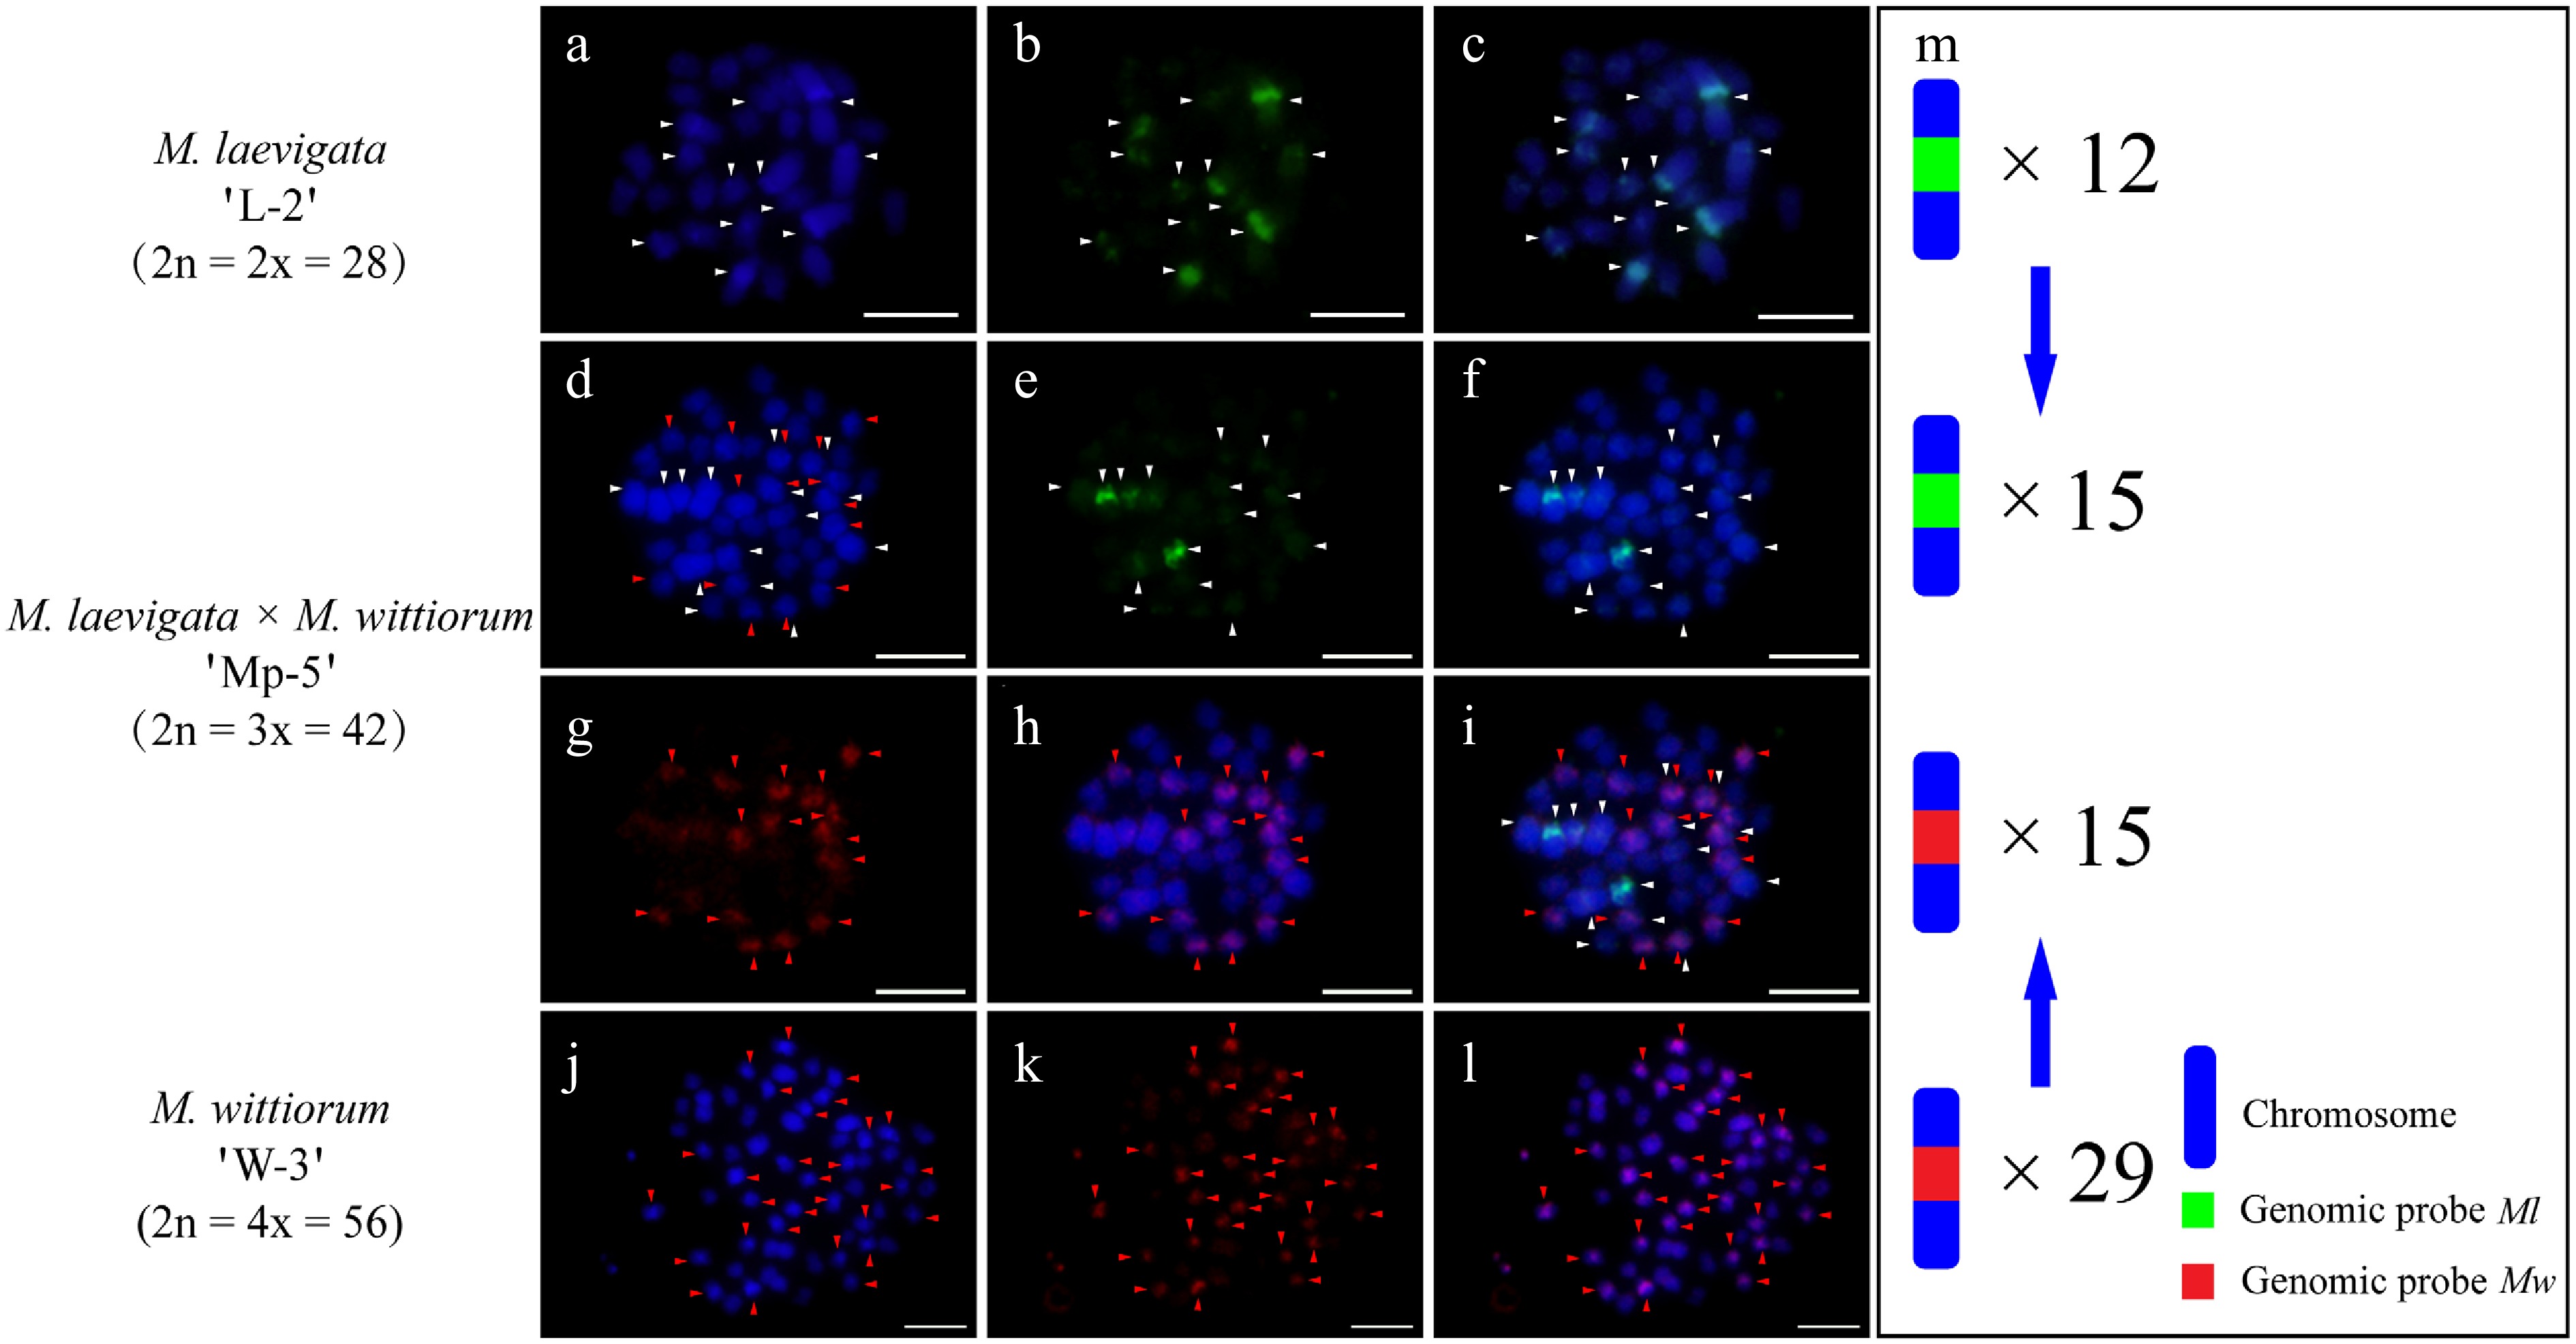
Figure 5.
cGISH signal patterns in M. laevigata 'L-2', M. wittiorum 'W-3', and their hybrid M. laevigata × M. wittiorum 'Mp-5'. cGISH signals using the genomic probe from Ml (green) with blocking DNA from Mw were detected in (a)−(c) M. laevigata 'L-2' and (d)−(f) the hybrid 'Mp-5. cGISH signals using the genomic probe from Mw (red) with blocking DNA from Ml were detected in (g), (h) the hybrid 'Mp-5', and (j)−(l) M. wittiorum 'W-3'. (i) The two-round cGISH showing overlapping signals from the Ml (green) and Mw (red) genomic probes with reciprocal blocking DNA. (m) Ideogram summarizing chromosome counts with different genomic probes' signals. White and red arrows point to chromosomes with the Ml and Mw signals, respectively. Blue arrows indicate the transmission of parental chromosomes to the hybrid. Scale bars represent 5 μm.
-
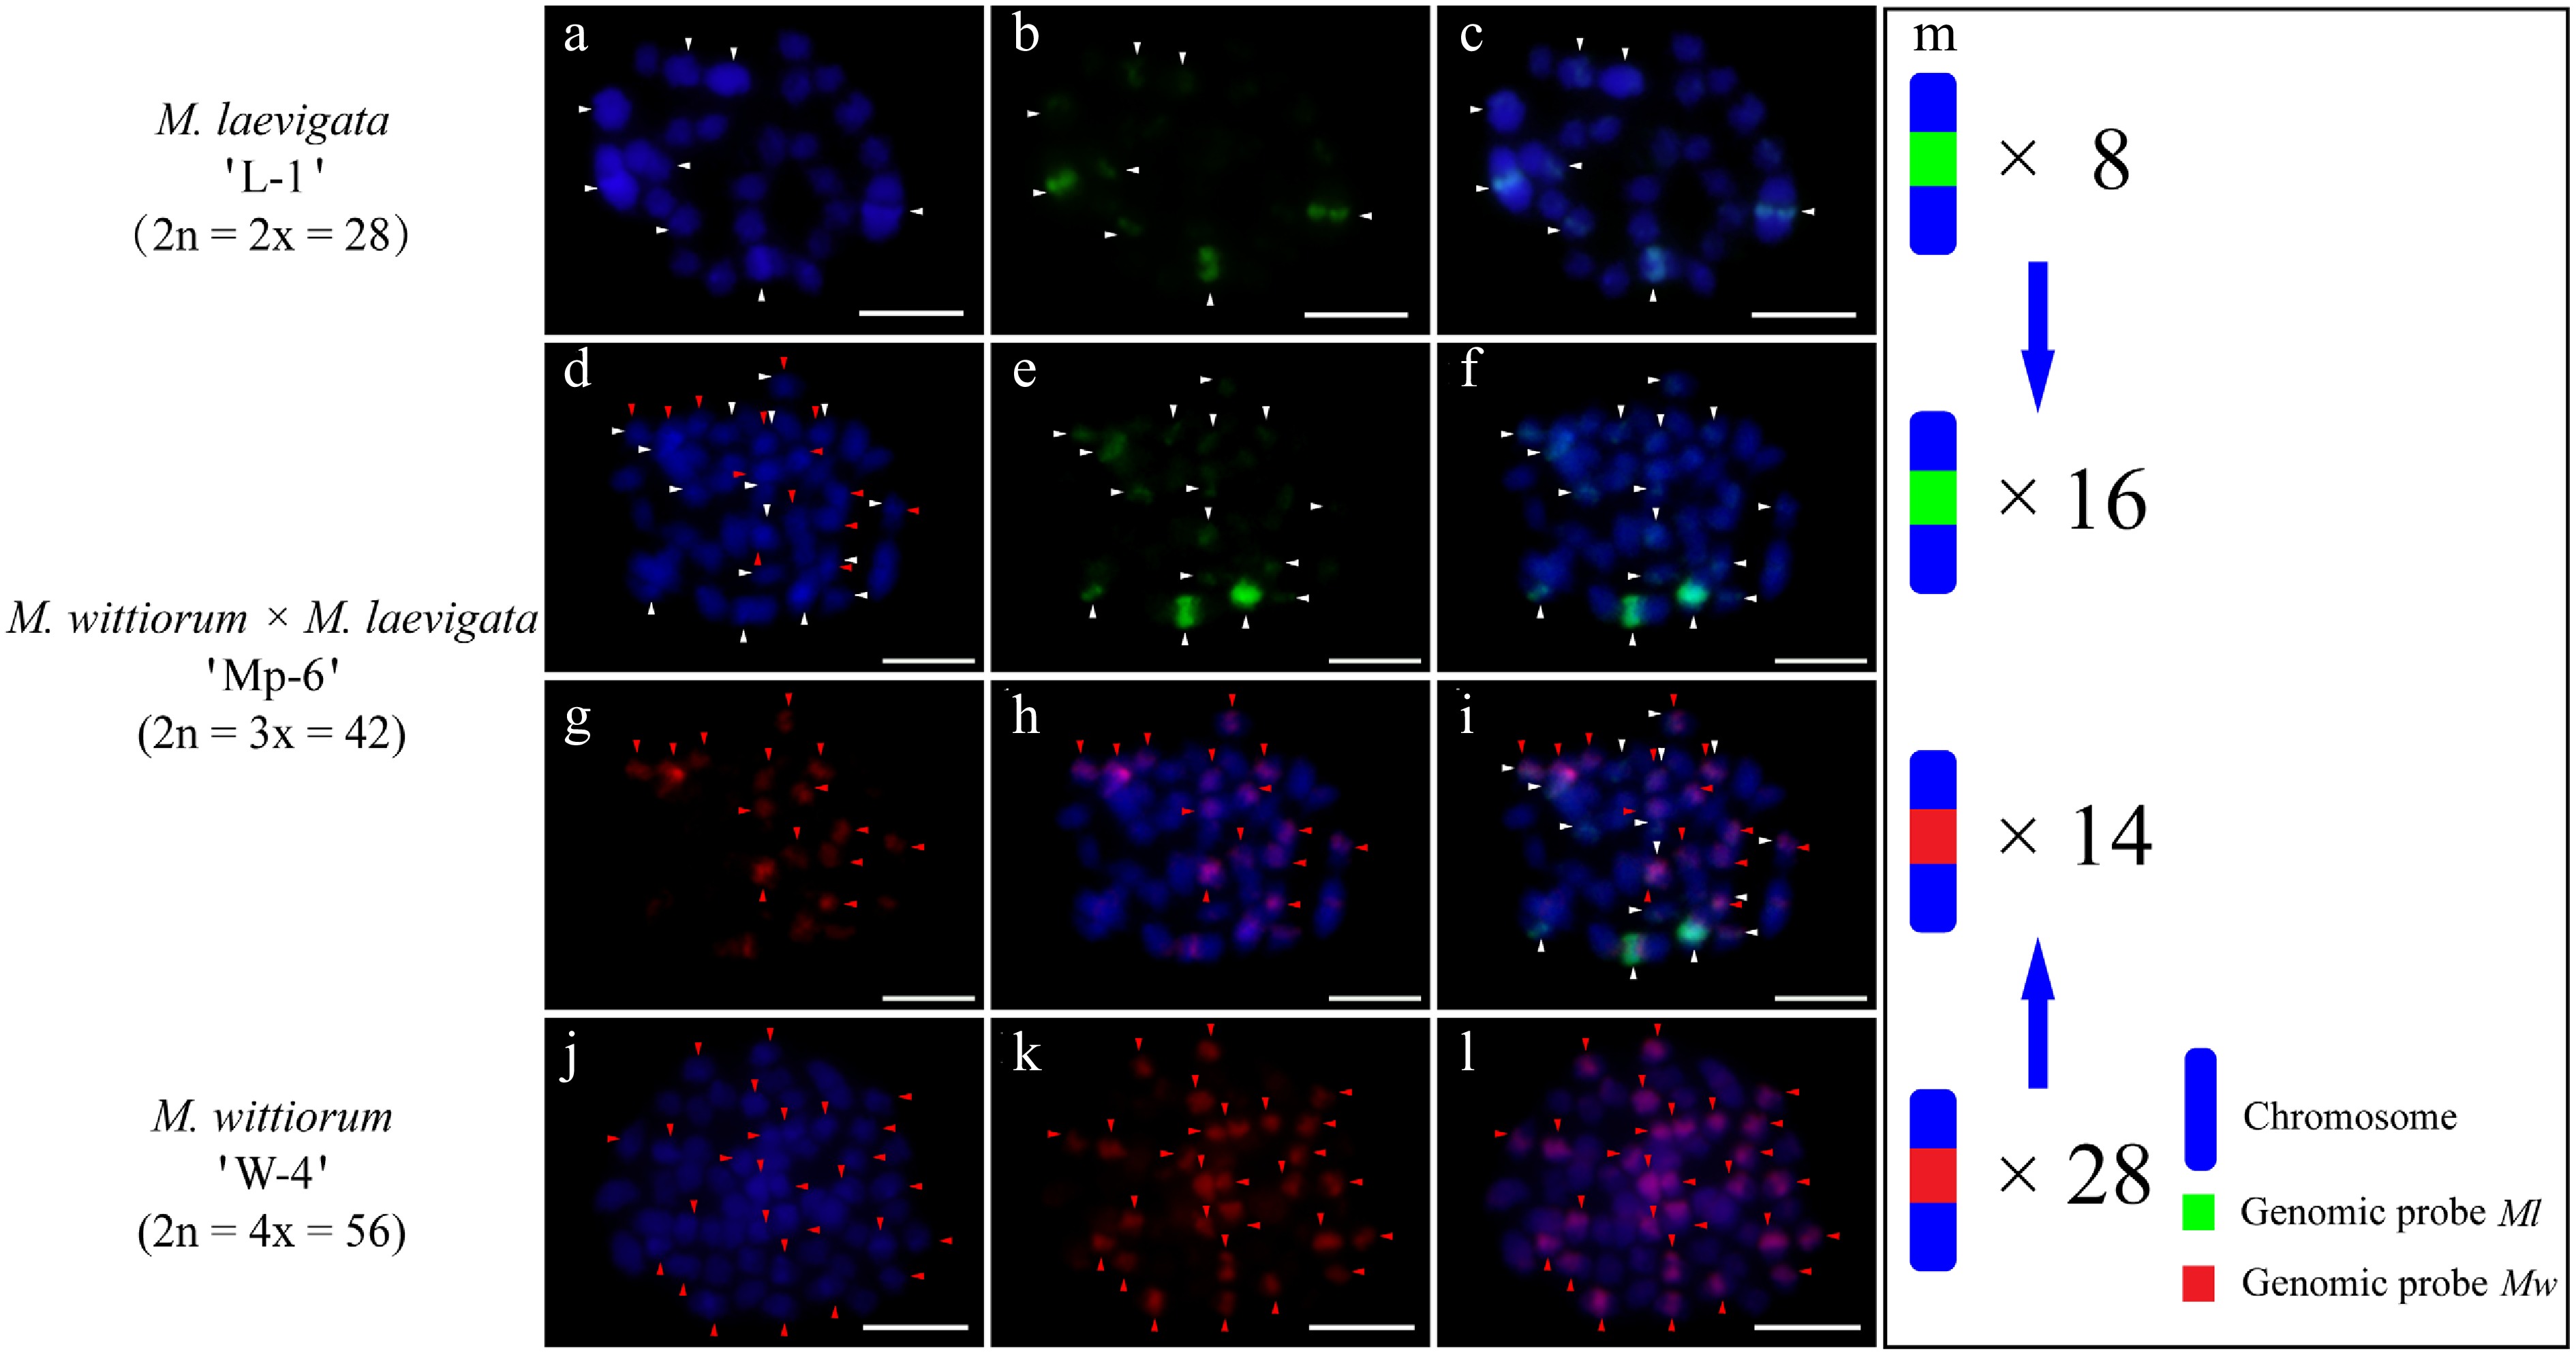
Figure 6.
cGISH signal patterns in M. laevigata 'L-1', M. wittiorum 'W-4', and their hybrid M. wittiorum × M. laevigata 'Mp-6'. cGISH signals using the genomic probe from Ml (green) with blocking DNA from Mw were detected in (a)−(c) M. laevigata 'L-1' and (d)−(f) the hybrid 'Mp-6'. cGISH signals using the genomic probe from Mw (red) with blocking DNA from Ml were detected in (g), (h) the hybrid 'Mp-6', and (j)−(l) M. wittiorum 'W-4'. (i) The two-round cGISH showing overlapping signals from the Ml (green) and Mw (red) genomic probes with reciprocal blocking DNA. (m) Ideogram summarizing chromosome counts with different genomic probes' signals. White and red arrows point to the chromosomes with Ml and Mw signals, respectively. Blue arrows indicate the transmission of parental chromosomes to the hybrid. Scale bars represent 5 μm.
-
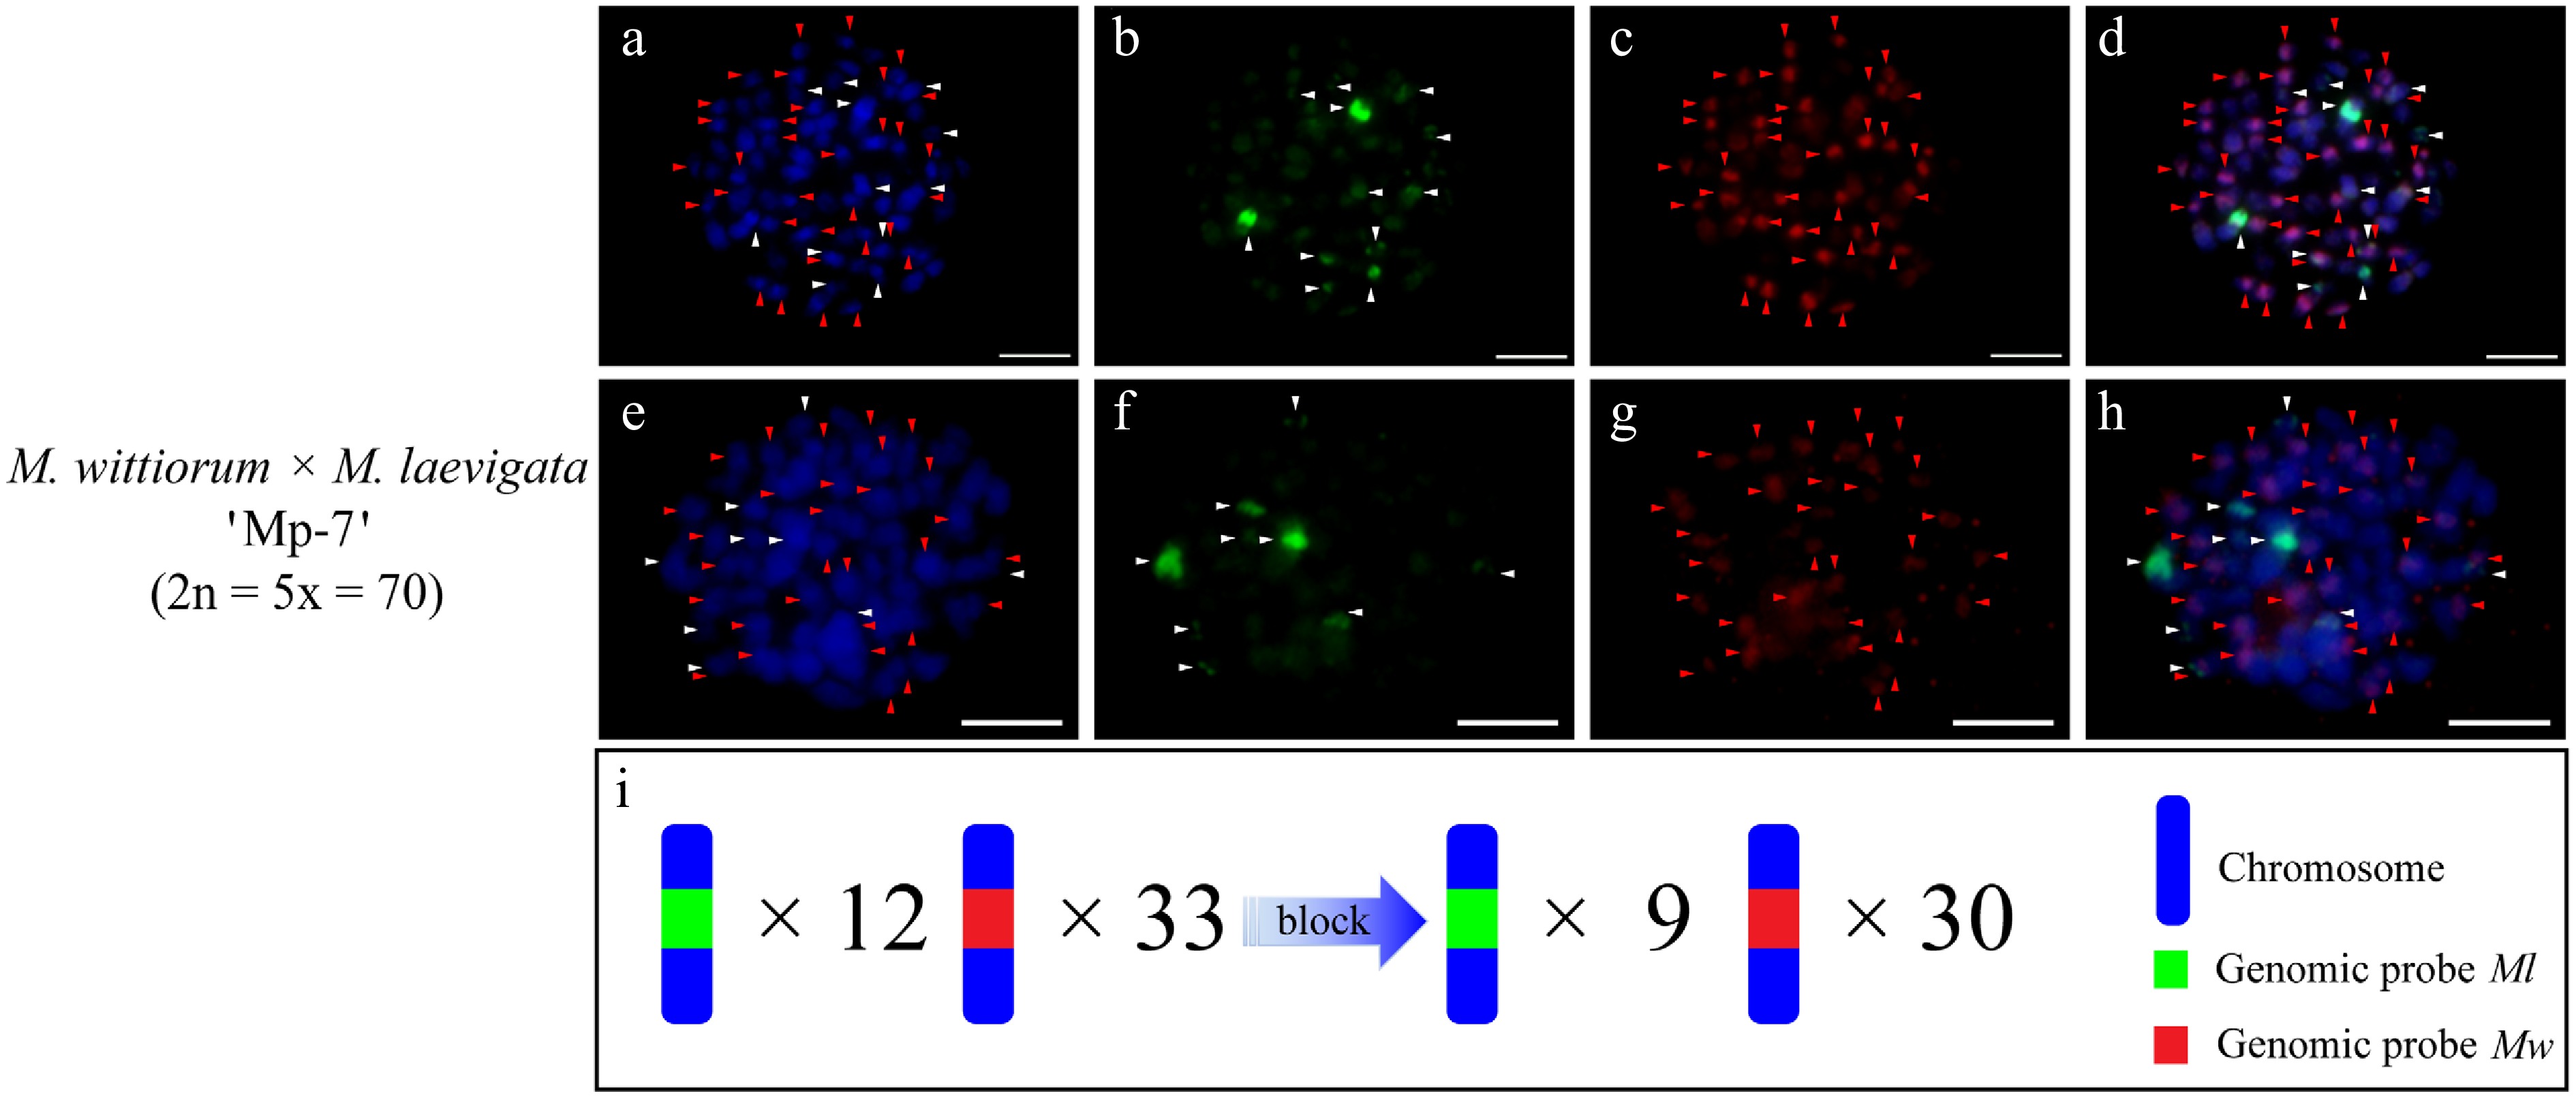
Figure 7.
cGISH signal patterns in the hybrid 'Mp-7' from the cross M. wittiorum 'W-4' × M. laevigata 'L-1'. (a)−(d) Dual-color GISH signals using the genomic probes from Ml (green) and Mw (red) were detected in the hybrid 'Mp-7'. (e)−(h) The two-round cGISH signals using the genomic probes from Ml (green) and Mw (red) with reciprocal blocking DNA were detected in the hybrid 'Mp-7'. (i) Ideogram summarizing chromosome counts with different genomic probes' signals. White and red arrows point to chromosomes with the Ml and Mw signals, respectively. The blue gradient arrow indicates the changes in signal number after the application of blocking DNA. Scale bars represent 5 μm.
-
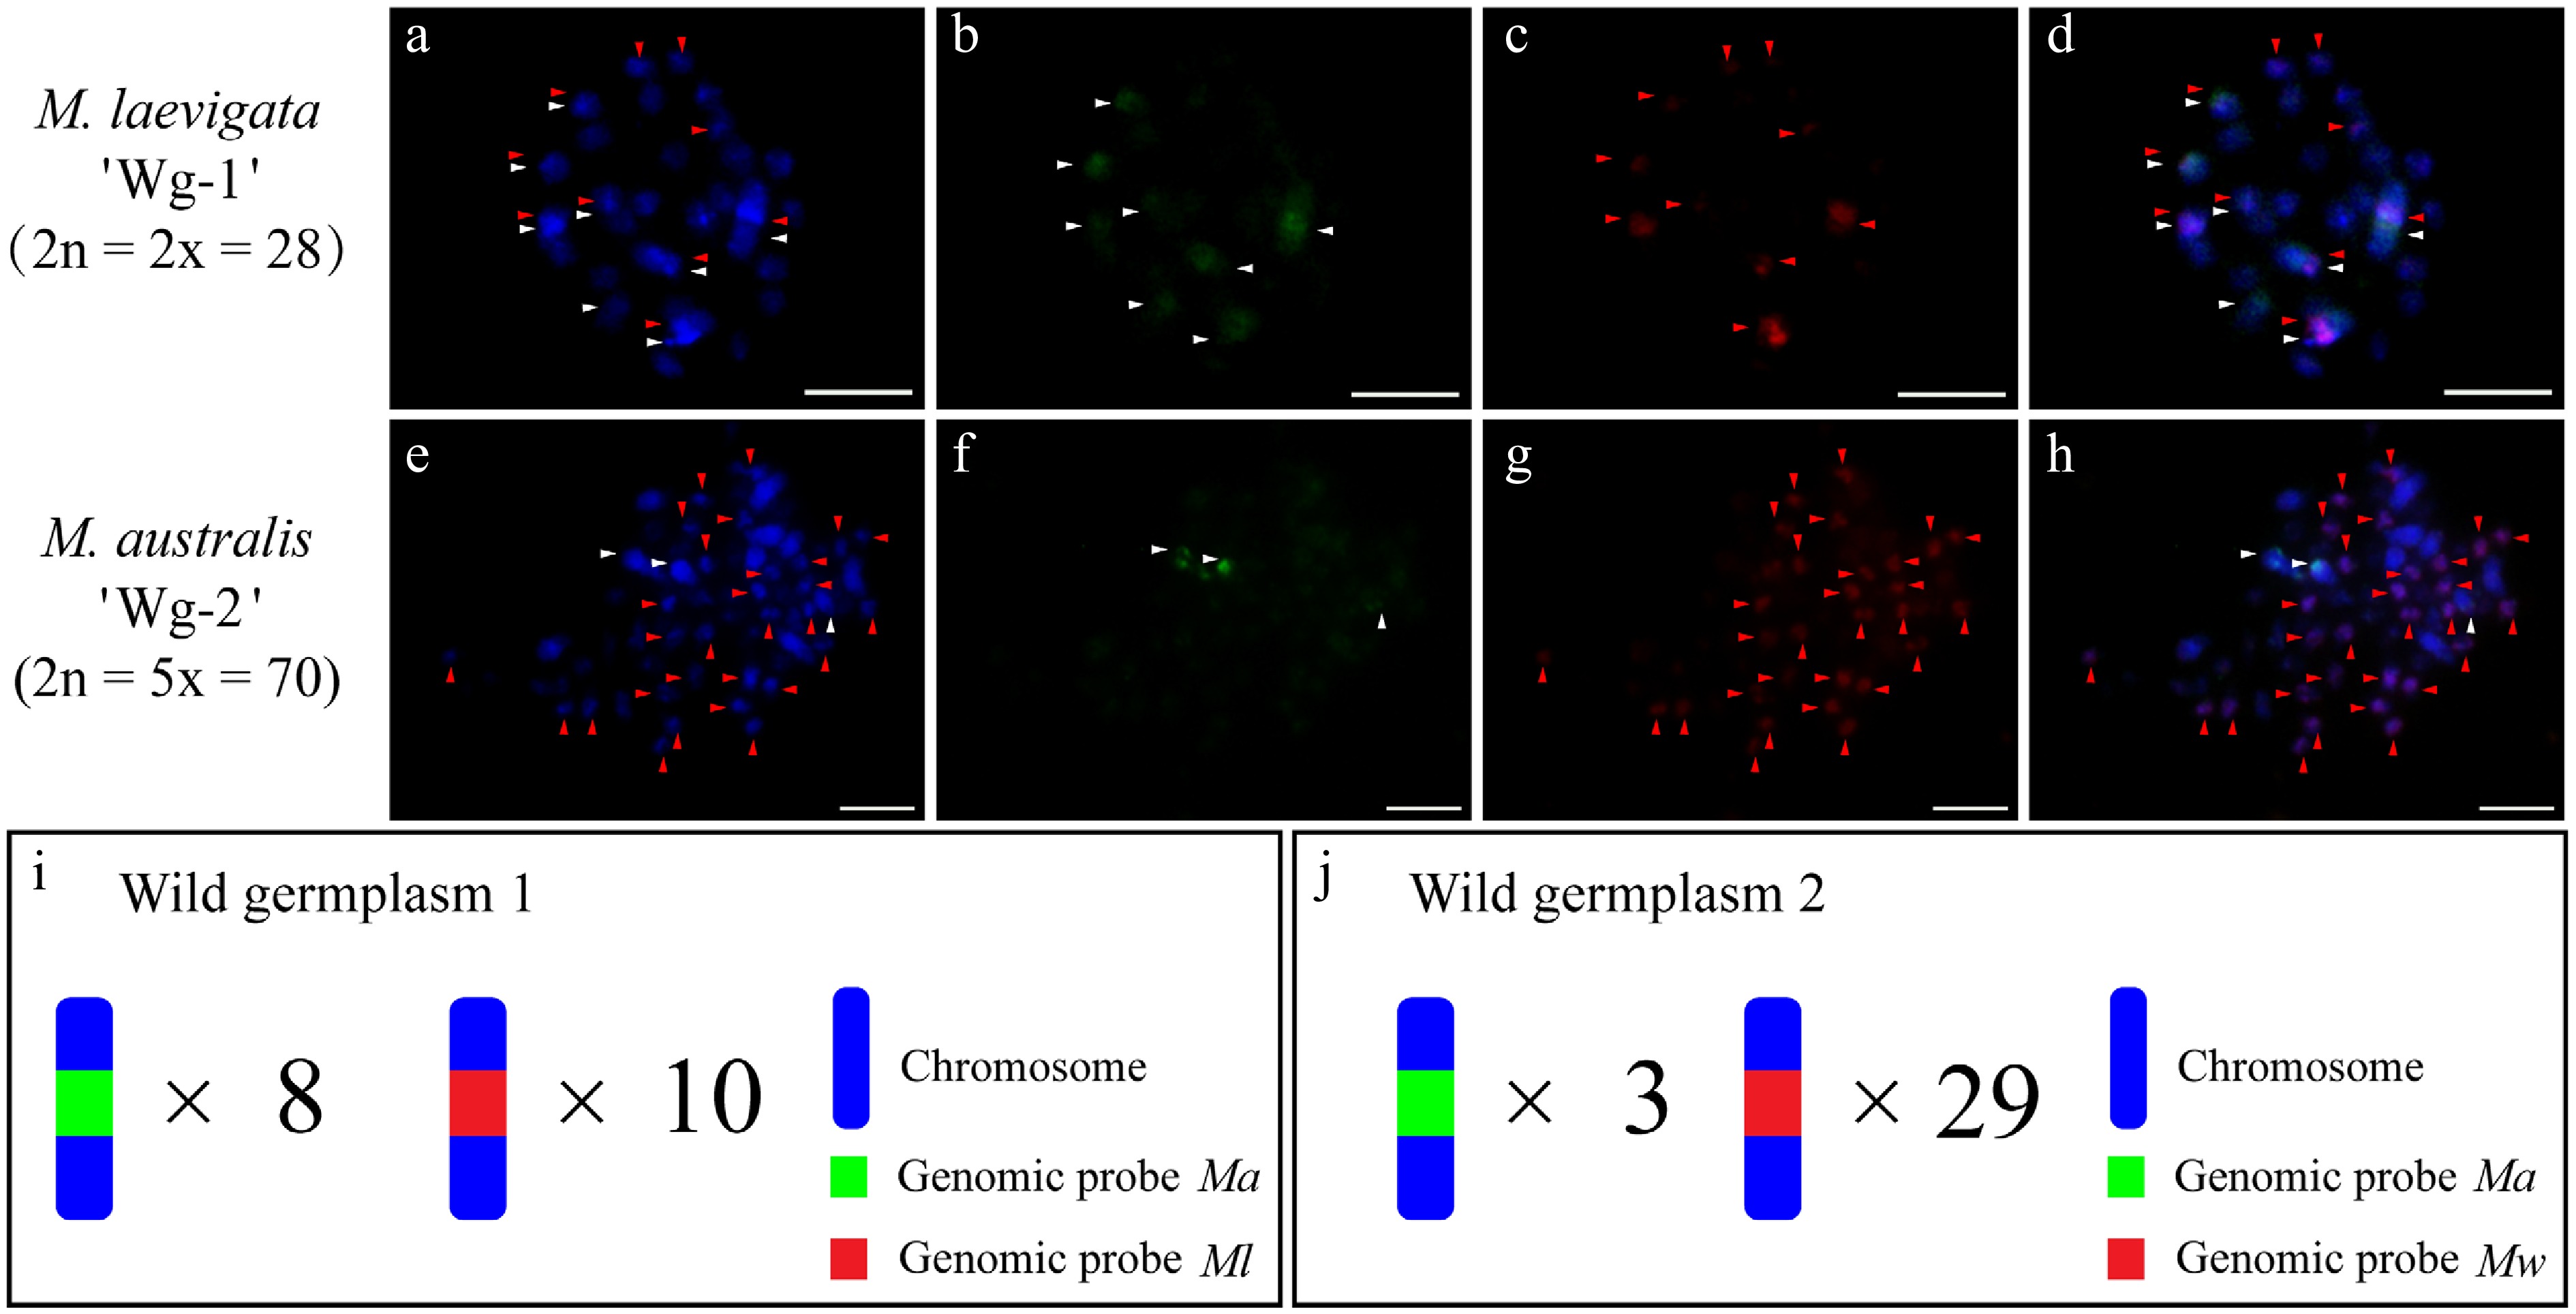
Figure 8.
cGISH signal patterns in the wild accessions M. laevigata 'Wg-1' and M. australis 'Wg-2'. (a)−(d) The two-round cGISH signals using genomic probes from Ma (green) and Ml (red) with reciprocal blocking DNA were detected in M. laevigata 'Wg-1'. (e)−(h) Corresponding two-round cGISH signals using genomic probes from Ma (green) and Mw (red) with reciprocal blocking DNA were detected in M. australis 'Wg-2'. (i), (j) Ideograms summarizing chromosome counts with different genomic probes' signals. White arrows point to chromosomes with Ma signals, whereas red arrows point to chromosomes with (a)−(d) Ml signals or (e)−(h) Mw signals. Scale bars represent 5 μm.
Figures
(8)
Tables
(0)