-
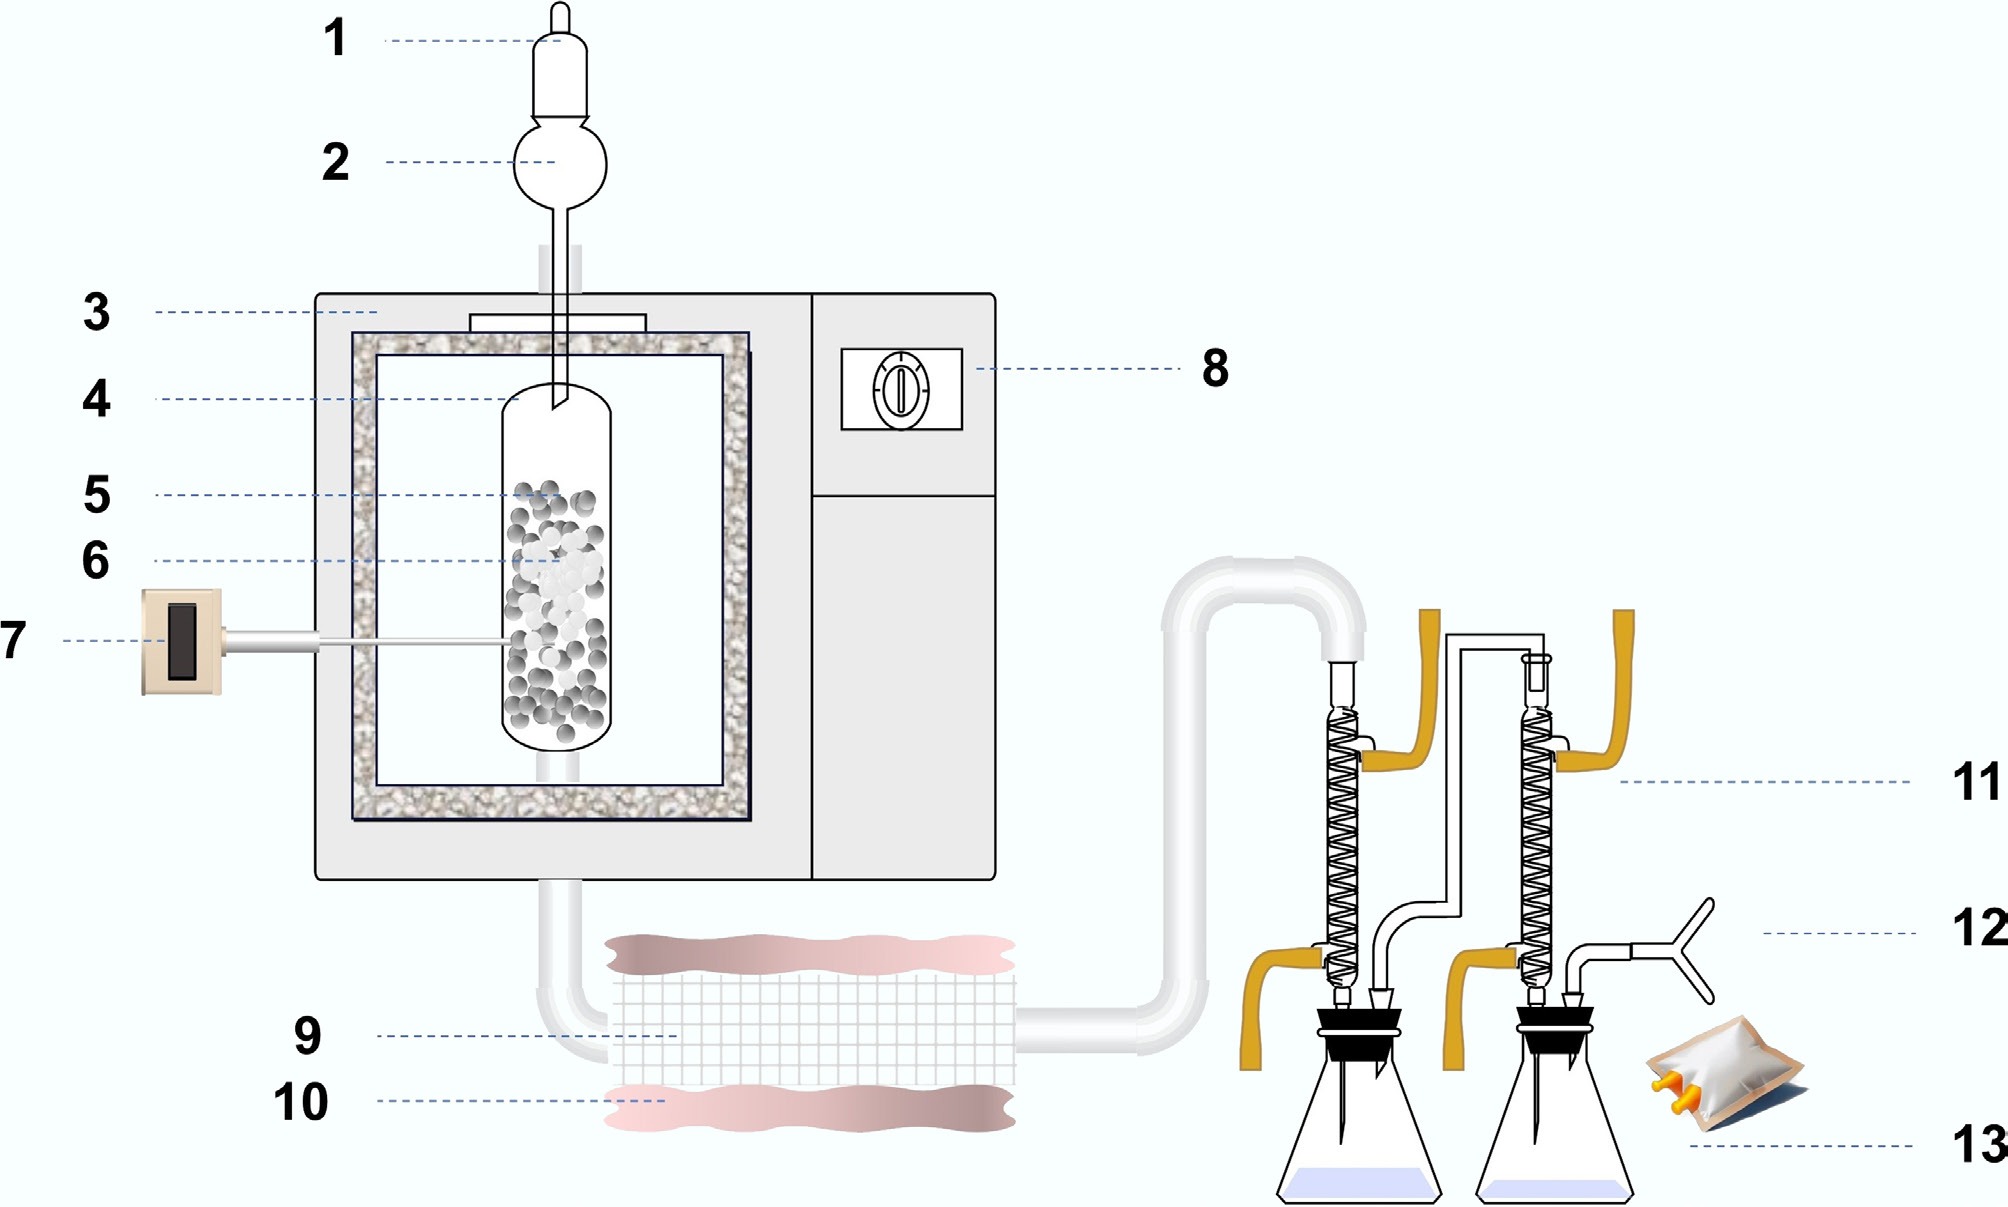
Figure 1.
Schematic of the catalytic pyrolysis system and product collection setup. (1) N2 carrier gas; (2) feed hopper; (3) microwave pyrolysis furnace; (4) quartz reactor; (5) SiC bed zone; (6) plastic particles; (7) temperature sensor; (8) system controller; (9) catalyst; (10) thermal insulation belt; (11) condenser; (12) gas collection (sampling bag); (13) liquid collection.
-
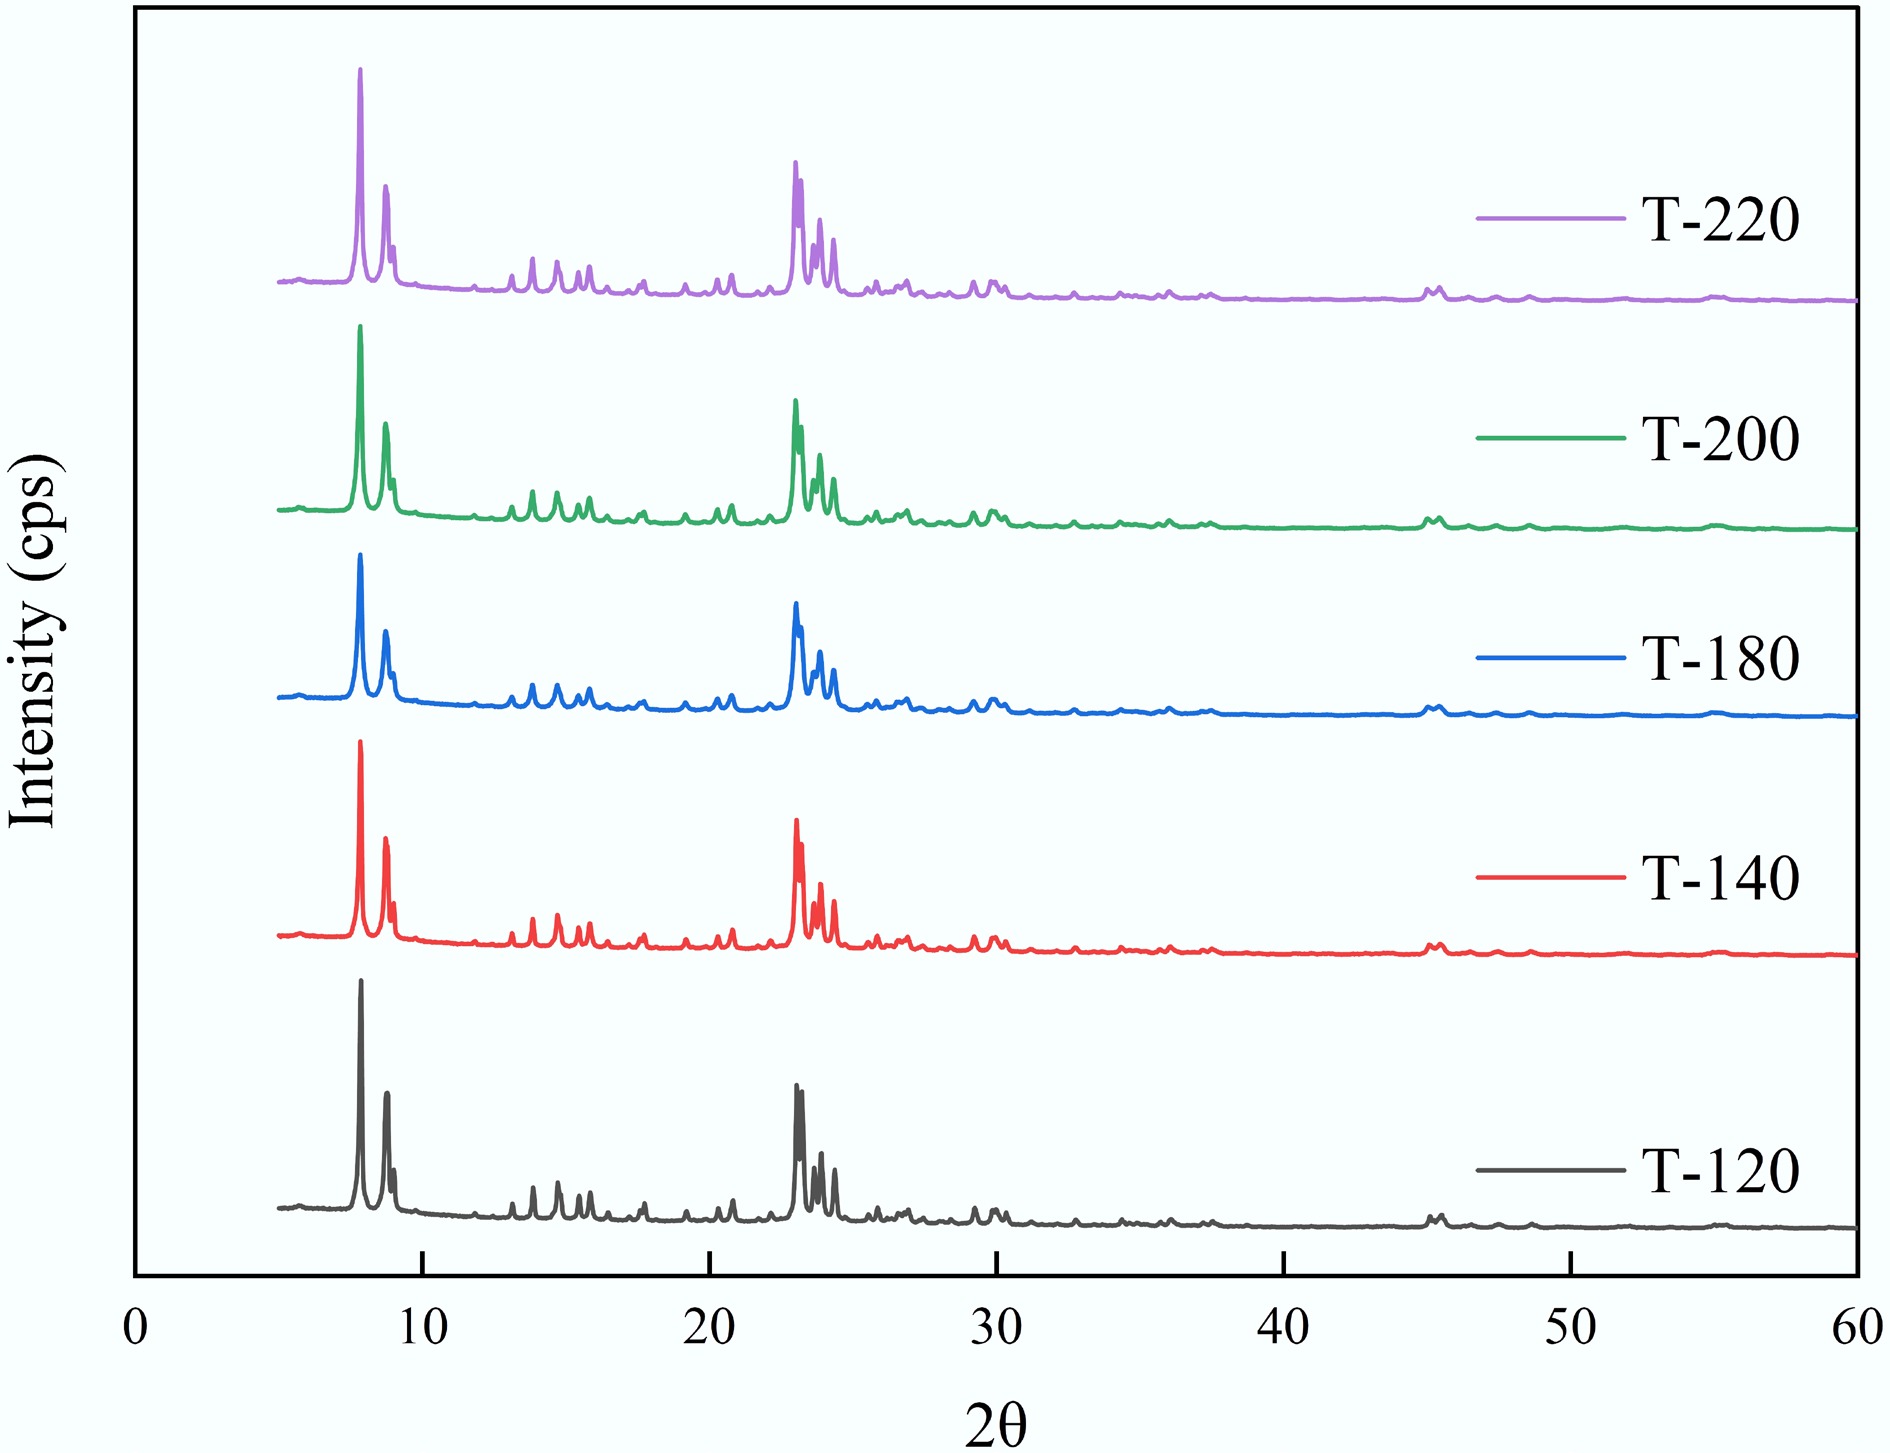
Figure 2.
Normalized XRD patterns of ZSM-5 catalysts synthesized at different crystallization temperatures (T-120, T-140, T-180, T-200, and T-220).
-
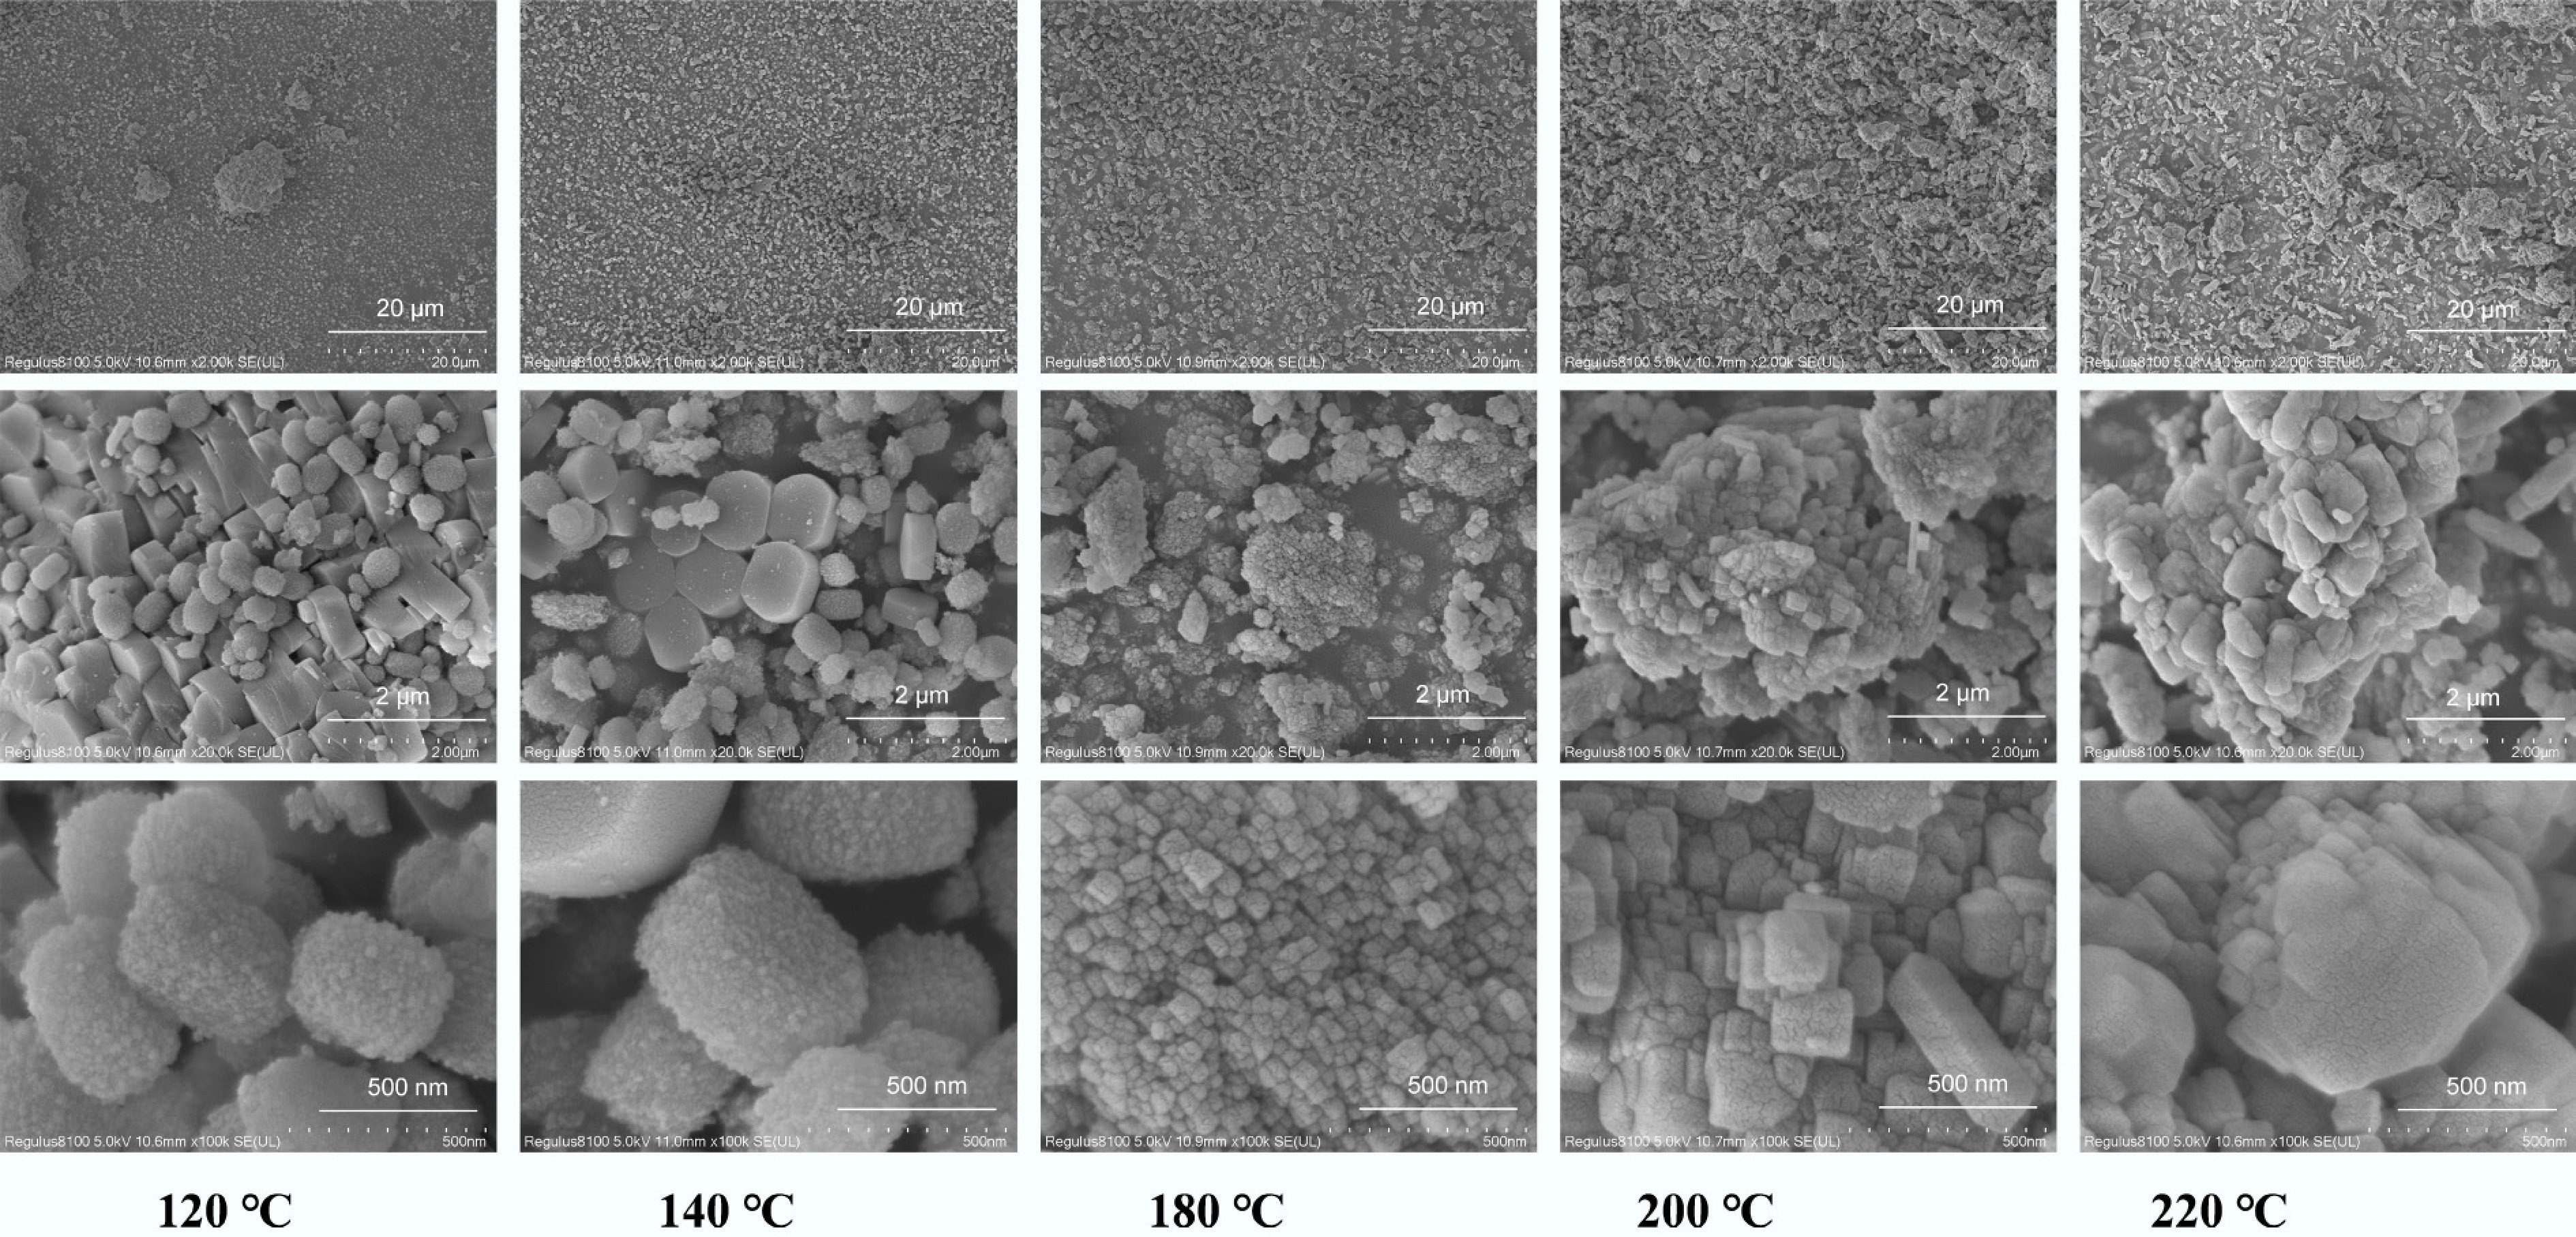
Figure 3.
SEM images of hierarchical ZSM-5 synthesized at different crystallization temperatures (T-120, T-140, T-180, T-200, and T-220). For each sample, images were acquired at 2,000×, 20,000×, and 100,000× to illustrate the morphology evolution from nanocrystal-assembled aggregates to coarsened, densely intergrown crystallites with increasing crystallization temperature.
-
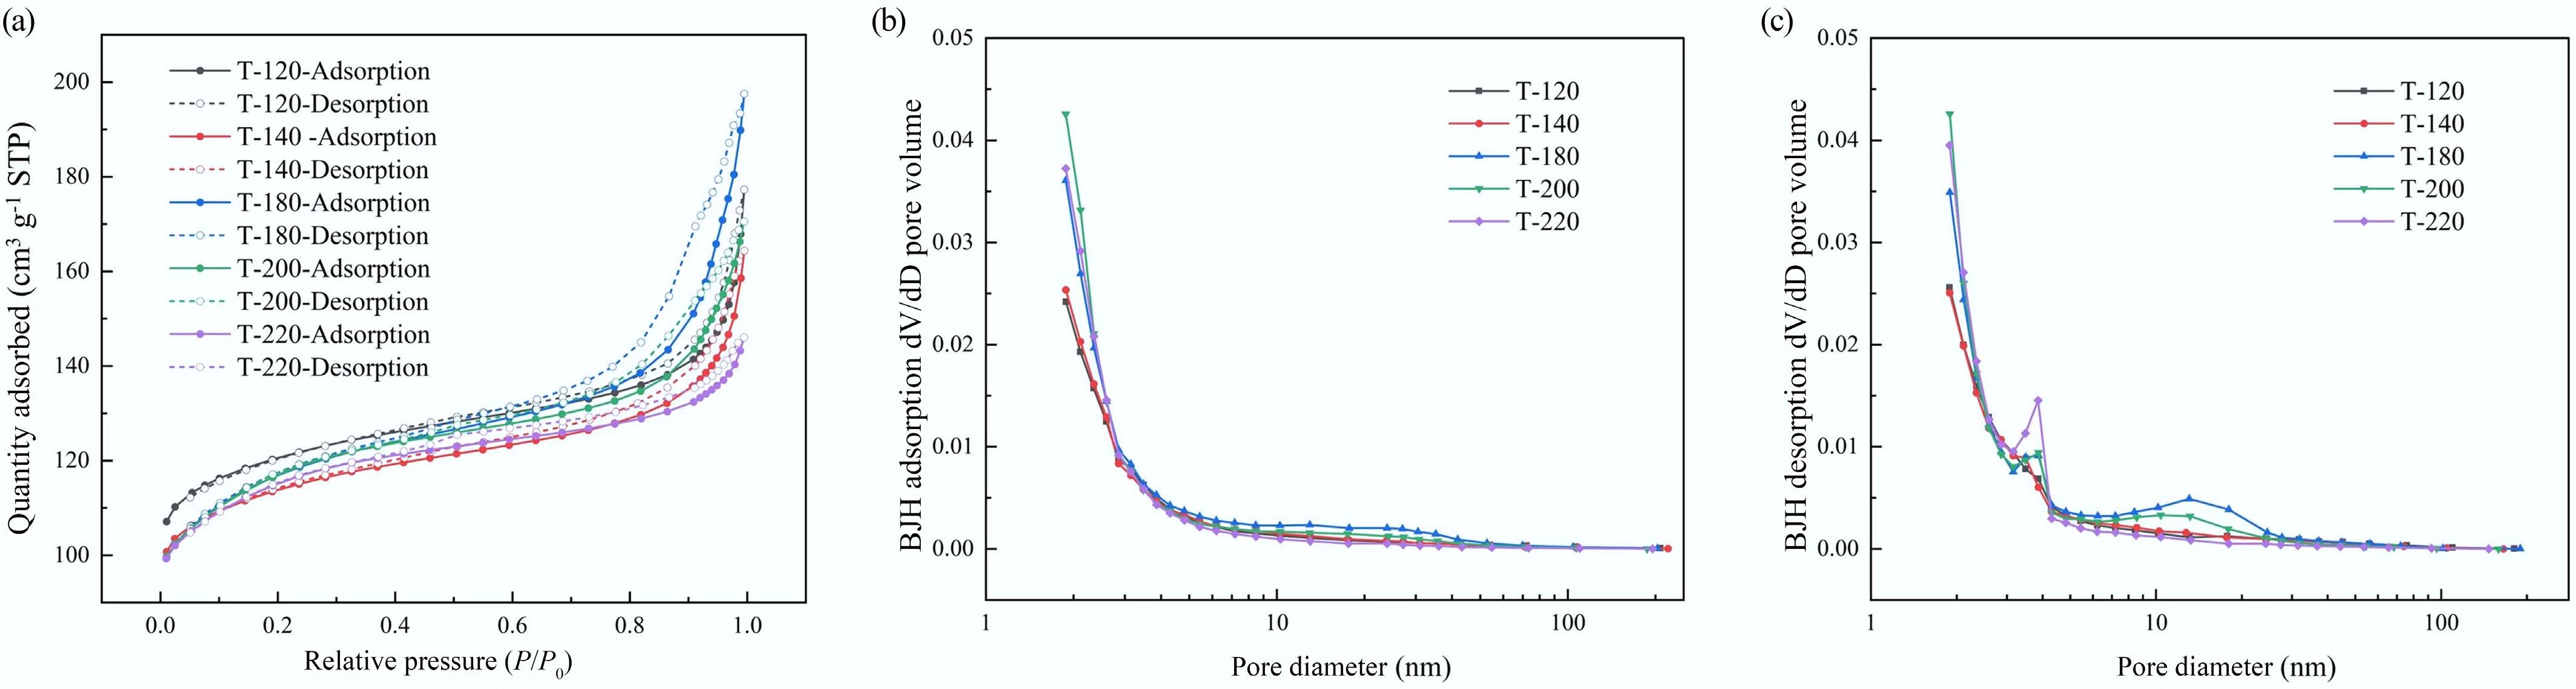
Figure 4.
N2 physisorption characterization of hierarchical ZSM-5 catalysts synthesized at different crystallization temperatures: (a) BET isotherm (Isotherm linear plot); (b) BJH adsorption pore size distribution (dV/dD pore volume); (c) BJH desorption pore size distribution (dV/dD pore volume).
-
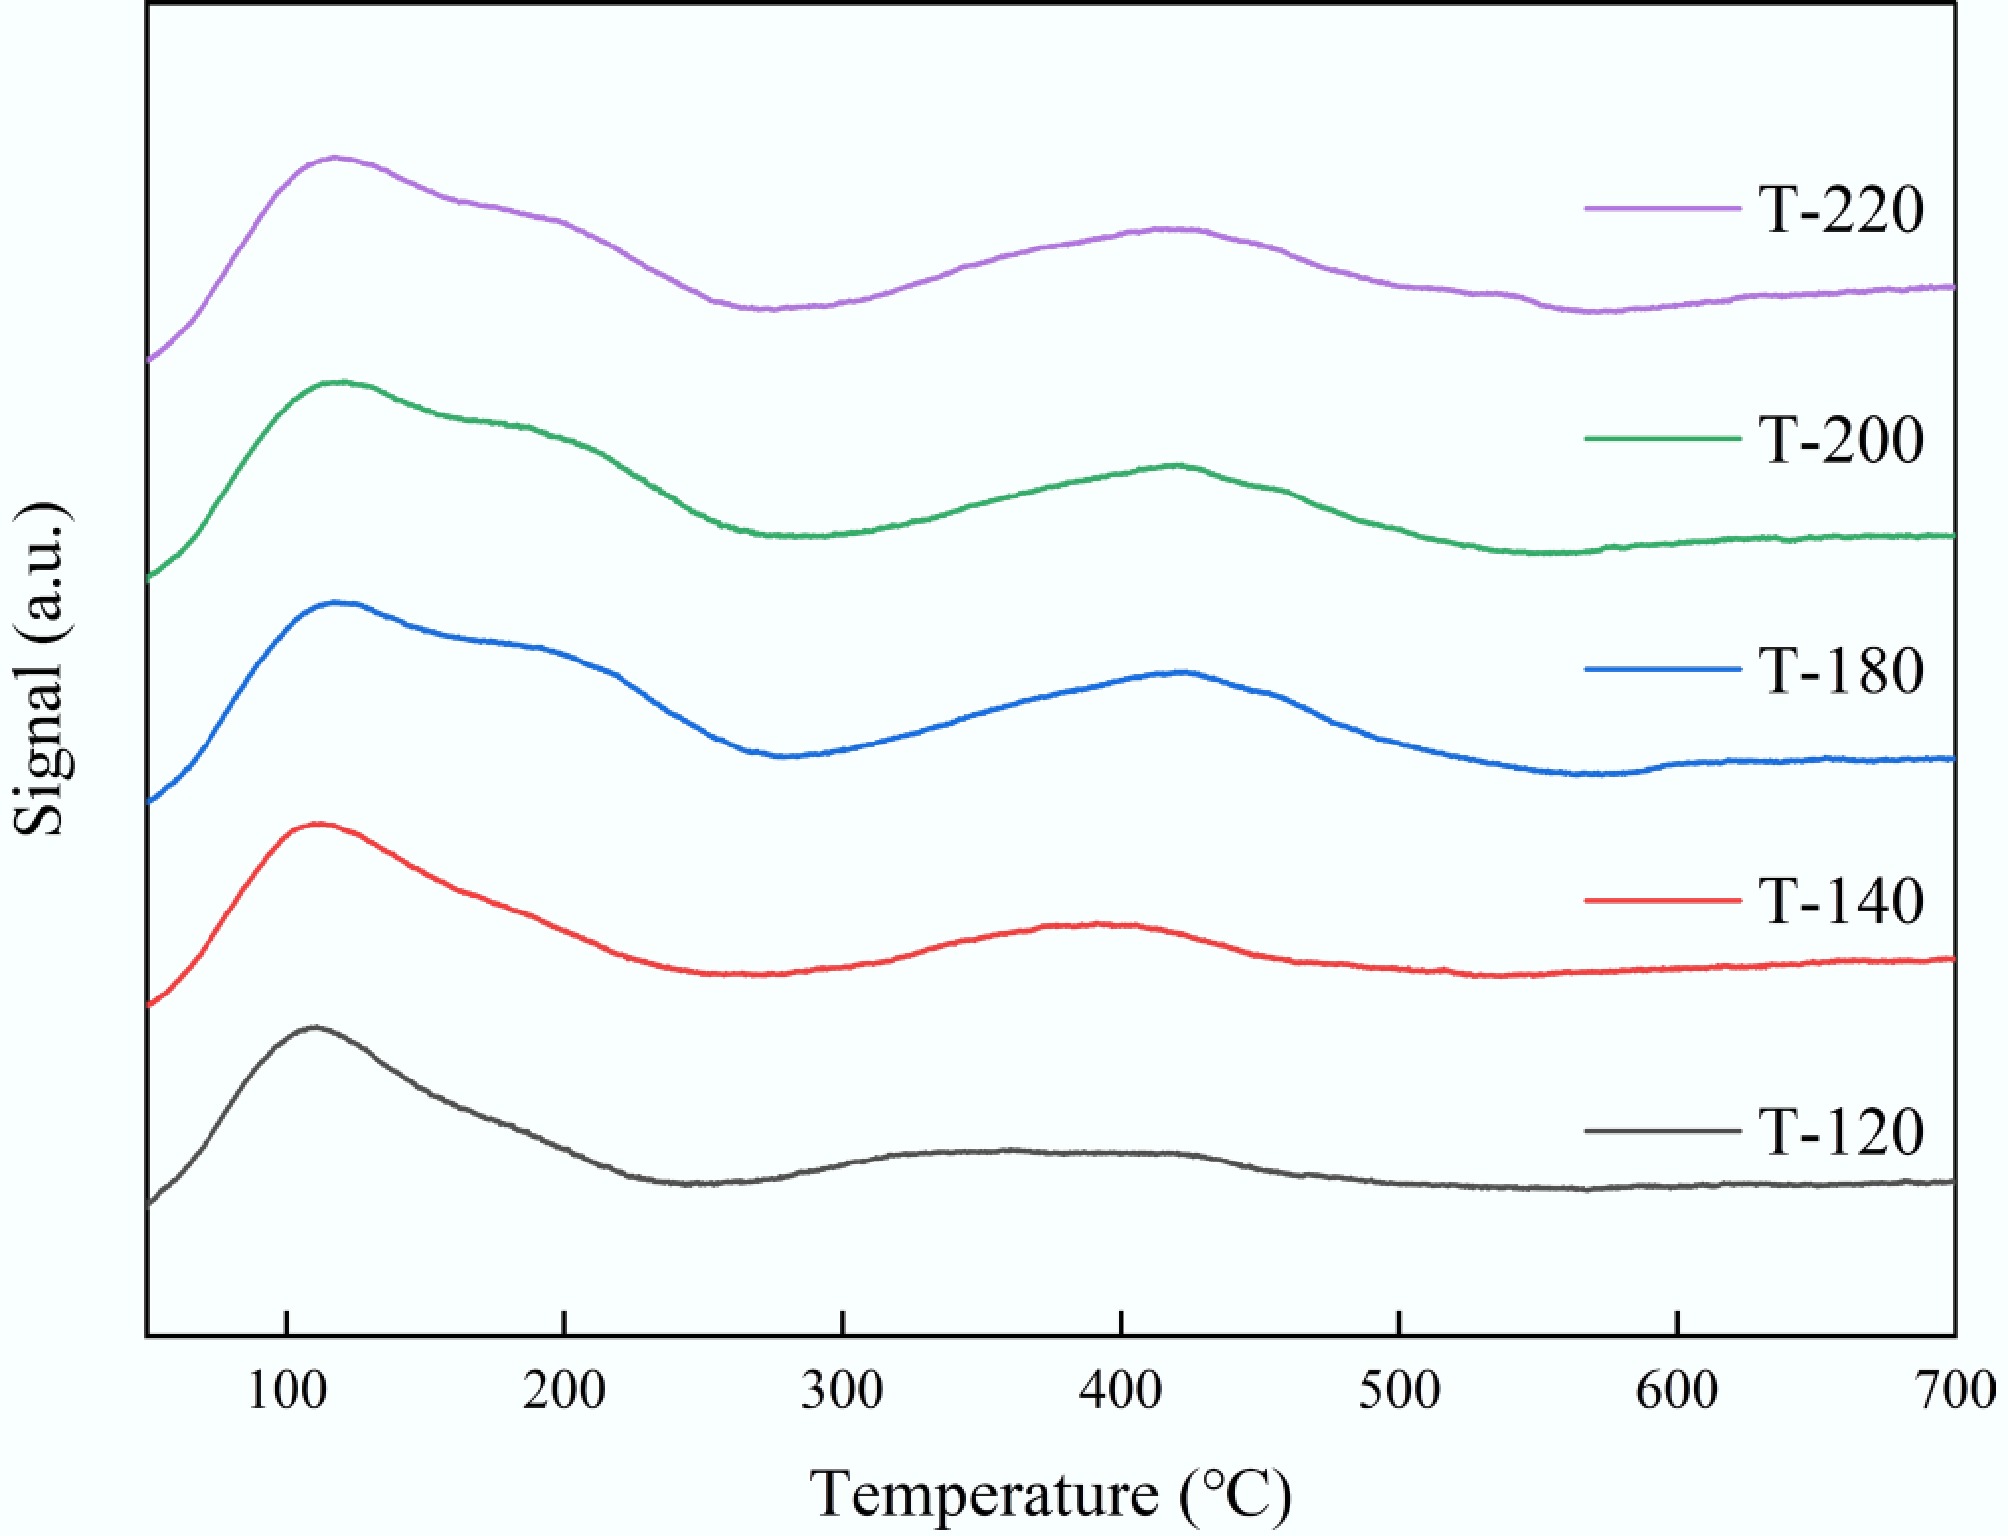
Figure 5.
NH3-TPD profiles of ZSM-5 synthesized at different crystallization temperatures (T-120, T-140, T-180, T-200, and T-220).
-
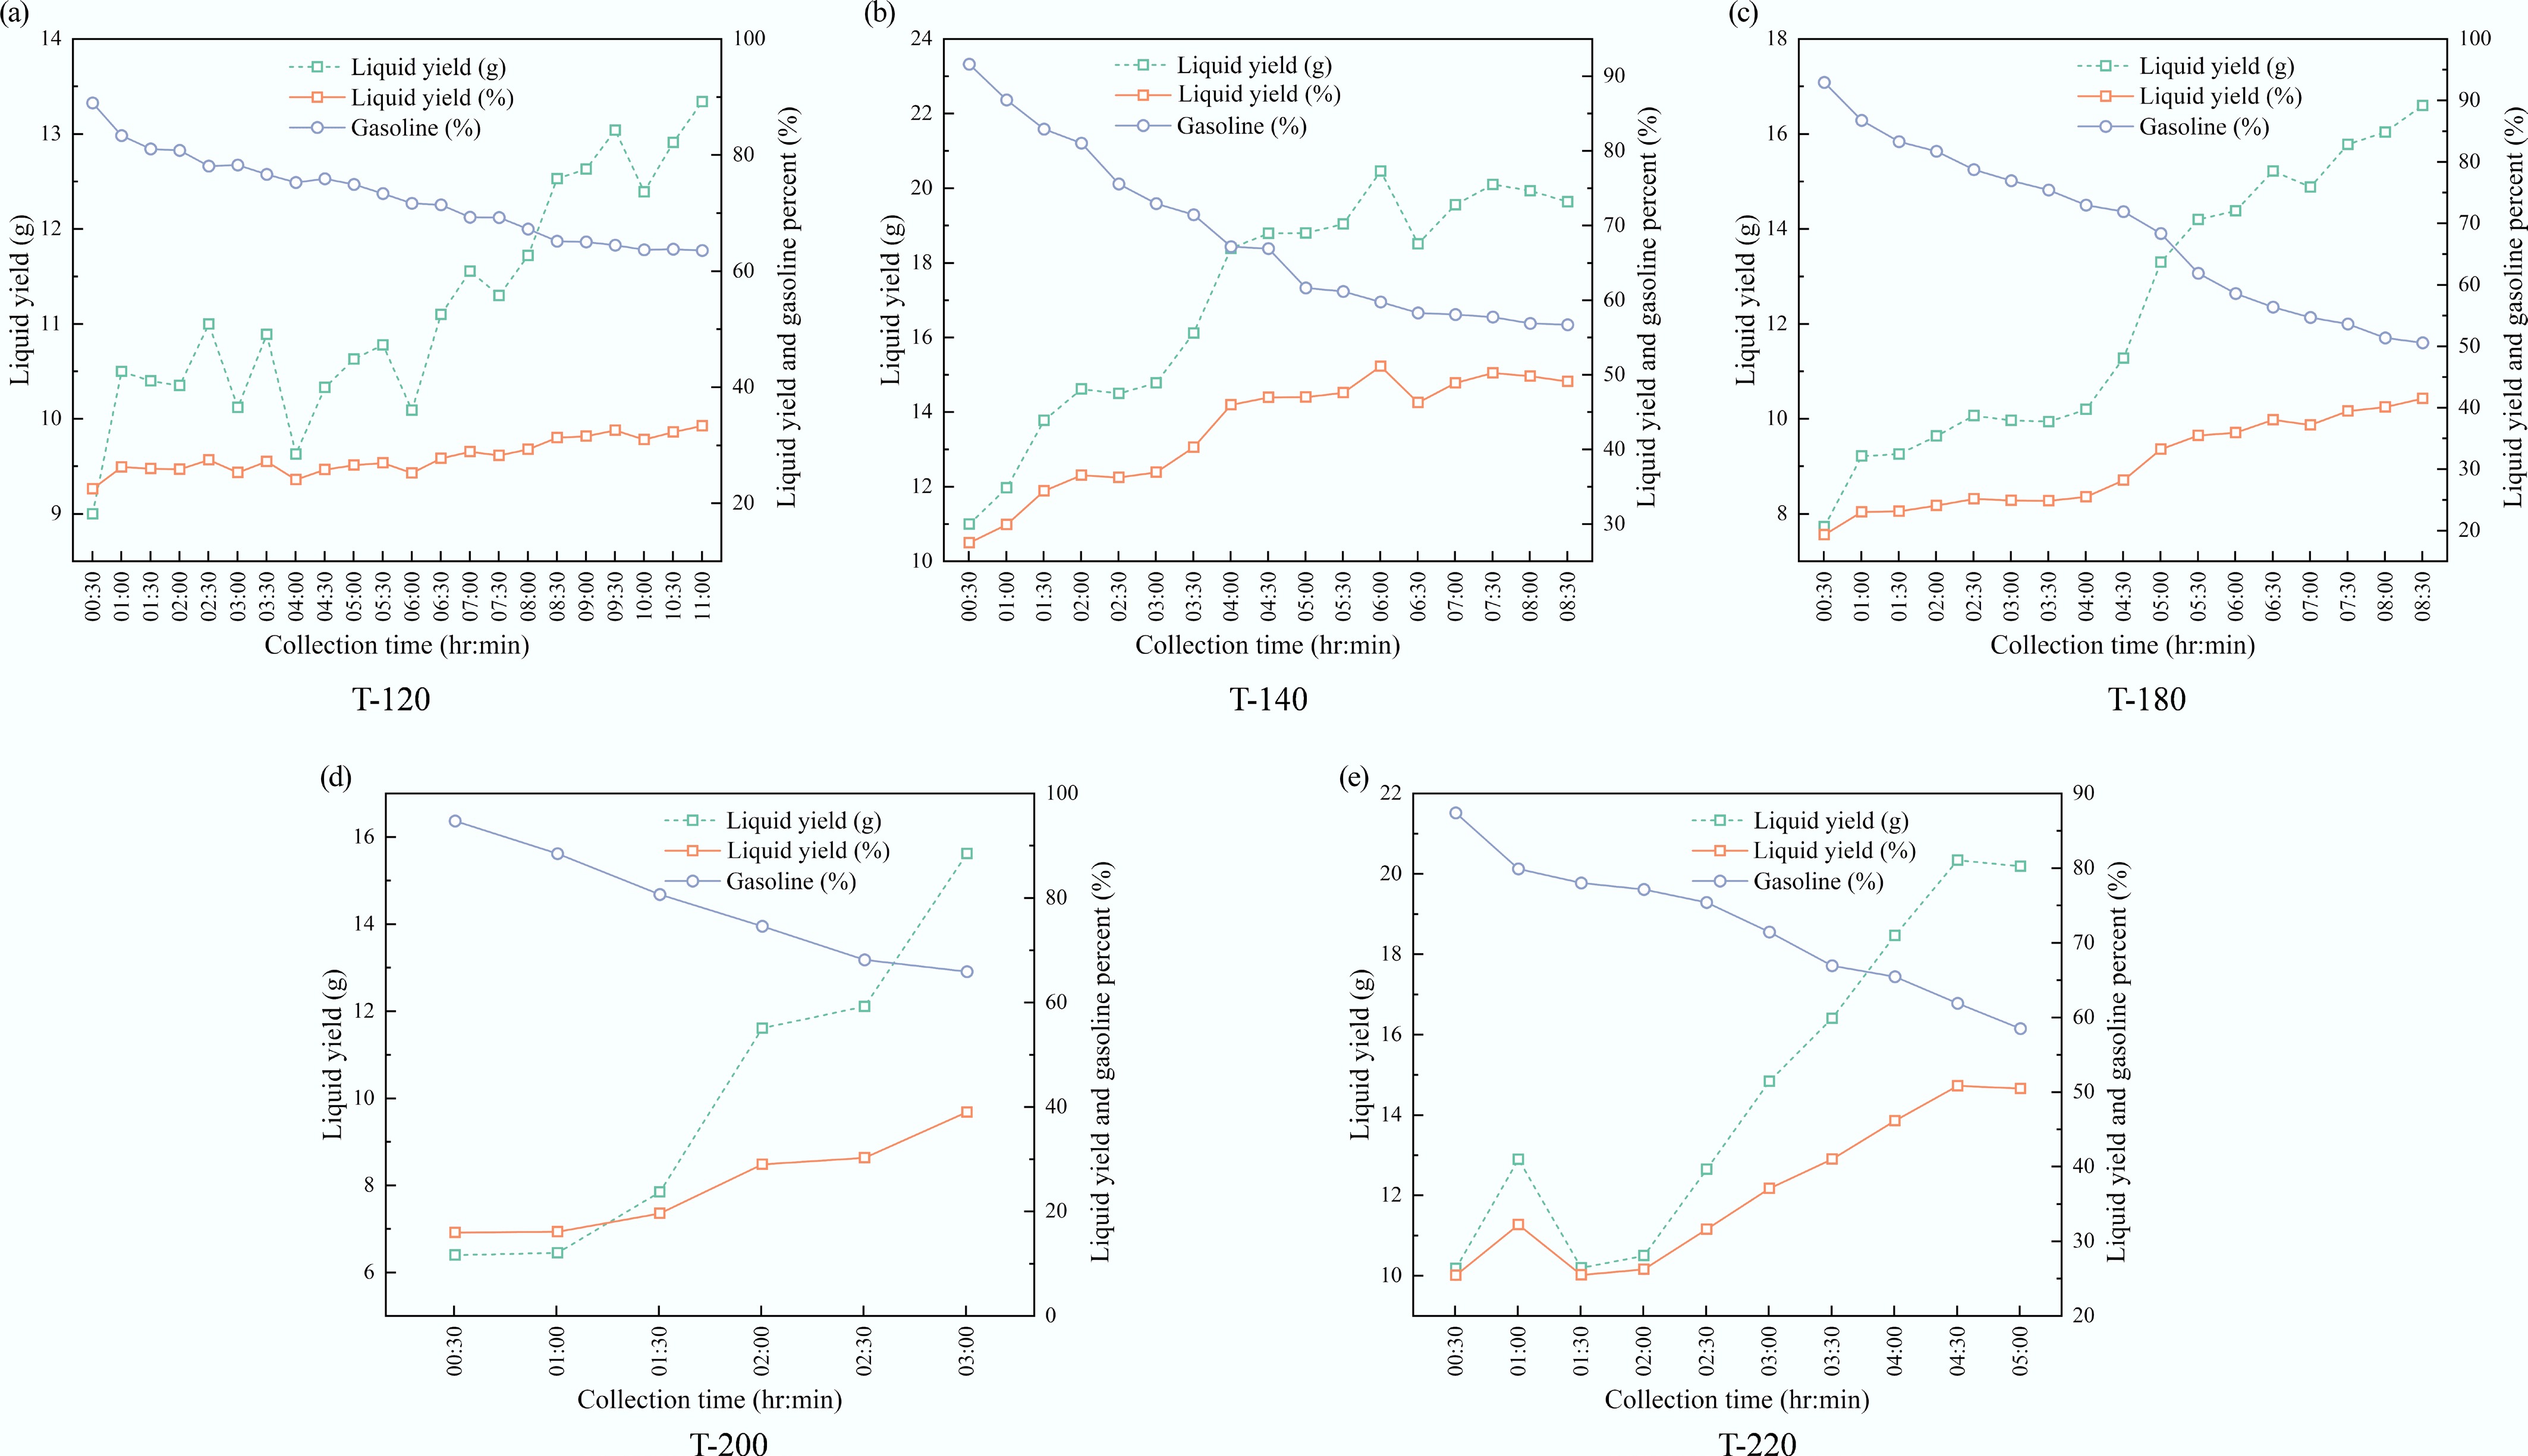
Figure 6.
Time-resolved composition of condensed liquid products over ZSM-5 catalysts synthesized at different crystallization temperatures: (a) 120 °C, (b) 140 °C, (c) 180 °C, (d) 200 °C, and (e) 220 °C.
-
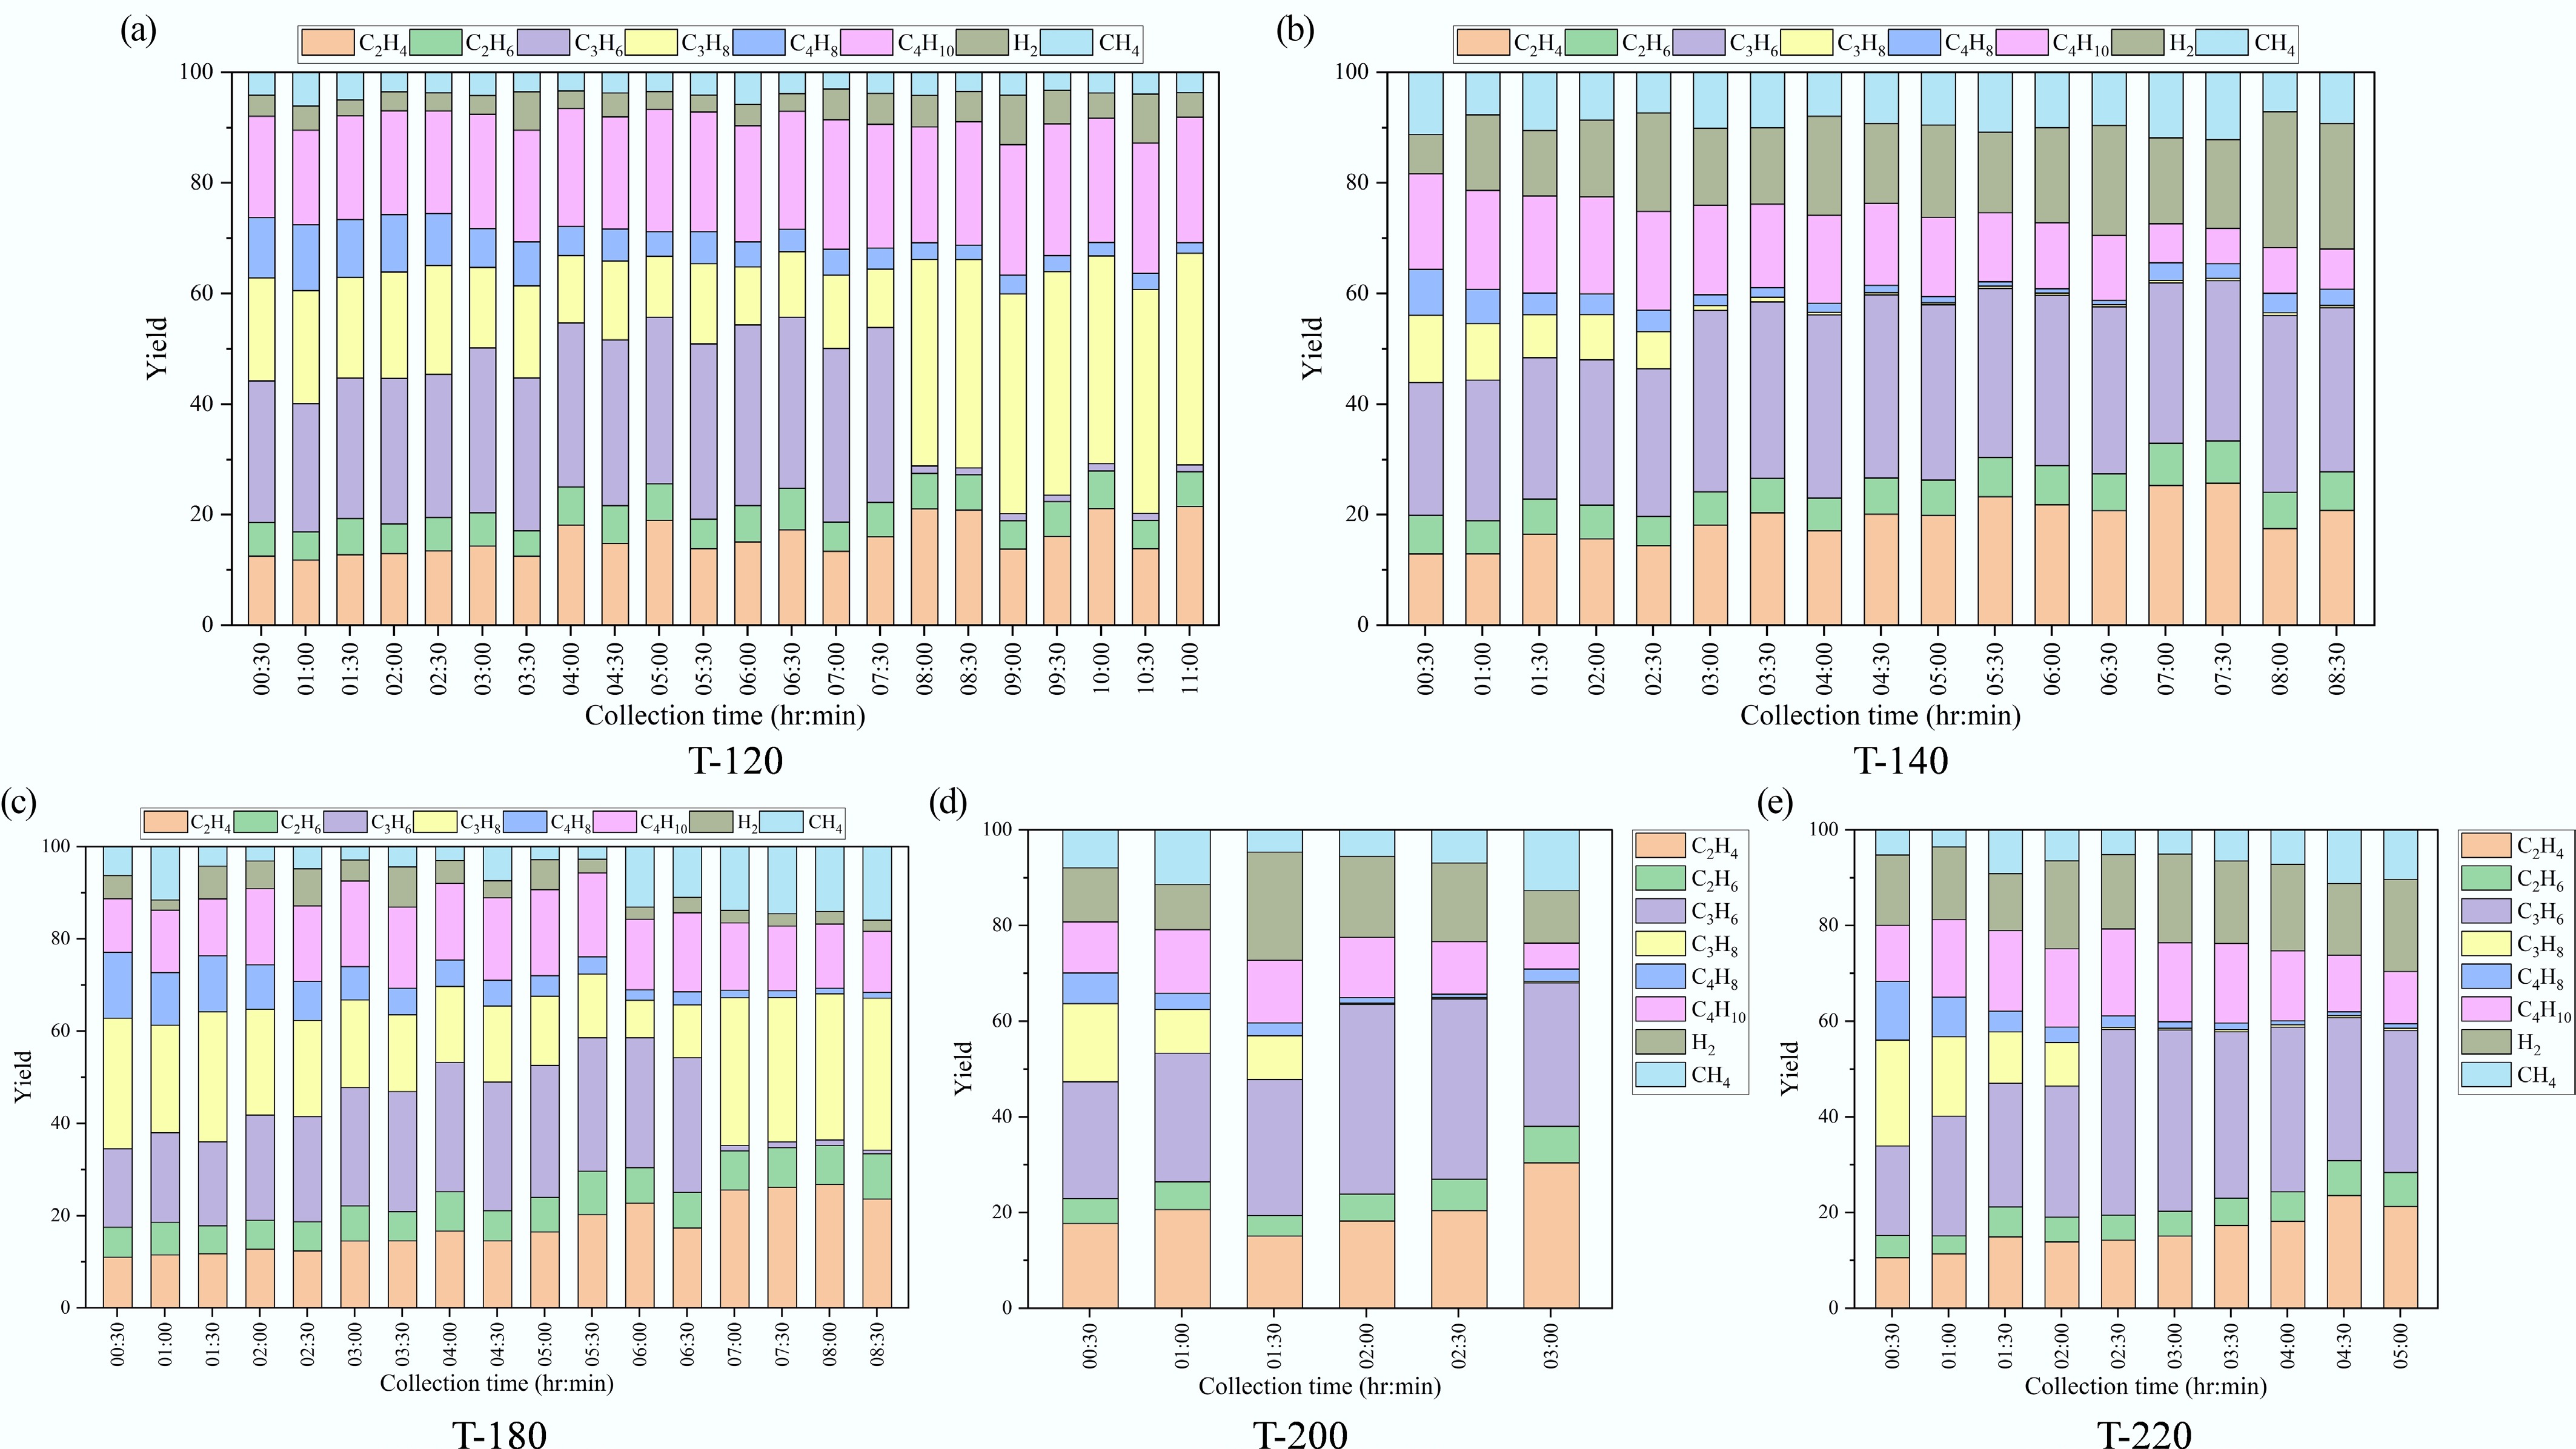
Figure 7.
Time-resolved composition of gas products over ZSM-5 catalysts synthesized at different crystallization temperatures: (a) 120 °C, (b) 140 °C, (c) 180 °C, (d) 200 °C, and (e) 220 °C.
-
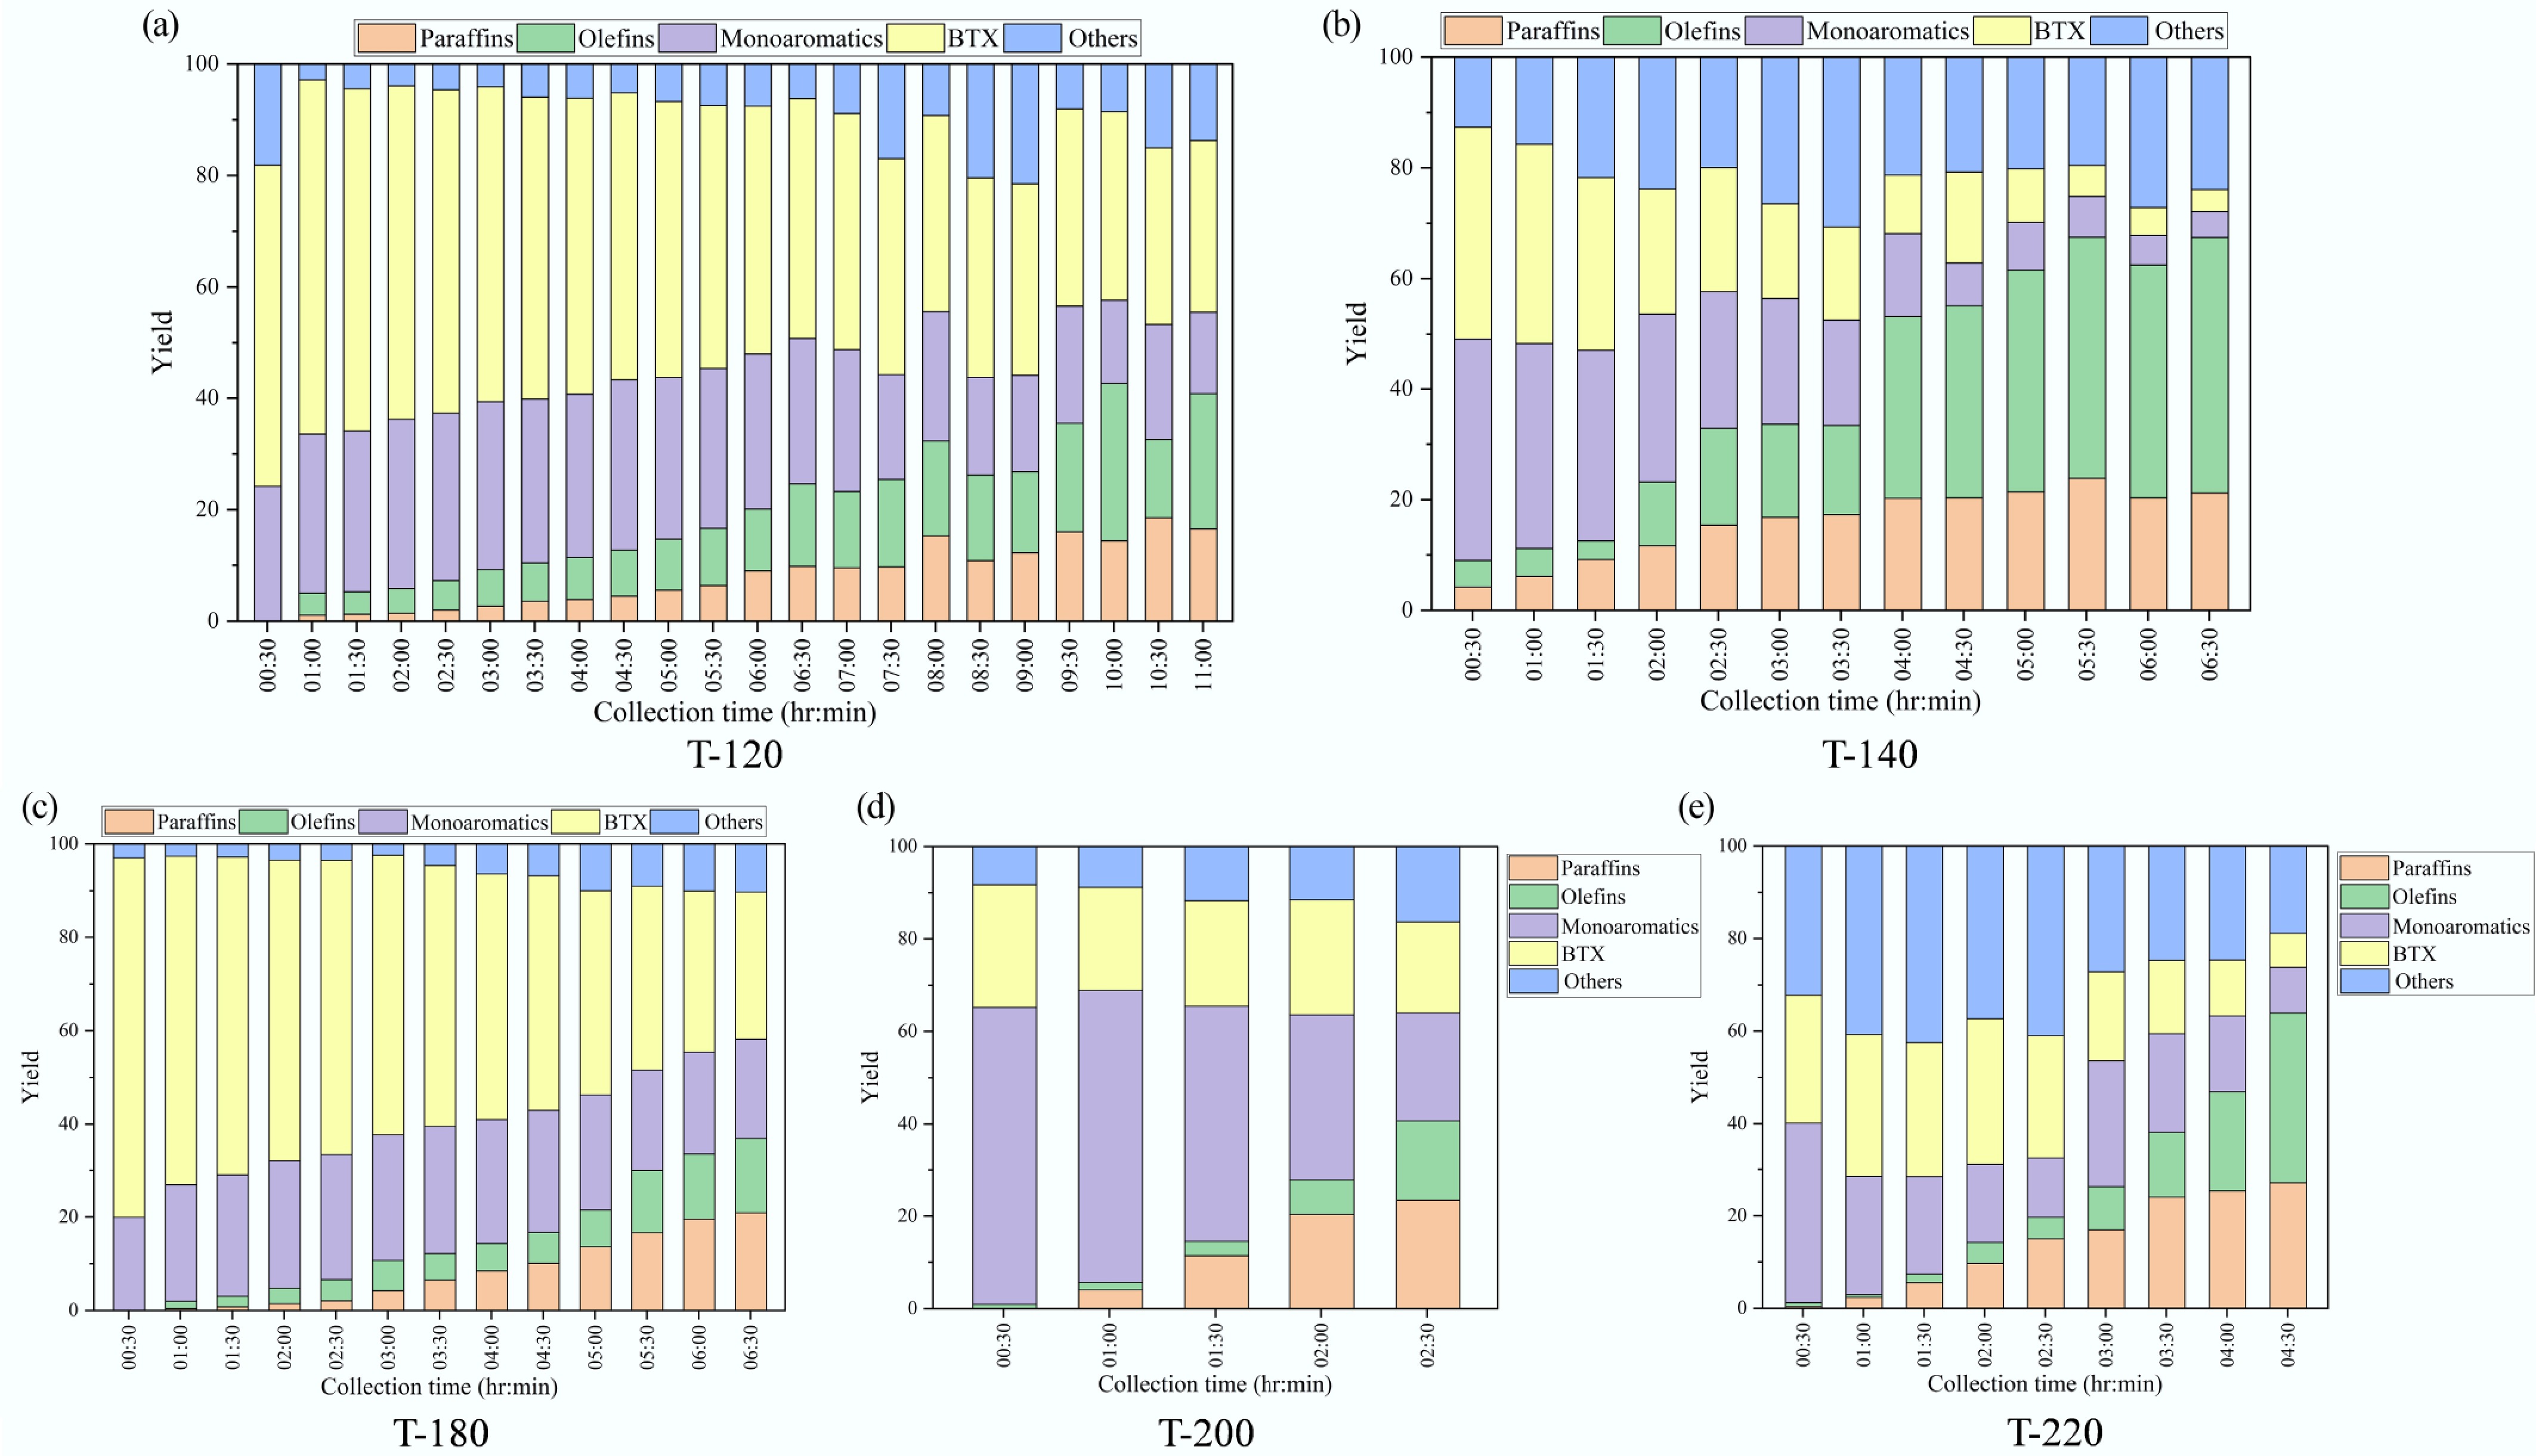
Figure 8.
Time-resolved liquid product speciation during catalytic pyrolysis over ZSM-5 catalysts synthesized at different crystallization temperatures (paraffins, olefins, monoaromatics, BTX, and others; mass fraction): (a) 120 °C, (b) 140 °C, (c) 180 °C, (d) 200 °C, and (e) 220 °C.
-
Sample SBET (m2 g−1) Vtotal (cm3 g−1) Vmicro (cm3 g−1) Sext (m2 g−1) Vmeso (cm3 g−1) DBJH (nm) T-120 467.3 0.274 0.147 88.7 0.111 7.67 T-140 439.0 0.254 0.136 91.1 0.102 6.89 T-180 437.1 0.306 0.125 126.5 0.157 7.87 T-200 435.7 0.264 0.122 132.7 0.115 5.85 T-220 434.5 0.226 0.127 116.5 0.075 4.47 SBET from BET method; Vtotal from single-point adsorption at P/P0 = 0.995; Vmicro and Sext from t-plot; Vmeso and average pore diameter DBJH from BJH adsorption branch (1.7–300 nm). Table 1.
Textural properties of ZSM-5 catalysts synthesized at different crystallization temperatures derived from N2 physisorption (BET), t-plot, and BJH analyses
-
Sample Peak 1 Tmax (°C) Peak 1 NH3 (mmol g−1) Peak 2 Tmax (°C) Peak 2 NH3 (mmol g−1) Total acidity (mmol g−1) Strong-acid fraction (%) T-120 111.06 0.40 360.15 0.16 0.56 28.79 T-140 112.27 0.14 391.26 0.06 0.20 29.77 T-180 116.88 0.20 419.65 0.13 0.32 40.15 T-200 120.38 0.19 420.05 0.10 0.29 34.05 T-220 116.81 0.19 412.20 0.12 0.32 38.72 Peak 1 (low-temperature) is typically assigned to weak/medium acid sites and/or weakly bound NH3; Peak 2 (high-temperature) corresponds to stronger acid sites (more strongly bound NH3). Reported acidity is the integrated NH3 quantity (mmol g−1). Strong-acid fraction = Peak 2/(Peak 1 + Peak 2). Table 2.
NH3-TPD-derived acidity of ZSM-5 catalysts synthesized at different crystallization temperatures
-
Catalyst G(t0) at 0.5 h (%) G at 3 h (%) tG=70% (h) tG=60% (h) G(tend) (%) tend (h) rG (%-pt h−1) T-120 88.98 78.28 6.83 - 63.55 11.0 −2.42 T-140 91.61 72.94 3.67 5.92 56.71 8.5 −4.36 T-180 92.92 76.92 4.77 5.78 50.58 8.5 −5.29 T-200 94.73 65.90 2.36 - 65.90 3.0 −11.53 T-220 87.41 71.45 3.16 4.78 58.50 5.0 −6.42 Gasoline is defined as the liquid fraction volatilized below 200 °C in TGA. tG=x values were obtained by linear interpolation (Eq. [4]). rG is calculated using Eq. (5). Table 3.
Gasoline indicators and deactivation metrics derived from TGA of condensed liquids
Figures
(8)
Tables
(3)