-
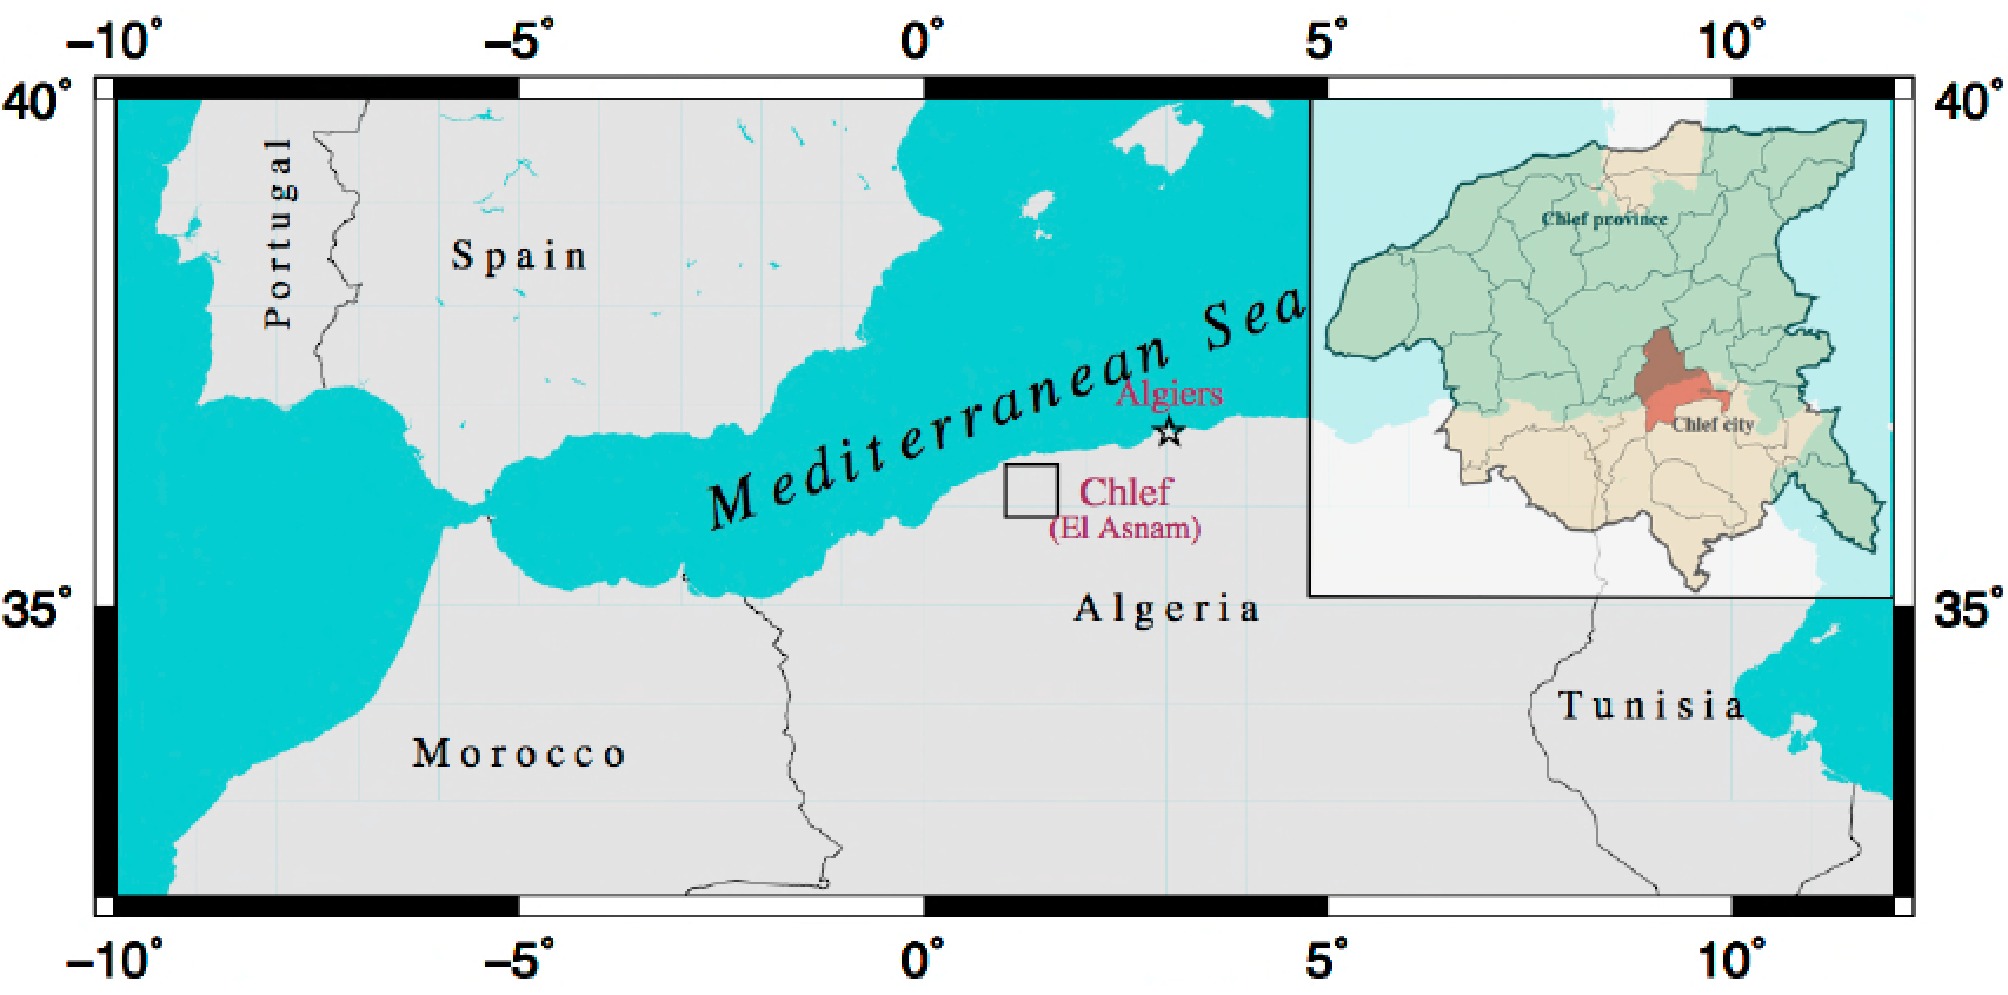
Figure 1.
Geographical location of Chlef City (black square) in northern Algeria and its location within Chlef province (transparent red area in the inset).
-
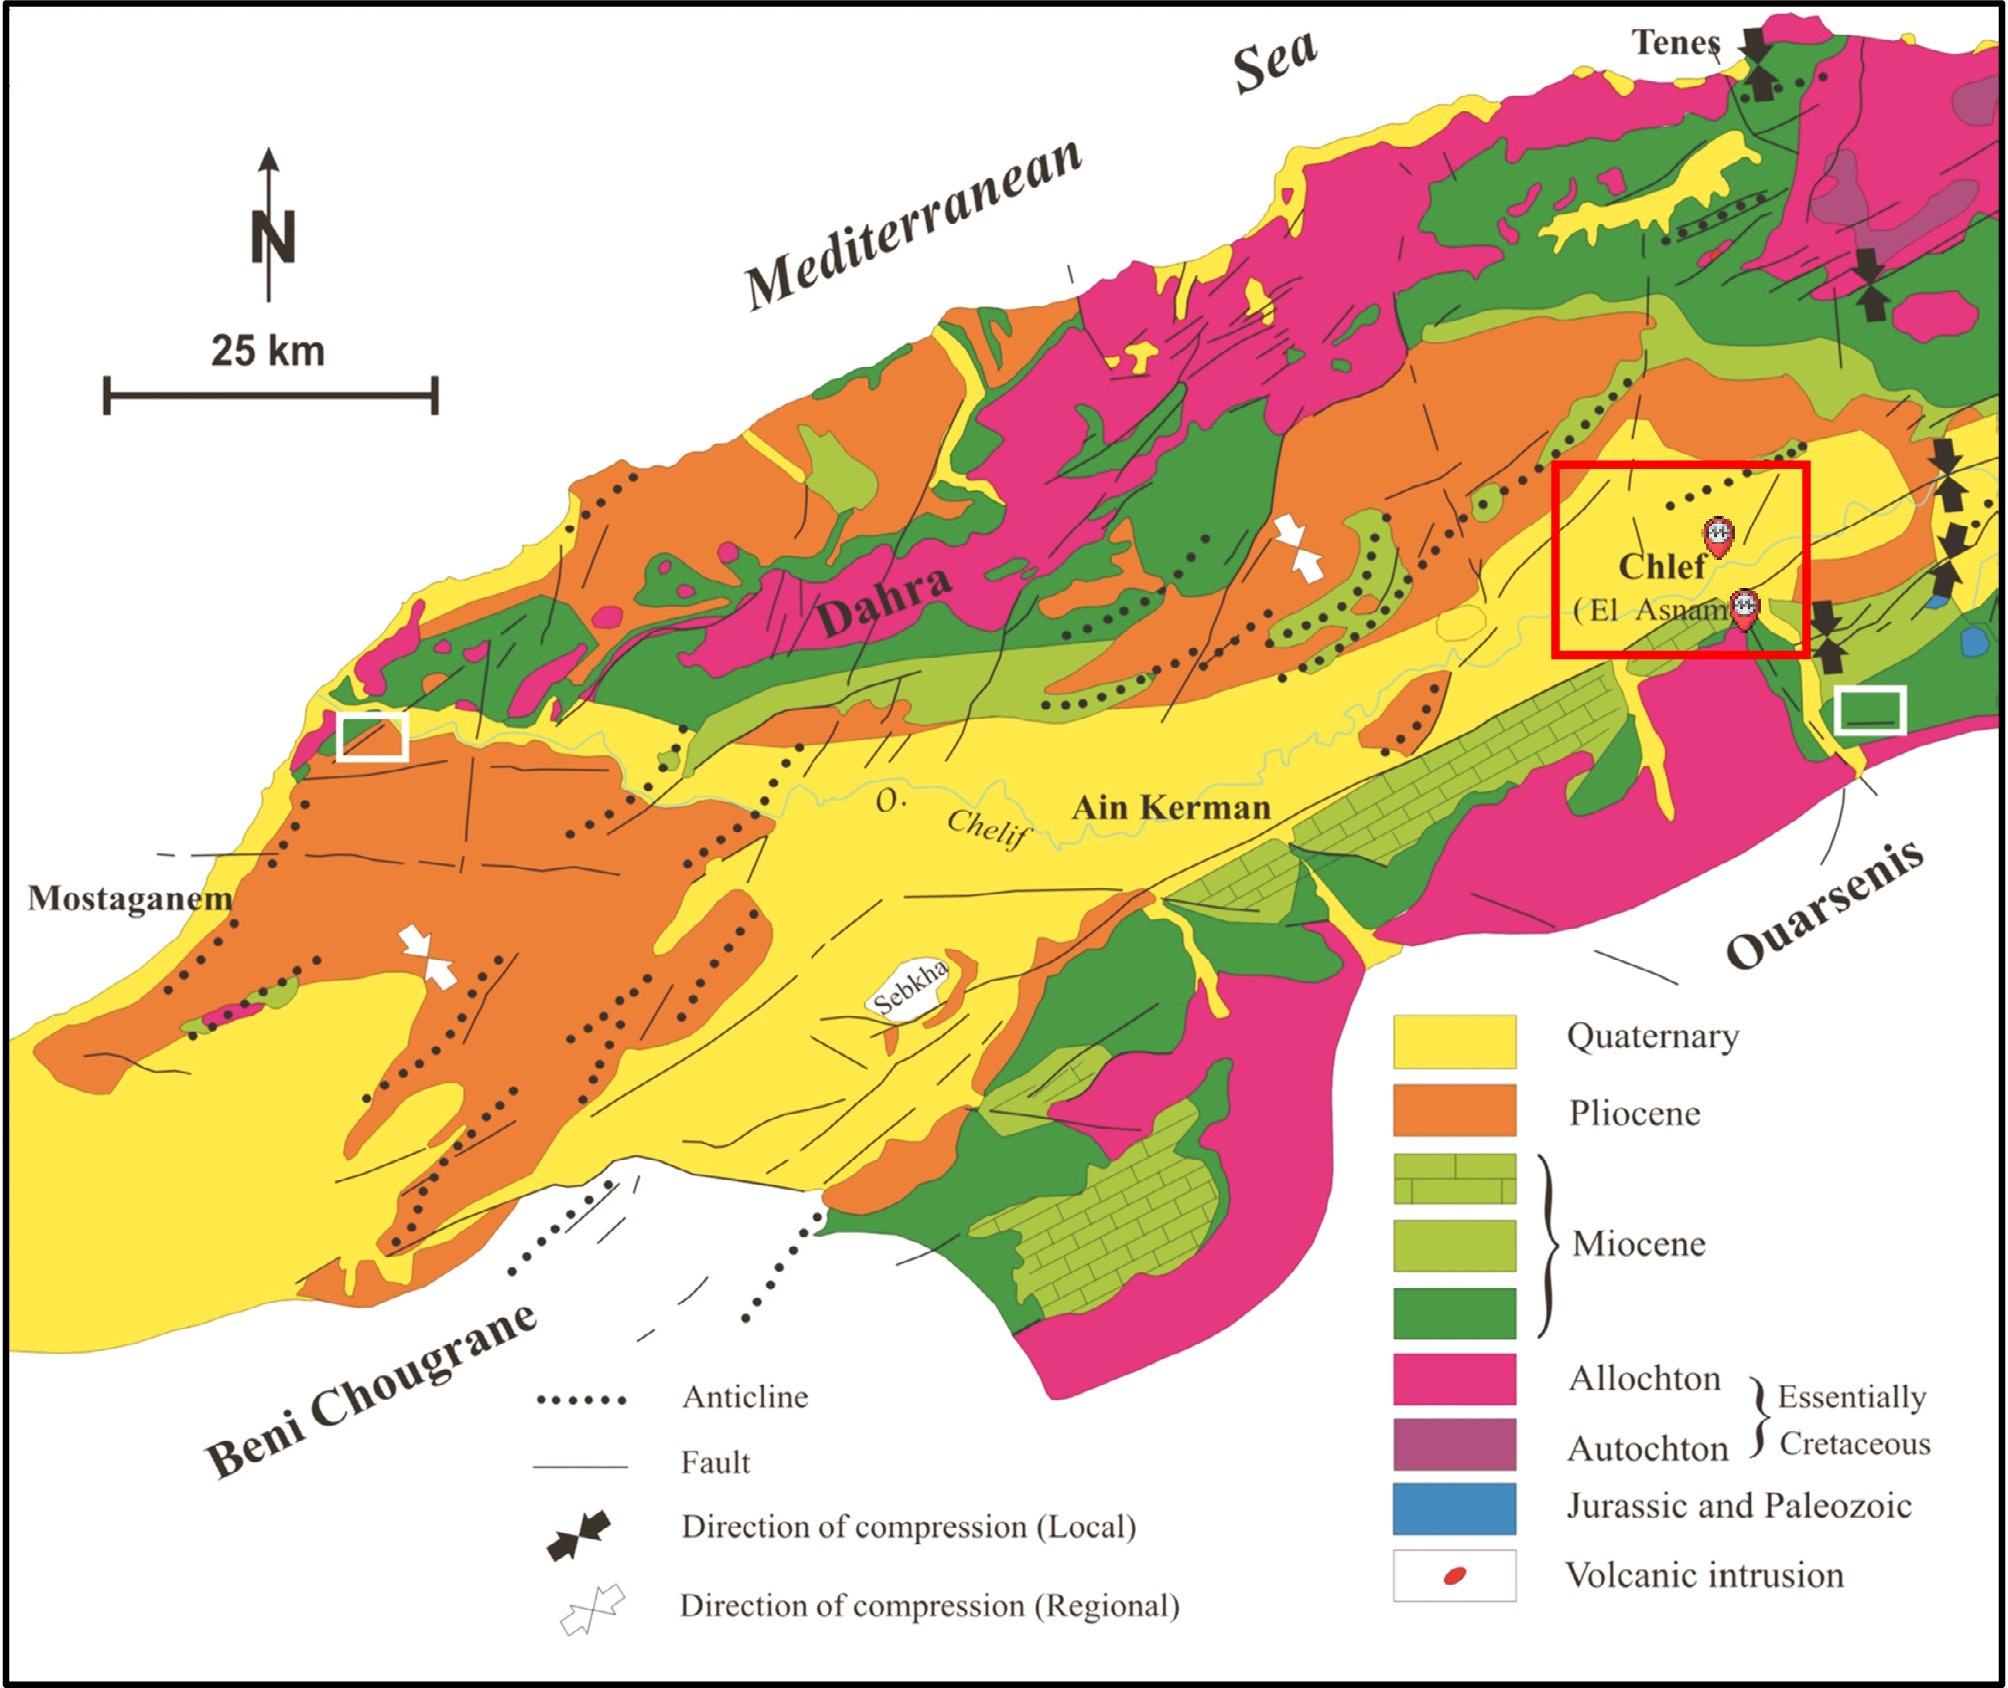
Figure 2.
Geological and seismotectonic map of the Chellif Basin region. The red frame encompasses the city of Chlef, the El Asnam fault, and the earthquake emblems representing the two major seismic events of 1954 and 1980 (modified from Hadji et al.[26]).
-
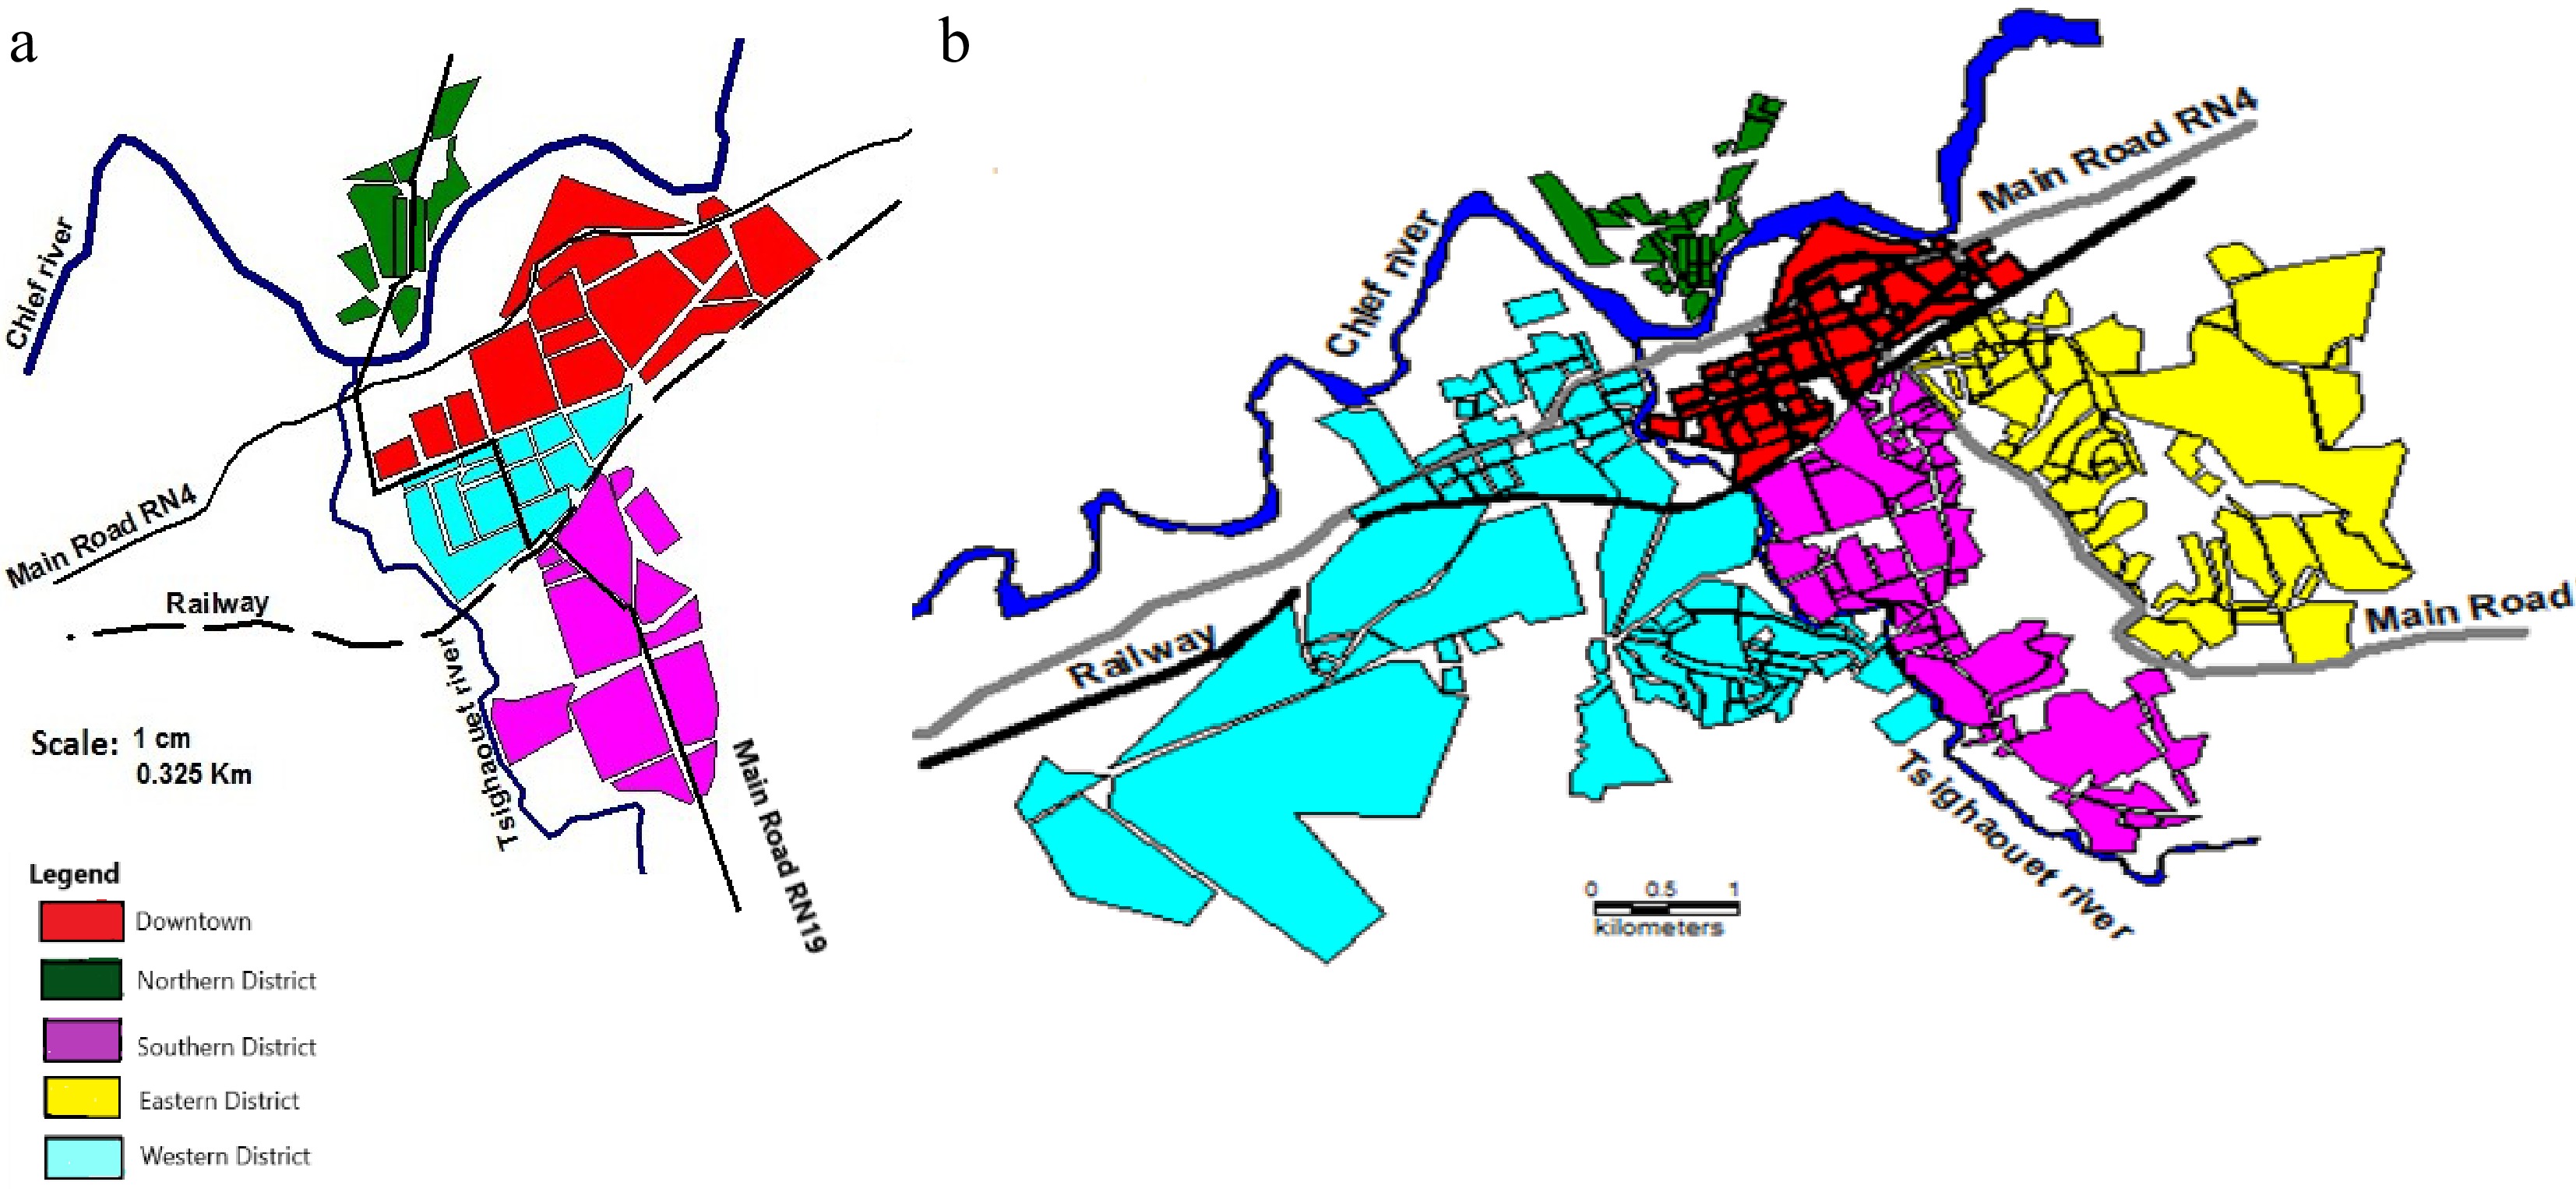
Figure 3.
Urban landscape of Chlef City: (a) before the 1980 earthquake, and (b) after the 1980 earthquake (modified from Boutaraa et al.[9]).
-
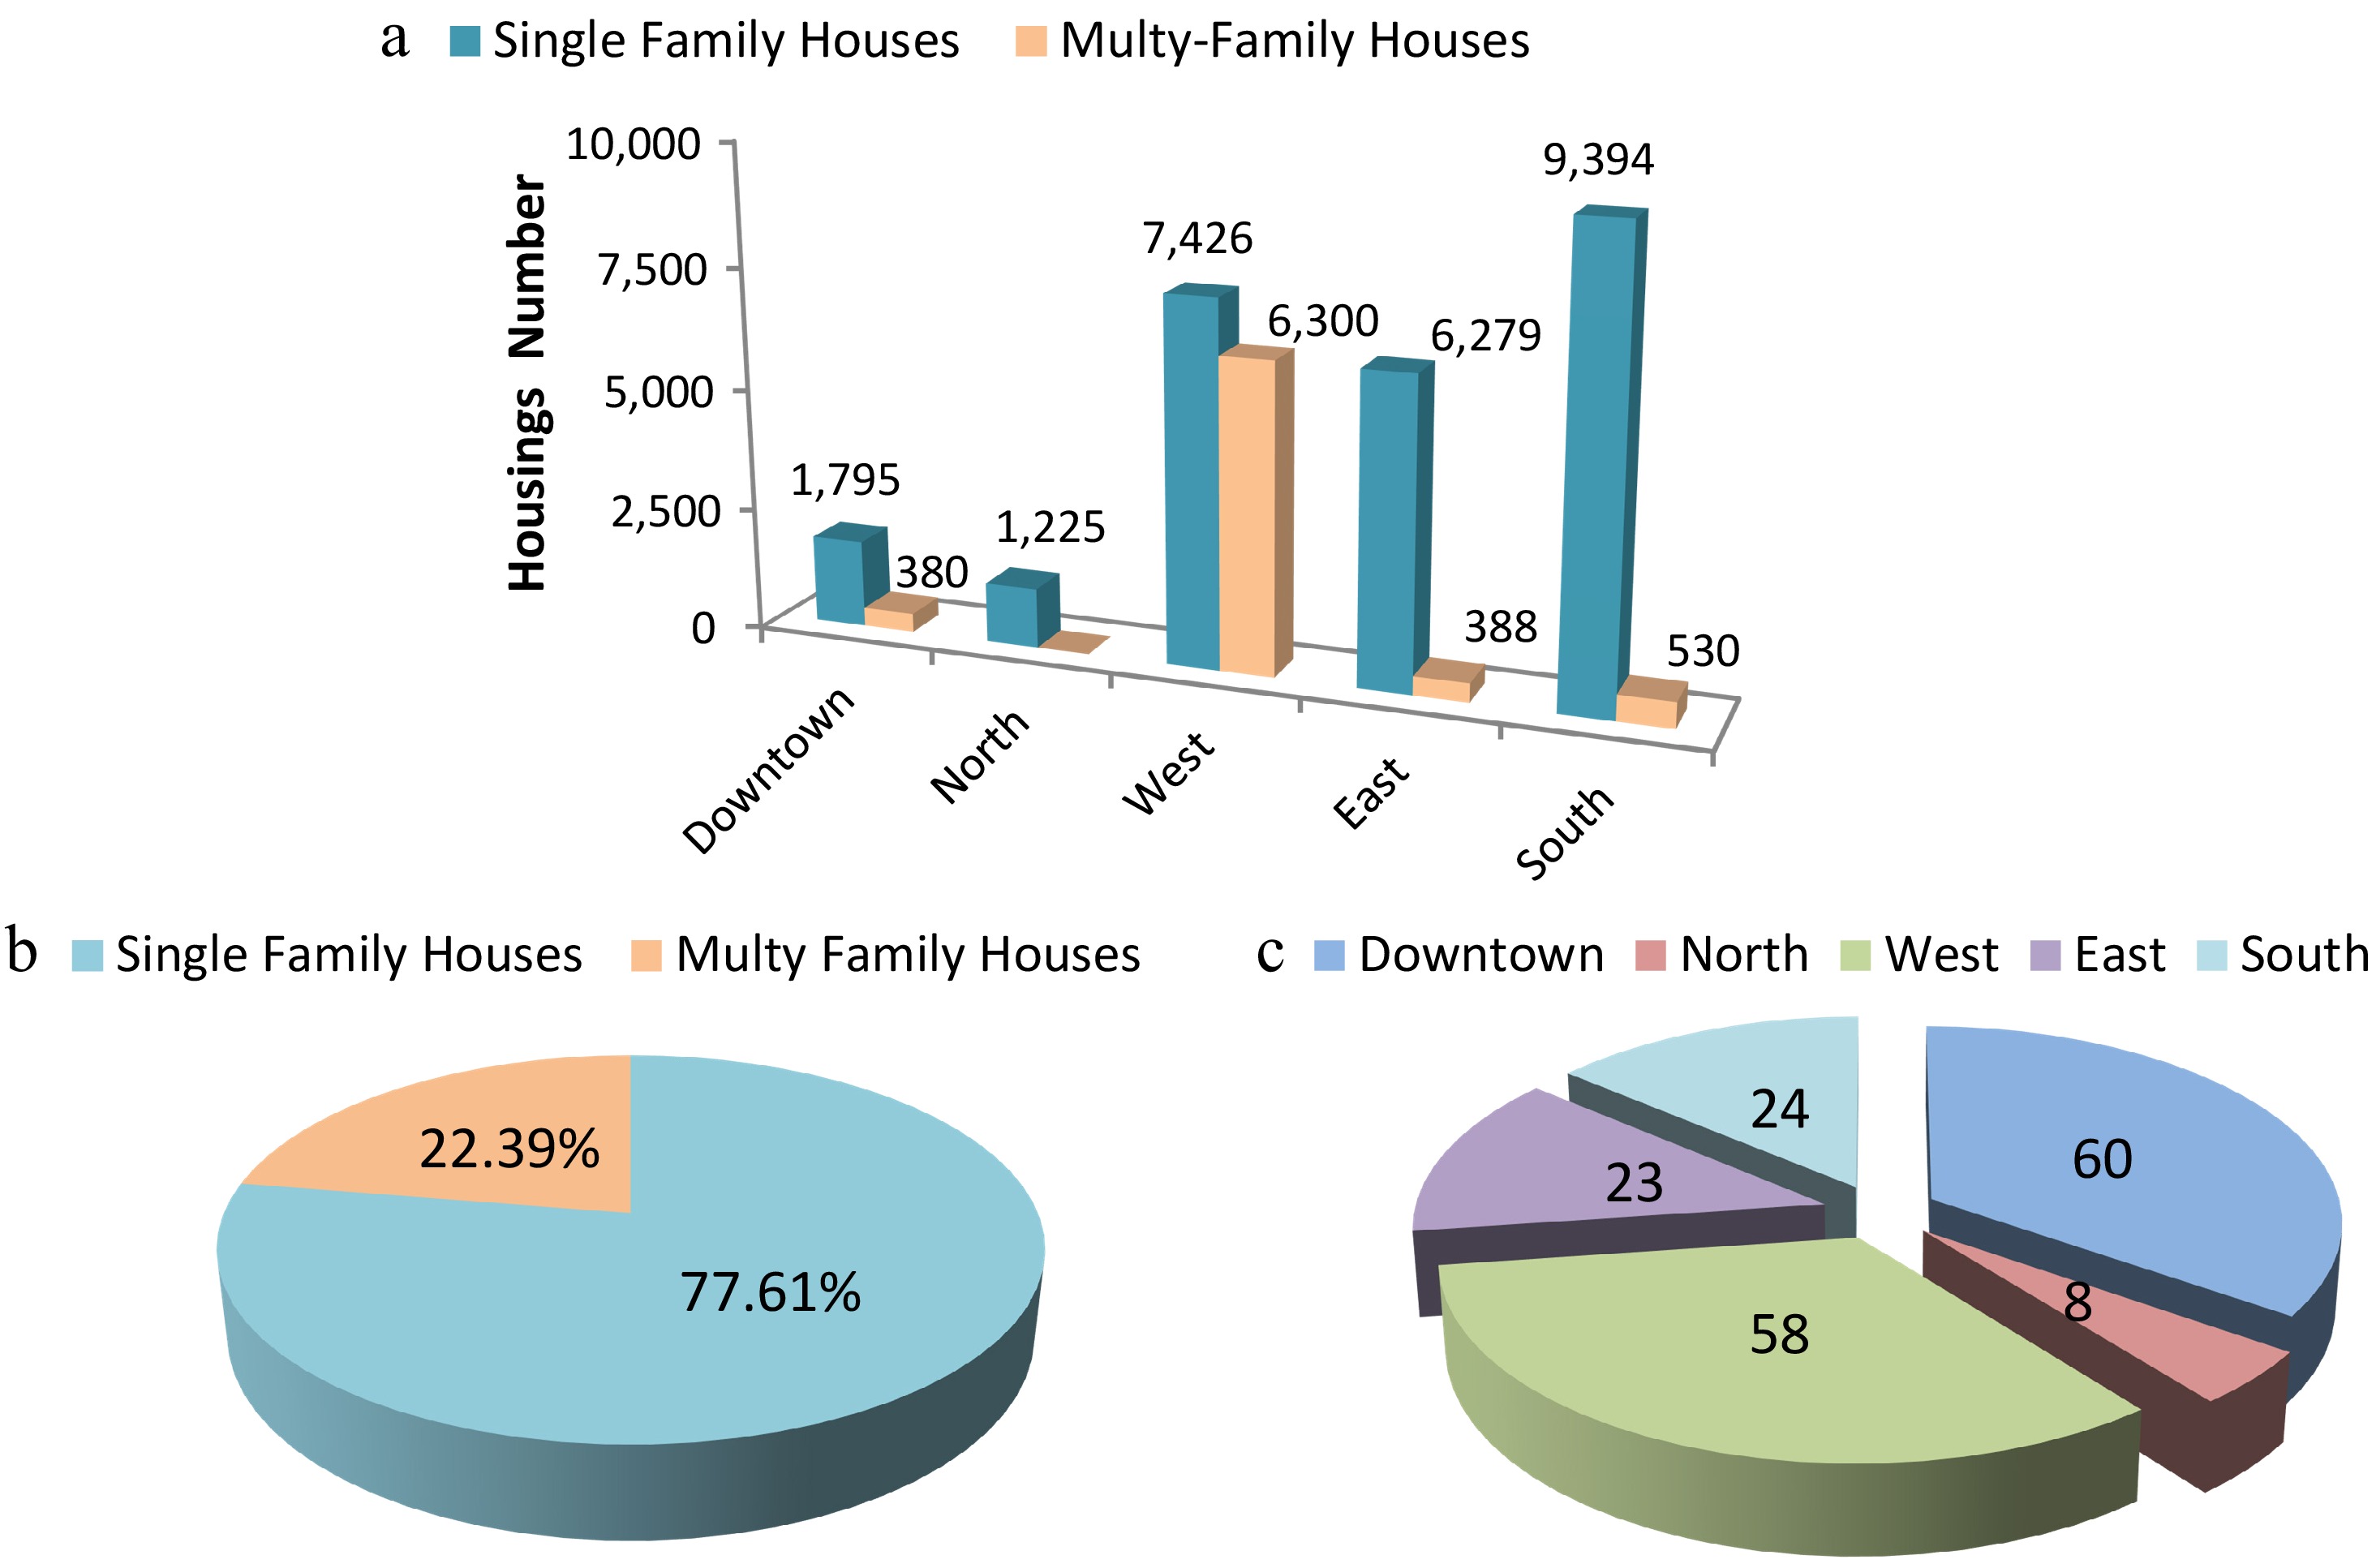
Figure 4.
Building stock in Chlef City in terms of: (a) housing number by district, (b) percentage of housing types, and (c) number of public facilities by district.
-
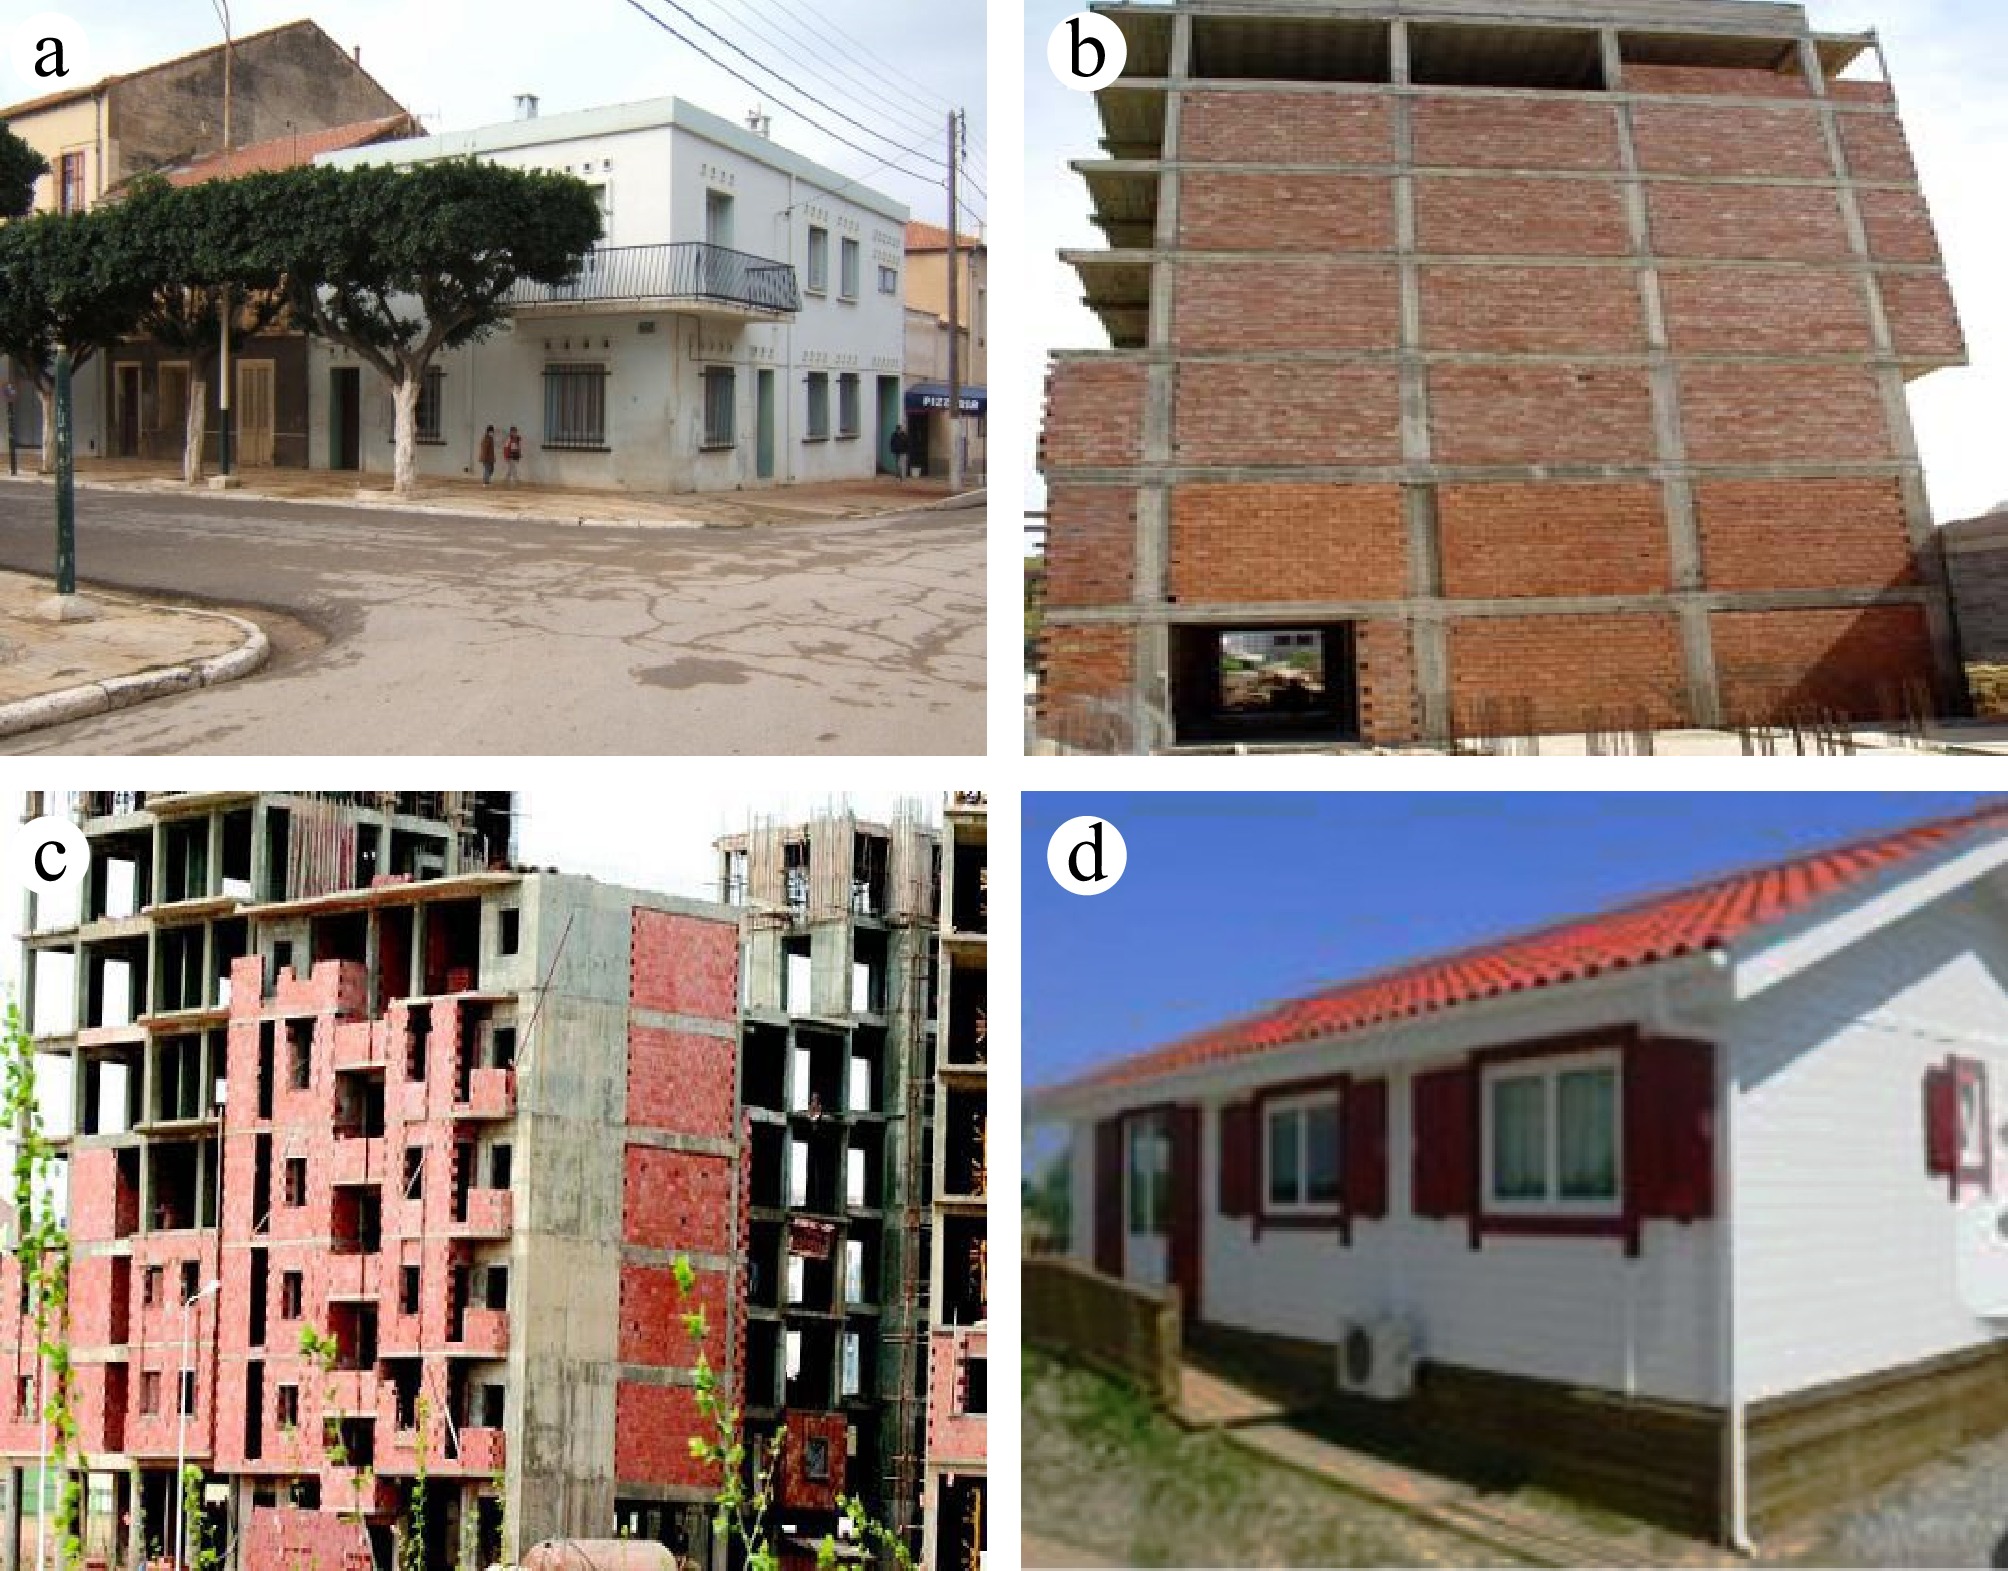
Figure 5.
Building structural typologies existing in Chlef City: (a) masonry buildings, (b) RC moment frames (under construction), (c) RC dual systems (under construction), and (d) wooden prefabricated houses.
-
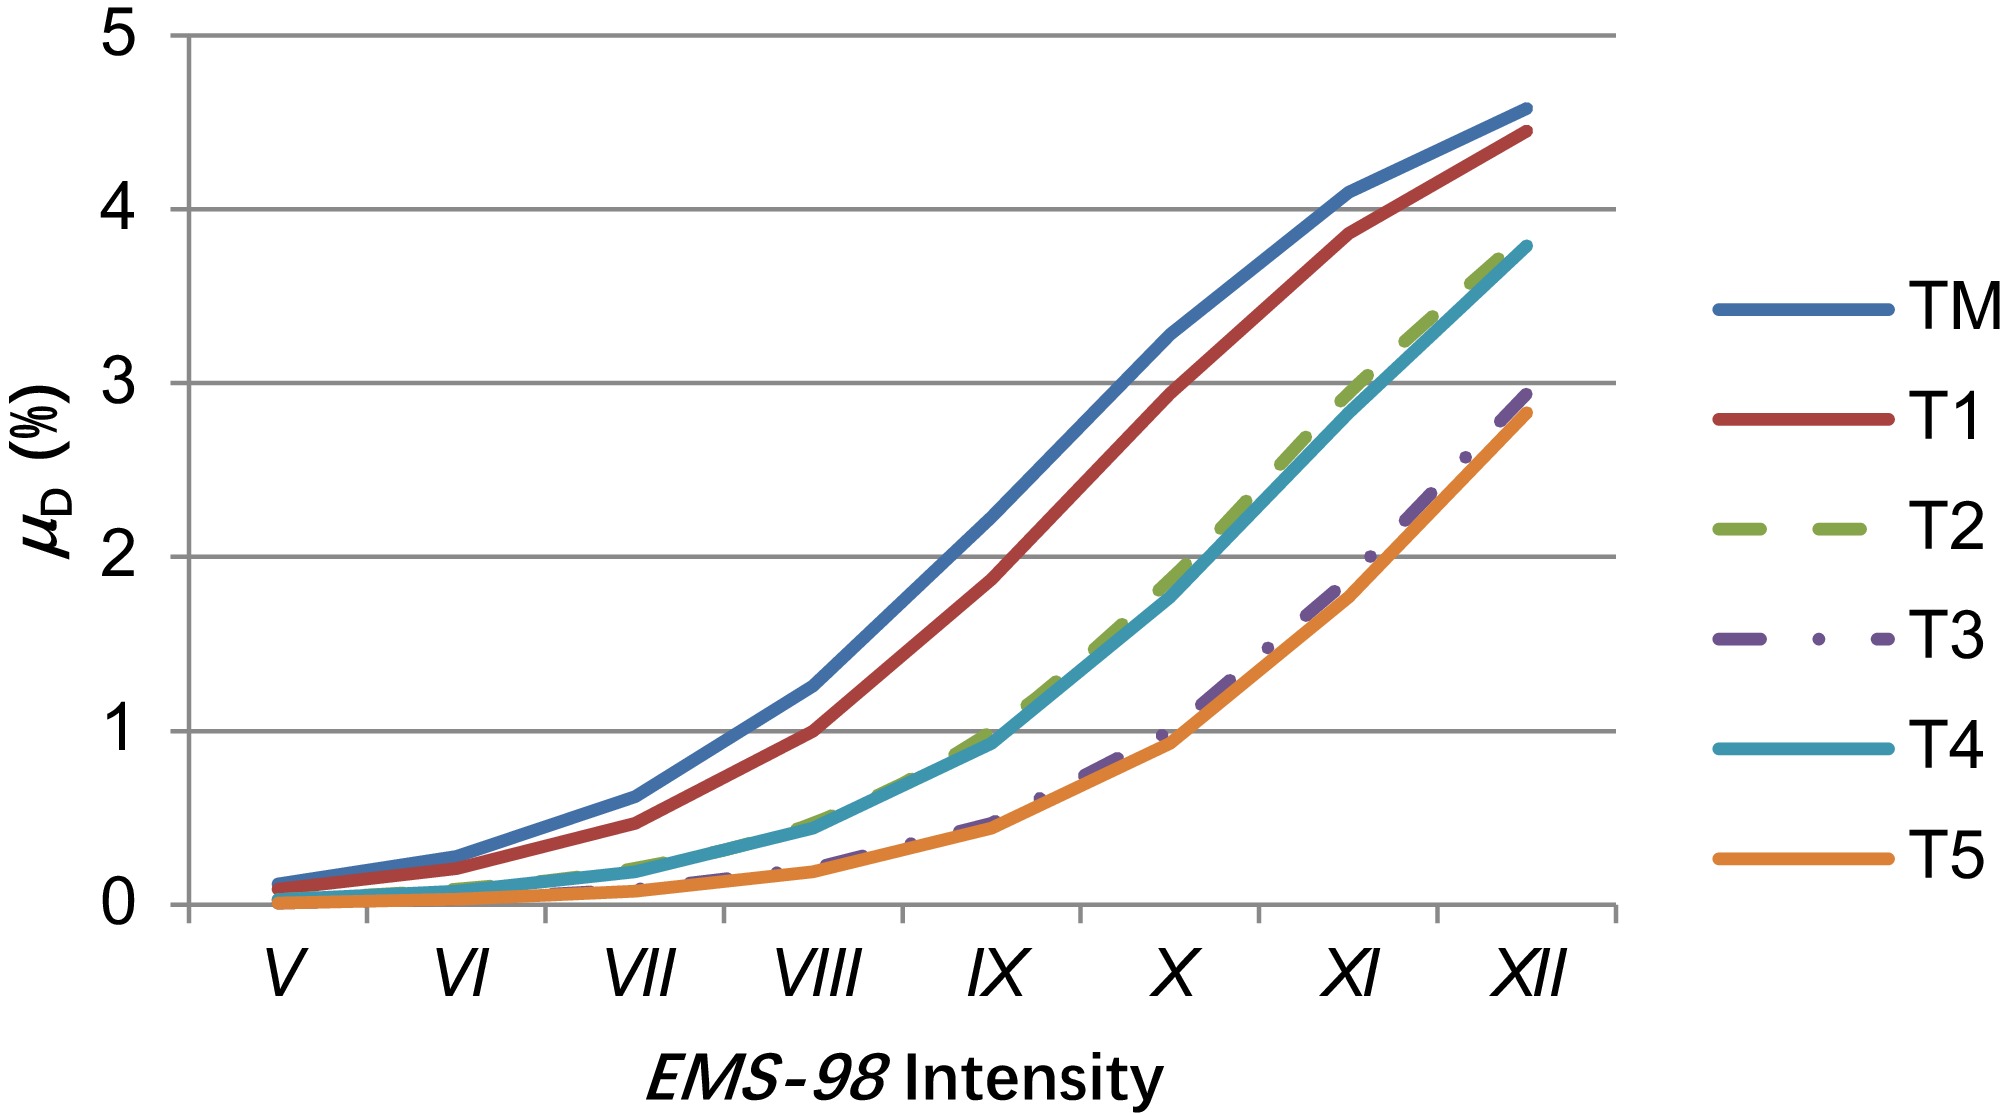
Figure 6.
Vulnerability curves of buildings typologies identified in Chlef City.
-
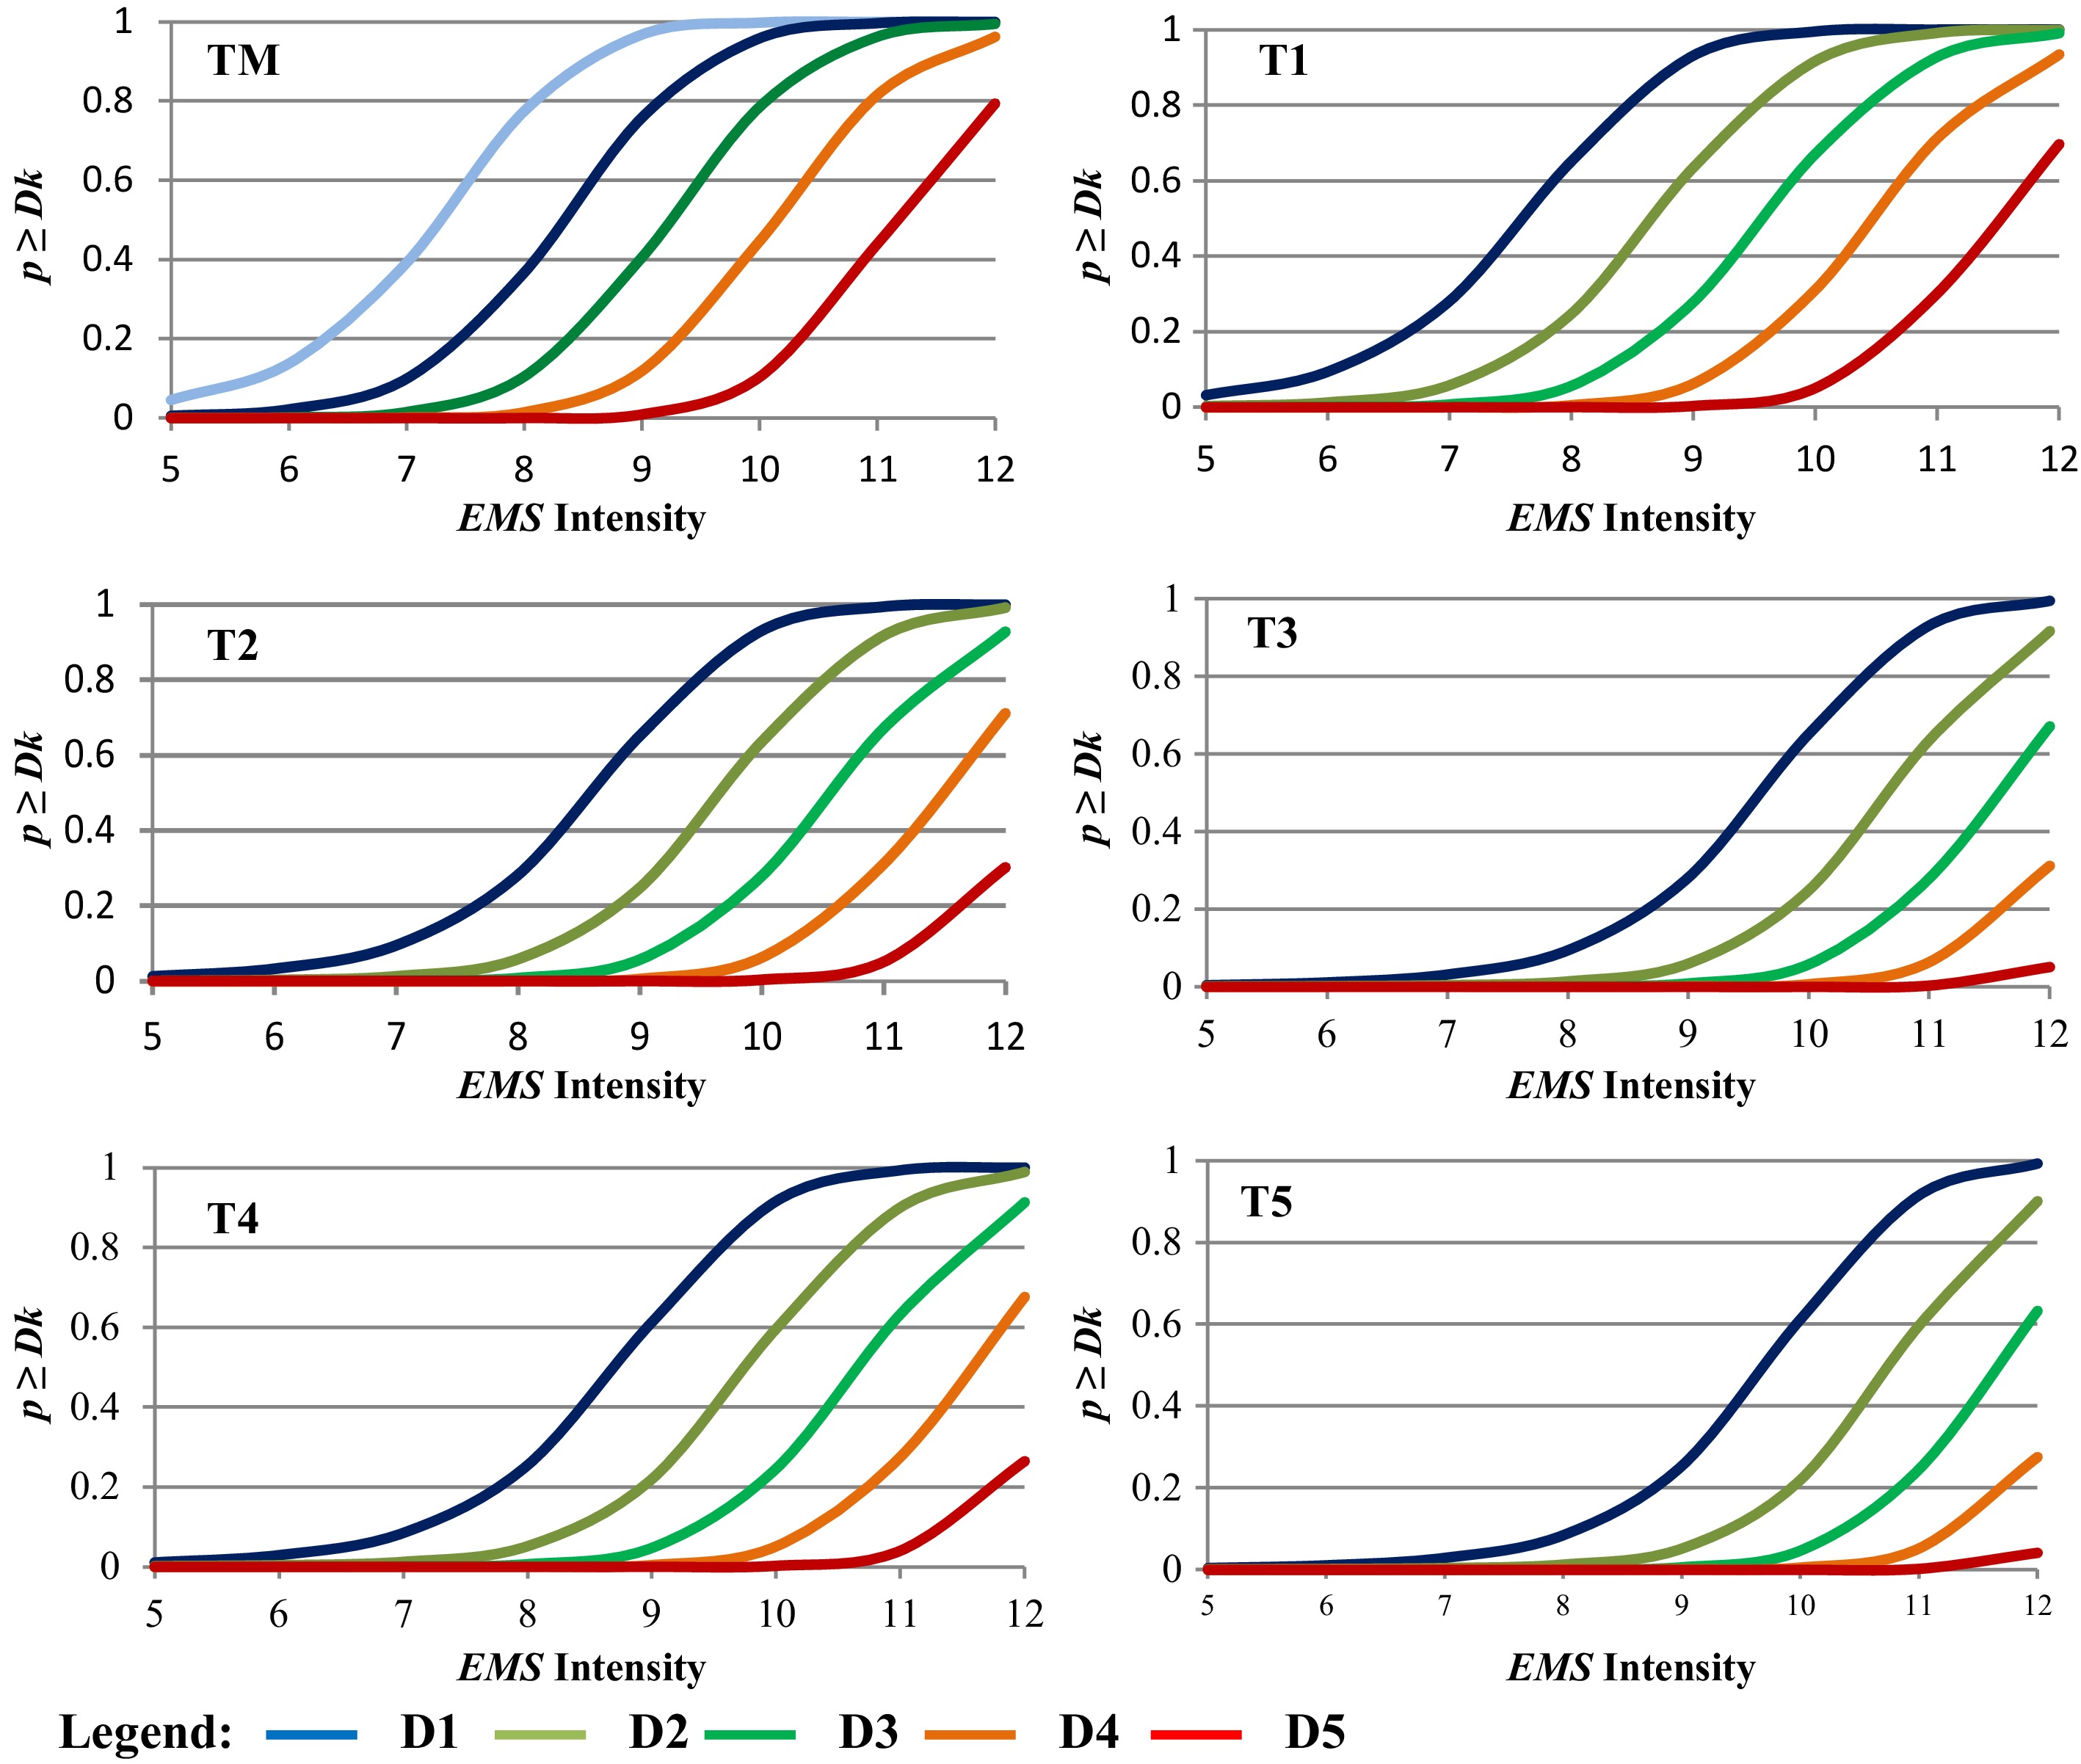
Figure 7.
Fragility curves developed for the buildings typologies identified in Chlef City.
-
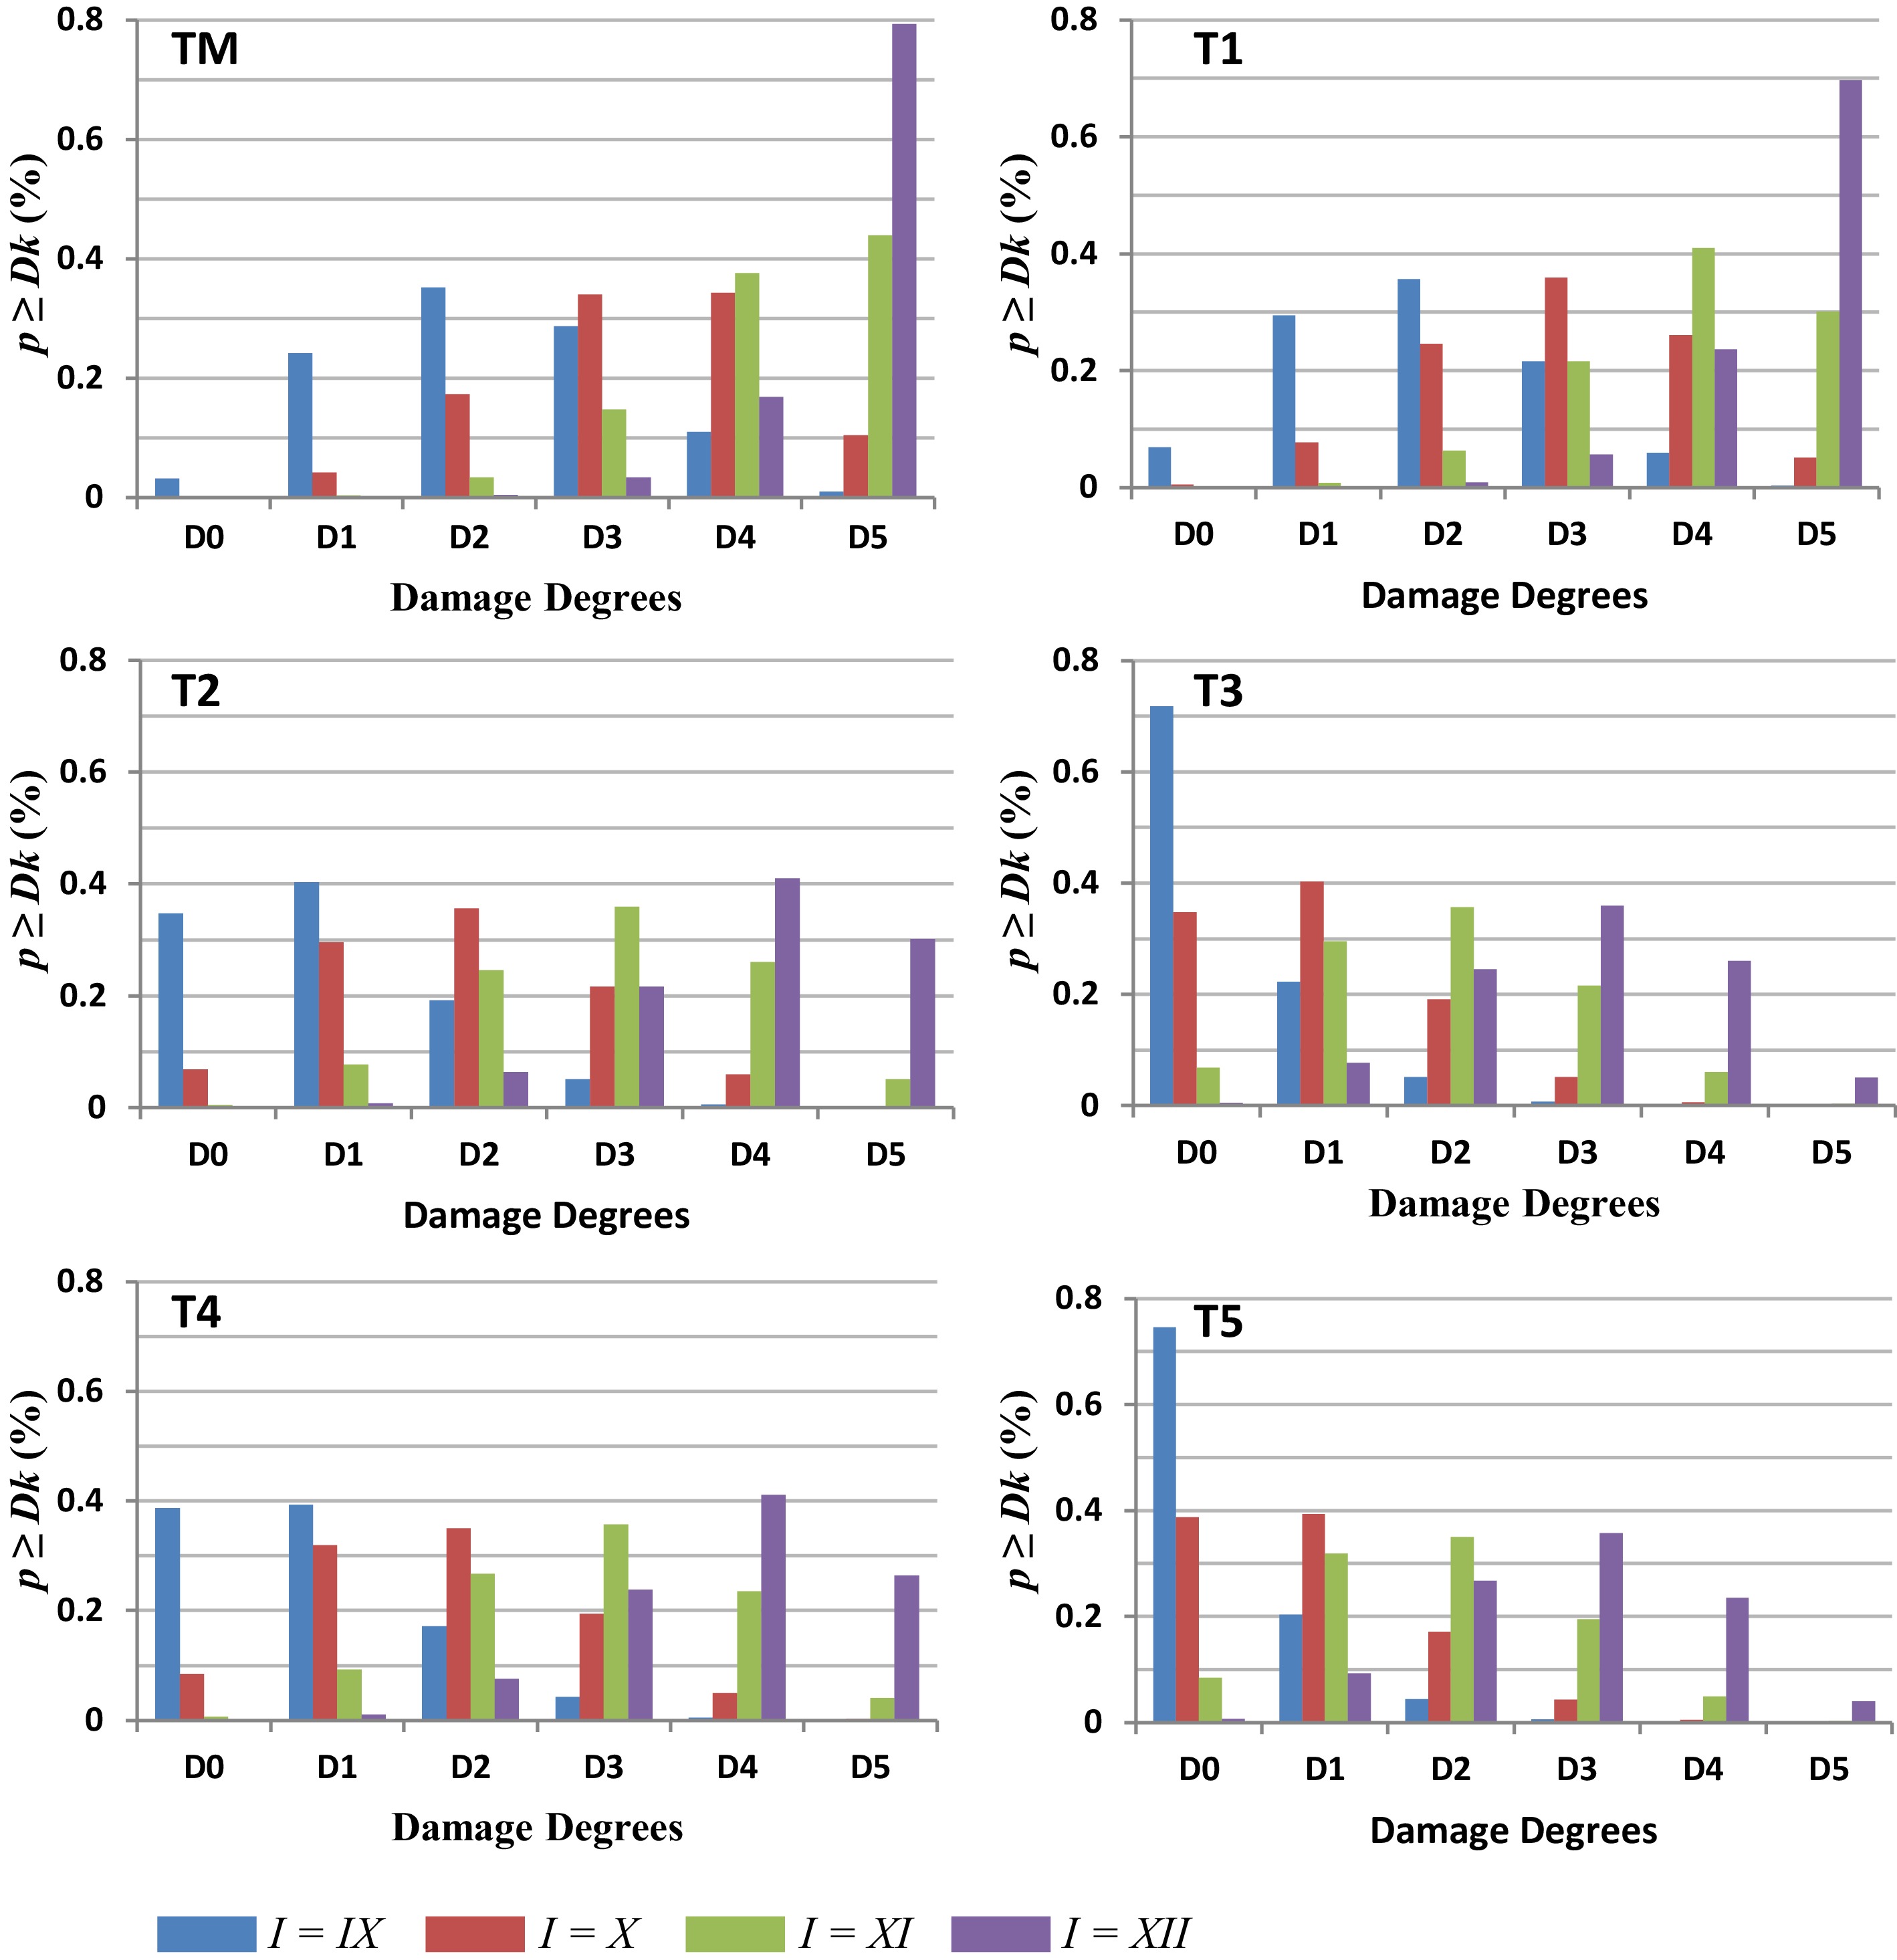
Figure 8.
Damage distribution for six of the identified typologies (EMS = IX–XII).
-
District Number of
housingPercent (%) Number of
buildingsPercent (%) Downtown 2,175 6.45 1,606 7.28 Southern 9,924 29.44 6,515 29.54 Eastern 6,667 19.77 5,037 22.84 Northern 1,225 3.63 1,225 5.55 Western 13,726 40.71 7,671 34.79 Total 33,717 100 22,053 100 Table 1.
Distribution of housing and building stocks by the city's districts.
-
Typology Typology description Building number Buildings percent (%) TM Masonry buildings built before 1962 889 2.61 T1 RC moment frames regularly infilled walls built between 1962 and 1980 7,353 31.92 T2 RC moment frames regularly infilled walls built between 1981 and 2003 3,140 12.81 T3 RC moment frames regularly infilled walls built after 2003 1,305 4.49 T4 RC dual systems (RC frame and wall) built between 1981 and 2003 942 2.85 T5 RC dual systems (RC frame and wall) built after 2003 636 1.44 TP Wooden Prefabricated houses 7,788 43.88 Total 22,053 100 Table 2.
Distribution of the buildings stock vs the identified typologies.
-
Building's
typologyTypology's description Seismic code level RISK-EU typology label Initial VI index* Assigned VI index** TM Structural system: massive stone − M1.3 0.616 0.616 Construction date: 1954–1962 Building's purpose: residential T1 Structural system: regularly infilled walls Precode or low RC3.1 0.402 0.562 Construction date: between 1962 and 1980 Building's purpose: residential T2 Structural system: regularly infilled walls Medium RC3.1 0.402 0.402 Construction date: between 1981 and 2003 Building's purpose: residential T3 Structural system: RC moment frames High RC1 0.442 0.282 Construction date: after 2003 Building's purpose: residential T4 Structural system: RC dual systems Medium RC2 0.386 0.386 Construction date: between 1981 and 2003 Building's purpose: residential/facilities T5 Structural system: RC dual systems High RC2 0.386 0.226 Construction date: after 2003 Building's purpose: residential/facilities TP Structural system: wooden prefabricated houses High Unclassified /
/Construction date: between 1981–1982 Building's purpose: residential/facilities * The most probable value of the VI given in the building typologies matrix BTM[21]. ** The assigned vulnerability index (this study). Table 3.
Vulnerability index values assigned to the identified building typologies.
-
Typologies Mean damage degree µD (%) versus EMS intensity V VI VII VIII IX X XI XII TM 0.12 0.28 0.62 1.26 2.23 3.28 4.10 4.58 T1 0.09 0.21 0.47 1.00 1.87 2.94 3.86 4.45 T2 0.03 0.09 0.21 0.47 1.00 1.87 2.94 3.86 T3 0.01 0.03 0.09 0.21 0.47 1.00 1.87 2.94 T4 0.03 0.08 0.19 0.44 0.93 1.77 2.83 3.79 T5 0.01 0.03 0.08 0.19 0.44 0.93 1.77 2.83 Table 4.
Mean damage degrees of building typologies as a function of EMS intensity.
-
Typology Damage levels (%) (I = IX) Structural damage (%)
(≥ D3)No structural damage (%) D0 D1 D2 D3 D4 D5 (< D3) TM 3.18 24.19 35.22 28.70 10.95 0.93 40.58 59.42 T1 6.87 29.52 35.65 21.62 5.99 0.33 27.94 72.06 T2 34.79 40.31 19.15 5.13 0.60 0.01 5.74 94.26 T3 71.77 22.27 5.15 0.75 0.04 0.00 0.79 99.21 T4 38.75 39.32 17.17 4.27 0.46 0.00 4.73 95.27 T5 74.55 20.33 4.45 0.62 0.03 0.00 0.65 99.35 Table 5.
Damage distribution and probability of structural and non-structural damage (I = IX).
-
Typology Damage levels (%) (I = X) Structural damage (%)
(≥ D3)No structural damage (%) D0 D1 D2 D3 D4 D5 (< D3) TM 0.17 4.14 17.27 33.95 34.25 10.37 78.57 21.43 T1 0.51 7.75 24.59 35.97 26.07 5.09 67.13 32.87 T2 6.87 29.52 35.65 21.61 6.00 0.33 27.94 72.06 T3 34.79 40.31 19.15 5.13 0.60 0.01 5.74 94.26 T4 8.45 31.93 35.00 19.45 4.91 0.00 24.36 75.64 T5 38.75 39.32 17.17 4.27 0.46 0.00 4.73 95.27 Table 6.
Damage distribution and probability of structural and non-structural damage (I = X).
Figures
(8)
Tables
(6)