


-
Nowadays, buildings' seismic vulnerability studies at the city level are increasingly being realized to assess building stock fragility to earthquakes, especially in seismic-prone areas. In these zones, this type of study becomes a priority for both researchers and governments. To conduct such evaluations, a suitable means is the development of the structure's fragility curves, which describe the relation between the probabilities of reaching or exceeding several damage states and a set of intensity measure levels. A fragility curve is described as 'the probability of reaching a defined limit state based on the occurrence of a particular hazard with a specified intensity.' While a vulnerability function is characterized as 'the probability of experiencing losses that are equal to or exceed a certain monetary value, depending upon the occurrence of an earthquake with a given intensity.' The vulnerability of a structure is assessed through a probabilistic relationship between the anticipated limit state and a measure of the earthquake demand, such as spectral acceleration Sa, peak ground acceleration PGA, the probability of recurrence, or a particular ground motion magnitude[1]. These curves can be derived using several approaches: analytical, empirical, discretionary, or a combination of these three, known as the hybrid approach[2]. Each of these four approaches is defined below, and their respective strengths and weaknesses are displayed[3]:
(1) Analytical approaches: these methods use statistical tools to analyze complete and simplified structural models. The reliability of the results depends on accurately representing the actual behavior of the structure in question.
(2) Empirical approaches: these methods are considered the most realistic because they reflect the actual responses of impacted buildings. These methods are based on data collected from observational studies and surveys conducted after an earthquake. Therefore, statistical techniques are used to formulate vulnerability indices.
(3) Judgmental approaches: these methods formulate vulnerability indices based on damage assessments provided by experts through field surveys. However, this approach's reliability is questionable because it can produce different results depending on experts' opinions and subjectivity; and
(4) Hybrid approaches: combine various approaches, such as empirical and judgment techniques.
Therefore, due to the importance of evaluating the seismic vulnerability of structures to judge their performance when faced with seismic risk, several researchers around the world have conducted studies and research with this objective. The Capacity Spectrum–based method is used to assess the seismic vulnerability of building stocks in the Western Zone of Surat City, Gujarat, in India[4]. In Italy, calibrated fragility and vulnerability curves for masonry and RC buildings were developed based on the new Italian guidelines for the seismic risk classification of constructions, and a heuristic vulnerability model for large-scale applications was proposed[5]. In the same country, the seismic vulnerability of the built environment within the municipality of Meta- Naples has been studied, focusing on masonry structures found in the historical center of the city. A vulnerability assessment has also been performed using a vulnerability index-based approach and fragility curves have been derived using a macroseismic approach[6]. A comprehensive overview of the literature on seismic risk assessment and damage analysis was synthesized and published in 2024. This overview encompasses relevant studies in this field carried out worldwide, collected from 4,229 articles and reviews, published over a period ranging from 1982 to 2023[7].
In Algeria, where most populated towns are concentrated in the northern part of the country, which is prone to seismic risk, a number of these cities have undergone seismic vulnerability assessments. Most of these studies used fragility curves to predict the seismic behavior of structures. Among these studies, one can cite that carried out for Mostaganem city based on a nonlinear static pushover analysis[8], and that carried out for Chlef City via the simulation of three deterministic seismic scenarios[9]. Constantine, a city in eastern Algeria, has also benefited from such assessments. Several studies have been dedicated to this city, considered the eastern capital of Algeria. Therefore, a study predicting damage to a set of almost 29,000 buildings in this city was performed using a scenario adapted from the HAZUS approach, considering the response spectrum of the Algerian seismic code as a seismic hazard model[10]. In a second study, a seismic scenario that focused on the vulnerability of the Old City and Coudia's historic districts was carried out in order to reduce the seismic risk in Constantine, which made it possible to assess the maximum ground acceleration using empirical attenuation laws[11]. In another study, aiming to evaluate the seismic performance of this city's existing reinforced concrete structures, a two-story 1980s-era reinforced concrete building was used as a prototype to develop fragility curves[12]. On the other hand, Souika, a site classified as National Heritage in this city, which encompasses 337 unreinforced masonry structures benefited from the evaluation of the seismic vulnerability[13].
Oran, Algeria's second-largest city, located on the western coast, has also benefited from studies evaluating the seismic vulnerability of its built environment[14,15]. Other cities in the northern part of Algeria have also been subject to such seismic evaluation studies, such as Annaba city[16,17]. Blida, a city located 45 kilometers southwest of Algiers, the Algerian capital, is also threatened by seismic risk and has also been subject of such studies. A simplified methodology and operational approaches to assess urban vulnerability and socio-economic losses in the Great-Blida region has been proposed, and a seismic scenario for 370 buildings in the city was simulated assuming the Blida fault[18,19].
All of the cited studies use fragility curves to assess the building performance against seismic action, as a fragility curve predicts whether a structure or group of structures will approach or exceed the limit of deformation at a given level of ground shaking. It can also be shown as a graph that depicts the likelihood of failure in proportion to ground movement parameters. The data derived from fragility curves can be used to analyze, evaluate, and improve the seismic performance of both non-structural and structural elements[20].
In this context, this study aims to identify the most vulnerable building types in current-day Chlef using the LM1 level of the RISK-UE methodology, so-called the VIM method[21]. The study considers the seismic intensity of the 1980 El Asnam earthquake and uses data on the number and characteristics of buildings within the city. The data was collected from local departments in charge of construction and urbanization, local authorities, and supplemented by a 2018 field survey carried out by the first author. The study objective is to develop fragility curves and plot damage distribution for the five damage grades adopted by the EMS scale (Dk, k = 1–5) to predict the seismic performance of the building stock in this seismically prone city in Algeria.
-
Chlef City, formerly Castellum Tingitanum during the Roman era, was named El Asnam by the Muslims who triumphed over the Maghreb countries in 682 to spread the Islamic religion. Historical accounts report that upon their arrival, the Muslims found vestiges and ruins of ancient buildings, which led them to give the city this Arabic name, meaning idols. In 1843, French colonial authorities gave the name of Orléansville to the city in honor of the Crown Prince, who had died accidentally a year before. After the country's independence in 1962, the city regained its Arabic name of El Asnam in 1964. Subsequently, after the devastating 1980 earthquake, the city was officially renamed Chlef, referring to the Chellif River that crosses the city from east to west[22]. Note that, since its creation by the Phoenicians, several civilizations have passed through this city: Roman (33 BCE), Arab-Muslim (682 CE), Ottomans (1516), and finally the French colonization (1830−1962).
Geographic location
-
Chlef City is situated in the center of the Wilaya (province) of Chlef, located in the Lower Chellif Basin in northern Algeria, about 200 km (124 miles) west of the capital Algiers (Fig. 1). It is approximately 50 km (31 miles) from the Mediterranean coastline. The city's geographical coordinates are 36°10'26'' N and 1°20'12'' E, and its altitude ranges from 116 to 123 m (381–404 ft) above sea level.
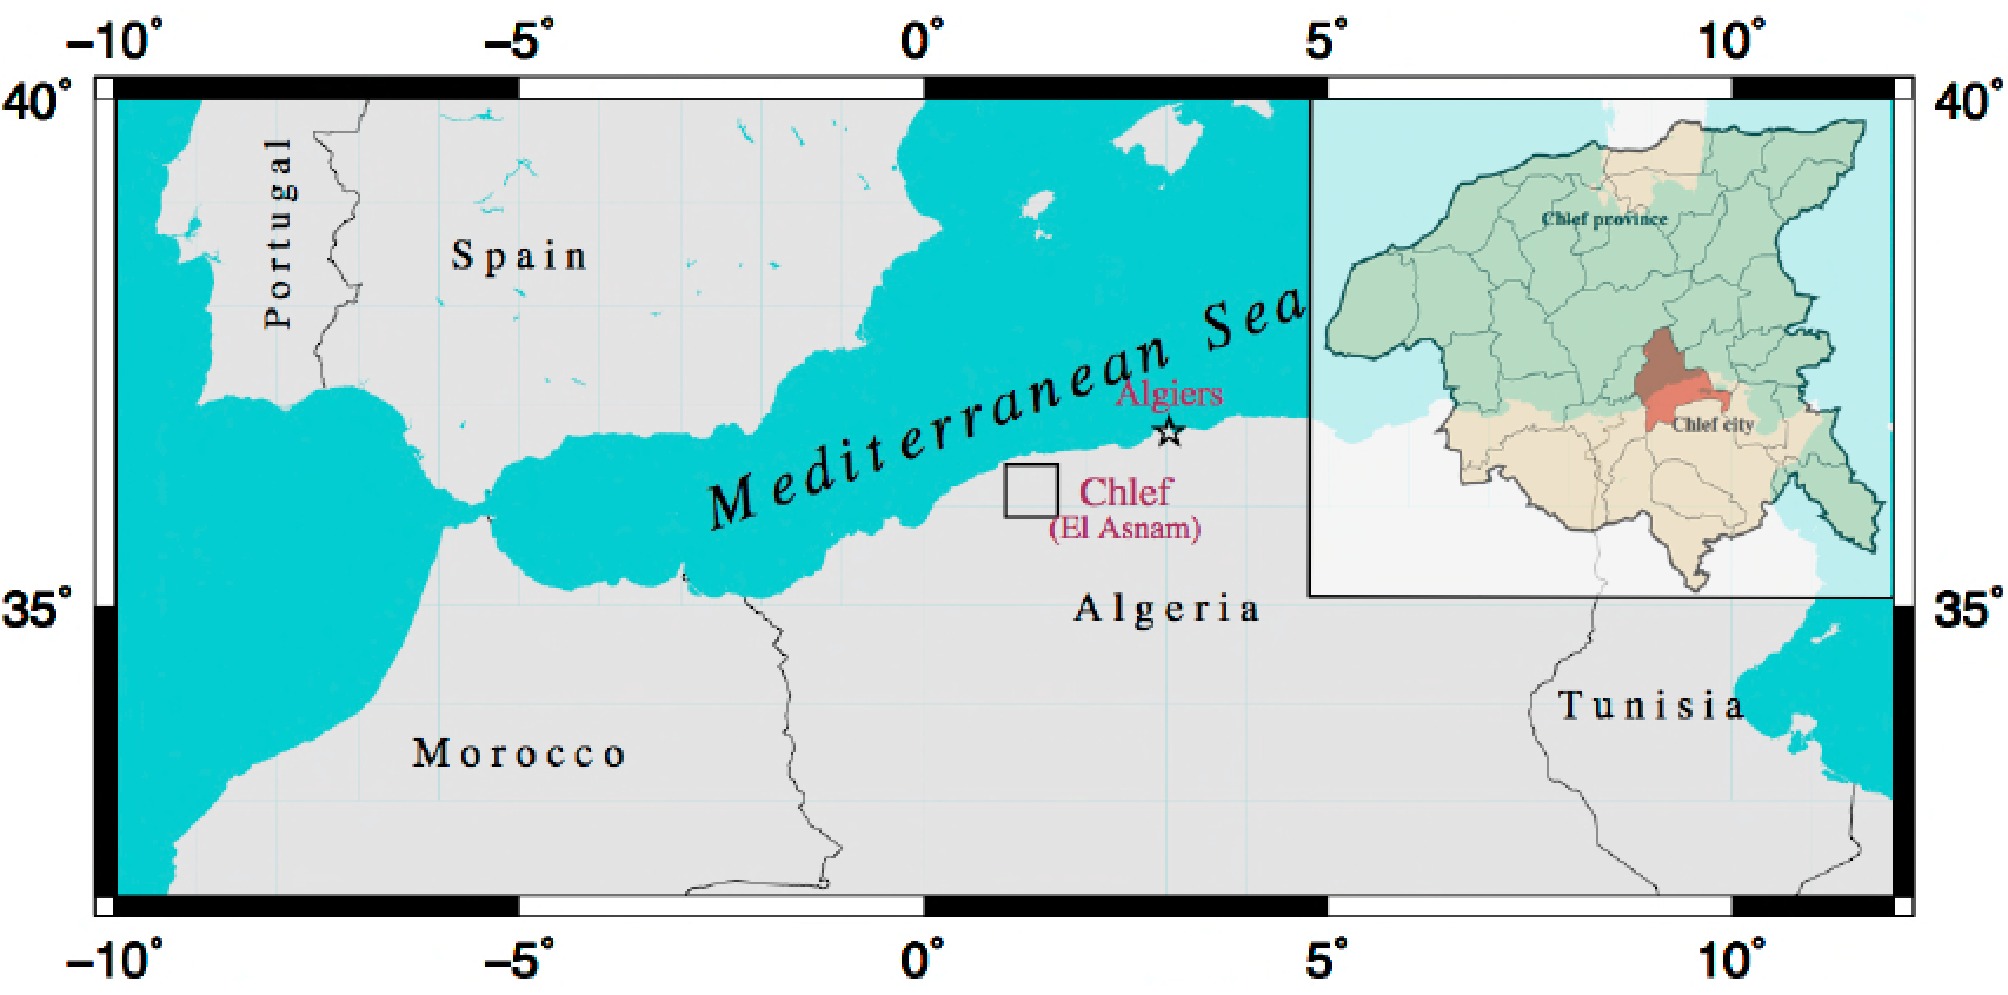
Figure 1.
Geographical location of Chlef City (black square) in northern Algeria and its location within Chlef province (transparent red area in the inset).
Geology and seismicity
-
Chlef City is built mainly on an old alluvial terrace covering Pleistocene alluvial, profoundly altered (Fig. 2). This terrace has been deeply eroded and is cut by valleys containing recent alluvial deposits of local origin. These low areas were used as places of landfill since Roman times, and many buildings near the city center were built over several meters of artificial embankments[23]. The consultation of soundings and soil profiles established by the two public laboratories operating in Chlef: the LCPC (Laboratoire Central des Travaux Public), and the LNHC (Laboratoire National de l'Habitat et de la Construction), allows us to notice that the main geological formations of the superficial soil layers are primarily made up of embankments, sands, gravels, silt, and clay, with shear wave velocity Vs(30) not exceeding 300 m/s. In some areas, the ground consists of loose sand, with water present at significant depths. In terms of literature, the results of a 2018 study show that Vs(30) values in the city range from 330 to 510 m/s[24], whereas an earlier and older study reported values ranging from 200 to 800 m/s across sites located from the north to the south of the city[25].
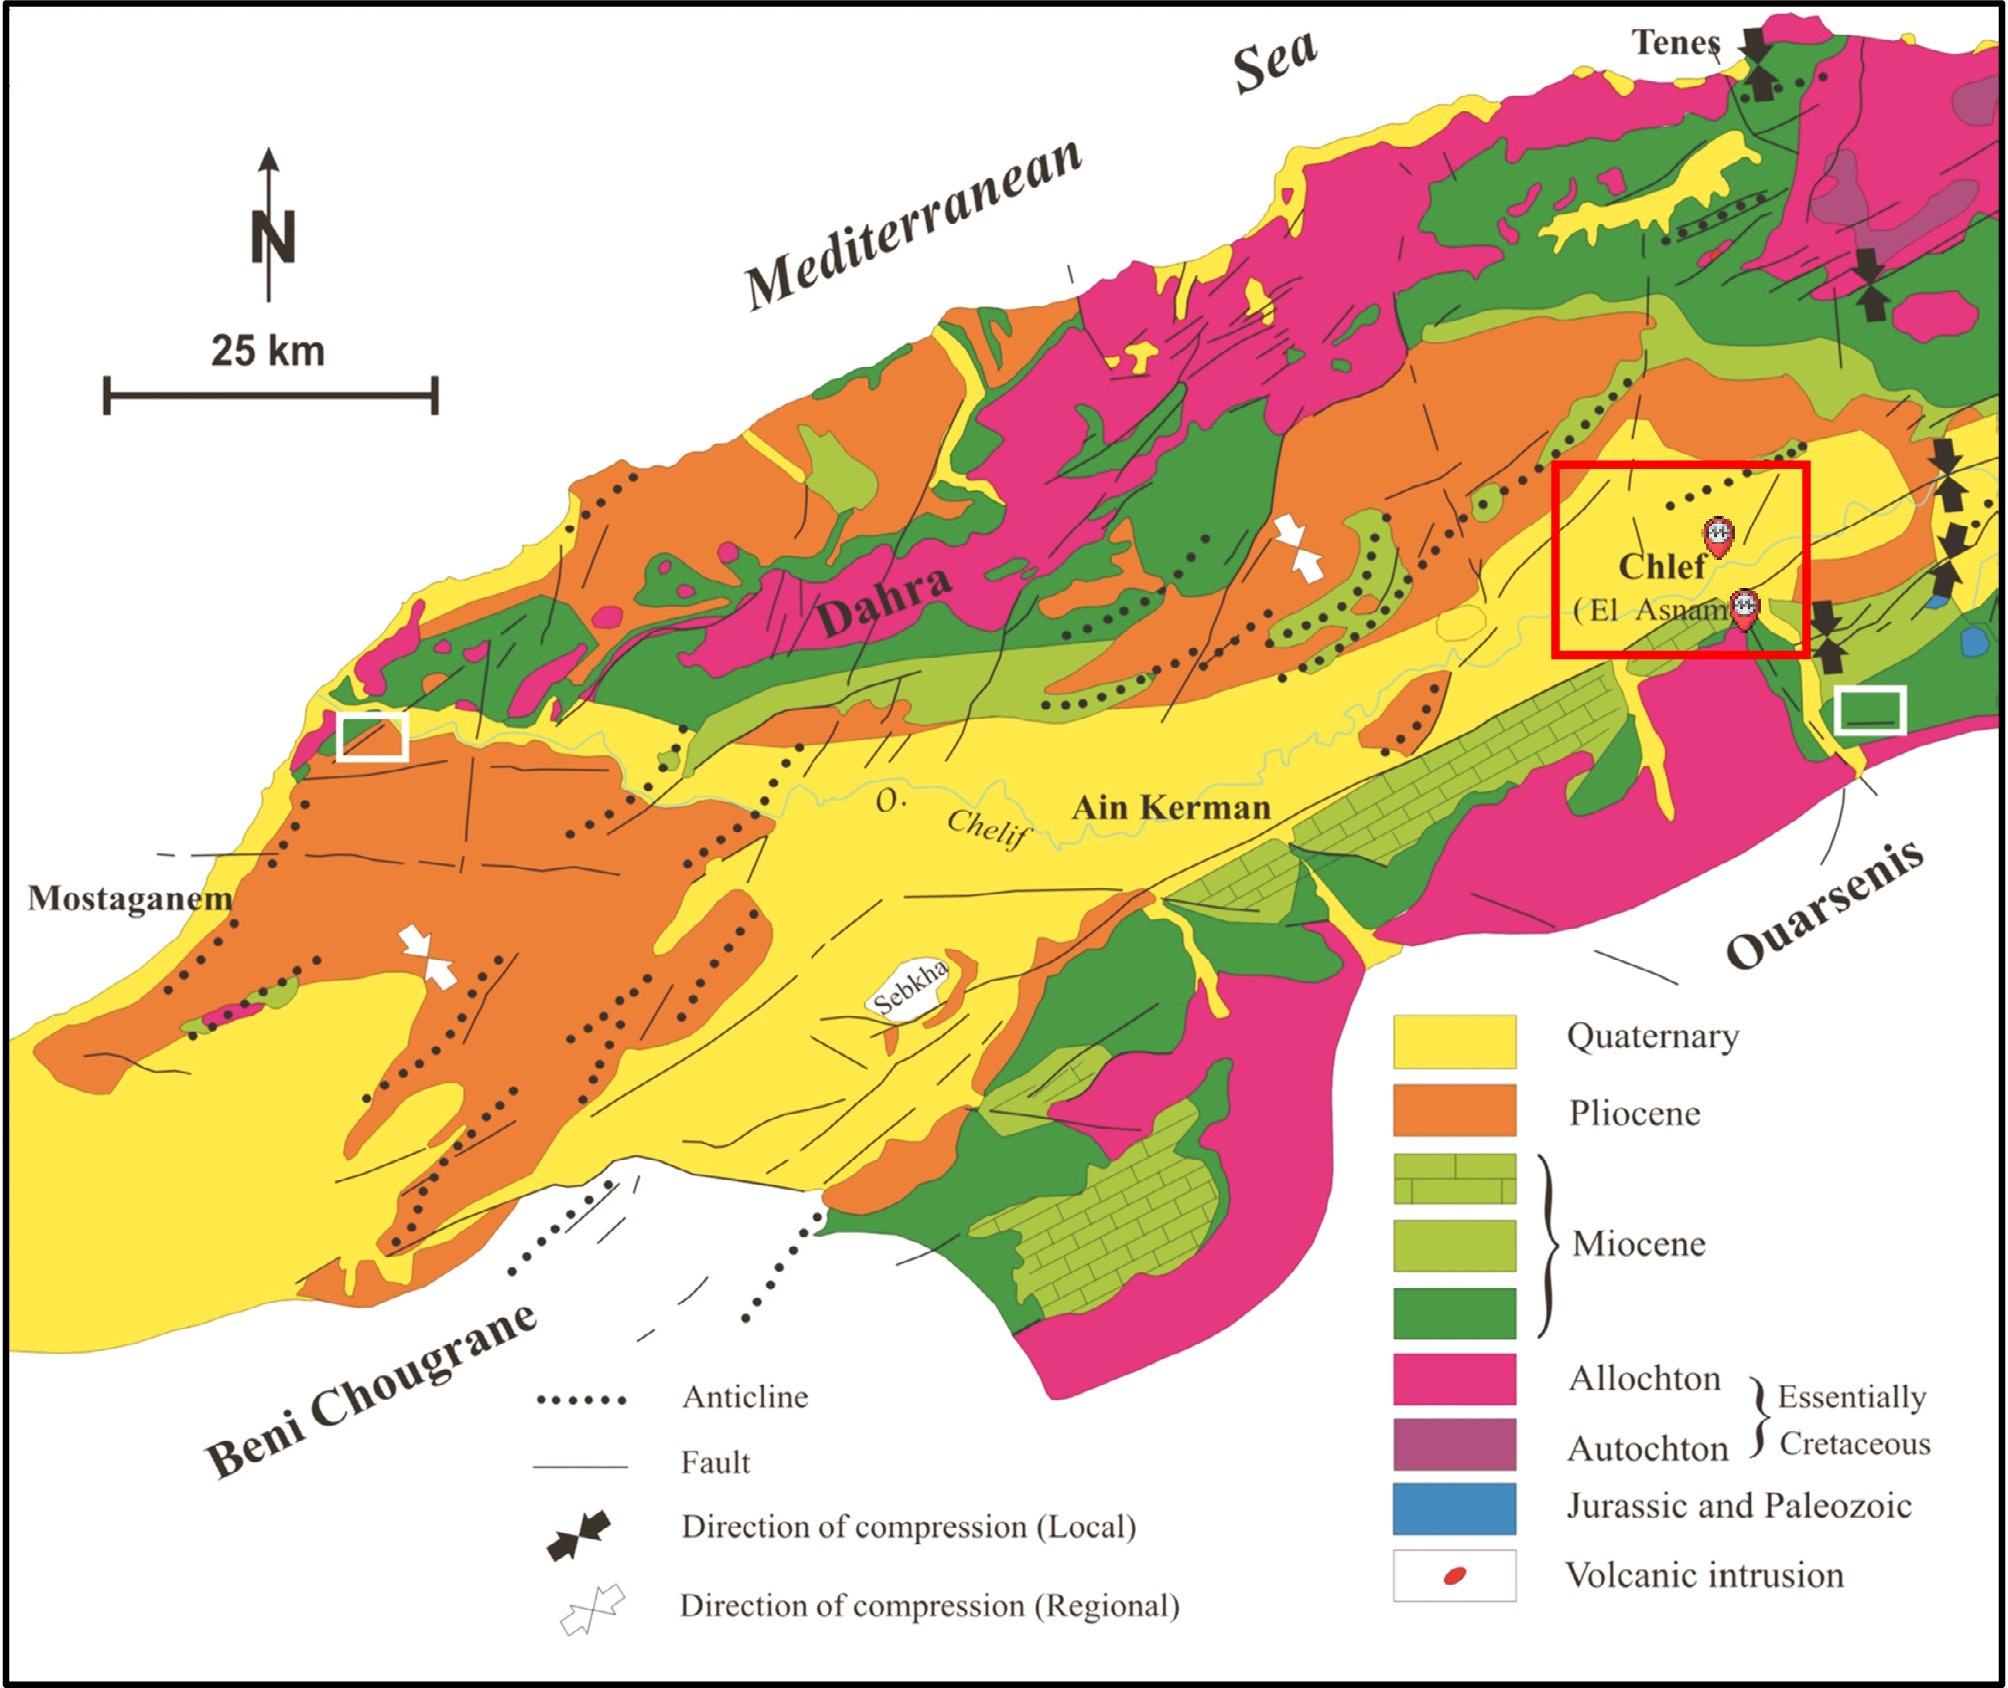
Figure 2.
Geological and seismotectonic map of the Chellif Basin region. The red frame encompasses the city of Chlef, the El Asnam fault, and the earthquake emblems representing the two major seismic events of 1954 and 1980 (modified from Hadji et al.[26]).
Furthermore, the seismic microzoning project carried out following the 1980 El Asnam earthquake by Woodward Clyde Consultants (WCC), reveals that the city center and the northern district are implanted on soil layers characterized by a moderate to high risk of settlement, liquefaction, and landslide, especially all the way through the two rivers, Chellif and Tsighaouat[27]. These two rivers cross the city from east to west and from south to north, respectively (Fig. 3). Chlef City is also exposed to the local seismic amplification caused by the site effects. In fact, soil frequency peaks have been identified in both the low and high frequency domains[28]. The mentioned induced effects increase the seismic risk in this city. This underscores the need for preventive and technical measures, such as soil reinforcement, prior to any urban development. Thus, based on the probability of earthquake-induced effects, a recent study proposes a risk prevention plan for the city of Chlef that includes all current urban sites and areas designated for future urbanization up to the year 2030[29].
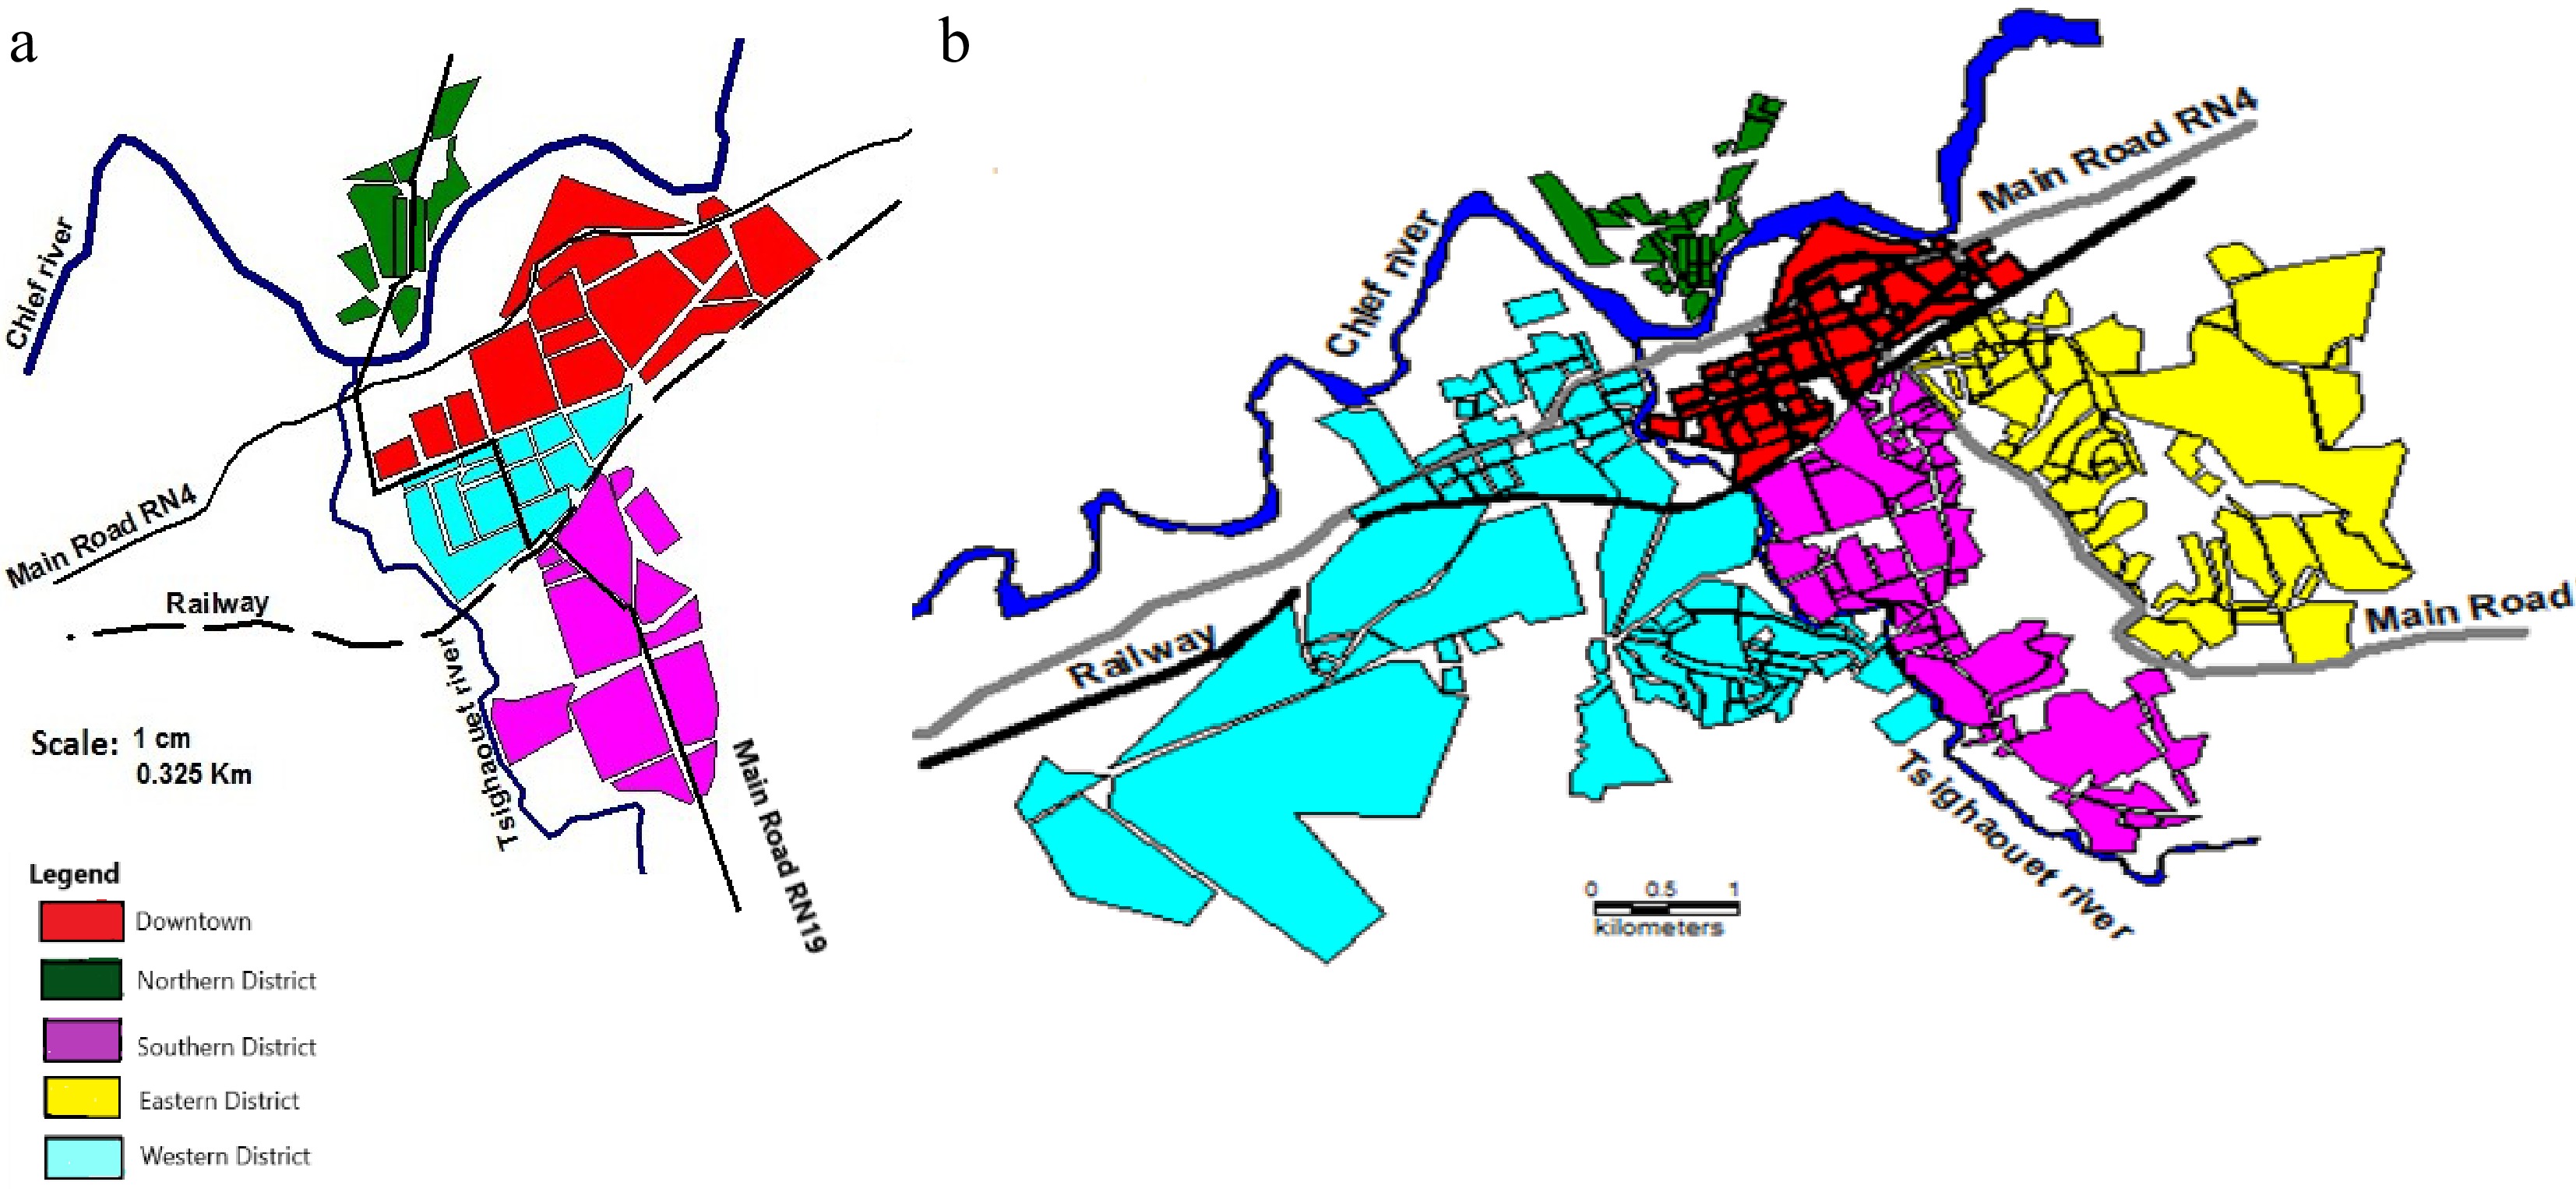
Figure 3.
Urban landscape of Chlef City: (a) before the 1980 earthquake, and (b) after the 1980 earthquake (modified from Boutaraa et al.[9]).
Concerning the seismological context, the city suffered in the past from important seismic events. These include the major earthquakes that occurred in El Abadia (previously Carnot) on September 7, 1934 (Ms = 5.1), Orleansville on September 9, 1954 (Ms = 6.9), and El Asnam on October 10, 1980 (Ms = 7.3)[27,30]. The latest event destroyed 70% of the city, caused more than 2,700 casualties, 12,000 injuries, and over 150,000 were made homeless[30]. Based on seismic catalogues, this earthquake was qualified as the largest earthquake ever known in the Mediterranean region, and classified as the one that dominates all of the seismicity in the region for the period that extends from 1900 to 2015[31]. Although to the present day, it remains the most important earthquake that Algeria has experienced. Considering this active seismicity, Chlef is ranked in zone VI (high seismicity) by the Algerian seismic code[32]. However, this extensive damage cannot be attributed solely to the earthquake's high magnitude. In fact, the nearly complete demolition of buildings was actually caused by two factors. Firstly, non-compliance with high-level seismic codes is the most significant factor. This is due to the lack of such regulations in Algeria at that time. Another important factor is the quality of the soil characteristics, particularly in the city center, where the Vs(30) value does not exceed, in extreme cases, 350 m/s in the superficial soil layers[29]. Moreover, the city's seismotectonic location is in the Lower Cheliff Basin, which contains several seismic faults and is well known for its seismic activity, and is the cause of this seismic activity. In addition to the Oued Fodda fault, the city is surrounded by several reverse faults, including the Red Mountains fault, the Medjaja fault, and the Ouled Fares fault (Fig. 2). The tectonic evolution of this region is the result of the convergence of the European and African plates, a phenomenon that has been widely studied[33−38]. Figure 2 shows a geological and seismotectonic map of the Chellif Basin region. The El Asnam fault, also known as the Oued Fodda fault, is marked on the map. This fault caused the two major earthquakes of 1954 and 1980.
Urbanism and social stakes
-
For this study, data collected in a previous study is used. The planned steps of the survey are described below.
(1) First, an overview concerning historical data on existing buildings from before 1954 (location, construction practice, materials), as well as information on the damage caused by the 1954 and 1980 earthquakes to the building stock. This data was collected through extensive bibliographic research.
(2) Secondly, collecting and consulting graphic documents and urban planning maps, mainly the city's Master Plan of Urban Development. This plan details urbanized sites, as well as areas designated for future urbanization.
(3) Third, collecting quantitative and descriptive data related to the real estate of the building stock in the study area. This phase of the survey involved consulting the technical services responsible for the various construction programs in the city of Chlef (e.g., social housing, participatory housing, National Agency for Housing Improvement and Development [AADL], etc.). A field survey was conducted to supplement any missing or inadequate data. This data includes buildings' characteristics, such as the total number of buildings, the number of floors by building, as well as numbers of housing units by building, the building function (individual housing, collective housing, or public facility), the buildings' age, the structural design type of building, the construction materials, and possible rehabilitation after past earthquakes. Quantitative data also includes population number, which was estimated by multiplying the official occupancy rate of 5.48 assigned to Chlef City, and then multiplying that result by the total number of houses.
(4) Finally, conducting the self-construction census through a field survey. This stage was the most difficult and time-consuming task. However, it is important to note that these data fluctuate rapidly due to the high rate of uncontrolled self-construction. Therefore, the present study cannot accurately estimate the number of buildings in the city, which certainly exceeds 22,053.
Urban landscape
-
With a population of approximately 230,000 inhabitants, Chlef is currently the tenth largest city in Algeria. The city is home to many important economic, educational, administrative, and judicial structures. The urban stock encompasses the buildings inherited from the period preceding the 1980 El Asnam earthquake, and those built afterwards. Figure 3 illustrates the city's two urban states: before and after the 1980 earthquake. Five main districts make up the current urban landscape of the city:
(1) The downtown district, generally intended for administrative and commercial activities, as well as for providing services, such as restaurants, tea rooms, café, and gardens;
(2) The southern and eastern districts, both dominated by their residential aspect, despite the presence of many commercial and industrial areas;
(3) The northern district, which is a mixture of both commercial and residential vocations; and
(4) The western district, which remains the largest, the most populous, and the one with the most moderate activities. This modern district comprises several sets of residential buildings, various businesses and services, some local administrations, a subsidiary of the University, and two hospitals. It is also a place of entertainment and relaxation, making it the most visited district.
Building stock in Chlef City before the 1980 earthquake
-
The number of buildings in Chlef City before the 1980 earthquake did not exceed 5,131 units, divided into five districts (Fig. 3a). This stock can be divided into three typologies:
(1) Massive masonry buildings, built before 1954, that survived the devastating 1954 earthquake (Ms 6.9). These buildings are rare in Chlef City and were designed without seismic standards, since during the colonial era there was no seismic code in Algeria.
(2) Reinforced concrete (RC) moment frames with masonry infill built between 1954 and 1962, designed according to the AS55 recommendations (a pre-seismic code) established in the aftermath of the 1954 earthquake; and
(3) Reinforced concrete RC moment frames with brick infill constructed between 1962 and 1980, designed according to the French PS69 recommendations, which are a low-level seismic code.
Buildings stock in Chlef City after the 1980 earthquake
-
After the 1980 earthquake, Chlef City experienced a large urban enlargement (Fig. 3b). New districts were created to relocate the homeless, and numerous structures were erected. Moreover, the city has experienced a growing immigrant population over the 2000s, resulting in an intense urbanization.
Thus, according to the data collected in this study, the city's housing stock consists of 22,053 buildings comprising 33,717 houses, which are spread throughout the city's five districts (Table 1, Fig. 4a). The building stock includes the following types:
Table 1. Distribution of housing and building stocks by the city's districts.
District Number of
housingPercent (%) Number of
buildingsPercent (%) Downtown 2,175 6.45 1,606 7.28 Southern 9,924 29.44 6,515 29.54 Eastern 6,667 19.77 5,037 22.84 Northern 1,225 3.63 1,225 5.55 Western 13,726 40.71 7,671 34.79 Total 33,717 100 22,053 100 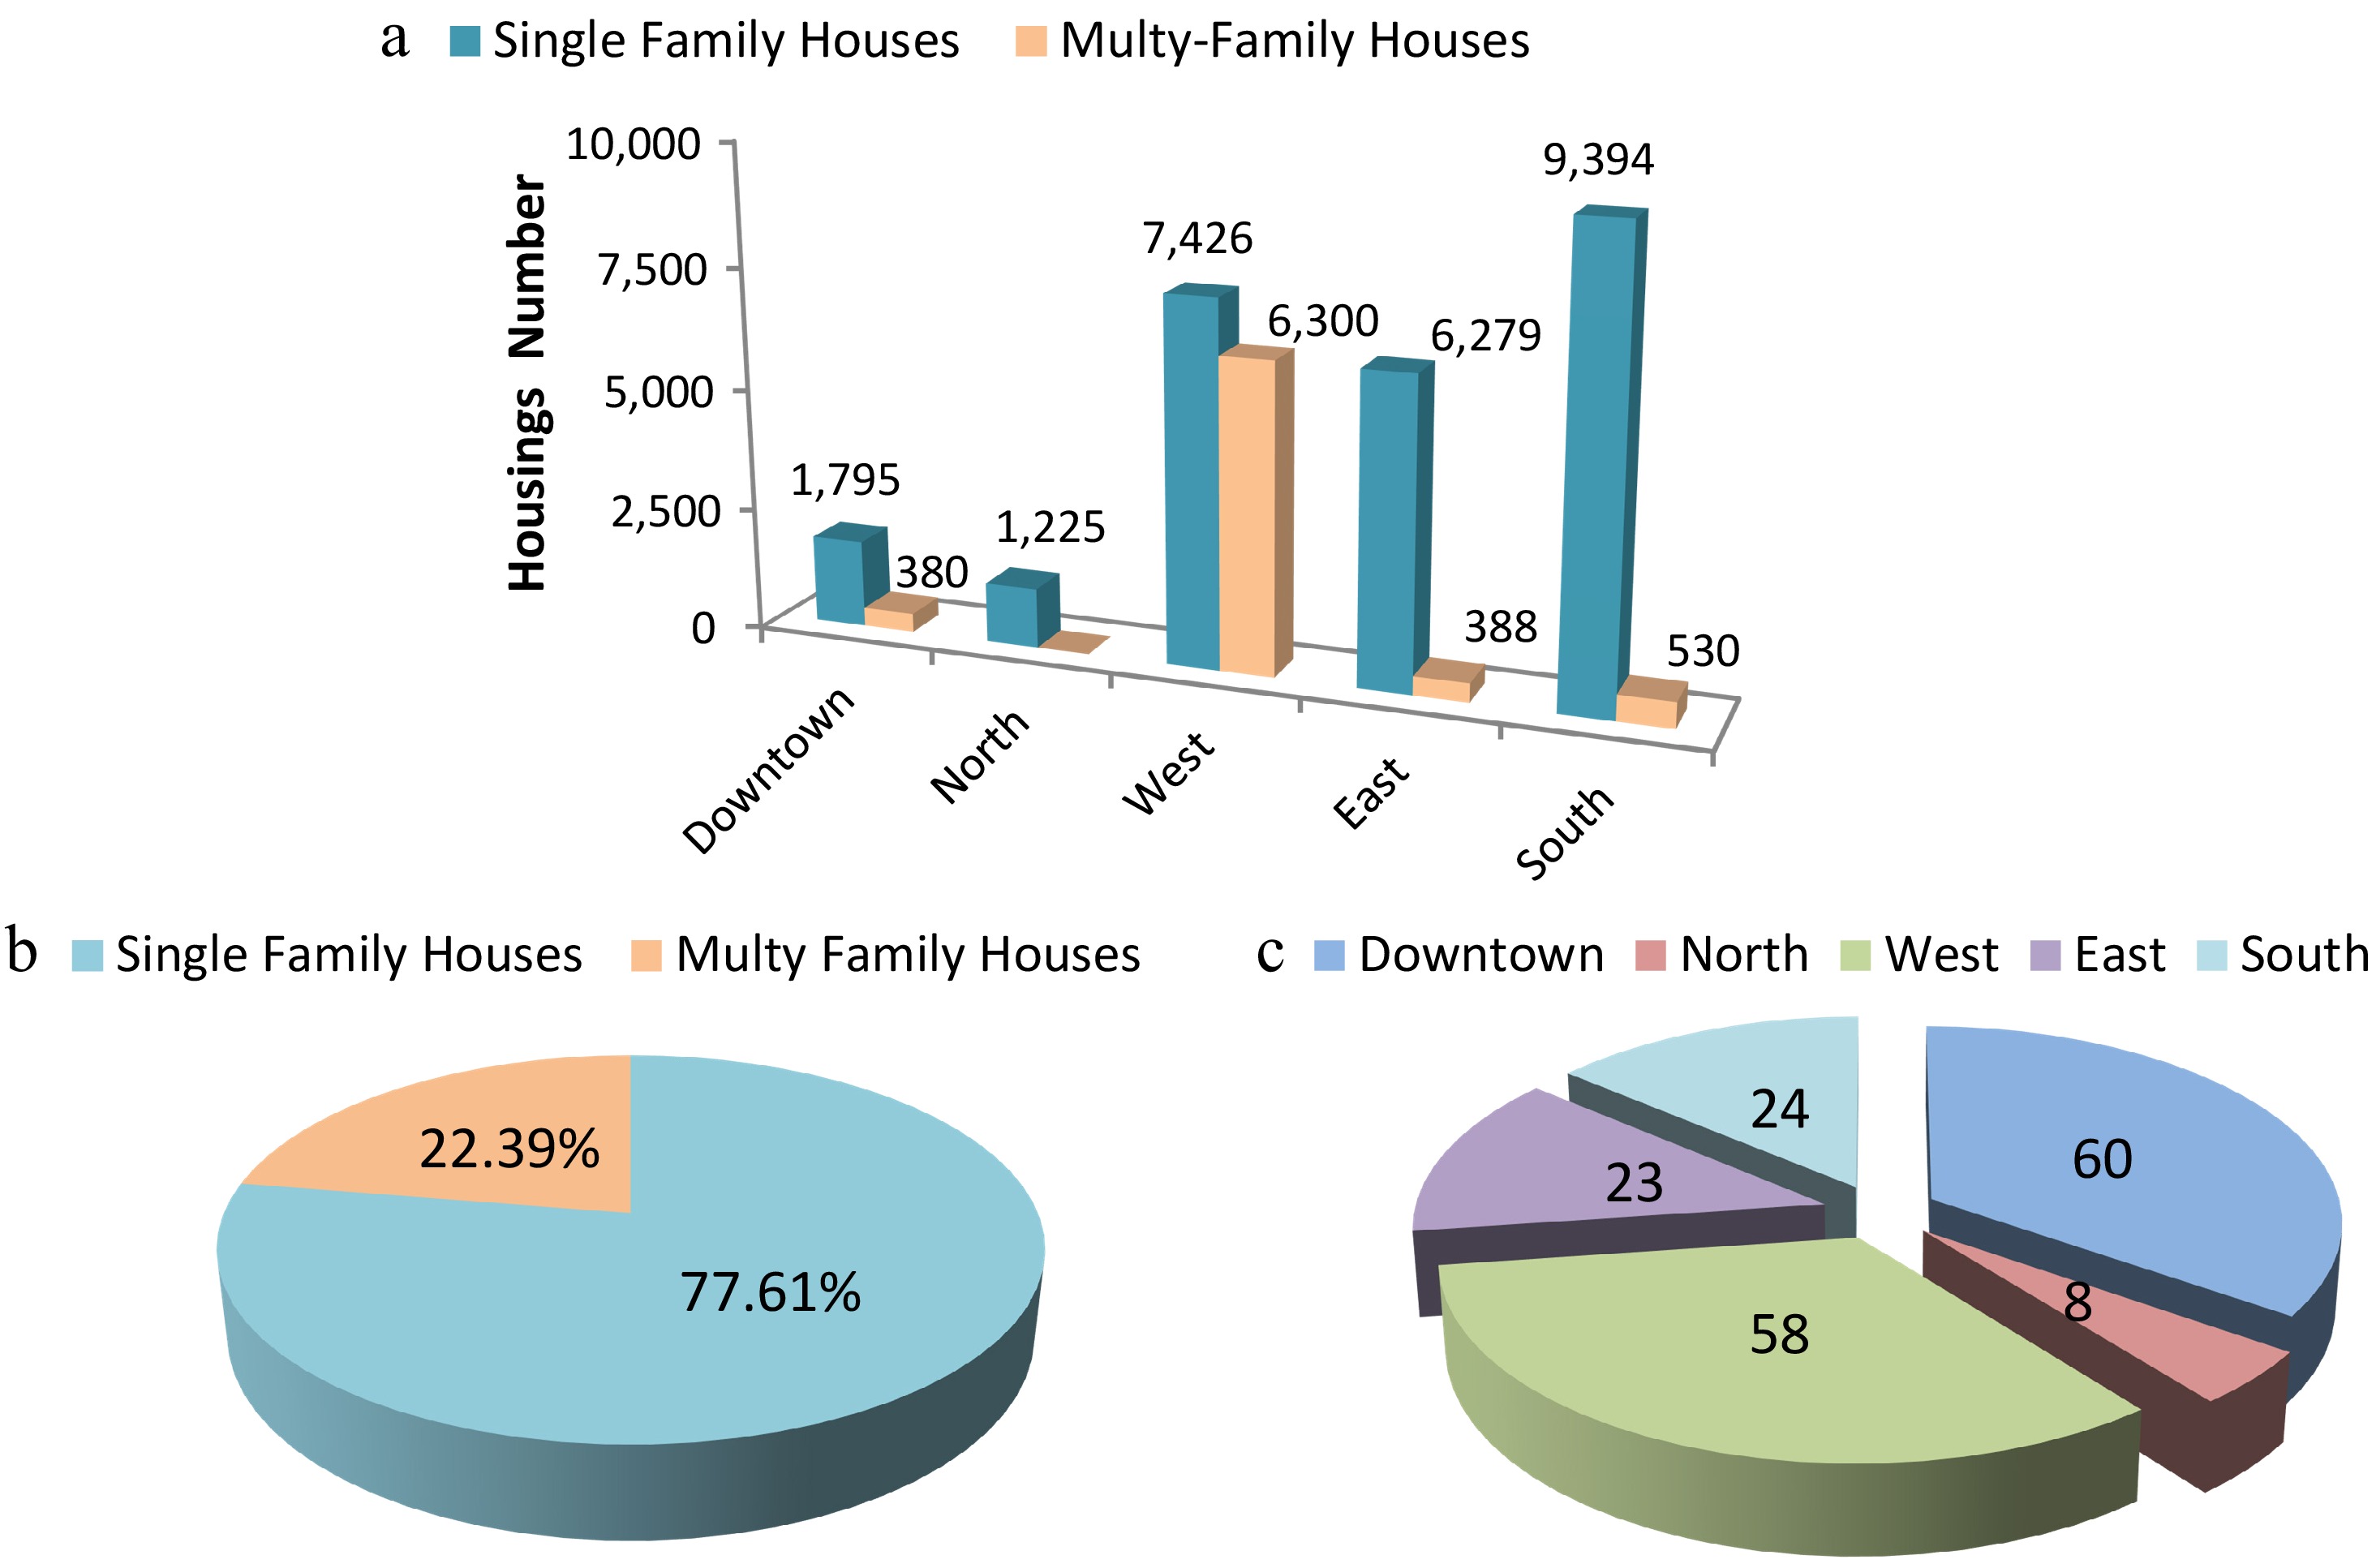
Figure 4.
Building stock in Chlef City in terms of: (a) housing number by district, (b) percentage of housing types, and (c) number of public facilities by district.
(1) Single-family houses, which are the predominant type, representing 77.61% of the total housing stock (Fig. 4b). These buildings can have one of the following structural systems: massive stone, RC moment frames, RC dual systems, or prefabricated structures. The latter are wooden single-story houses built after the El Asnam 1980 earthquake to rehouse the homeless, and are designed to withstand earthquakes. This housing type counts 7,788 units.
(2) Multi-family houses representing 22.39% of the total housing stock (Fig. 4b). The structural system of these buildings is RC dual systems, and
(3) Public facilities buildings (schools, administrations, shopping centers, etc.), 34.68% of which are located in the city center (Fig. 4c). These buildings were generally built after 1981 and have an RC dual structural system.
-
Among the most used methods in seismic vulnerability studies are the LM1 level, called 'macroseismic', or the vulnerability index method VIM of the RISK-UE methodology[21]. In this study, the VIM method, which is an advanced method for seismic assessment, is utilized to analyze the vulnerability of the building stock. This method is preferred for assessing buildings' vulnerability in urban settings, particularly where there are no detailed seismicity estimates, but sufficient information regarding seismic intensity[21]. It is founded on recorded damage data and the EMS98 scale classification of buildings[39]. It also uses the damage grades Dk (k = 0~5) defined by this scale. This approach requires the seismic action to be defined in terms of macroseismic intensity, while the seismic quality of the buildings to be described by means of the vulnerability index VI[40].
Building's typology classification
-
Building typologies in the studied city are classified based on the following three criteria:
(1) Seismic code level: the seismic code used in the building's design varies according to the date of construction of the latter. Thus four code levels are distinguished: no code for the buildings built before 1962, low code for the buildings built between 1962 and 1980, medium for those built between 1981 and 2003, and high for those built after 2003.
(2) Construction material and structural system: three materials and four structural systems are identified: reinforced or confined masonry walls (Fig. 5a), RC (reinforced concrete) moment frames (Fig. 5b), RC dual systems (RC frame and concrete walls) (Fig. 5c), and wooden prefabricated houses (Fig. 5d).
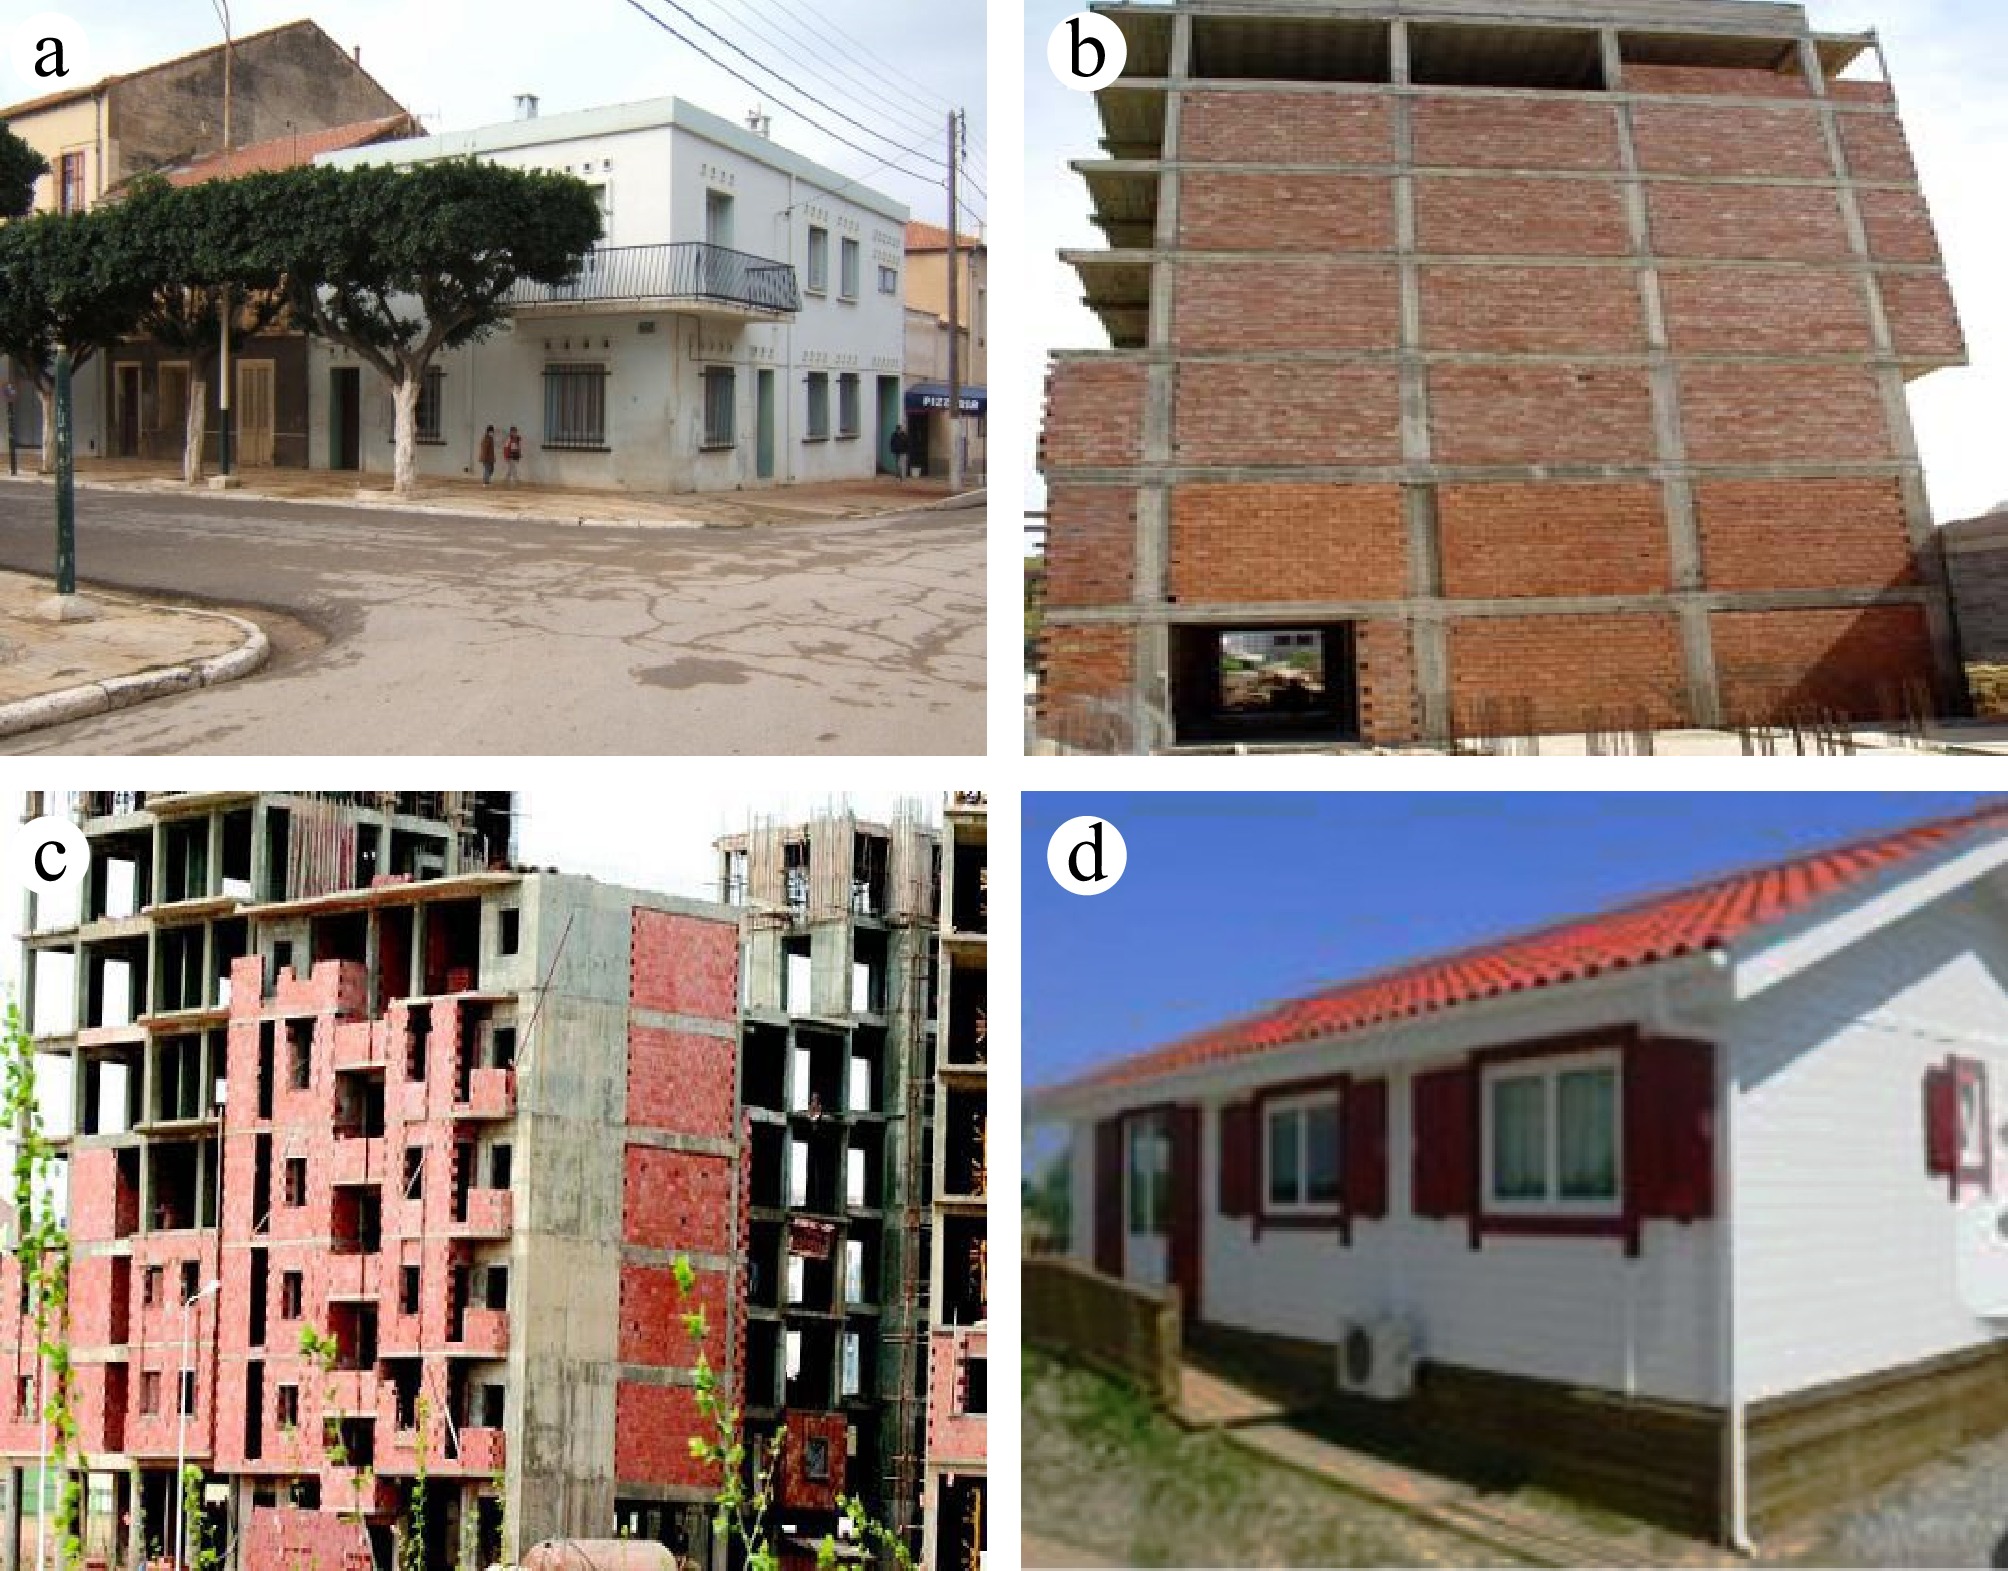
Figure 5.
Building structural typologies existing in Chlef City: (a) masonry buildings, (b) RC moment frames (under construction), (c) RC dual systems (under construction), and (d) wooden prefabricated houses.
(3) Building's purpose: This criterion distinguishes two categories of buildings: residential (collective or individual), and public facilities (administrative, educational, social, cultural, and commercial). Note that the number of public facility buildings is insignificant compared to those used for housing (< 2% of the total building stock).
By classifying the studied stock according to these criteria, seven typologies are identified, which are named: TM (masonry buildings built before 1962), T1 (RC moment frames regularly infilled walls built between 1962 and 1980), T2 (RC moment frames regularly infilled walls built between 1981 and 2003), T3 (RC moment frames regularly infilled walls built after 2003), T4 (RC dual systems built between 1981 and 2003), T5 (RC dual systems built after 2003), and TP (wooden prefabricated houses). Table 2 gives the distribution of both the housing and building stock vs these seven typologies.
Table 2. Distribution of the buildings stock vs the identified typologies.
Typology Typology description Building number Buildings percent (%) TM Masonry buildings built before 1962 889 2.61 T1 RC moment frames regularly infilled walls built between 1962 and 1980 7,353 31.92 T2 RC moment frames regularly infilled walls built between 1981 and 2003 3,140 12.81 T3 RC moment frames regularly infilled walls built after 2003 1,305 4.49 T4 RC dual systems (RC frame and wall) built between 1981 and 2003 942 2.85 T5 RC dual systems (RC frame and wall) built after 2003 636 1.44 TP Wooden Prefabricated houses 7,788 43.88 Total 22,053 100 Vulnerability index evaluation
-
To evaluate the vulnerability index, the VIM method employs a classification framework based on building typology. This study uses the Building Typology Matrix (BTM) to evaluate the vulnerability index assigned to each of the identified typologies in the studied area. The BTM consists of 23 primary building categories organized by structural type and construction material, and was proposed in the RISK-EU project[21]. Additionally, the method incorporates regional and behavioral modifiers considering, respectively, the regional characteristics and factors influencing the building's seismic performance, such as the seismic code level. Then, using the BTM, and Eq. (1) defined by the RISK-EU methodology[21], the vulnerability index VI is calculated and assigned to each of the seven building typologies identified in Chlef City (Table 3). Its value ranges from 0 to 1; values close to 1 indicate higher vulnerability, while values close to 0 indicate lower vulnerability. Structures designed with high codes fall into the latter category.
Table 3. Vulnerability index values assigned to the identified building typologies.
Building's
typologyTypology's description Seismic code level RISK-EU typology label Initial VI index* Assigned VI index** TM Structural system: massive stone − M1.3 0.616 0.616 Construction date: 1954–1962 Building's purpose: residential T1 Structural system: regularly infilled walls Precode or low RC3.1 0.402 0.562 Construction date: between 1962 and 1980 Building's purpose: residential T2 Structural system: regularly infilled walls Medium RC3.1 0.402 0.402 Construction date: between 1981 and 2003 Building's purpose: residential T3 Structural system: RC moment frames High RC1 0.442 0.282 Construction date: after 2003 Building's purpose: residential T4 Structural system: RC dual systems Medium RC2 0.386 0.386 Construction date: between 1981 and 2003 Building's purpose: residential/facilities T5 Structural system: RC dual systems High RC2 0.386 0.226 Construction date: after 2003 Building's purpose: residential/facilities TP Structural system: wooden prefabricated houses High Unclassified /
/Construction date: between 1981–1982 Building's purpose: residential/facilities * The most probable value of the VI given in the building typologies matrix BTM[21]. ** The assigned vulnerability index (this study). In this study, the regional vulnerability modifier factor VR is set to zero because it is only introduced to account for the specific characteristics of certain building types and local construction practices, materials, and design deficiencies not captured by standard models. Examples of these building types are buildings in dense urban areas, such as centuries-old edifices and those with stone/brick walls and wood/earth floors, prevalent in old European city centers[21]. Yet, due to successive seismic events and local construction practices, buildings of these types did not exist in the city of Chlef.
However, the unique behavior modifier Vm, which is considered in this study, is related to the seismic code level, except for the TM typology, as the method does not take it into account for all masonry typologies (rubble stone, fieldstone, simple stone, and massive stone)[21]. Thus, the consideration of the unique parameter of the seismic code level as a behavior modifier is based on an examination of a large number of specimens of each building typology in the studied city. The analysis reveals that the most significant modifier of building behavior is the seismic code used in the building's design stage. The other parameters are assigned a value of zero or assigned a value that may be balanced by a different parameter having the same Vm score, depending on the typology case. The following clarifications provide insight into this process of evaluation:
(1) For the M1.3 typology, the most probable value of the vulnerability index is equal to 0.616, and is directly assigned to the TM typology. It should be noted here that this study did not take into account behavior modifier factors related to the state of preservation (Vm = +0.04) of the TM typology, the number of floors (Vm = −0.02), and the existence of soft-story (Vm = +0.04) in some buildings belonging to this typology. This is due to the fact that these modifier factor scores are balanced by the retrofit interventions and the structural system factors, which can have a Vm score ranging between (−0.08 ÷ +0.08), and (−0.04 ÷ +0.04), respectively.
(2) For RC typologies (T1−T5), the Vm increases by 0.16 for a low code, decreases by 0.16 for a high code, and is assigned a null value for a medium code. Note that the BTM assigns a null value to the other factors, such as the number of floors, which generally ranges from three to five in Chlef City[21]. Furthermore, none of these typologies encompasses plan or vertical irregularities, short columns, or bow windows. Further details on the process of evaluating the Vm behavior modifier can be found in the RISK-EU project, referenced in Milutinovic & Trendafiloski [21].
(3) For TP typology, which cannot be considered as an ordinary wooden structure, since these single-story houses were specially designed to withstand earthquakes and have proven their good behavior during multiple earthquakes over 46 years of their existence in Chlef City. For this reason, this study excludes this typology from the vulnerability evaluation, as it would be pointless.
Equation (1) gives the final vulnerability index to be assigned to each buildings typology:
$ VI_{building }= VI_{class} + \Delta V_{R} + \sum \limits_{\boldsymbol{j}=\mathbf{1}}^{\boldsymbol{n}}\Delta {\boldsymbol{V}}_{\boldsymbol{m}\boldsymbol{j}} $ (1) where, VIclass is the building's corresponding vulnerability index given by the BTM[21], ΔVR is a regional modifier that takes into account the region characteristics, and ΔVmj are behavior modifiers that include features affecting the buildings seismic performance.
Vulnerability and fragility curves development
-
To evaluate the building's vulnerability, the EMS seismic intensity is varied from a value of V to XII, since intensities lower than V do not cause significant damage. To assess the mean damage
$\mu_{D } $ $\mu_{D } $ $ \mu_{D }=2,5 \left[1 + tanh \left( \dfrac{{I}+{6},{25}{V}{I}-{13},{1}}{{Q}}\right) \right] $ (2) where, Q is the ductility index, which is determined by considering the building's typology and construction features. Curves derived from the EMS-98 scale have a Q value of 2.3.
Finally, fragility curves are developed for each building's typology using the beta probability function in Eq. (3) and the beta cumulative density function, Eq. (4):
$ p{}_{\beta }\left(x\right)=\dfrac{\Gamma \left(t\right)}{\Gamma \left(r\right)\Gamma \left(t-r\right)}\dfrac{{\left(x-a\right)}^{r-1}{\left(b-x\right)}^{t-r-1}}{{\left(b-a\right)}^{t-1}} $ (3) $ P_{\beta} (x) = \int \nolimits_{{x}}^{{a}}{{P}}_{{\beta }}({\varepsilon }){d}{\varepsilon } $ (4) where, a, b, t, and r are the distribution parameters, Γ is the gamma function, and r, a factor given by Eq. (5):
$ r=t\ (0.007{\mu_D}^3-0.052{\mu_D}^2+0.287\mu_D) $ (5) -
Table 4 and Fig. 6 give the mean damage degree
$\mu_{D } $ $\mu_{D } $ $\mu_{D } $ $\mu_{D } $ Table 4. Mean damage degrees of building typologies as a function of EMS intensity.
Typologies Mean damage degree µD (%) versus EMS intensity V VI VII VIII IX X XI XII TM 0.12 0.28 0.62 1.26 2.23 3.28 4.10 4.58 T1 0.09 0.21 0.47 1.00 1.87 2.94 3.86 4.45 T2 0.03 0.09 0.21 0.47 1.00 1.87 2.94 3.86 T3 0.01 0.03 0.09 0.21 0.47 1.00 1.87 2.94 T4 0.03 0.08 0.19 0.44 0.93 1.77 2.83 3.79 T5 0.01 0.03 0.08 0.19 0.44 0.93 1.77 2.83 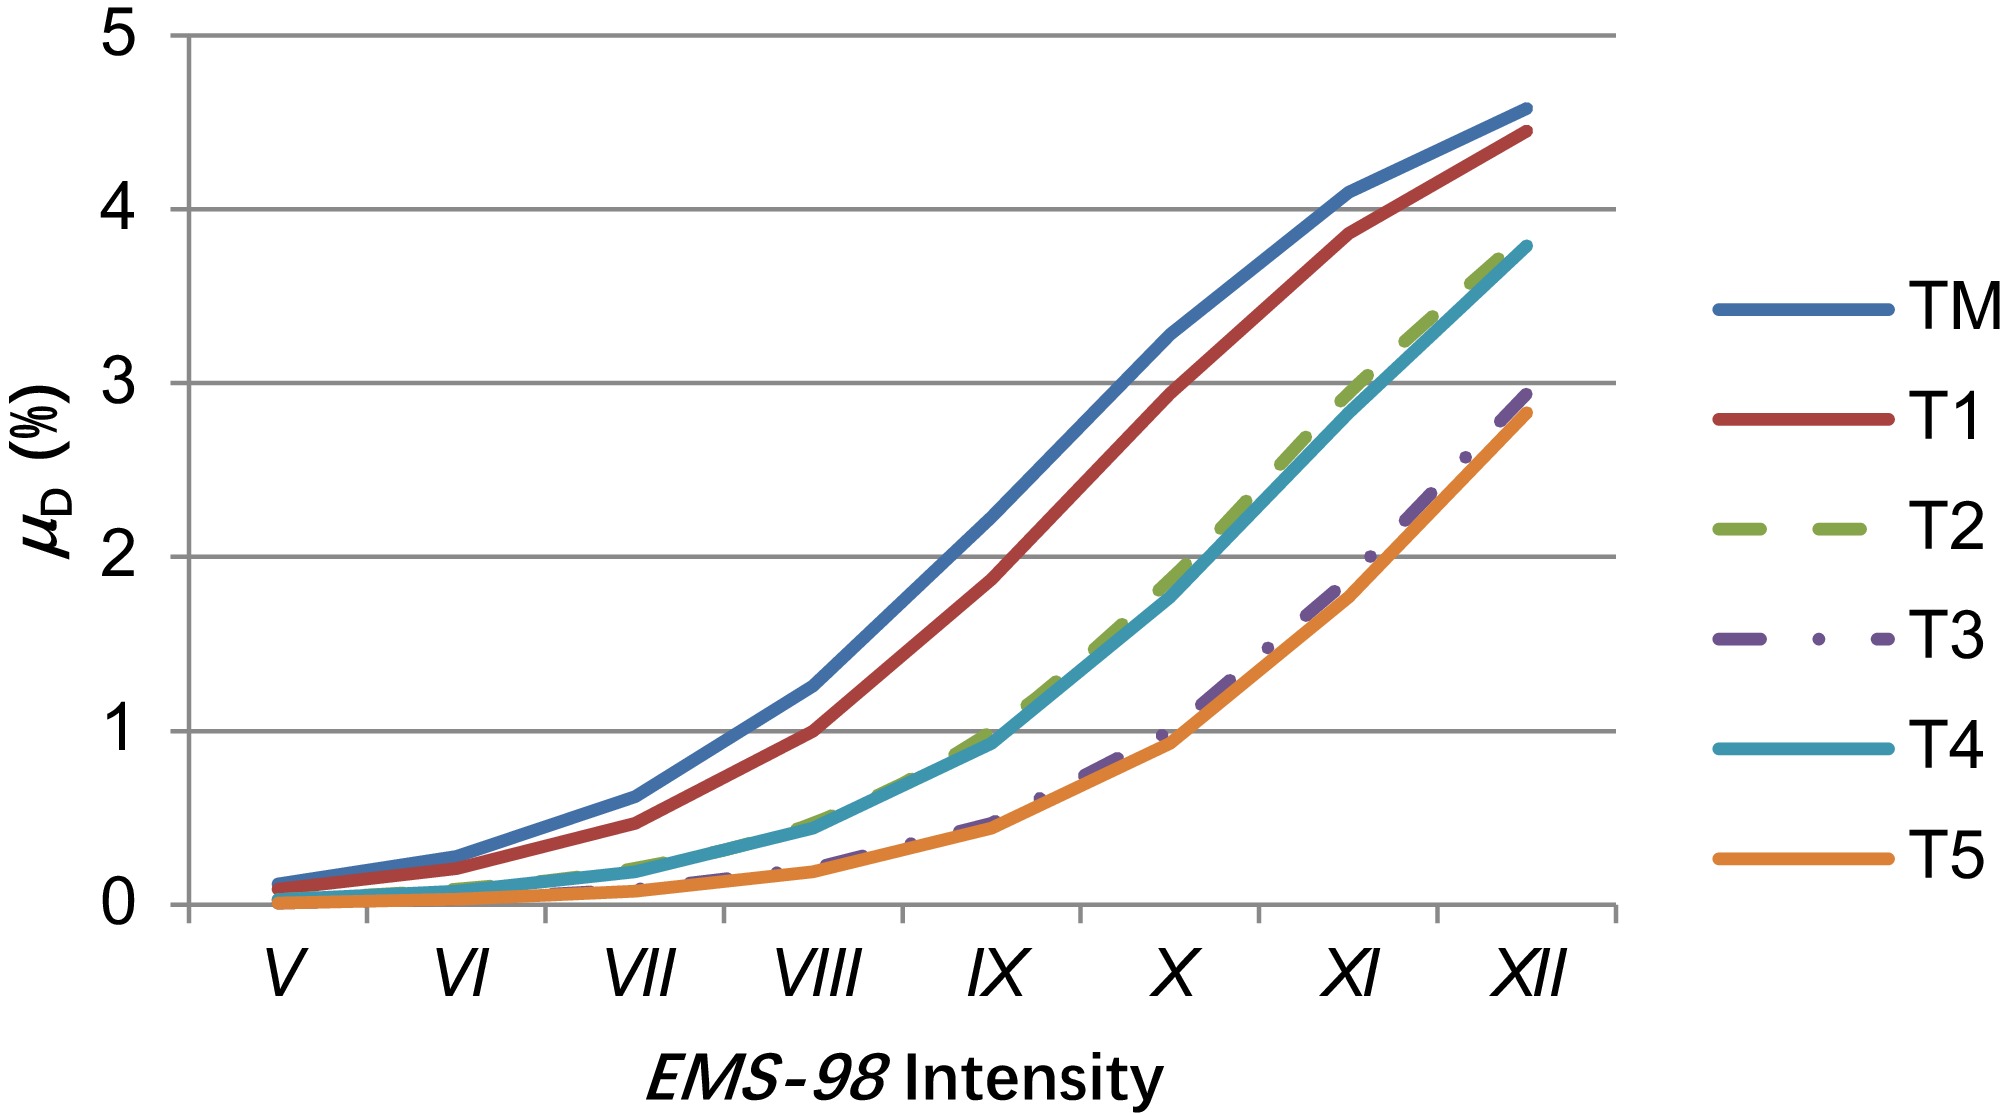
Figure 6.
Vulnerability curves of buildings typologies identified in Chlef City.
Conversely, the T5 typology is the least vulnerable, since
$\mu_{D } $ Results of fragility curves development and damage distribution
-
Figure 7 illustrates the developed fragility curves for the identified building typologies in Chlef City, except for the Tp typology, which is not vulnerable to earthquakes. A proportional relationship is noticed between the damage probabilities and the seismic intensity for all typologies. It is also clearly observed that, among the identified typologies, the most affected by the high probability of damage are typologies TM and T1, which together accumulate 8,242 building units, representing 37.37% of the total building stock. The second observation displays the fact that typologies T2 and T4 have a fairly a similar fragility curve shape, and are also subject to a high probability of damage. These two typologies encompass 4,082 building units, which represent 18.51% of the city's building stock. However, typologies T3 and T5 reveal a good seismic behavior compared to the other typologies, since even at an EMS intensity of X, both damage D4 and D5 are null.
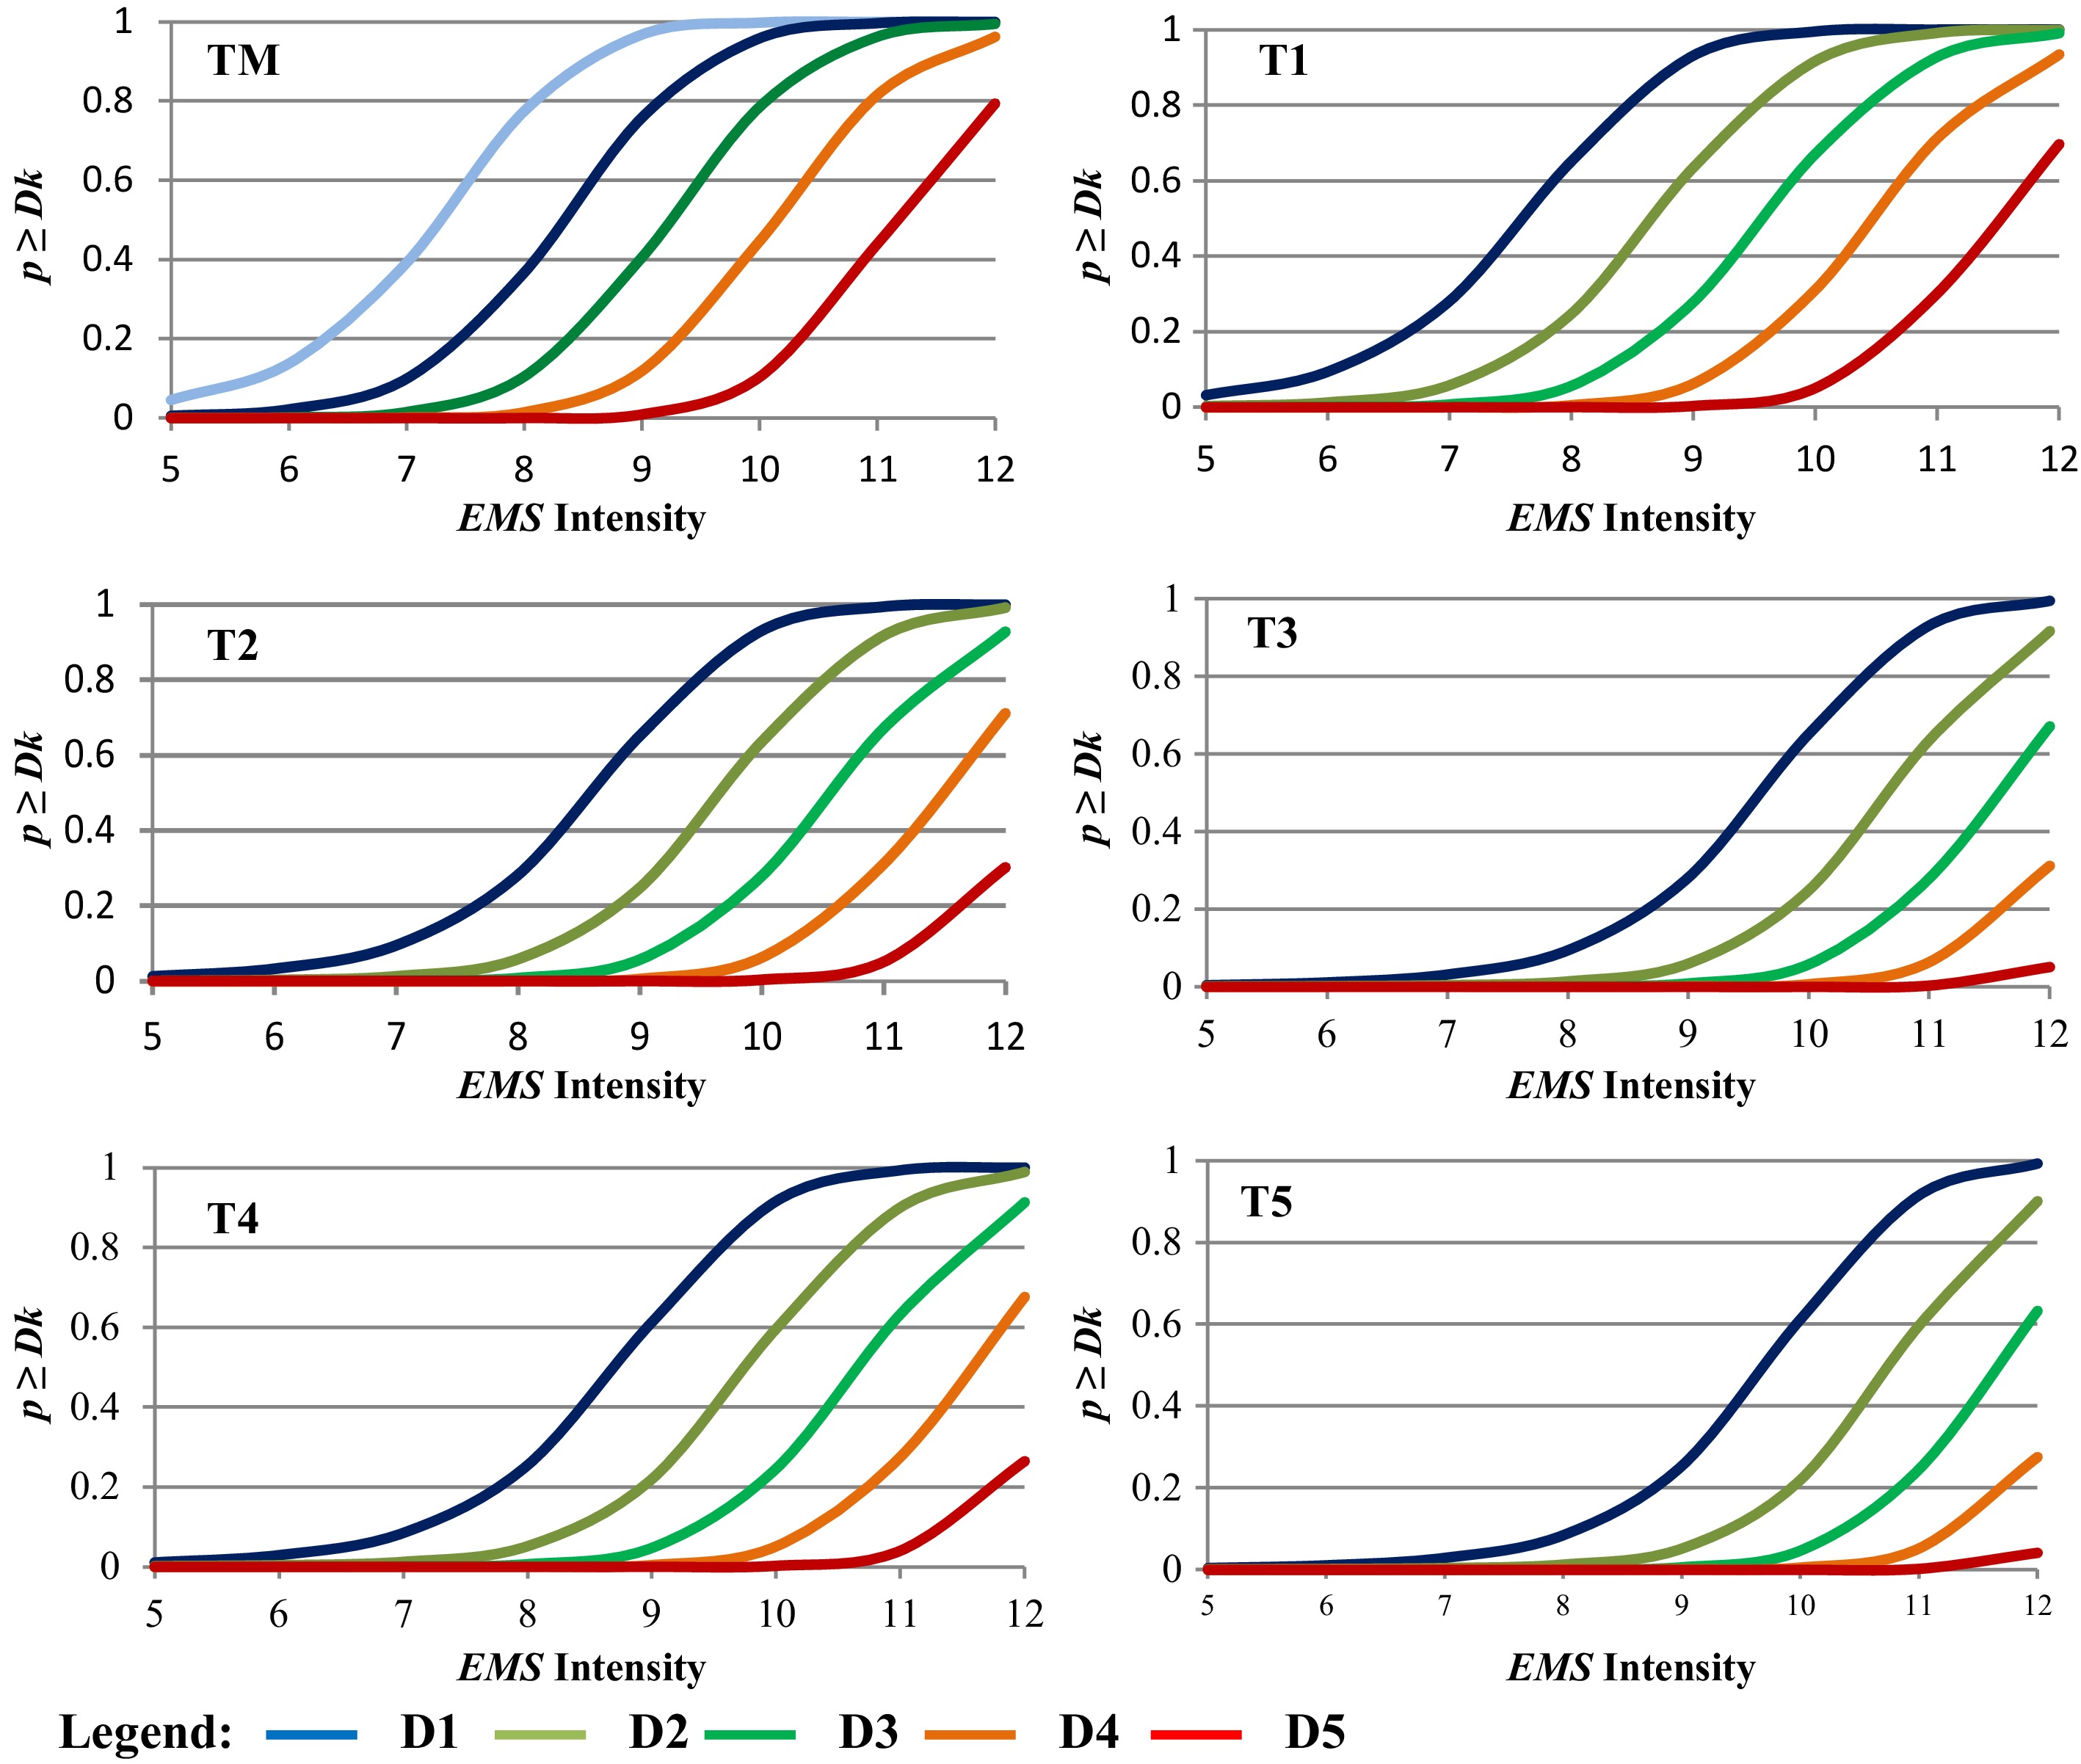
Figure 7.
Fragility curves developed for the buildings typologies identified in Chlef City.
Figure 8 shows the percentage of damage distribution for the five damage grades on the EMS scale (Dk, k = 1–5) in histogram form. The numerical values of the damage distribution are detailed in Table 5. It is clear that typologies TM and T1 can sustain the most significant structural damage (≥ D3) at EMS intensity X: 78.57%, and 67.13%. However, at intensity IX, non-structural damage is also significant for them: 59.42% and 72.06%. This is primarily due to the fact that the vulnerability indices assigned to these two typologies are higher than those assigned to the others. These high index values reflect the buildings' age, their structural systems (neither moment frames nor shear walls), and the absence of seismic codes during the design phase, especially for the first typology.
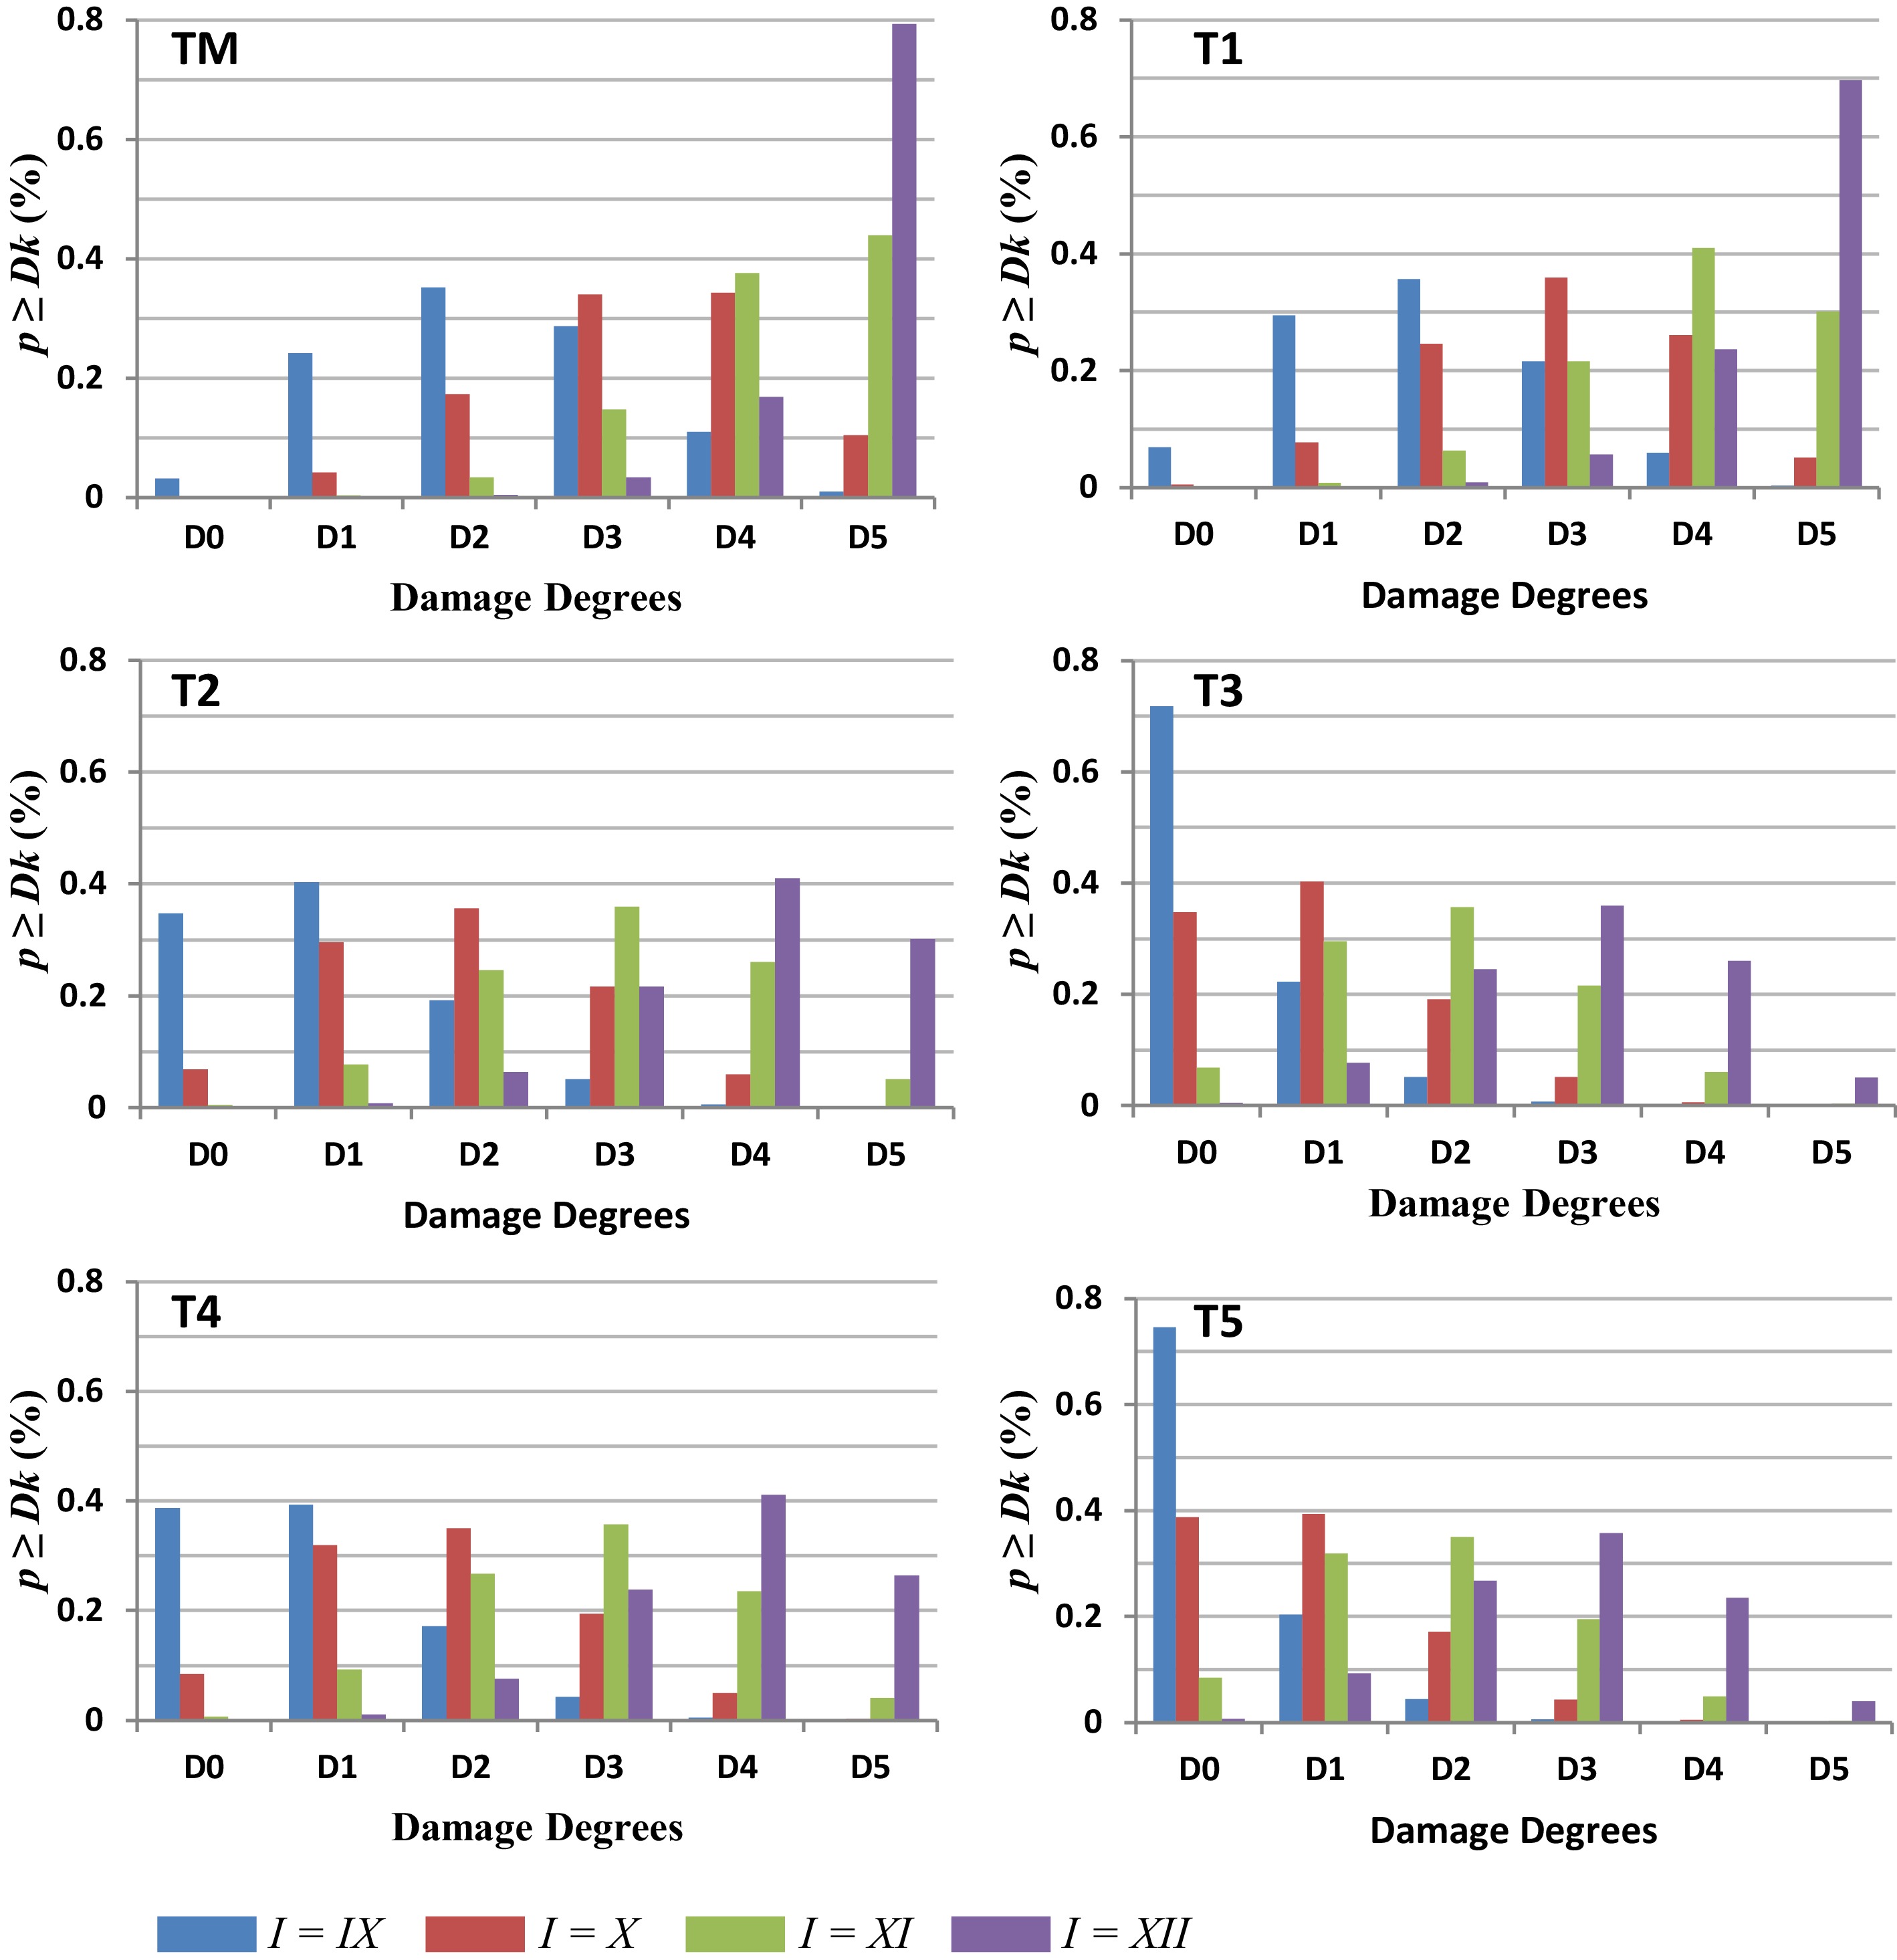
Figure 8.
Damage distribution for six of the identified typologies (EMS = IX–XII).
Table 5. Damage distribution and probability of structural and non-structural damage (I = IX).
Typology Damage levels (%) (I = IX) Structural damage (%)
(≥ D3)No structural damage (%) D0 D1 D2 D3 D4 D5 (< D3) TM 3.18 24.19 35.22 28.70 10.95 0.93 40.58 59.42 T1 6.87 29.52 35.65 21.62 5.99 0.33 27.94 72.06 T2 34.79 40.31 19.15 5.13 0.60 0.01 5.74 94.26 T3 71.77 22.27 5.15 0.75 0.04 0.00 0.79 99.21 T4 38.75 39.32 17.17 4.27 0.46 0.00 4.73 95.27 T5 74.55 20.33 4.45 0.62 0.03 0.00 0.65 99.35 In the same way, typologies T2 and T3 are less threatened by structural damage, yet they are much more susceptible to non-structural damage: 94.26%, and 99.21%, respectively. This is thanks to their seismic design, which improves their seismic performance against structural damage. Yet in the event of EMS intensity of X, they can sustain 27.94%, and 5.74% structural damage, respectively.
On the contrary, the T4 typology exhibits better seismic behavior, despite undergoing significant non-structural damage at both intensities: 95.27% (I = IX), and 75.64% (I = X). However, it experiences relatively high structural damage: 4.73% (I = IX) and 24.36% (I = X). It should be noted that T2 and T4 typologies have almost similar probabilities of both structural and non-structural damage at both EMS intensities of IX and X (Tables 5, 6). This analogy can be explained by the consideration of the same level of seismic regulation for buildings constructed between 1981 and 2003.
Table 6. Damage distribution and probability of structural and non-structural damage (I = X).
Typology Damage levels (%) (I = X) Structural damage (%)
(≥ D3)No structural damage (%) D0 D1 D2 D3 D4 D5 (< D3) TM 0.17 4.14 17.27 33.95 34.25 10.37 78.57 21.43 T1 0.51 7.75 24.59 35.97 26.07 5.09 67.13 32.87 T2 6.87 29.52 35.65 21.61 6.00 0.33 27.94 72.06 T3 34.79 40.31 19.15 5.13 0.60 0.01 5.74 94.26 T4 8.45 31.93 35.00 19.45 4.91 0.00 24.36 75.64 T5 38.75 39.32 17.17 4.27 0.46 0.00 4.73 95.27 The last analyzed typology (T5) exhibits excellent seismic performance. Even at intensity X, the maximum structural damage it can sustain is only 4.73%. This is due to its reinforced concrete shear wall structural system and seismic design level (high), which comply with the latest version of the Algerian seismic code.
Finally, it is evident that, in addition to the ground motion, the seismic vulnerability of buildings may be affected by soil-structure interaction, damage to non-structural components, and induced effects, such as liquefaction. In fact, compared to an analysis that disregards soil-structure interaction, taking it into account might greatly increase the likelihood of exceeding damage limitations. On the other hand, the induced effects, such as settlements, liquefaction, and landslides, can be the major cause of buildings' collapse, despite their perfect structural design. Likewise, damage to non-structural components often causes major disruption and economic losses, as well as human fatalities, even if the building's structure doesn't sustain damage. Including these factors in the analysis of a portfolio's seismic fragility, which represent the limitations of this study, leads to a complete and meaningful study.
-
This study focused on assessing the seismic vulnerability of buildings on a citywide scale. The study employed the VIM method, the first level of the RISK-UE methodology, which is typically used for such evaluations, primarily in Mediterranean countries. The city of Chlef, which is characterized by its historical seismicity, was subject to this evaluation. After collecting data and conducting a field survey of the city's buildings, the seismic vulnerability of 22,053 buildings containing 33,717 houses across five districts was considered. This building stock was divided into seven typologies.
The study results included assessing and developing vulnerability and fragility curves in relation to EMS intensity. The percentage of damage for each damage grade were also evaluated and schematically illustrated. Considering a deterministic seismic scenario, that of El Asnam 1980, it is found that among the seven identified typologies, the TM and T1 typologies that bring together 8,242 building units, representing 37.37% of the city's building stock, are highly vulnerable to earthquakes and can experience important structural damage.
A number of 4,082 buildings, representing 18.50% of the building stock, belonging to typologies T2 and T4, fall into the second place and are found to be moderately vulnerable. Therefore, it is advantageous to retrofit buildings belonging to these four vulnerable typologies, in order from most to least vulnerable. The total number of buildings requiring retrofitting is 12,324 units, representing 55.88% of the city's building stock.
The rehabilitation operation must adhere to the proposed priorities outlined in this study and utilize retrofitting techniques employed by local construction rehabilitation firms. For RC buildings, these techniques comprise not only the traditional method of concrete jacketing for structural elements, but also modern structural enhancements, including the installation of new reinforced concrete shear walls and the implementation of diagonal steel cross-bracing between beams and columns. These retrofitting methods improve lateral stiffness and energy dissipation capacity. Another technique used in Algeria is covering columns and beams with composite materials, such as FRP (fiber-reinforced polymer), which are lightweight, corrosion-resistant reinforcements. This technique increases the building's structural strength, ductility, and shear strength.
As regards the retrofit of masonry buildings with soft stories that are usually encountered in the city center and are used for commercial purposes, it should include the addition of reinforced concrete infill walls to these levels to prevent collapse in case of a seismic event. Note that the 2024 Algerian seismic code provides guidance about retrofitting techniques to be used to enhance the seismic resilience of buildings. It aims for a better performance-based design and rehabilitation of existing, older, and vulnerable building stock in Algeria.
In conclusion, to reduce seismic risk in the city of Chlef, local authorities can use the study's findings as a useful tool for the city's seismic risk management plan.
-
The authors confirm their contributions to the paper as follows: study conception and design: Boutaraa Z, Negulescu C; data collection: Boutaraa Z; analysis and interpretation of results: Boutaraa Z, Negulescu C; draft manuscript preparation: Boutaraa Z. The two authors reviewed the results and approved the final version of the manuscript.
-
All data generated or analyzed during this study are included in this published article.
-
The authors would like to thank the staff of the Department of Urban Planning, Public Facilities, and the People's Assembly of the Municipality of Chlef for the provided data.
-
The authors declare that they have no conflict of interest.
- Copyright: © 2026 by the author(s). Published by Maximum Academic Press on behalf of Nanjing Tech University. This article is an open access article distributed under Creative Commons Attribution License (CC BY 4.0), visit https://creativecommons.org/licenses/by/4.0/.
-
About this article
Cite this article
Boutaraa Z, Negulescu C. 2026. Seismic risk assessment at the urban scale through the development of fragility curves: the case of Chlef City (formerly El Asnam), Algeria. Emergency Management Science and Technology 6: e003 doi: 10.48130/emst-0026-0003 

Seismic risk assessment at the urban scale through the development of fragility curves: the case of Chlef City (formerly El Asnam), Algeria
- Received: 27 November 2025
- Revised: 23 January 2026
- Accepted: 10 March 2026
- Published online: 09 April 2026
Abstract: The seismic vulnerability of a building stock can be assessed by developing fragility curves, thereby creating a portfolio. These curves are a commonly used tool in seismic studies. Given its historical seismicity, Chlef City, located in northern Algeria, requires such an evaluation. Consequently, aiming to assess the buildings' seismic vulnerability at Chlef city's scale, this study categorizes the city's building stock into different typologies. A total of 33,717 houses within 22,053 buildings are considered. This stock is classified into seven typologies, based on three criteria: (1) the seismic code level; (2) the construction material and structural system (massive masonry, RC moment frames with brick infill, reinforced concrete, and RC dual systems); and (3) the building's purpose (residential/facility). The fragility curves were developed using the Vulnerability Index Method (VIM) of the RISK-UE methodology, which requires the seismic action to be defined in terms of macroseismic intensity. In this study, the European Macroseismic Scale EMS-98 is used. Therefore, the seismic intensity of the 1980 El Asnam earthquake (IX−X) is considered. The study's findings reveal that the massive stone and the regularly brick-infilled walls typologies, encompassing 8,242 buildings in total, are the most vulnerable and represent a rehabilitation priority. Two other typologies, covering 4,082 buildings, fall in the second range and are moderately vulnerable. Thus, together these four typologies represent 55.88% of the city's building stock. The study outcomes represent a valuable tool for local urban authorities, enabling them to prioritize the rehabilitation of the urban stock in this seismically prone city.
-
Key words:
- Seismic risk /
- Fragility curves /
- Buildings stock /
- RISK-UE /
- El Asnam earthquake /
- Chlef city