-
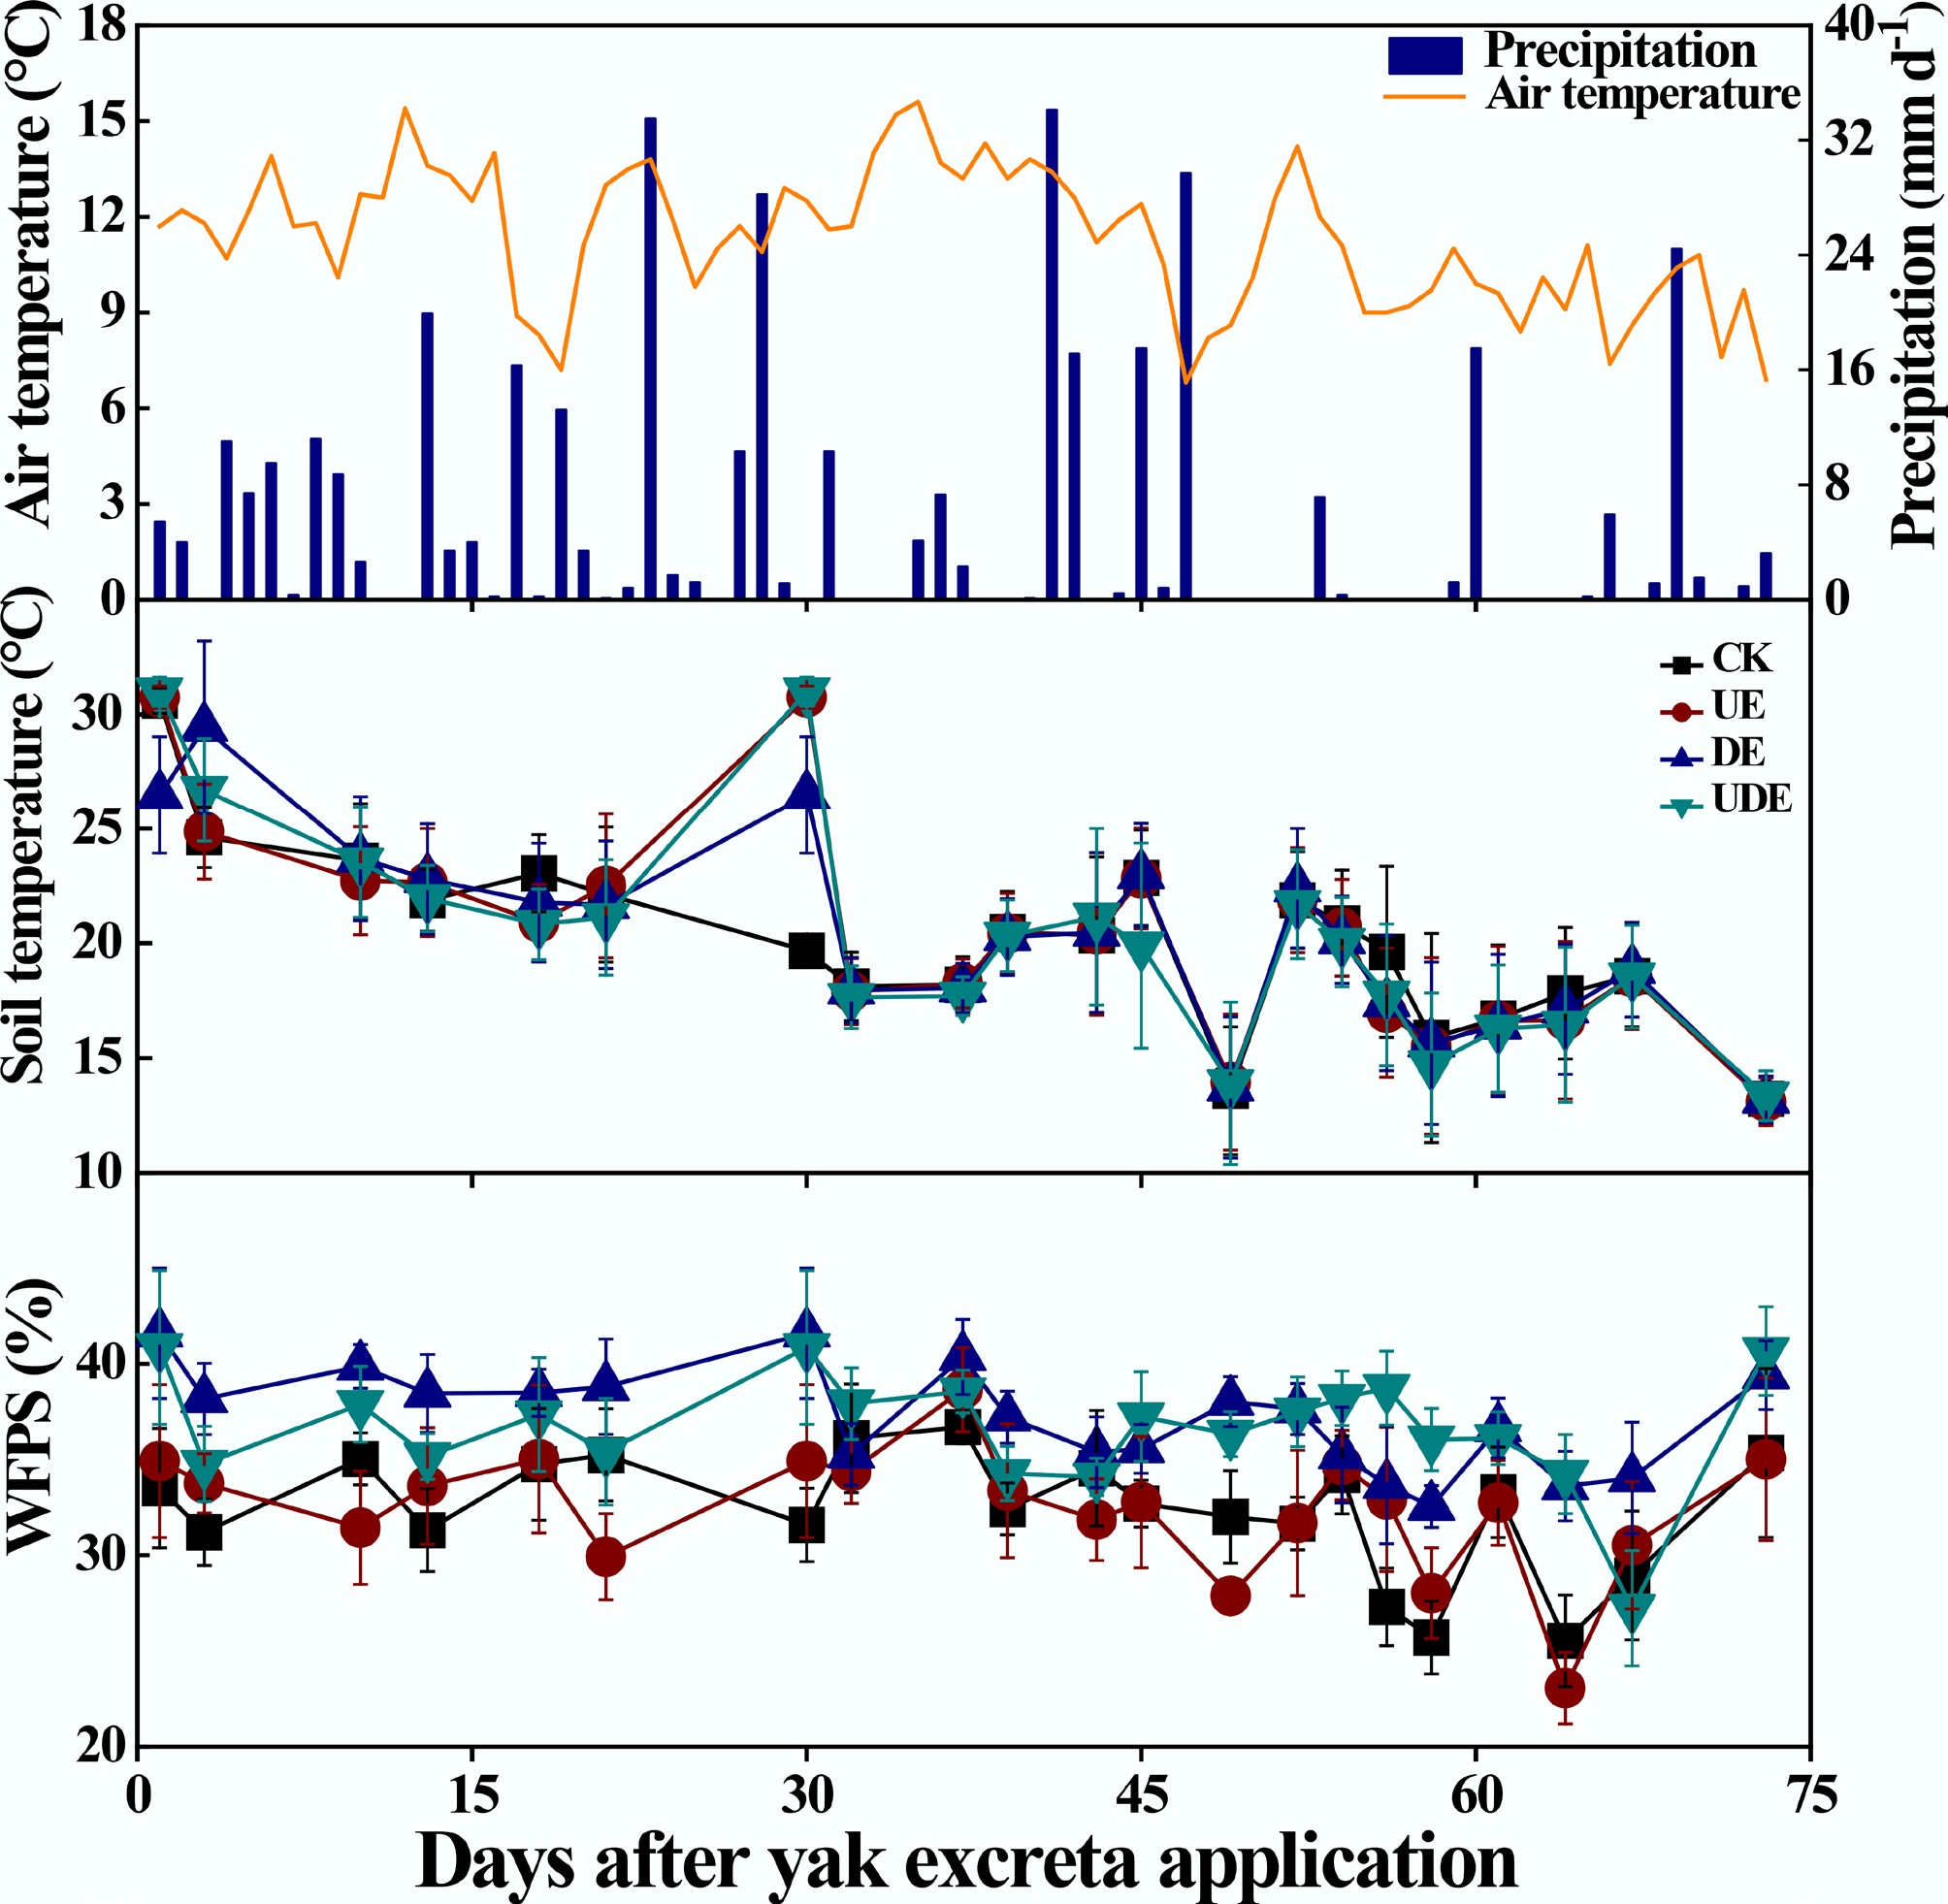
Figure 1.
Variation in daily air temperature and precipitation, and the effects of urine and dung excreta application on soil temperature at 5 cm depth and water-filled pore space (WFPS) from July 2, 2020 to September 12, 2020. CK, without excretion application; UA, urine application; DA, dung application; UDA, combined urine and dung application. The error bars represent the standard errors of the mean (n = 4).
-
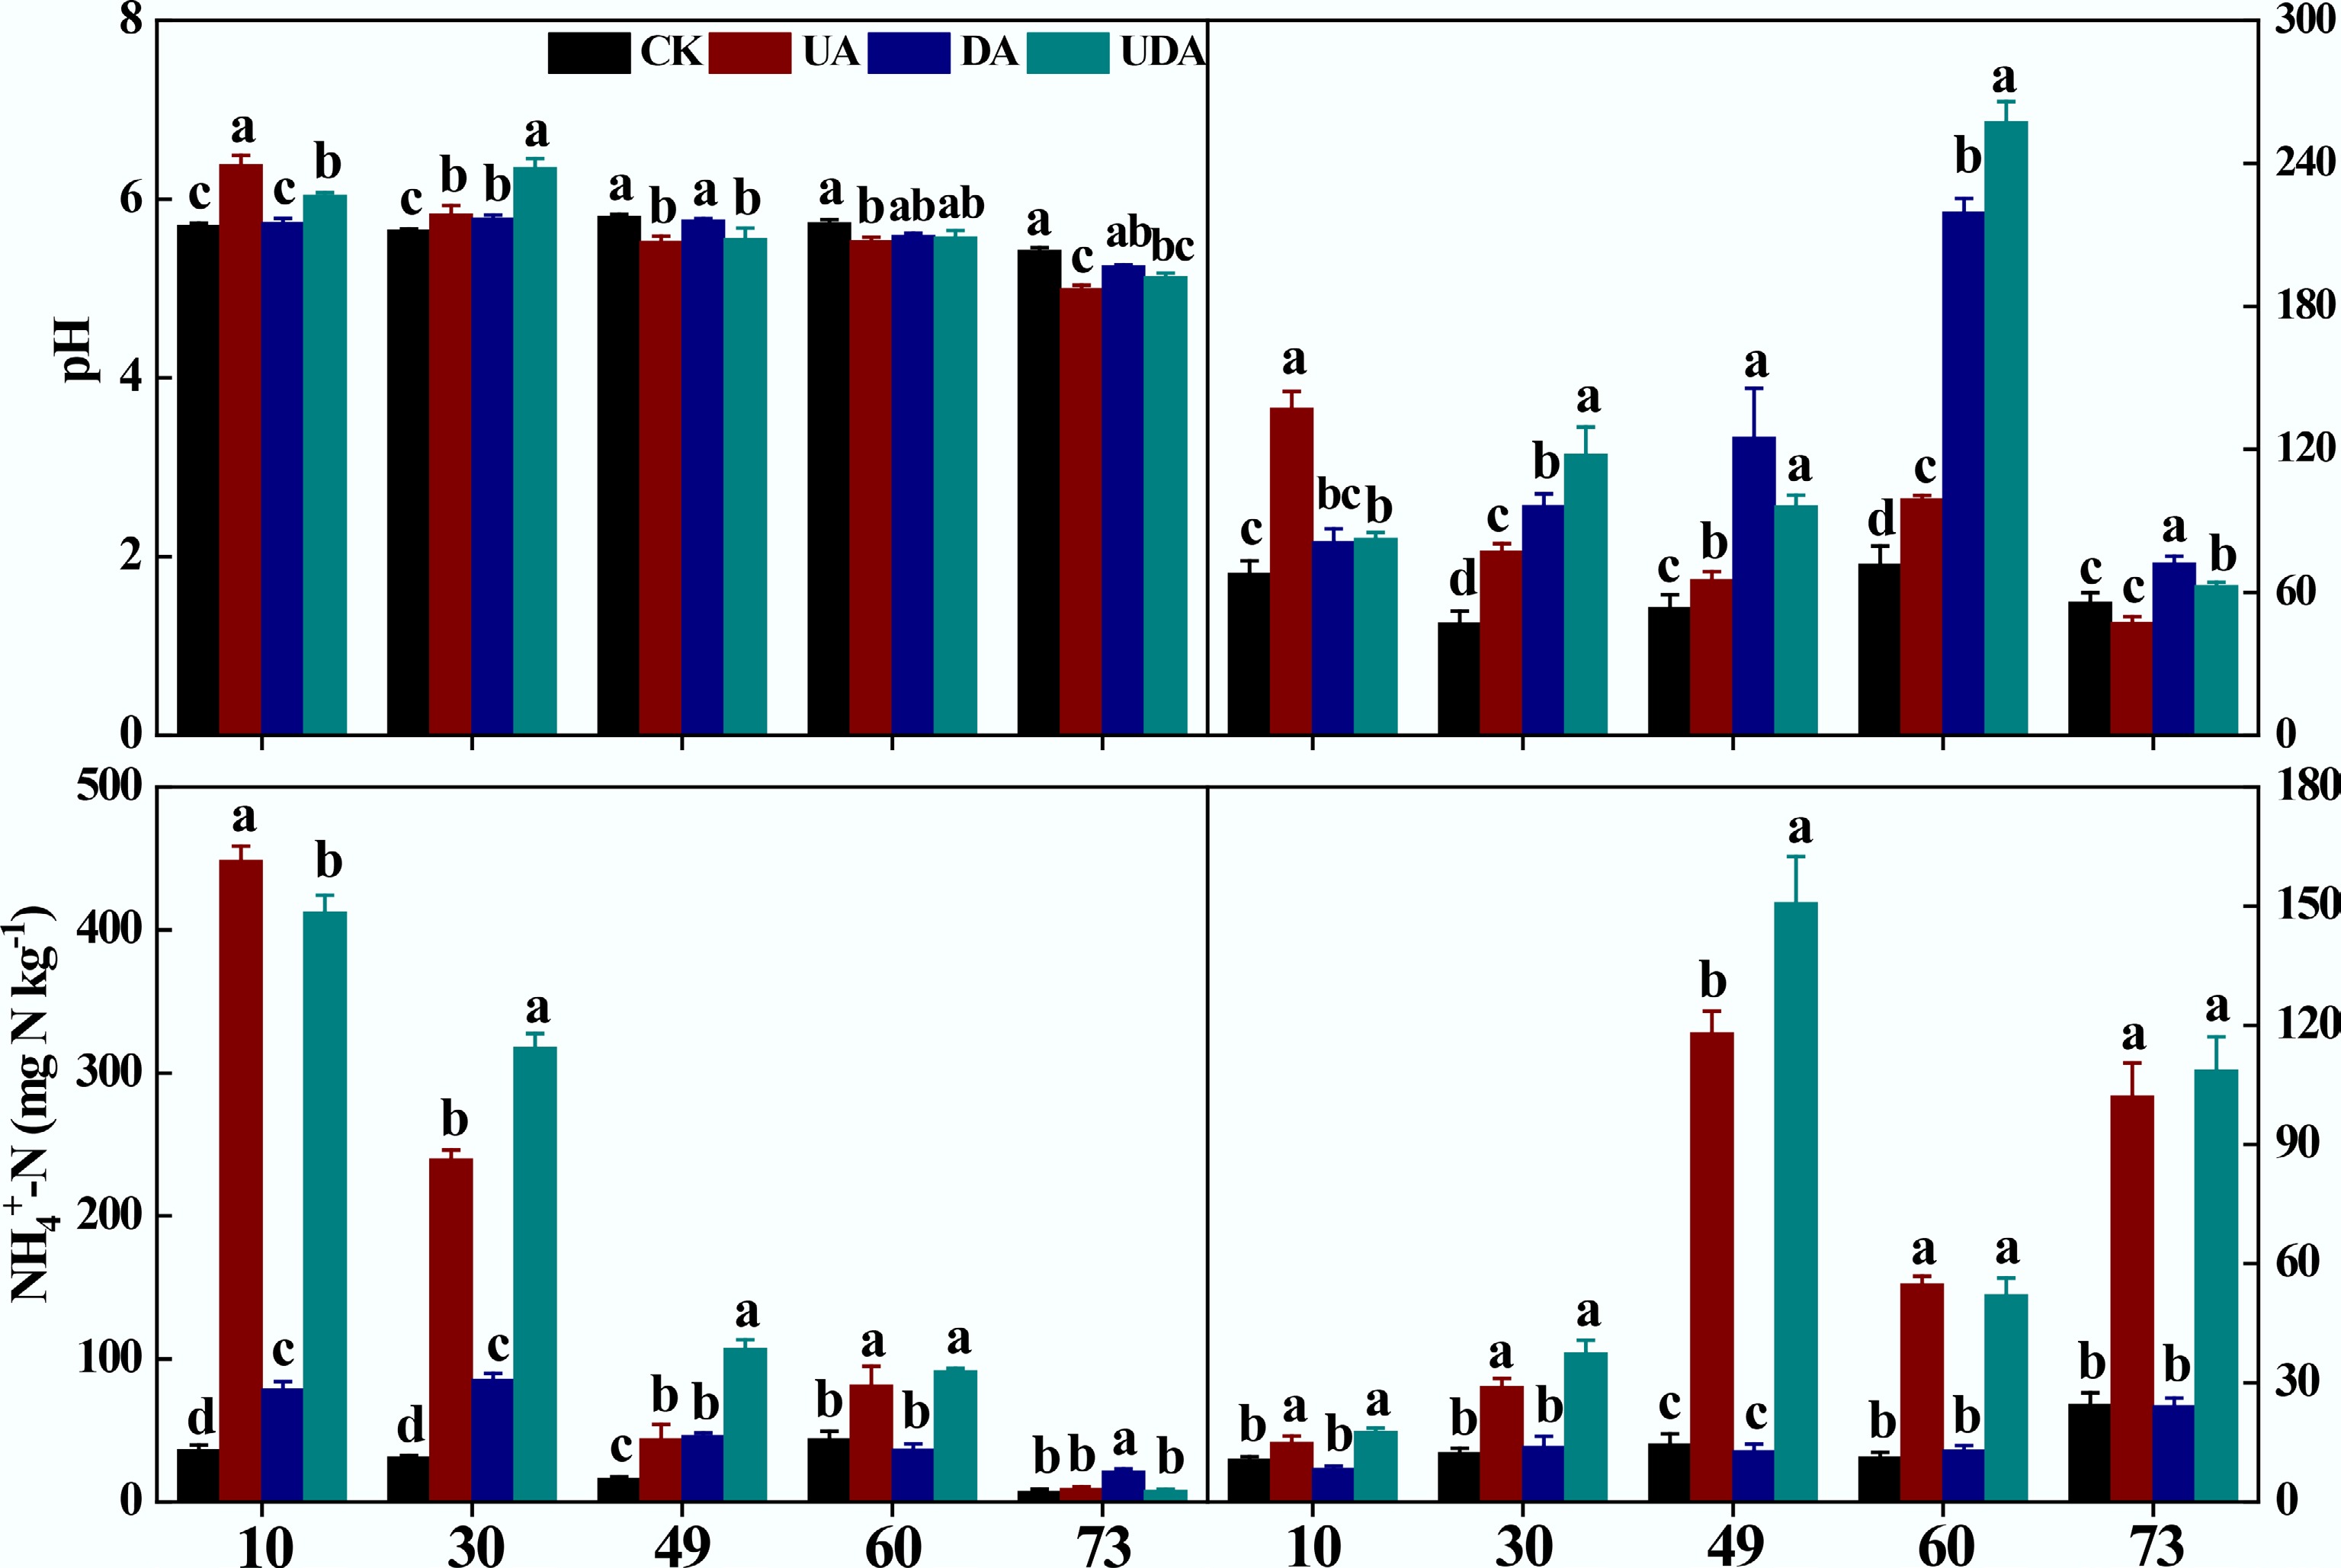
Figure 2.
Soil pH, DOC, NH4+-N, and NO3−-N concentration under different yak excreta application treatments. CK, without excretion application; UA, urine application; DA, dung application; UDA, combined urine and dung application; DOC, dissolved organic carbon; NH4+-N, ammonium nitrogen; NO3−-N, nitrate nitrogen. The error bars represent the standard errors of the mean (n = 4). The lowercase letters indicate significant differences among treatments at the same sampling time (p < 0.05).
-
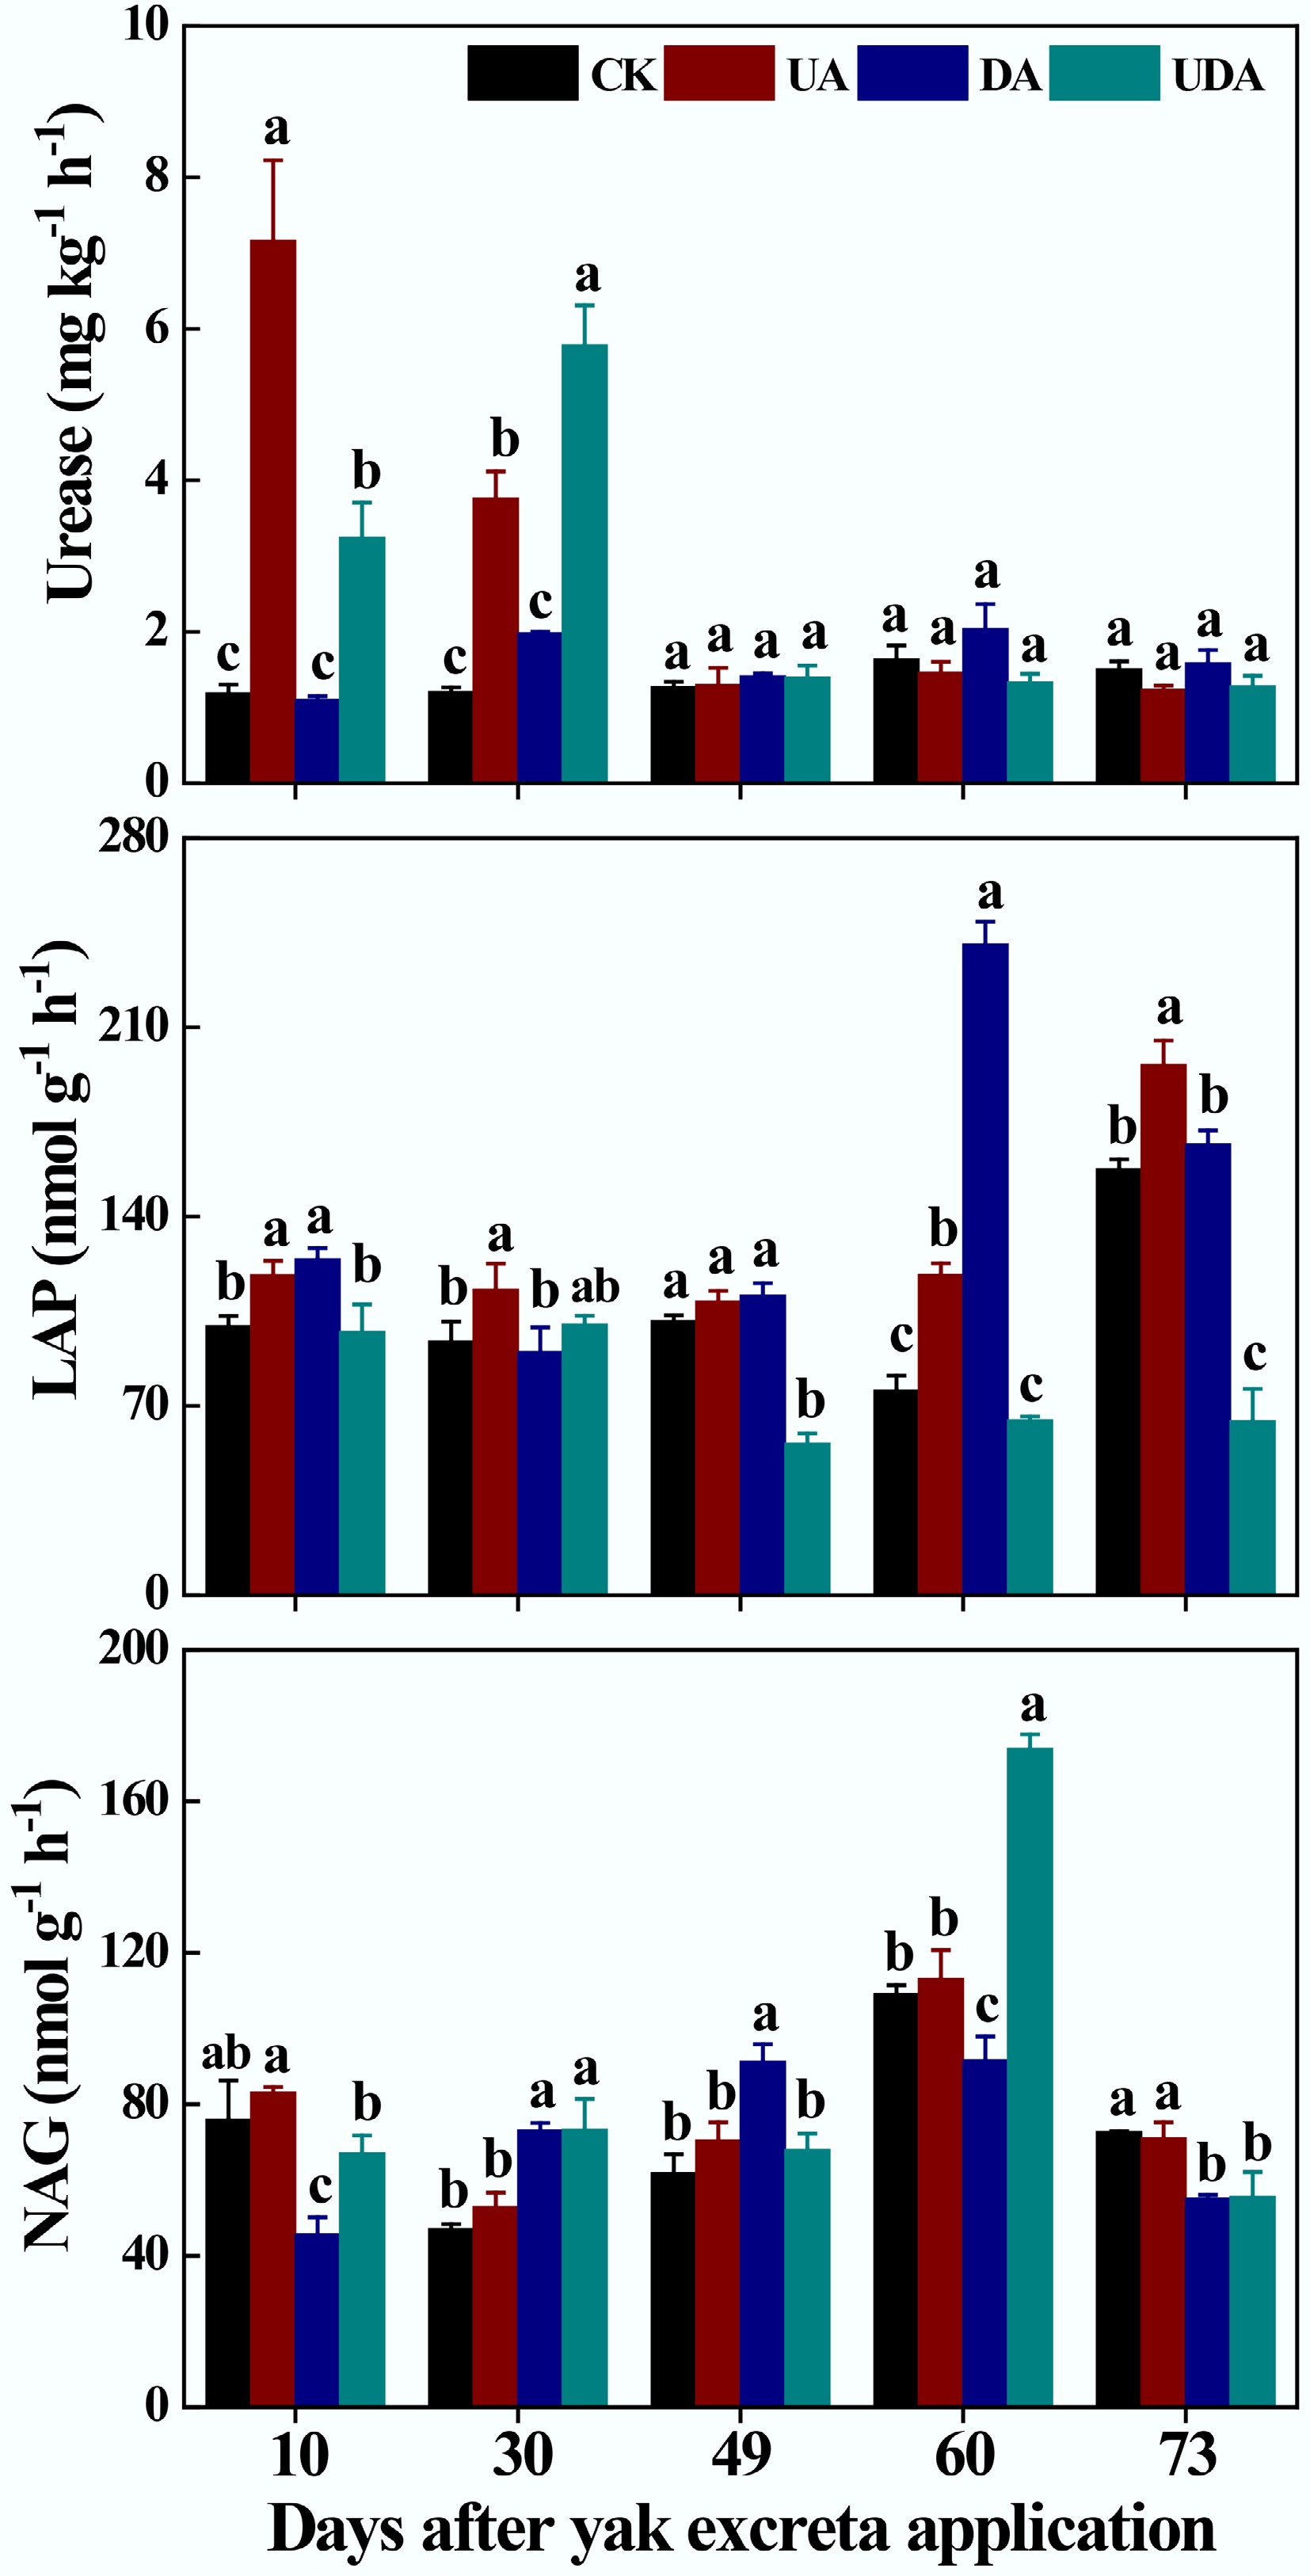
Figure 3.
Soil Urease, LAP and NAG under different yak excreta application treatments. CK, without excretion application; UA, urine application; DA, dung application; UDA, combined urine and dung application; LAP, leucine aminopeptidase; NAG, β-N-acetylglucosaminidase. The error bars represent the standard errors of the mean (n = 4). The lowercase letters indicate significant differences among treatments at the same sampling time (p < 0.05).
-
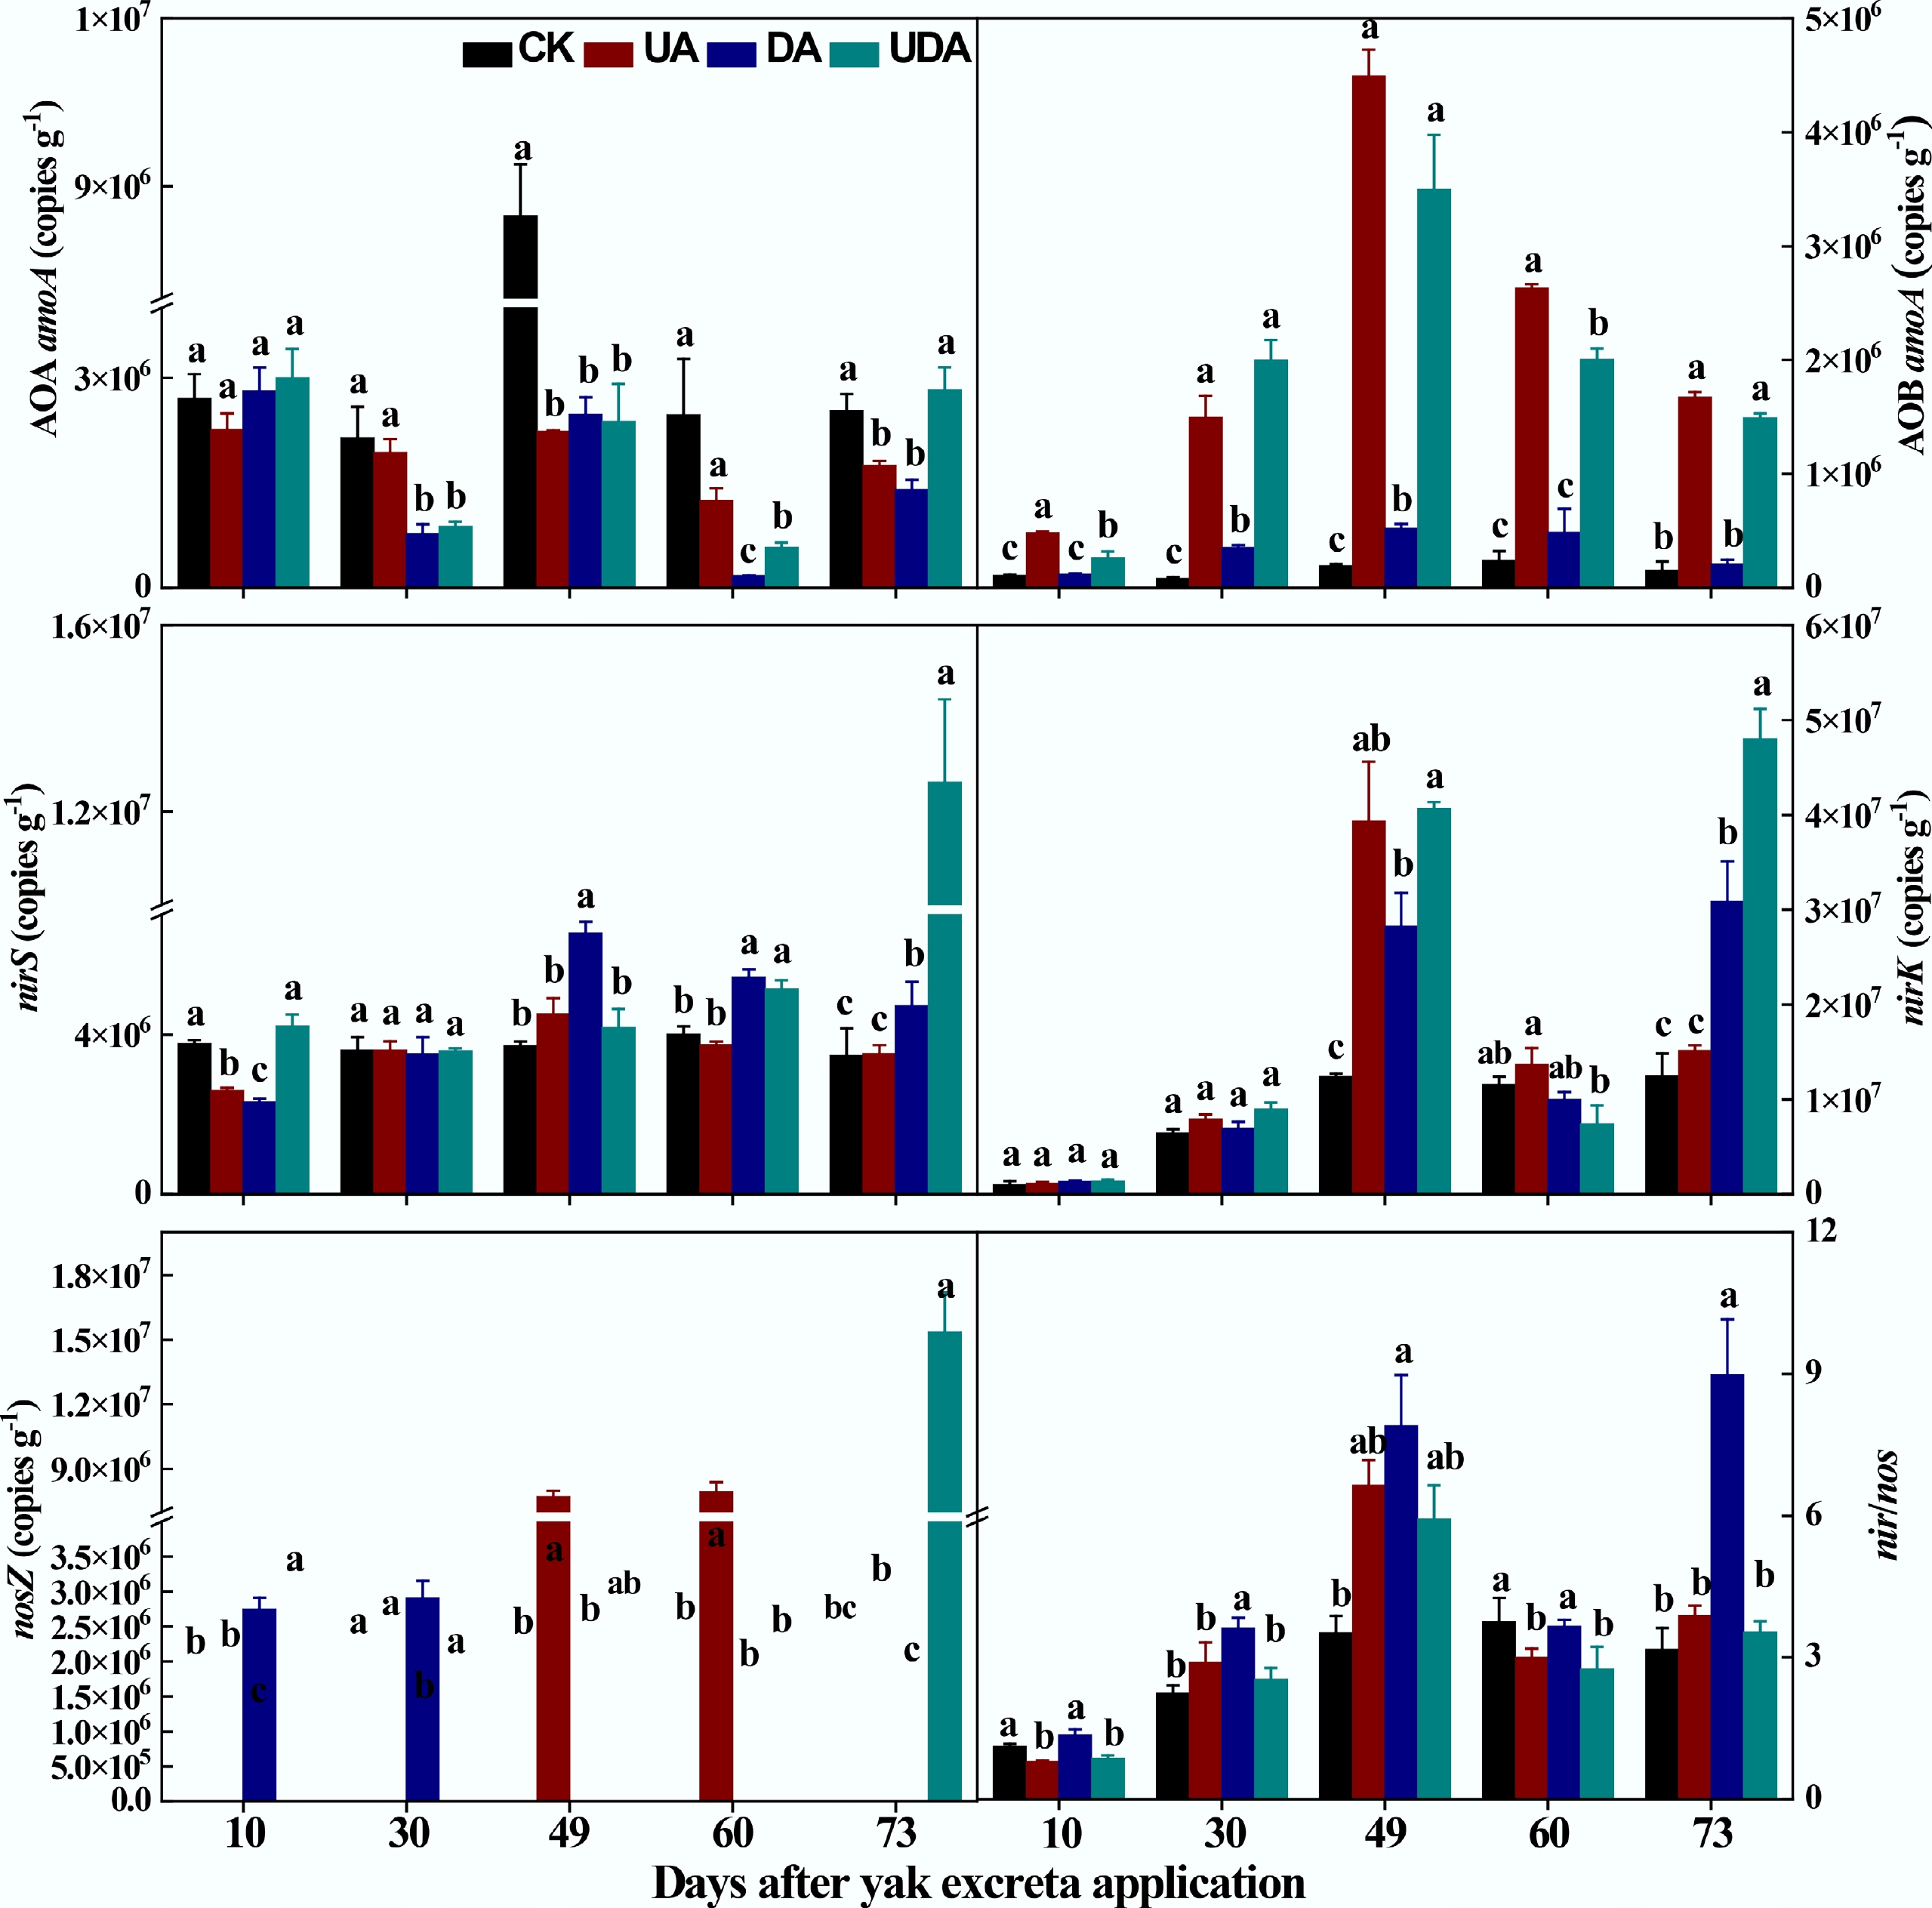
Figure 4.
The abundances of nitrifying functional gene (AOA amoA and AOB amoA), denitrifying functional gene (nirS, nirK and nosZ) and nir/nos under different yak excreta application treatments. CK, without excretion application; UA, urine application; DA, dung application; UDA, combined urine and dung application. The error bars represent the standard errors of the mean (n = 4). The lowercase letters indicate significant differences among treatments at the same sampling time (p < 0.05).
-
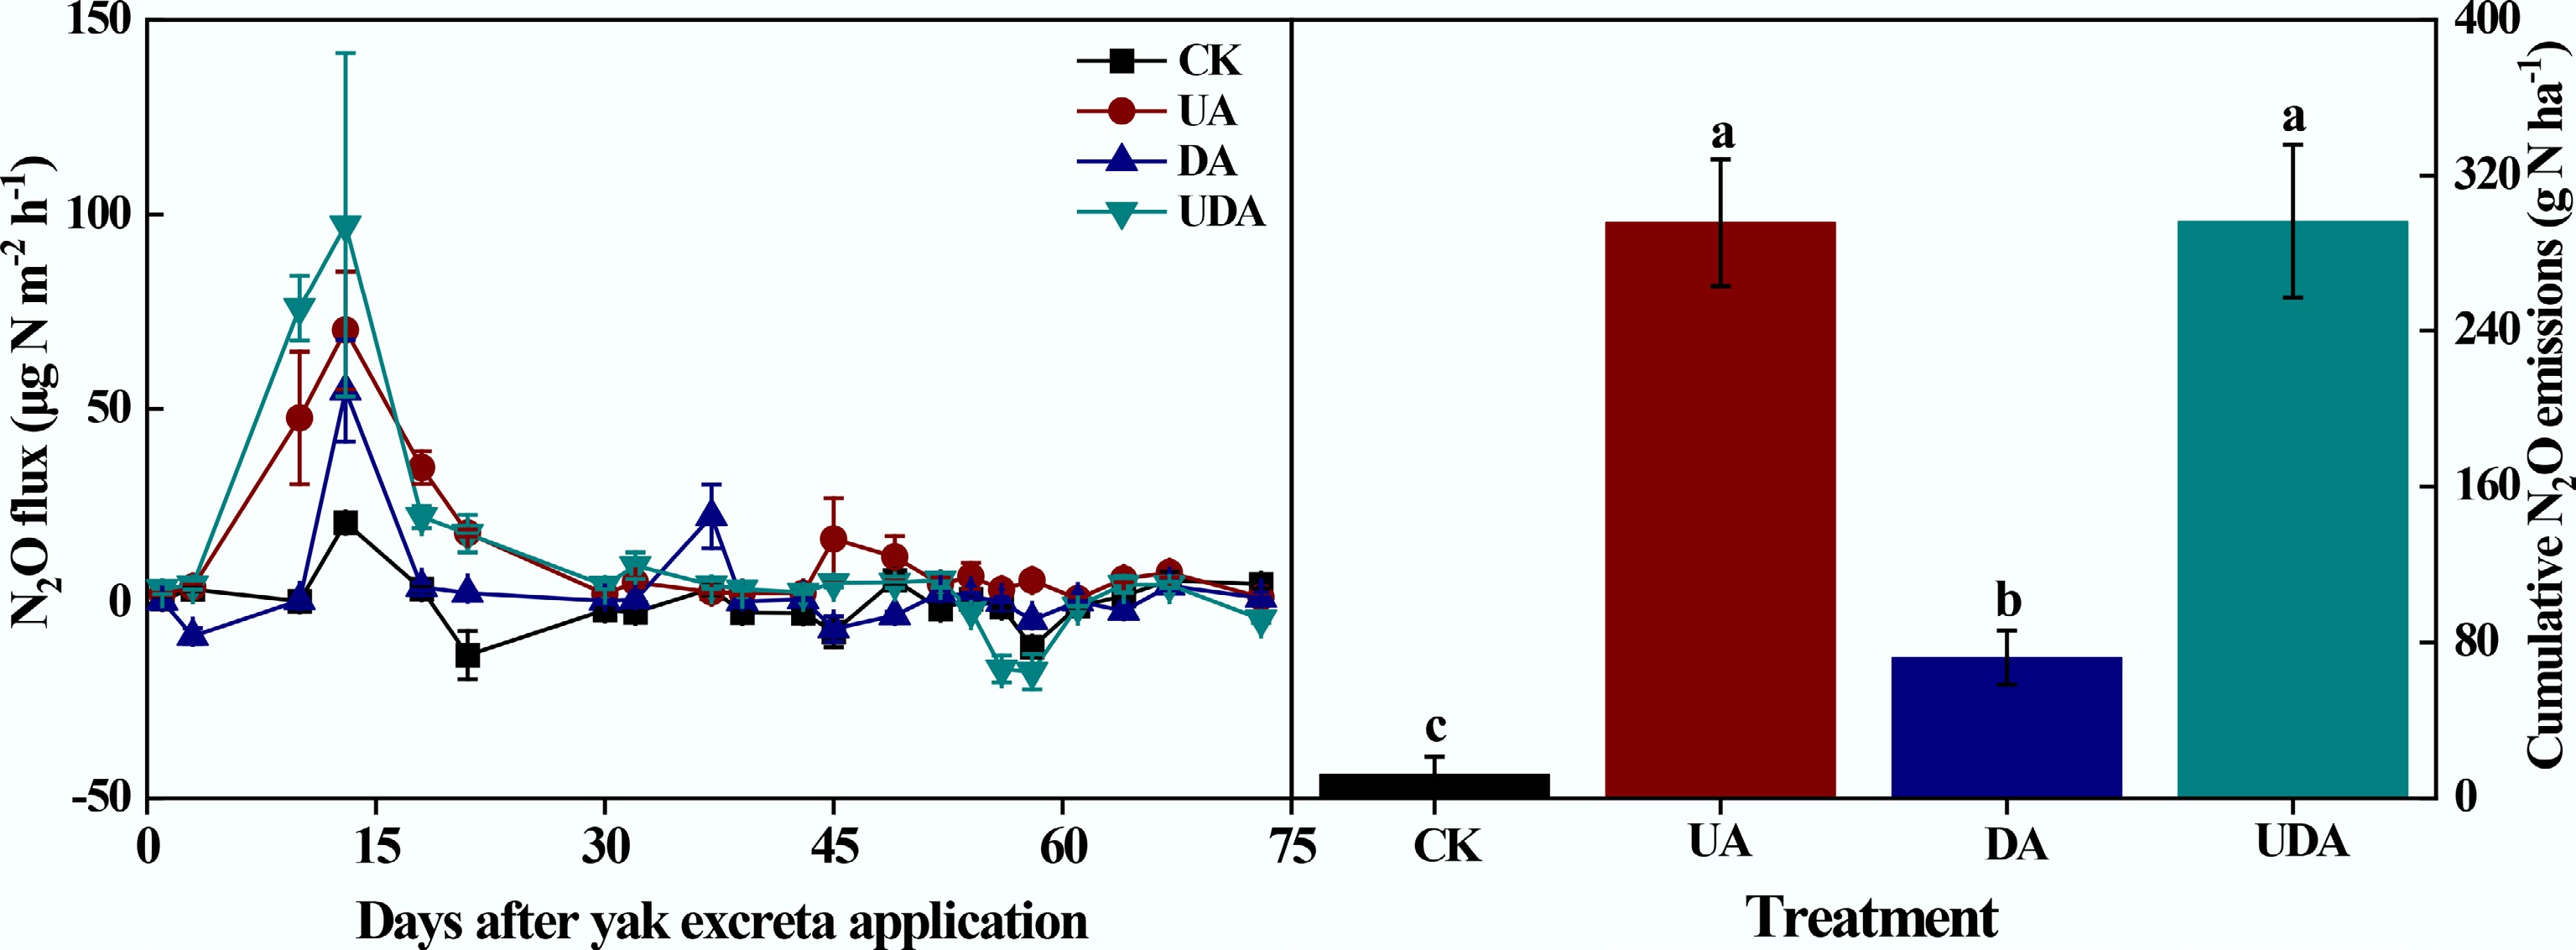
Figure 5.
Soil N2O fluxes and cumulative N2O emission under different yak excreta application treatments. CK, without excretion application; UA, urine application; DA, dung application; UDA, combined urine and dung application. The error bars represent the standard errors of the mean (n = 4). Different letters indicate significant differences between different treatments (p < 0.05).
-
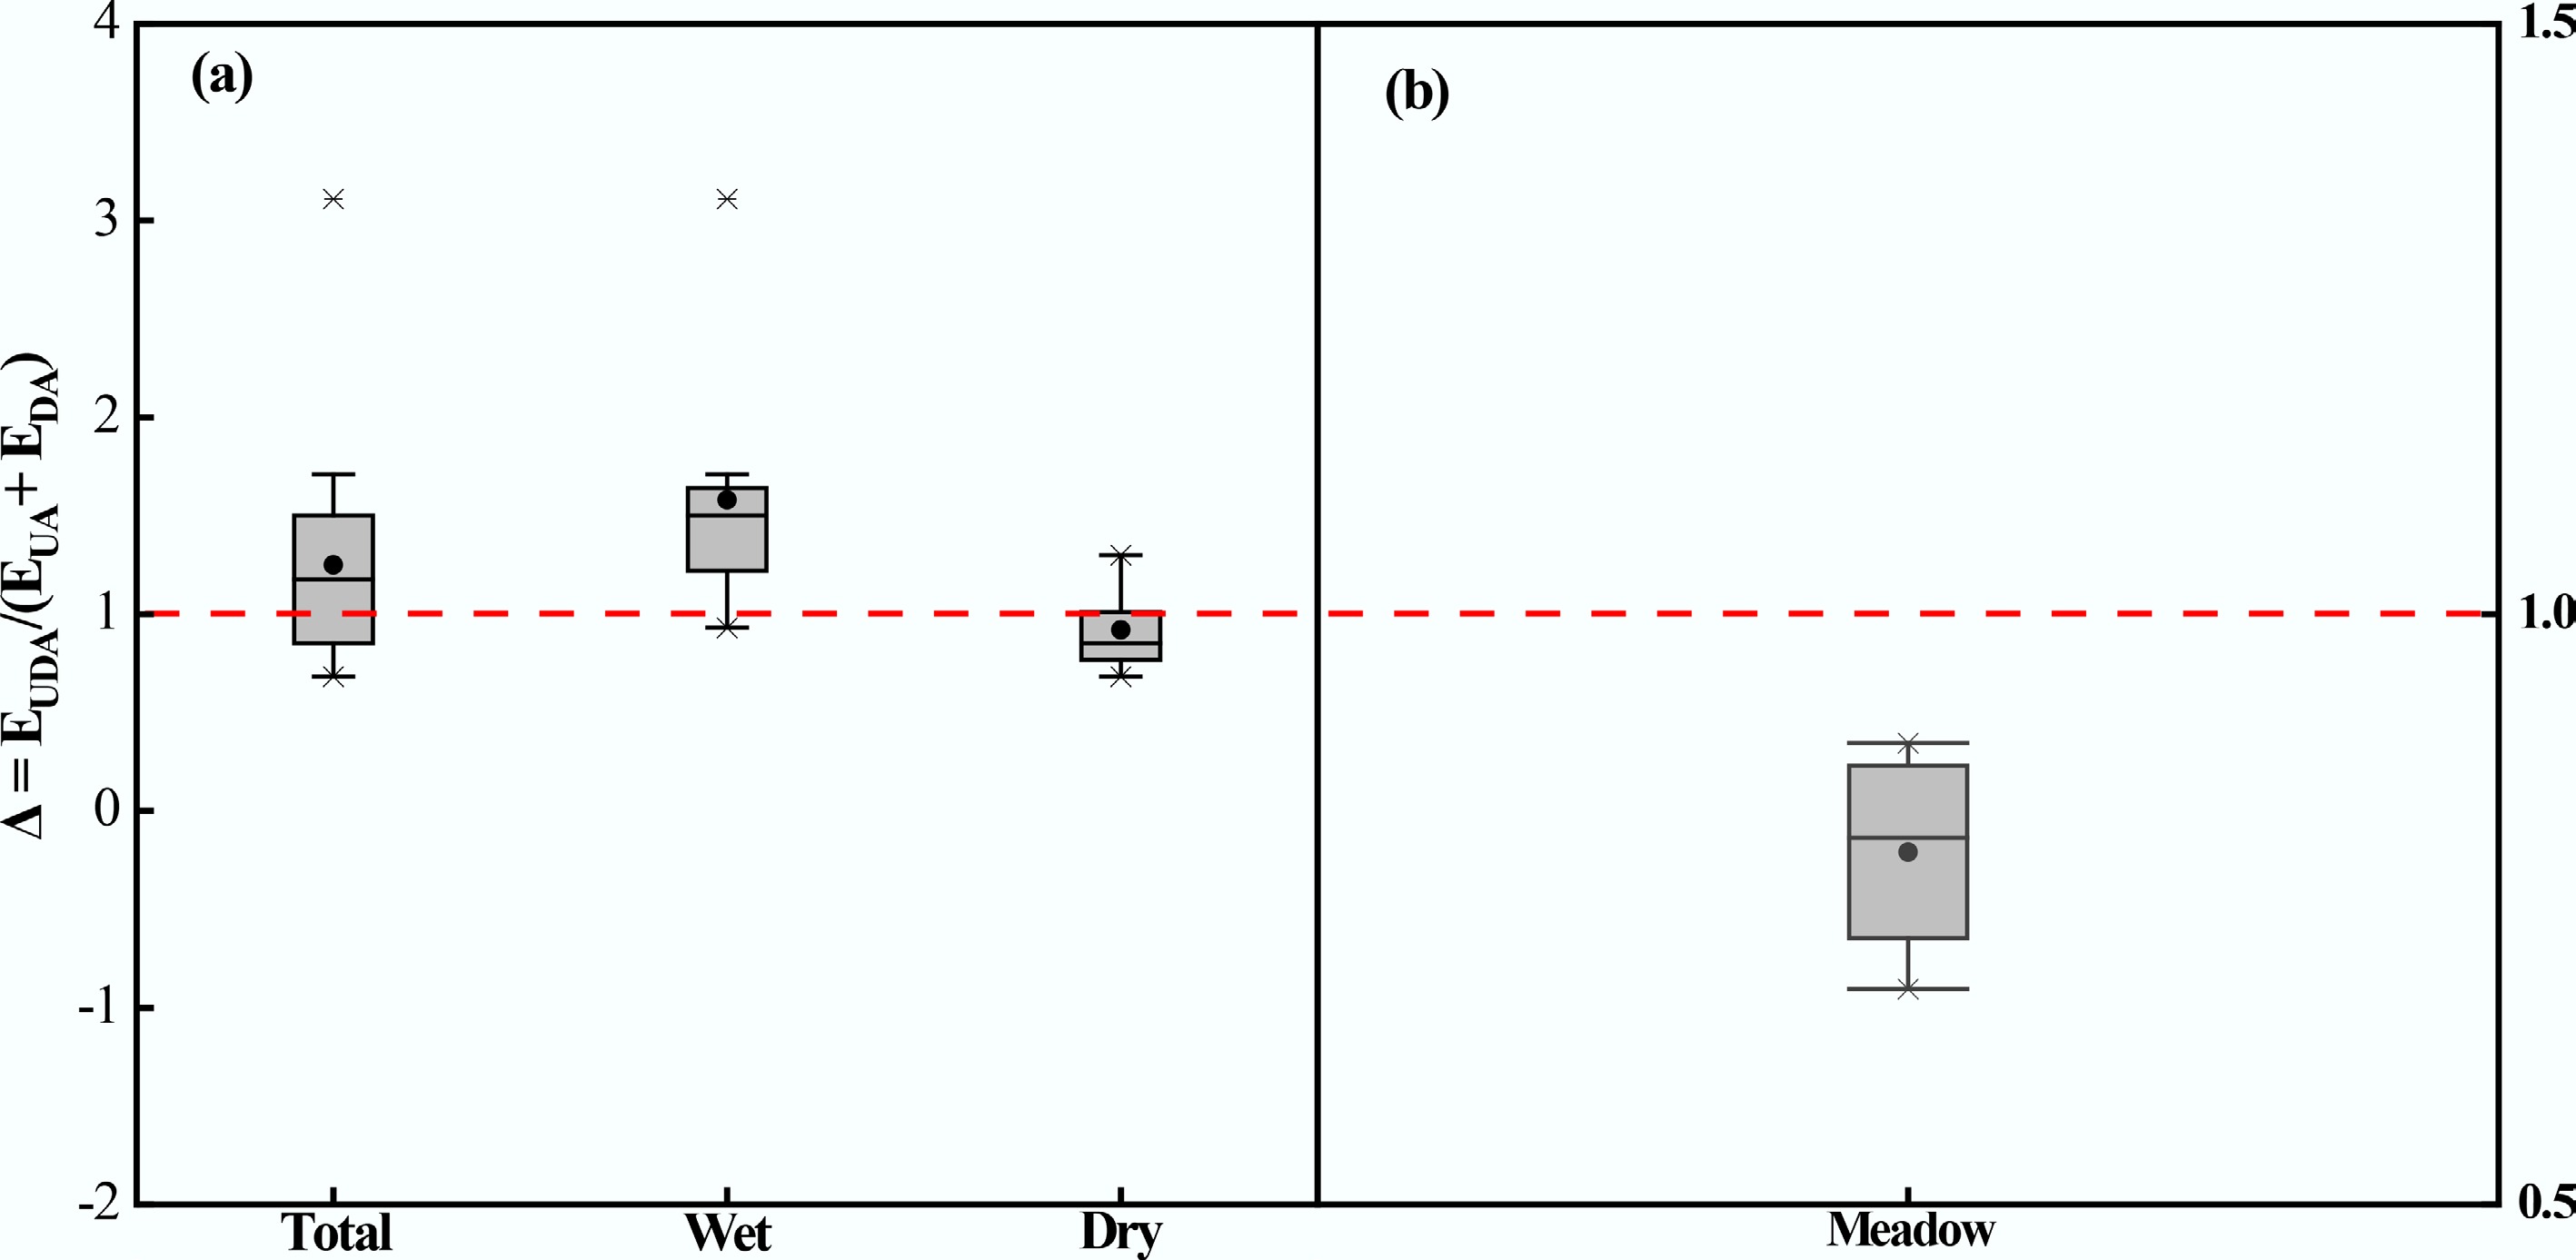
Figure 6.
Proportional change (Δ) in cumulative N2O emissions from the UDA treatment compared to the theoretical sum UA and DA of the individual treatments. UA, urine application; DA, dung application; UDA, combined urine and dung application; EUDA, cumulative N2O emissions from the UDA treatment; EUA + EDA, the theoretical sum of cumulative N2O emissions from the separate UA and DA treatments. The data set was compiled from (a) all studies (n = 18), including14 from previously published studies, and (b) 4 from the present study. If the relation is Δ = 1, then the effect of combining urine and dung on N2O emissions is additive. If Δ > 1, combining urine and dung results in a synergistic effect on N2O production, exceeding the sum of the individual emissions. Conversely, the Δ < 1, indicating that the effect of combining urine and dung excreta application on soil N2O emissions is antagonistic.
-
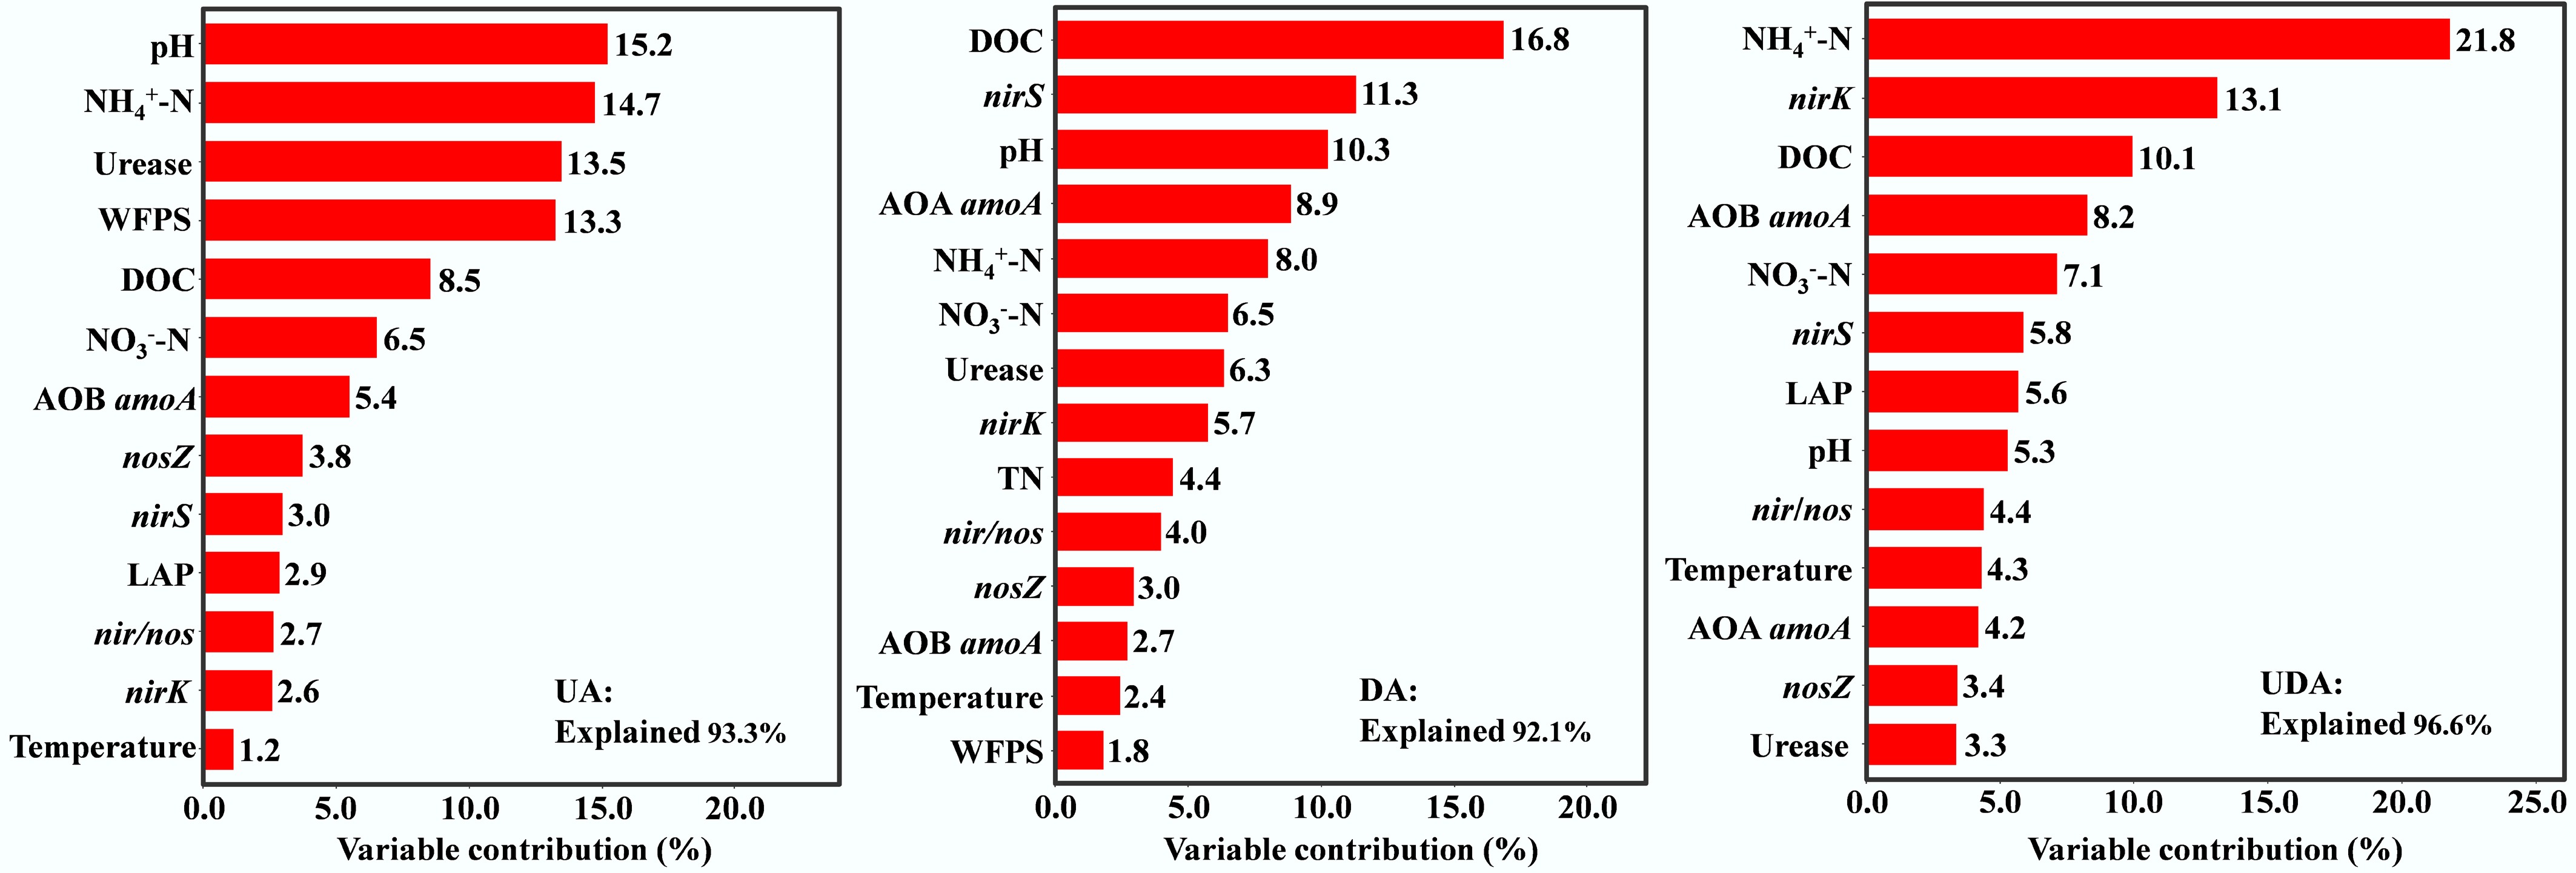
Figure 7.
Relative importance of soil properties on soil N2O emissions under different yak excreta application treatments. UA, urine application; DA, dung application; UDA, combined urine and dung application. N2O, soil N2O emissions; WFPS, water-filled pore space; DOC, dissolved organic carbon; NH4+-N, ammonium nitrogen; NO3−-N, nitrate nitrogen; NAG, β-N-acetylglucosaminidase activities; LAP, leucine aminopeptidase activities; nosZ, nosZ I gene abundance.
-
Parameters Excreta Soil Urine Dung pH (H2O) 7.32 ± 0.01 7.56 ± 0.01 5.71 ± 0.02 TC (g kg−1 or g L−1) 9.47 ± 0.10 394.43 ± 0.18 63.84 ± 3.90 TN (g kg−1 or g L−1) 9.00 ± 0.02 22.70 ± 0.06 7.07 ± 0.15 C/N 1.05 ± 0.01 17.38 ± 0.04 9.03 ± 0.19 NH4+-N (mg kg−1) -- − 36.33 ± 3.42 NO3−-N (mg kg−1) − − 10.68 ± 0.69 TC, total carbon; TN, total nitrogen. Table 1.
Properties of excreta and soil
-
Location Conditions CK UA DA UDA Δ Ref. UNCPBA, Argentina Dry 6.9 72.6 192.7 327.7 1.24 [9] UNCPBA, Argentina Wet 3.4 103.2 133.4 736.9 3.11 [9] Wexford, Ireland Wet 5.95 6.49 5.99 6.54 0.93 [55] ILRI, Kenya Wet 3.8 22.4 6 29.5 1.22 [27] ILRI, Kenya Wet 2.8 8.9 18.7 27.6 1.13 [27] ILRI, Kenya Dry 1.7 2.2 4.5 4.8 0.72 [27] ILRI, Kenya Wet −0.9 1.2 −0.9 2.1 1.43 [8] ILRI, Kenya Dry −2.9 −1.3 −1.5 1.1 1.3 [8] Kaptumo, Kenya Wet 14.84 143.41 14.84 225.83 1.64 [28] Kaptumo, Kenya Wet 21.43 215.93 19.78 351.10 1.71 [28] Kaptumo, Kenya Dry 11.48 40.98 27.87 55.74 0.81 [28] Kaptumo, Kenya Dry 18.03 91.8 19.67 113.12 1.01 [28] Wageningen, Netherlands Wet 0.29 0.91 0.51 1.59 1.55 [26] Hamilton, New Zealand Wet 1.72 6.74 7.18 17.47 1.50 [18] QP, China Dry 18.14 319.73 65.91 339.31 0.93 This study QP, China Dry 4.47 280.32 36.04 221.91 0.71 This study QP, China Dry 14.42 368.51 99.05 368.51 0.85 This study QP, China Dry 12.09 214.72 88.15 238.92 0.82 This study Table 2.
Cumulative nitrous oxide (N2O) emissions from different excreta treatments (CK, without excretion application; UA, urine application; DA, dung application; UDA, combined urine and dung application), and the proportional increase (Δ) of the combined treatments relative to the theoretical sum of the individual patches across different trials
Figures
(7)
Tables
(2)