


-
Grasslands cover approximately 40% of the Earth's land surface and support the livelihoods of billions of people through livestock production[1,2]. Grassland livestock production is associated with massive nitrogen (N) inputs through excreta (urine and dung) deposition, as approximately 75%–95% of the plant N ingested by grazing animals is returned to grazed grasslands as excreta[3]. Unfortunately, excreta patches on grazed grasslands have become hotspots for releasing nitrous oxide (N2O)[4], a powerful greenhouse gas and the dominant ozone-depleting substance in the atmosphere[5], due to the large surplus N remaining after plant uptake in excreta patches[3,6]. The N2O emissions from excreta patches of grazing animals account for approximately 40% of the total emissions from livestock production systems[7]. However, significant uncertainties remain in estimating N2O emissions from livestock urine and dung patches, particularly regarding their interactive effects[8,9]. Better understanding the effects of livestock excreta deposition on soil N2O emissions is thus crucial for accurately assessing N2O emissions from livestock production systems and establishing effective greenhouse gas mitigation strategies.
The deposition of excreta creates a substantial pulse of available substrates, predominantly labile N, which fuels microbial processes such as nitrification and denitrification, the primary sources of N2O in grazed soils[10,11]. Urine patches typically generate higher soil N2O emissions than dung patches, mainly due to the higher N availability[3,8,11]. Moreover, the transient increase in pH resulting from urea hydrolysis is a key factor driving higher N2O emissions from urine patches than from dung patches[12,13]. Specifically, the increase in soil pH favors the growth of ammonia-oxidizing bacteria (AOB)[14], thereby promoting nitrification-derived N2O emissions. Conversely, increased soil pH also stimulates N2O reductase activity, which could subsequently decrease N2O emissions, especially under high soil moisture content[15,16]. In addition, the higher organic carbon (C) concentration in the dung patches favors greater denitrification and subsequent N2O emissions compared to the urine patches[17,18]. Nonetheless, when high organic C availability coincides with high soil moisture content, complete denitrification may be promoted, facilitating further reduction of N2O to N2[15]. Consequently, much uncertainty remains regarding the comparative effects of urine and dung deposition on N2O emissions and associated processes in grazing grasslands, especially in regions experiencing fluctuating soil moisture.
Although urine and dung are often deposited separately during grazing, studying their co-application is critical for accurate greenhouse gas budgeting. Yaks exhibit strong gregarious behavior, spending significant time congregating around watering points and shelters, where excreta overlap is spatially concentrated[19,20]. In these livestock congregation areas, the overlapping deposition results in a significant N surplus. Theoretically, urine is rich in urea-N but lacks available C. When it coincides with the C supplied by dung, a positive interaction may occur, leading to enhanced N2O emissions from overlapping patches compared to single urine or dung patches[21,22]. Indeed, previous studies have reported synergistic or additive effects of combined urine and dung deposition on N2O emissions, where total emissions exceed or equal the theoretical sum of the separate effects[9,22−24]. However, the interaction between urine and dung is not always additive and appears highly dependent on environmental context. Soil moisture plays a pivotal role in regulating N2O dynamics by governing oxygen (O2) diffusion and the formation of anaerobic microsites[25]. Under relatively wet conditions, the combination of labile C from dung and N from urine can stimulate denitrification, often leading to synergistic emissions[18,26]. Conversely, under drier conditions, restricted anaerobicity may limit this stimulation, potentially resulting in non-additive or even antagonistic effects[27,28]. Hence, the inconsistent effects of combined urine and dung deposition on N2O emissions are primarily driven by soil moisture conditions, which determine the dominance of specific microbial processes.
The Qingzang Plateau (QP), characterized by a centuries-long history of livestock grazing, accounts for 60% of China's total grassland area[29]. It is home to approximately 13.3 million yaks (Bos grunniens) and represents an ideal region for studying the effects of excreta deposition on grassland ecosystems. As the dominant vegetation type, alpine meadows cover approximately 30% of the total alpine grassland area[30] and are particularly vulnerable to environmental changes. However, the degradation of alpine meadows driven by climate change and overgrazing impairs ecosystem function, thereby heightening their vulnerability to drought stress[31]. To investigate how alpine meadow soil N2O emissions respond to the separate and combined urine and dung deposition, a field experiment was conducted to investigate the effects of yak urine, dung, and their combined application on soil N2O emissions in a typical alpine meadow on the QP. We hypothesized that (1) the increment of soil N2O emission induced by urine deposition would be significantly higher than that induced by dung deposition, primarily due to higher soil N availability and pH following urine deposition; and (2) overlapping urine and dung patches would exhibit an additive effect, resulting in N2O emissions statistically equivalent to the theoretical sum of the emissions from the individual patches.
-
This experiment was conducted in an alpine meadow located at the Zoige Peatland and Global Change Research Station of the Chinese Academy of Sciences (32°58' N, 102°36' E, and 3,465 m a.s.l.), situated on the eastern edge of the Qingzang Plateau in Hongyuan County, Sichuan Province, China (Supplementary Fig. S1). The region is characterized by a semi-arid plateau monsoon climate, with a mean annual temperature of 3.3 °C and mean annual precipitation of 753 mm. The main vegetation type is a typical alpine meadow, with dominant species including Kobresia humilis and Koeleria cristata[32,33]. The soil type is classified as Haplic Kastanozems with a silt-to-loam texture. Further details regarding the study area are provided by Shen et al.[32].
This experiment was performed using a completely randomized block design, and four treatments, including urine application (UA), dung application (DA), combined urine and dung application (UDA), and the control without excreta addition (CK), were set up with four replicates (Supplementary Fig. S1). Regarding the urine treatment, due to the large volume required for the experiment and the potential for fresh urine to deteriorate rapidly during collection, artificial urine was prepared based on the formulations described by de Klein & van Logtestijn[34], and van Groenigen et al.[26]. The solution was prepared by dissolving the following reagents in deionized water: urea (17.7 g L−1), hippuric acid (7.4 g L−1), creatine (0.2 g L−1), allantoin (0.4 g L−1), uric acid (0.1 g L−1), and NH4Cl (0.9 g L−1). The total N concentration was 9.0 g N L−1, which is typical of yak urine. Additionally, all artificial urine solutions contained 14.20 g L−1 KHCO3 and 10.50 g L−1 KCl. The standard urine application rate was equivalent to 4.5 L m−2. Since the solution was synthesized immediately before application, no long-term storage was required. Additionally, yak dung was collected following the method described by Lin et al.[20]. Yaks were grazed in an area away from the study site during the day and enclosed at night. The following morning, 10 yaks were randomly selected, and fresh dung was collected from each animal using stainless-steel buckets. The collected dung samples were immediately frozen and stored until a sufficient quantity was obtained. Subsequently, the samples were thawed at ambient temperature, thoroughly mixed to ensure homogeneity, and then stored at low temperatures until field application.
In this study, a total of 96 plots (2 m × 2 m, with a 1 m buffer zone between adjacent plots) were employed for gas monitoring and five destructive soil samplings (Supplementary Fig. S1). Yak excretion behaviors were simulated, based on the reported behaviors of grazing yaks, in the experimental plots with similar plant growth statuses[32]. To simulate realistic field conditions based on typical excretion rates and behaviors of yaks[20], three excreta treatments were established, namely: (1) for UA, 1,000 mL of urine was applied to the soil surface to form a patch with a diameter of 40 cm; (2) for DA, 2,000 g of dung was applied to form a patch with a diameter of 22 cm and a height of approximately 4 cm; and (3) for UDA, 2,000 g of dung was added onto a urine patch. These specific application rates (volumes and masses) and patch diameters were determined based on the typical sizes of single urination and defecation events for yaks[20], reflecting the biological reality that dung and urine events deliver distinct N loads to the soil[19]. These simulations were performed at the center of the plot at the beginning of the experiment. The basic characteristics of yak dung, artificial urine, and soil, including TC and TN concentrations, pH, C/N, and inorganic N concentrations are presented in Table 1. The experiment was conducted during the growing season, from July to September 2020.
Table 1. Properties of excreta and soil
Parameters Excreta Soil Urine Dung pH (H2O) 7.32 ± 0.01 7.56 ± 0.01 5.71 ± 0.02 TC (g kg−1 or g L−1) 9.47 ± 0.10 394.43 ± 0.18 63.84 ± 3.90 TN (g kg−1 or g L−1) 9.00 ± 0.02 22.70 ± 0.06 7.07 ± 0.15 C/N 1.05 ± 0.01 17.38 ± 0.04 9.03 ± 0.19 NH4+-N (mg kg−1) -- − 36.33 ± 3.42 NO3−-N (mg kg−1) − − 10.68 ± 0.69 TC, total carbon; TN, total nitrogen. Determination of soil N2O emissions
-
Soil N2O fluxes were measured using a static chamber method. In each gas monitoring plot, a polyvinyl chloride (PVC) base (40 cm × 40 cm) was inserted 5 cm into the soil. Gas samples were collected using a PVC static chamber (40 cm × 40 cm × 30 cm height) once or twice weekly between 10:00 and 12:00 am from July 1 to September 12, 2020. During gas sampling, the static chamber lid was placed in the shallow groove in the base and sealed with water to ensure an airtight environment. After connecting a 100 mL syringe to the sampling port, the plunger was pumped back and forth a couple of times to ensure air mixing in the static chamber before gas collection. Gas samples were collected four times with a syringe at 10-min intervals after the chamber was closed, and the samples were directly injected into pre-evacuated gas-collection bags. The temperature within the chamber was also recorded. During gas sampling, soil temperature and soil moisture content at 5 cm depth within the vertical profile were measured simultaneously using a Soil Moisture and Temperature Monitor (M1X, G-Smart, Shenzhen Dezhan, Shenzhen, China)[35]. Daily air temperature and precipitation were monitored by an automatic meteorological system at the station. Given the critical role of soil moisture in determining the interaction between urine and dung (as detailed above), determining soil water-filled pore space (WFPS) is significant in this study as it quantifies the soil's aeration status and the potential for anaerobic microsite formation[25]. As a key indicator integrating these factors, WFPS determines the relative dominance of nitrification and denitrification processes[36]. In this study, WFPS was calculated following the method described by Jiang et al.[35].
The N2O concentrations in the samples were analyzed using a gas chromatograph equipped with an electron capture detector (Agilent® 7890B, Santa Clara, CA, USA). The N2O fluxes and cumulative N2O emissions were calculated using the following Eqs (1) and (2):
$ F=\dfrac{\Delta c}{\Delta t}\times \rho \times \dfrac{273}{273+T}\times \dfrac{V}{A}\times \dfrac{P}{{P}_{0}}\times n $ (1) where, F is gas flux (μg N m−2 h−1 for N2O), ρ is gas density under normal conditions (mg m−3), V is the volume of the static chamber (m3), A is the area that the static chamber covered, Δc/Δt is the change in gas concentration (Δc) during a certain time (Δt), T is air temperature (°C), P0 and P are the standard pressure (1,013 hPa) and the air pressure (hPa), respectively, and n is the coefficient for converting the mass of N2O to the mass of N (28/44 for N2O).
$ E=\sum \nolimits_{i=1}^{n}({F}_{i+1}+{F}_{i})/2\times ({t}_{i+1}+{t}_{i})\times 24 $ (2) where, E is cumulative N2O emission (g N ha−1), F is soil N2O flux (μg N m−2 h−1) determined at each sampling time; i is the sampling number, t is the sampling time.
Soil sampling and soil properties analyses
-
Soil samples were collected on days 10, 30, 49, 60, and 73 after the start of the experiment. For each plot, five soil cores (approximately 5 cm in diameter, 10 cm in depth) were extracted from the 0–10 cm soil layer using the 'S'-shaped sampling method and thoroughly mixed to form a composite sample. Visible roots, stones, soil fauna, and plant residues were removed, and the soil was sieved through a 2 mm mesh. The fresh soil from each treatment was then divided into three subsamples for analysis. One subsample was immediately analyzed for dissolved organic C (DOC), ammonium N (NH4+-N), nitrate N (NO3−-N), and soil enzyme activities. The second subsample was air-dried at room temperature for soil pH determination. The third subsample was stored at −80 °C for DNA extraction.
Soil pH was measured at a 1:2.5 (w/v) ratio using a pH meter (Mettler Toledo Seven Compact S210, Zurich, Switzerland). Soil DOC concentration was extracted with 0.5 M K2SO4 (soil : solution ratio of 1:5), and determined using a TOC/N analyzer (Analytik Jena Multi N/C3100, Jena, Germany). Soil mineral N concentrations were determined by extracting fresh soil with 2 M KCl (1:5, w/v) on a shaker at 200 rpm for 1 h at 25 °C. The extract was then filtered through Whatman filter papers (Whatman® No. 42, Buckinghamshire, UK). Soil NH4+-N and NO3−-N concentrations were determined with a UV spectrophotometer (UV-2600, Shimadzu, Kyoto, Japan) using the indophenol blue colorimetric and the two-wavelength (220 and 275 nm) methods, respectively.
Soil enzyme activity assays
-
We measured the activities of three soil enzymes: urease, leucine aminopeptidase (LAP), and β-N-acetylglucosaminidase (NAG). These specific N-acquiring enzymes were selected as they represent distinct pathways of N transformation, providing a comprehensive view of soil N cycling dynamics in response to urine and dung application. Urease catalyzes the hydrolysis of urea into ammonia, representing the rapid turnover of labile organic N[37]. Soil LAP facilitates the degradation of proteins and peptides into amino acids, reflecting the microbial capacity to acquire N from labile protein sources[38]. Soil NAG plays a crucial role in the mineralization of chitin and other recalcitrant structural N compounds, indicating the breakdown of more stable organic N pools[39]. Soil urease activity was analyzed using the ammonium release method[40]. Briefly, 5.0 g of fresh soil was placed in a 50 mL Erlenmeyer flask and mixed with 1 mL of urea solution (0.2 mg mL−1). All flasks were covered with stoppers and incubated in the dark at 37 °C for 2 h. After incubation, 35 mL of a 2.5 M KCl-Ag2SO4 solution was added to the flasks, which were sealed with stoppers, shaken for 30 min, and filtered through a suction filter. Subsequently, the NH4+-N concentration in the filtrate was determined using the indophenol blue colorimetric method, and the urease activity was expressed as mg kg−1 h−1. Besides, soil LAP and NAG enzyme activity assays were performed according to the method described by Zheng et al.[41]. Units for the activities of LAP and NAG were expressed as nmol g−1 h−1.
Soil nitrifying and denitrifying enzyme activities (NEA and DEA) were measured using the soil slurry incubation method[42] and the acetylene-inhibition method[43], respectively. The detailed procedures were provided in Zhang et al.[44].
Soil DNA extraction and real-time quantitative PCR
-
We extracted total DNA from 0.5 g of freeze-dried soil samples using the PowerSoil Pro DNA Isolation Kit (MoBio, Qiagen, Germany). The quality of DNA extraction was evaluated by 0.8% agarose gel electrophoresis, and its concentration was assessed using a UV spectrophotometer (NanoDrop One, Thermo Fisher Scientific, MA, USA).
To investigate the dynamics of soil N2O-related functional genes, a real-time quantitative PCR (qPCR) system (ABI QuantStudio3, Thermo Fisher Scientific, MA, USA) was used to analyze the abundances of nitrifying functional genes, specifically AOA amoA and AOB amoA, along with denitrifying functional genes such as nirS, nirK, and nosZ. Each 20 μL qPCR reaction mixture contained 1 μL of template DNA, 0.2 μL of each 50 mM primer, 8.6 μL of deionized distilled water (ddH2O), and 10 μL of SYBR premix master mix (Takara, Shiga, Japan). Details regarding the amplification primers and thermal conditions were the same as described by Zhang et al.[44]. The copy numbers of the target genes were determined using a standard curve generated from purified plasmid DNA. The PCR amplification efficiencies ranged from 0.86 to 1.01, with R2 values of 0.993–0.998.
Statistical analyses
-
To determine whether the combined application of yak urine and dung results in a synergistic or antagonistic effect on N2O emissions, the proportional change (Δ) in cumulative N2O emissions was calculated as follows: Δ = EUDA/(EUA + EDA). Here, EUDA is the observed emission from overlapping urine and dung patches, and EUA + EDA represents the theoretical sum of emissions from individual urine and dung patches. If Δ = 1, the effect of combined urine and dung application on N2O emissions is additive. If Δ > 1, the combination of urine and dung application results in a synergistic effect on N2O production, exceeding the sum of the individual emissions. Conversely, if Δ < 1, it indicates an antagonistic effect[9].
Before conducting statistical analyses, the data was assessed for normal distribution using the Shapiro-Wilk test, and evaluated for homogeneity of variance using Levene's test. Statistically significant differences among treatments were determined at the 5% confidence level using one-way ANOVA and the least significant difference (LSD) test. Differences were considered statistically significant at p < 0.05. Pearson's correlation coefficients were used to measure the linear relationship between soil abiotic factors (soil temperature, WFPS, pH, DOC, NH4+-N, and NO3−-N concentrations), soil enzyme activities (Urease, NAG, and LAP), soil N-cycling functional gene (AOA amoA, AOB amoA, nirS, nirK, and nosZ) abundances, NEA, DEA, and soil N2O emissions. Furthermore, the hierarchical partitioning method was employed to assess the variable's contribution using the 'rdacca.hp' package in R (version 4.1.1) to calculate the relative influence of soil parameters[45]. The importance of the soil parameters was expressed as a percentage of the mean square error (MSE). Higher MSE% values suggest greater importance of the parameters[46].
-
The air temperature ranged from 6.80 to 15.60 °C, and total precipitation was 384.60 mm during the experimental period (Fig. 1). Soil temperature varied from 9.93 to 30.6 °C, with no obvious differences among treatments (Fig. 1). In contrast, the DA treatment consistently maintained a higher (p < 0.05) WFPS, ranging from 32.6% to 41.6%, compared to the UA treatment, which exhibited a range of 23.1% to 38.7%. Meanwhile, the WFPS in the UDA treatment ranged from 27.2% to 41.0% and did not differ significantly from those in the UA and DA treatments (Fig. 1). Overall, this trial can be classified as a dry condition, with the WFPS consistently remaining below 50%[26].
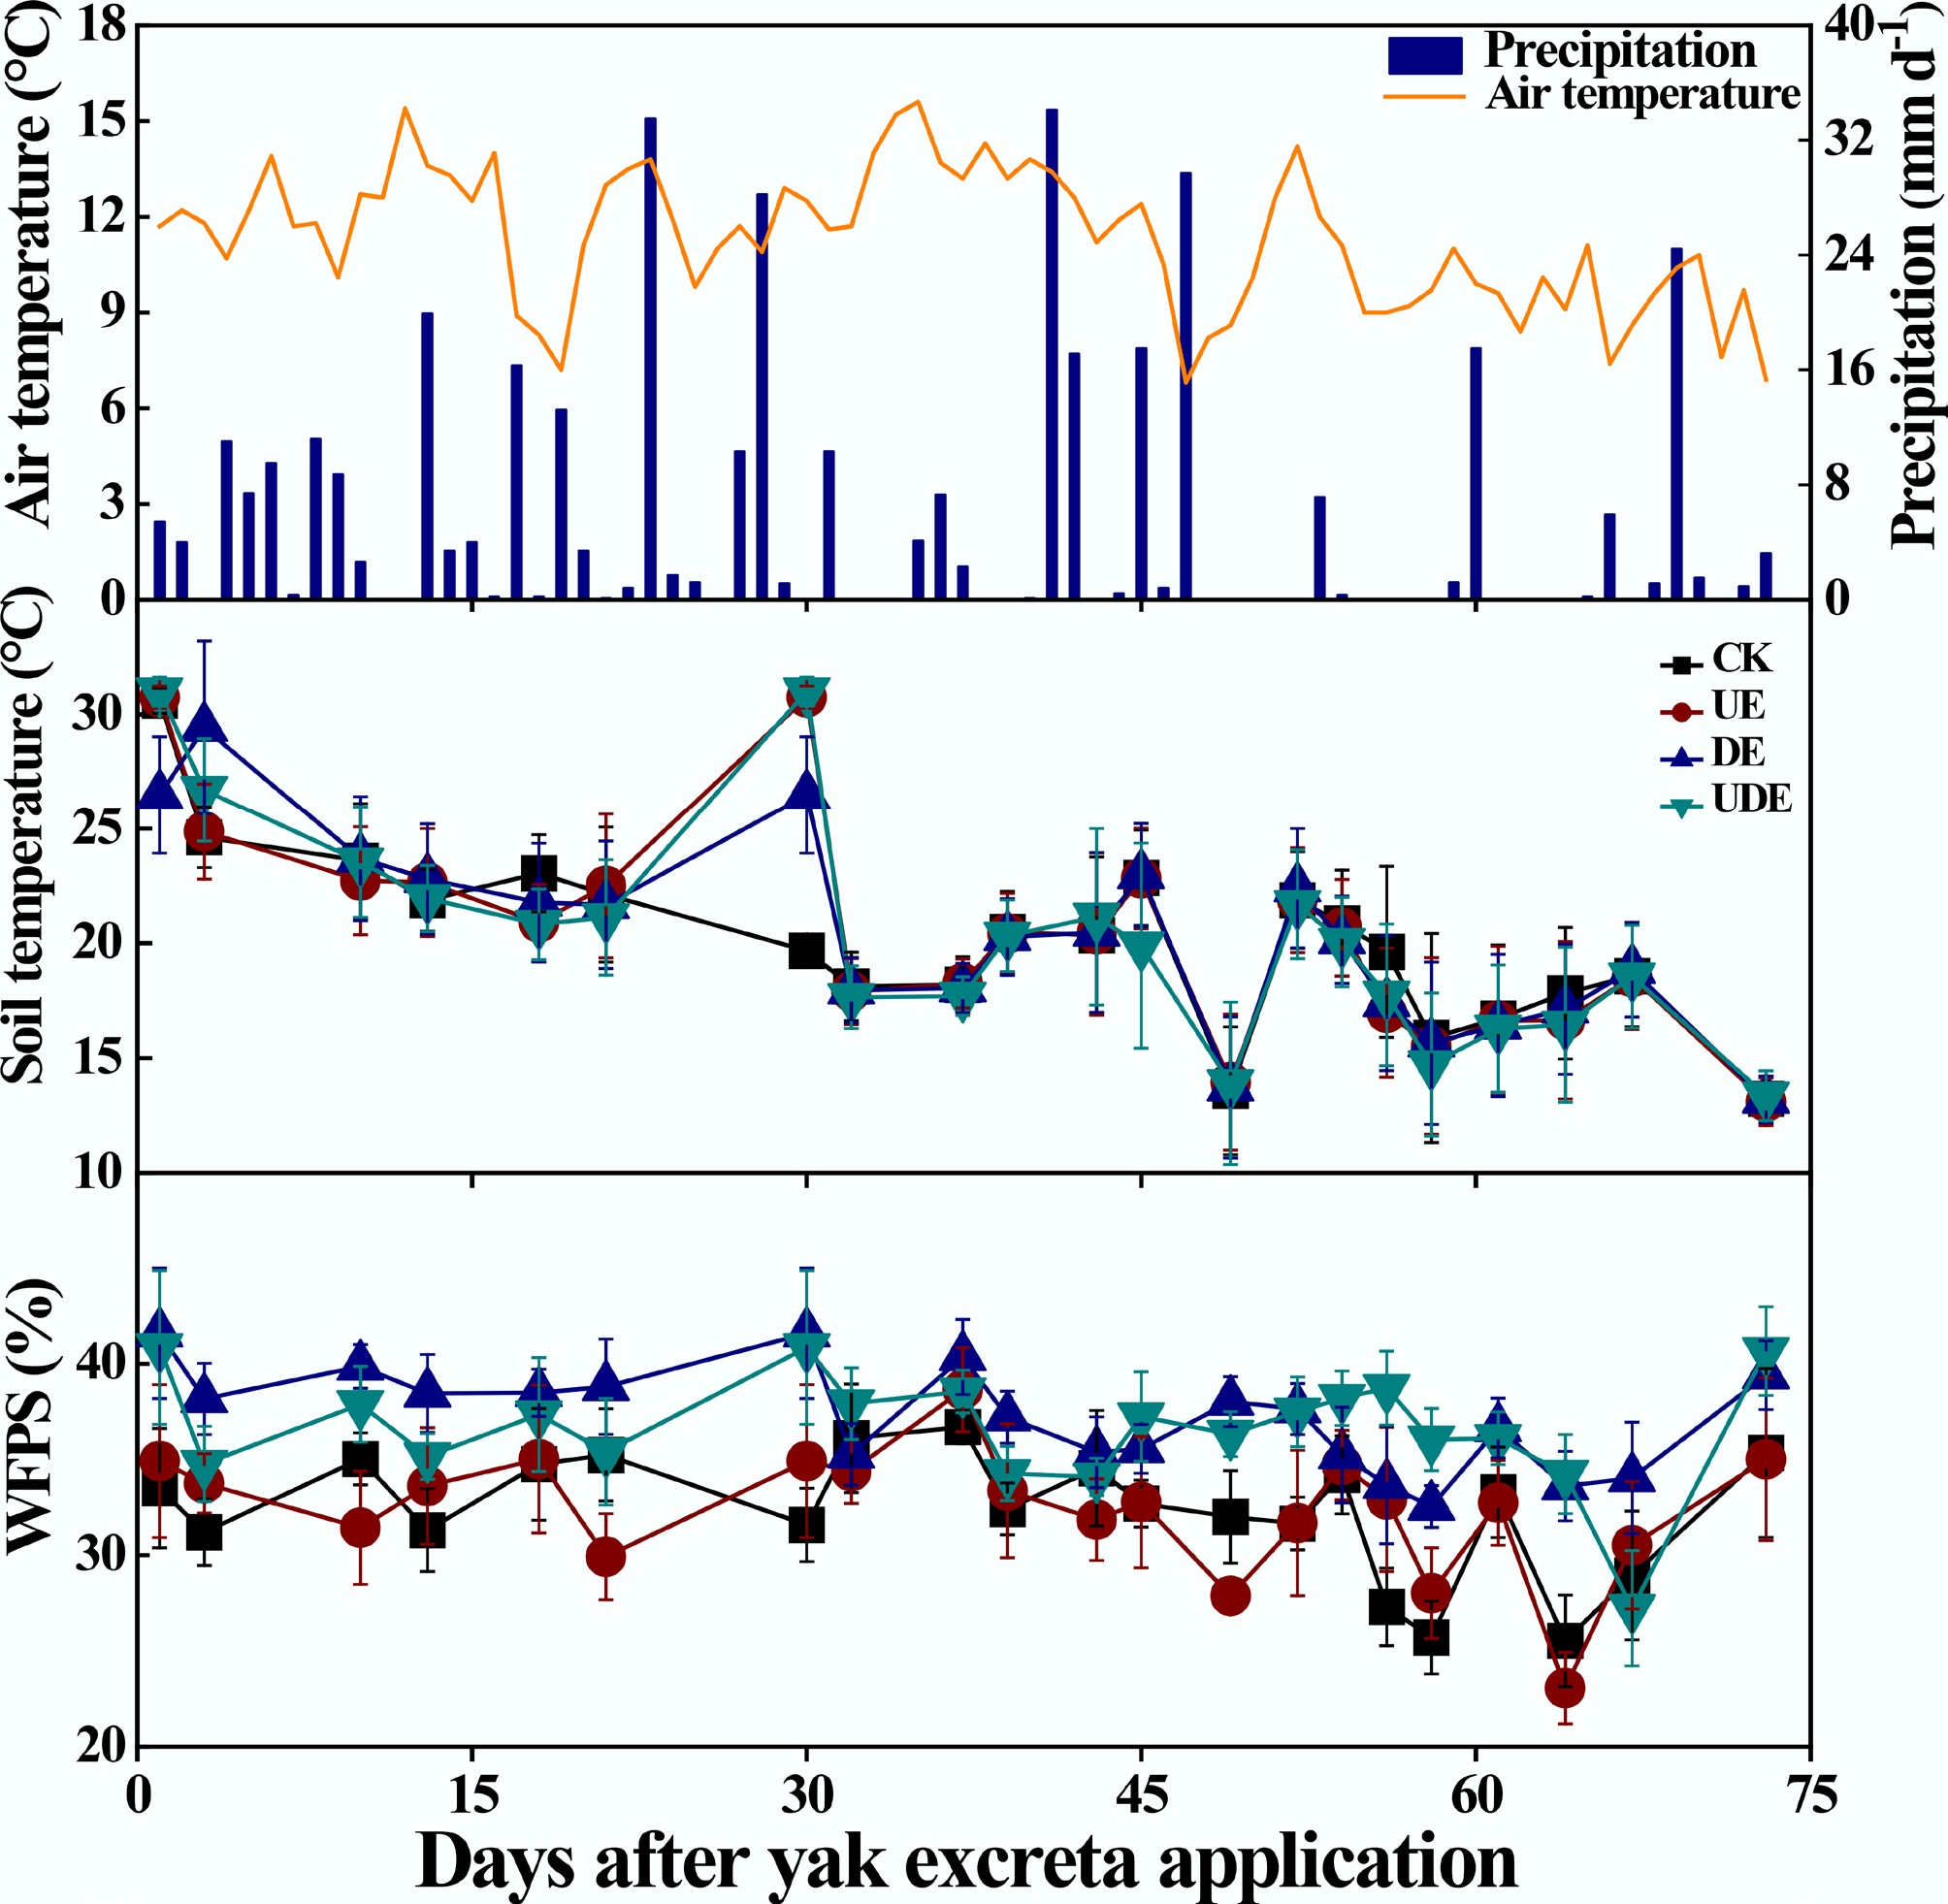
Figure 1.
Variation in daily air temperature and precipitation, and the effects of urine and dung excreta application on soil temperature at 5 cm depth and water-filled pore space (WFPS) from July 2, 2020 to September 12, 2020. CK, without excretion application; UA, urine application; DA, dung application; UDA, combined urine and dung application. The error bars represent the standard errors of the mean (n = 4).
Excreta application significantly affected soil pH, DOC, and inorganic N concentrations (Fig. 2). Soil pH was significantly higher in the UA treatment than in the DE treatment on day 10. Still, this pattern reversed on days 49 and 73. On day 30, soil pH in the UDA treatment significantly exceeded that in both the UA and DA treatments (Fig. 2). Soil DOC concentration in the UA treatment was significantly higher than that in the DA treatment on all sampling days except for day 10. It was significantly higher in the UDA treatment relative to the UA and DA treatments on days 30 and 60 (Fig. 2). On days 10, 30, and 60, soil NH4+-N concentration was significantly higher in the UE treatment than in the DA treatment. Furthermore, the UDA treatment exhibited significantly higher NH4+-N concentrations than the UA and DA treatments on days 30 and 49 (Fig. 2). Throughout the experiment, soil NO3−-N concentrations in both the UA and UDA treatments were significantly higher than those in the DA treatment (Fig. 2).
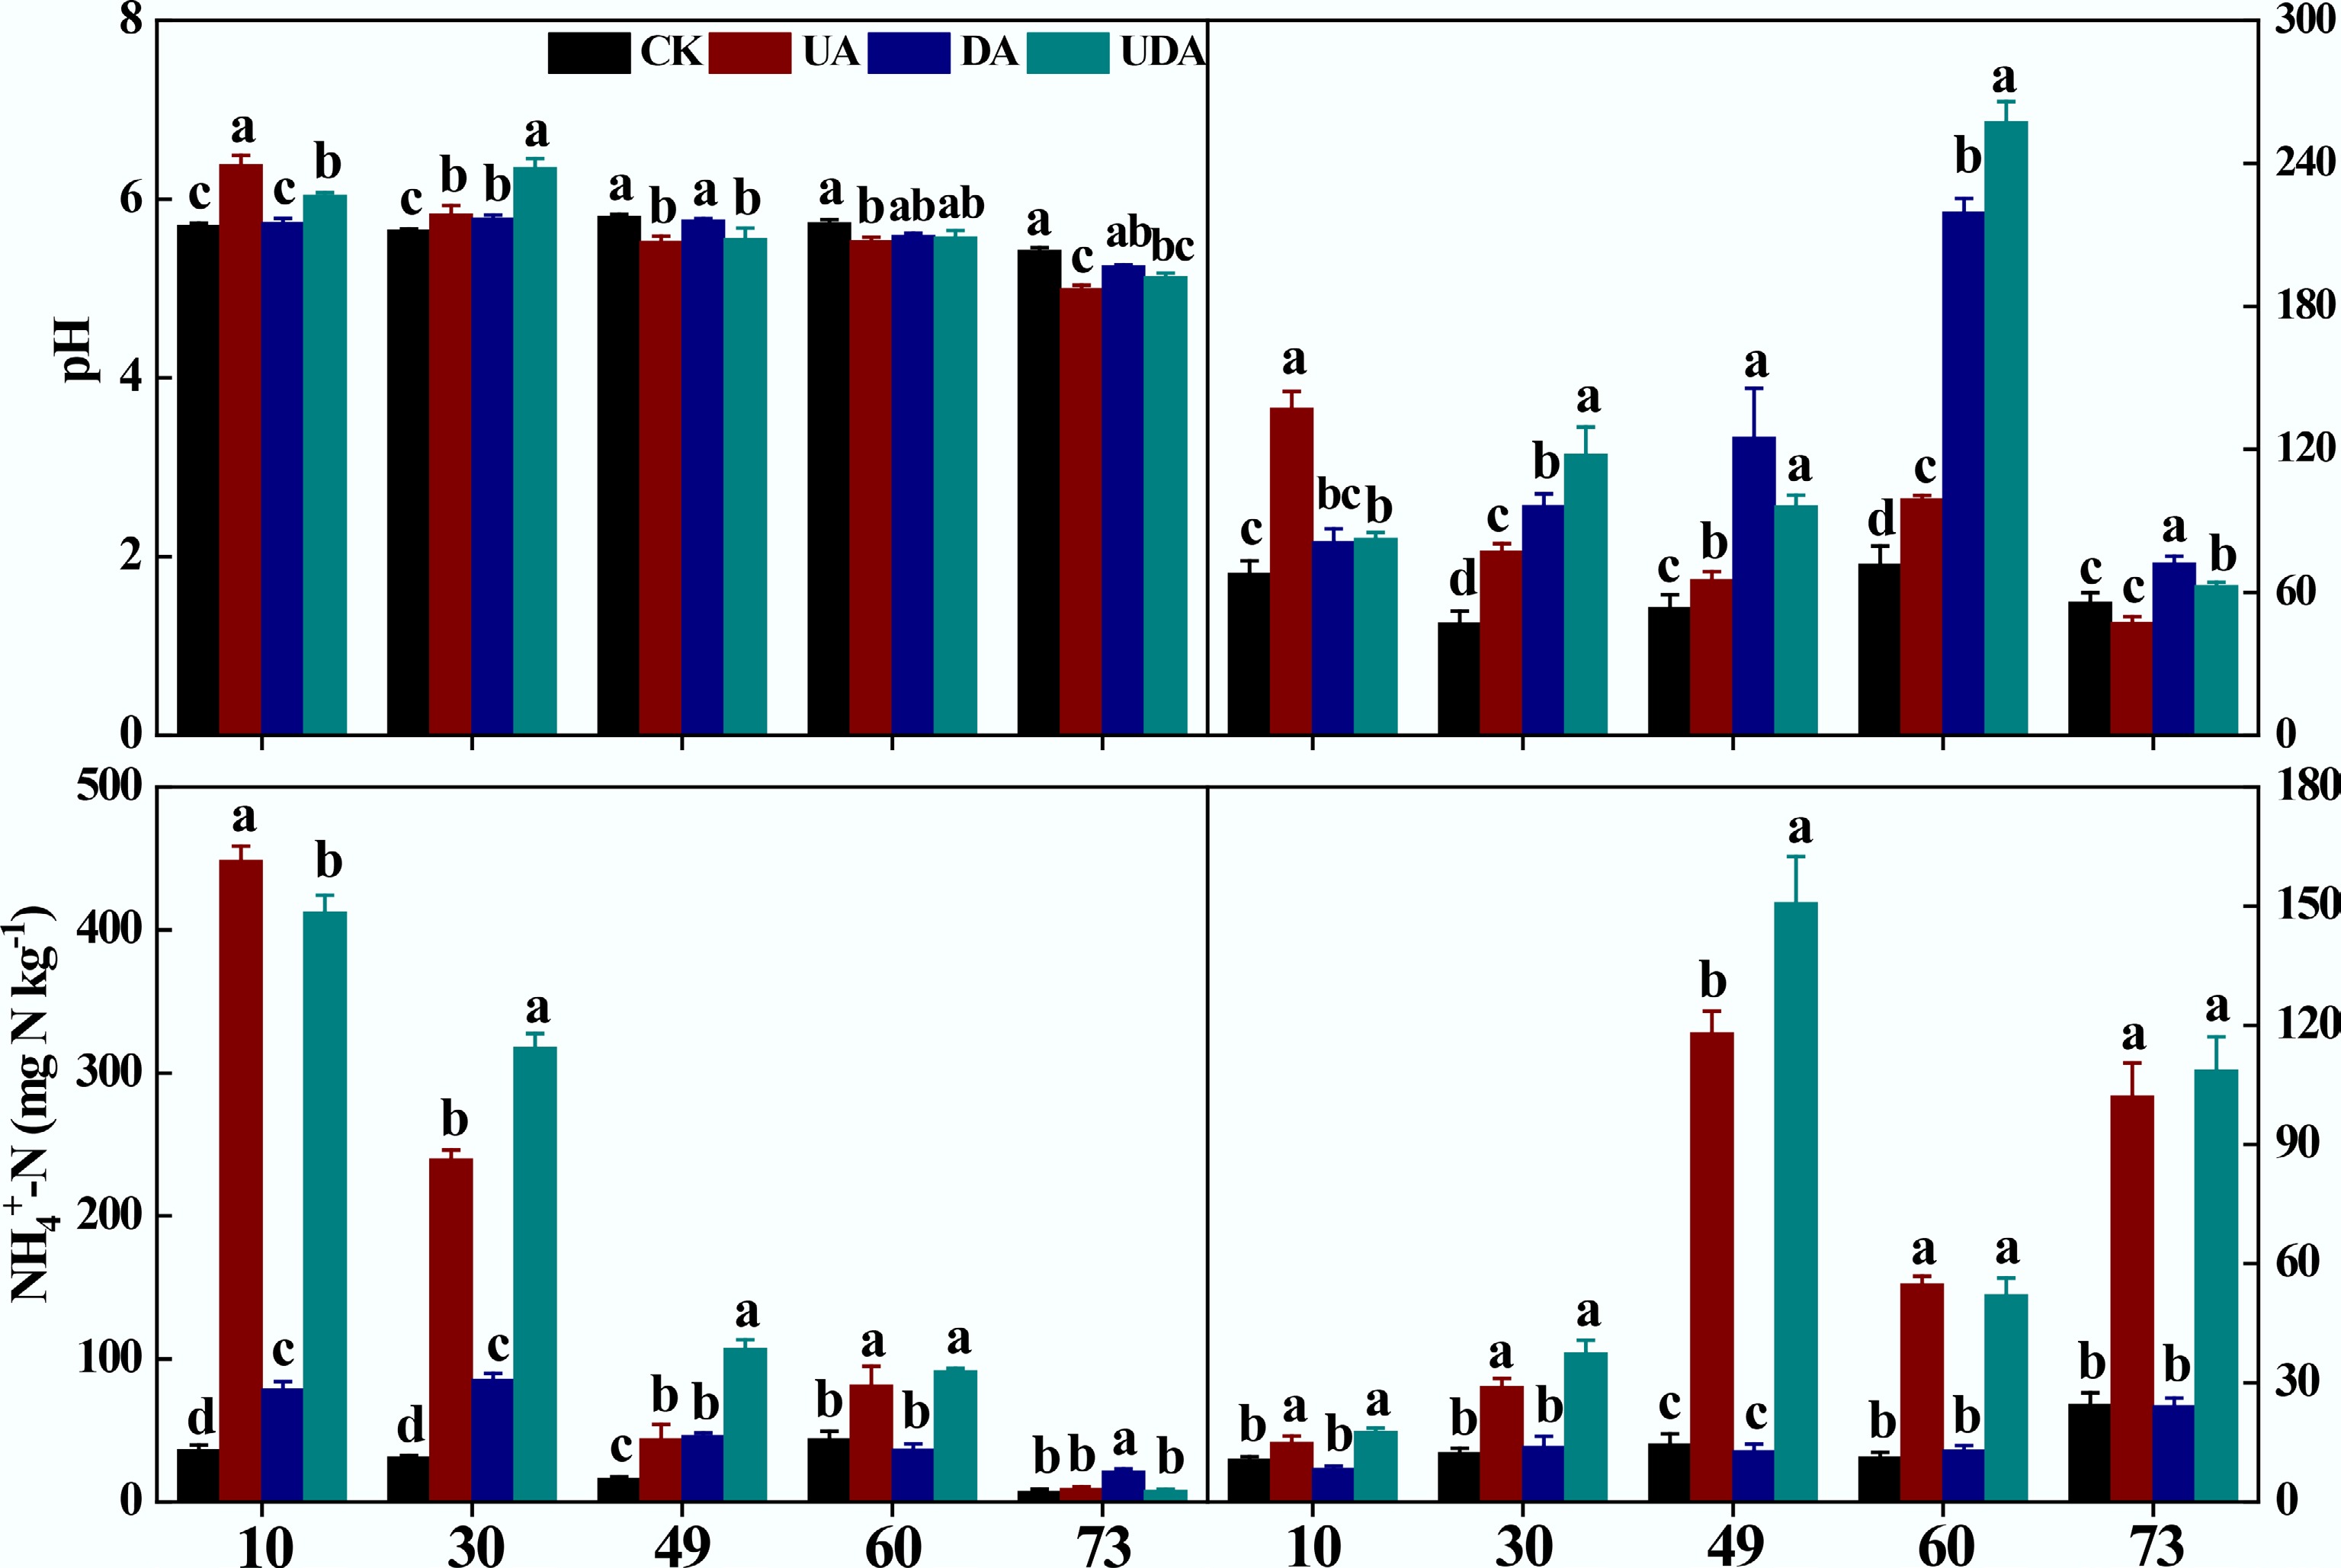
Figure 2.
Soil pH, DOC, NH4+-N, and NO3−-N concentration under different yak excreta application treatments. CK, without excretion application; UA, urine application; DA, dung application; UDA, combined urine and dung application; DOC, dissolved organic carbon; NH4+-N, ammonium nitrogen; NO3−-N, nitrate nitrogen. The error bars represent the standard errors of the mean (n = 4). The lowercase letters indicate significant differences among treatments at the same sampling time (p < 0.05).
Soil enzyme activities and N-cycling functional gene abundances
-
On days 10 and 30, soil urease activity was significantly higher in the UA and UDA treatments than in the DA treatment (Fig. 3). For LAP activity, the UE treatment had significantly higher values compared to the DA treatment on days 30 and 73; while the UDA treatment consistently had the lowest LAP activity, which was significantly lower than those in both the UA and DA treatments on all sampling days except for day 30 (Fig. 3). In addition, soil NAG activity in the UA treatment was significantly higher than those in the DA treatment on days 10, 60, and 73. Soil NAG activity in the UDA treatment was significantly higher than that in the UA treatment on days 30 and 60. It was also significantly higher than that in the DA treatment on days 10 and 60 (Fig. 3). The UA treatment showed significantly higher NEA than the DA treatment on all sampling days. The UDA treatment also showed significantly higher NEA on day 10 in comparison to that in the DA treatment (Supplementary Fig. S2). For DEA, both the DA and UDA treatments showed significantly higher values than the UA treatment on days 49 and 73 (Supplementary Fig. S2).
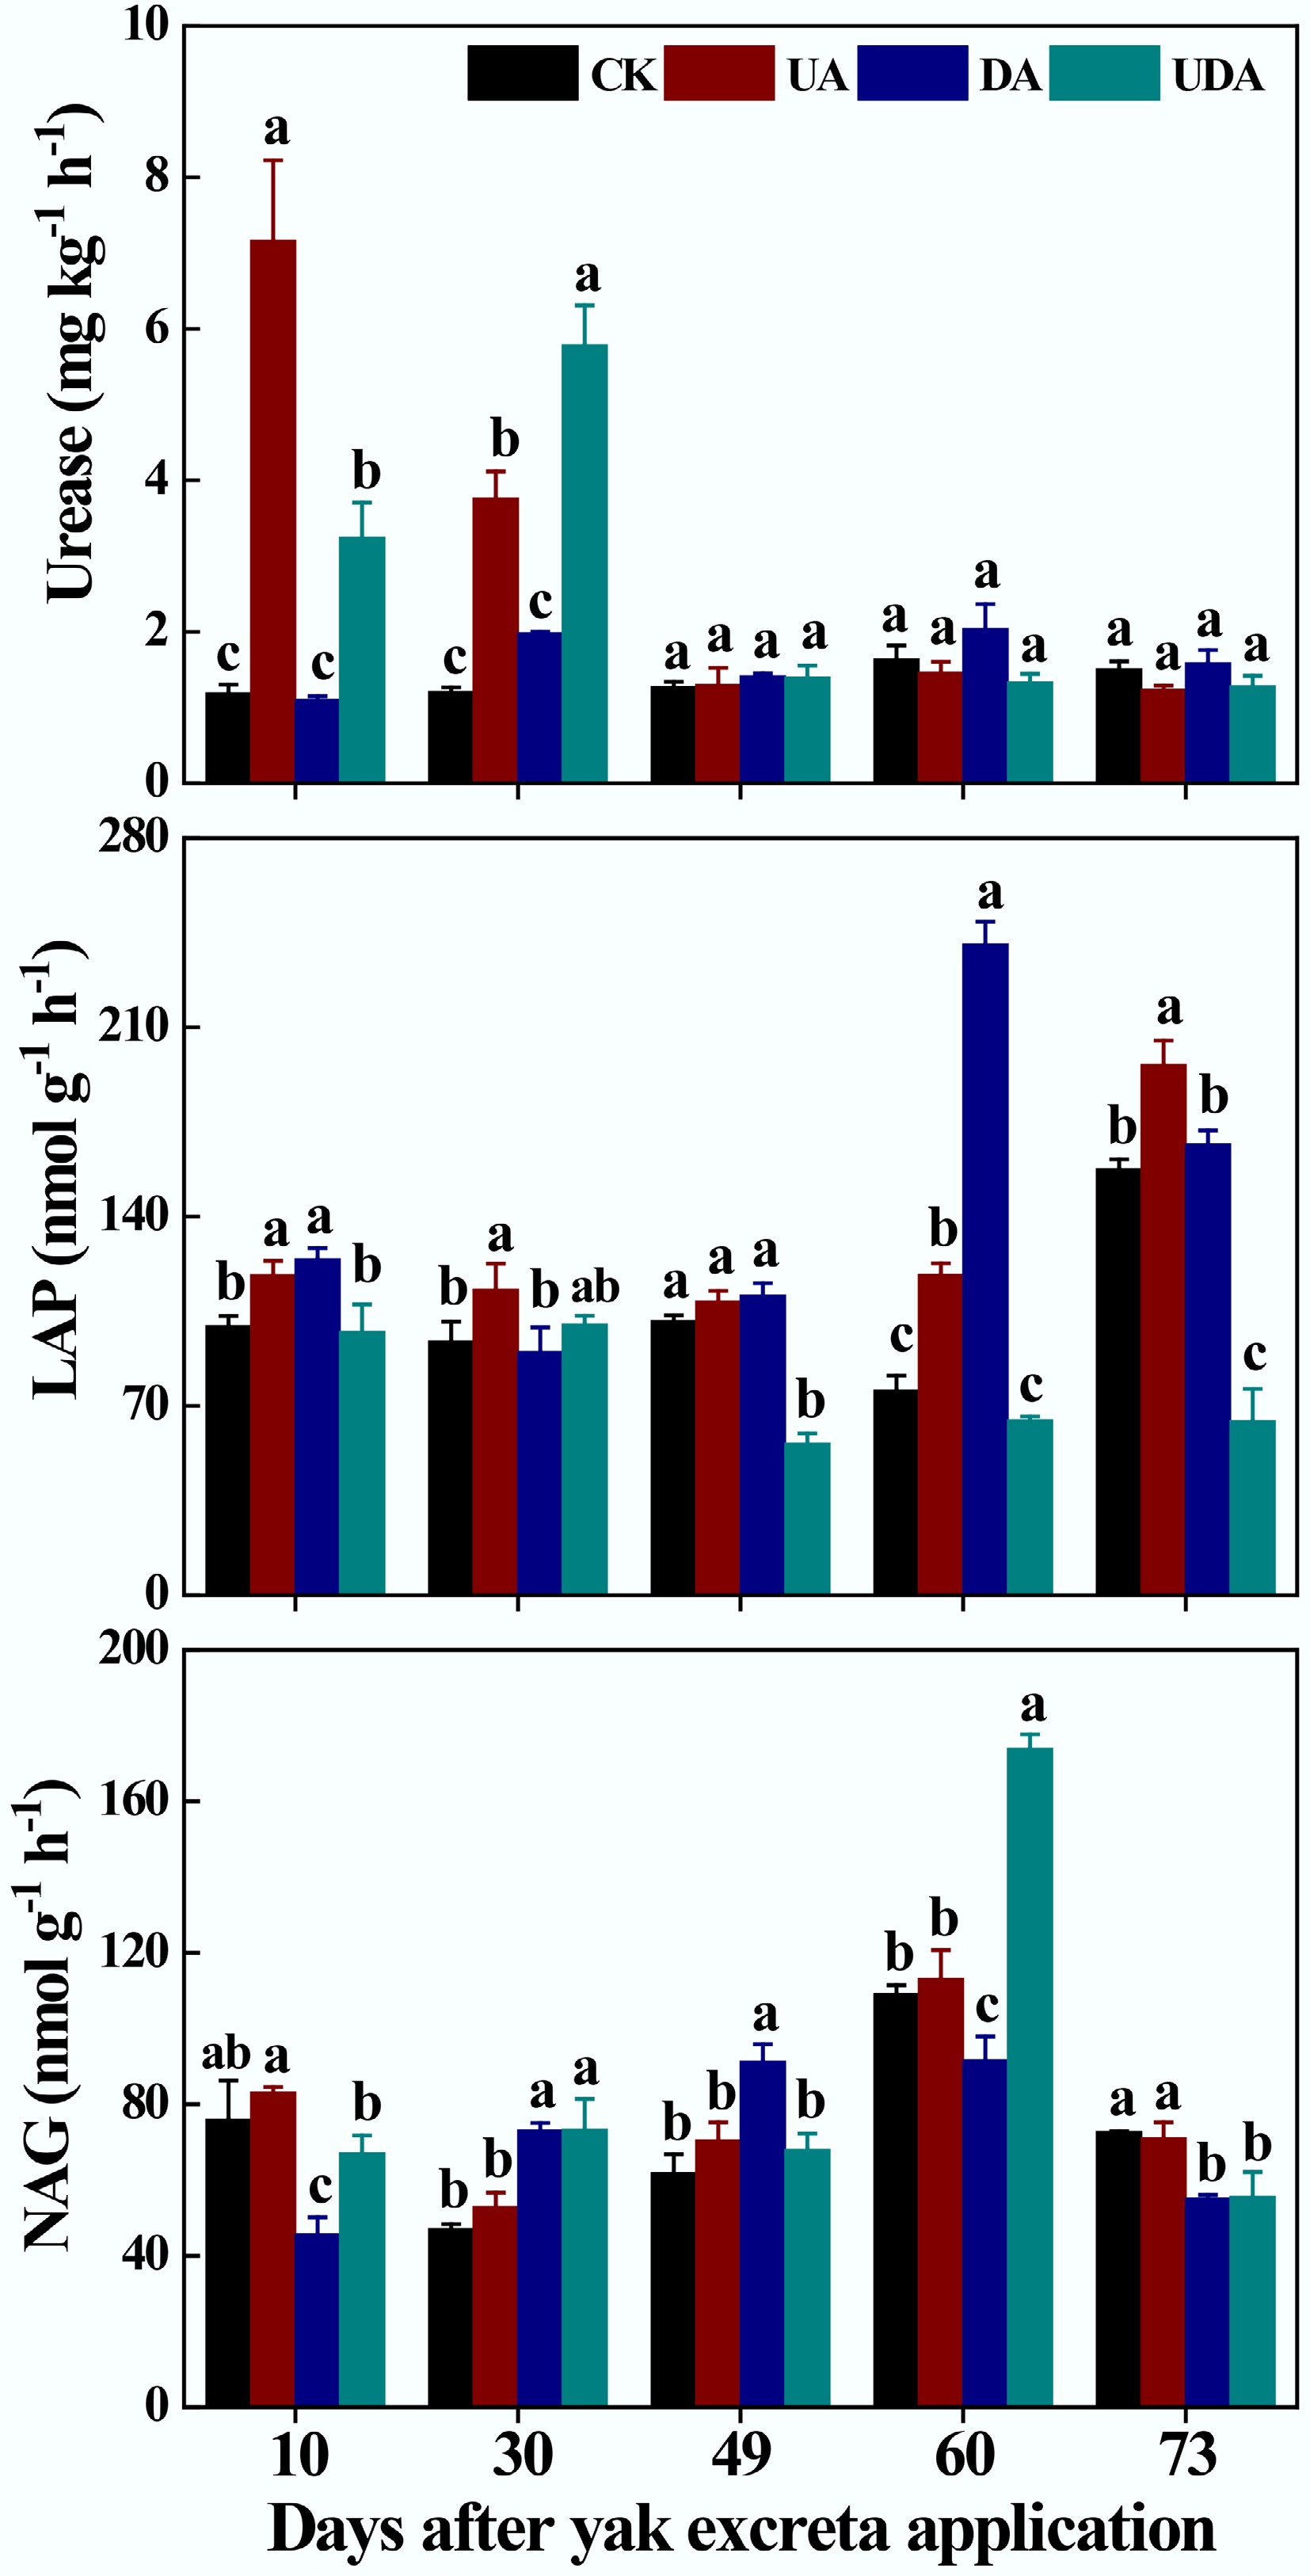
Figure 3.
Soil Urease, LAP and NAG under different yak excreta application treatments. CK, without excretion application; UA, urine application; DA, dung application; UDA, combined urine and dung application; LAP, leucine aminopeptidase; NAG, β-N-acetylglucosaminidase. The error bars represent the standard errors of the mean (n = 4). The lowercase letters indicate significant differences among treatments at the same sampling time (p < 0.05).
Compared to the CK treatment, soil AOA amoA gene abundance was significantly lower in both the DA and UDA treatments on days 30, 49, and 60, and also lower (p < 0.05) in the UA treatment on days 49 and 73 (Fig. 4). The UA treatment exhibited significantly higher AOA amoA gene abundance than the DA treatment on days 30 and 60. In contrast, the UDA treatment showed significantly greater value than both the UA and DA treatments on day 73 (Fig. 4). Conversely, soil AOB amoA gene abundance was significantly higher in the UA and UDA treatments compared to the CK treatment. Additionally, both treatments exhibited significantly greater abundance than the DA treatment, with no significant difference observed between the UA and UDA treatments (Fig. 4).
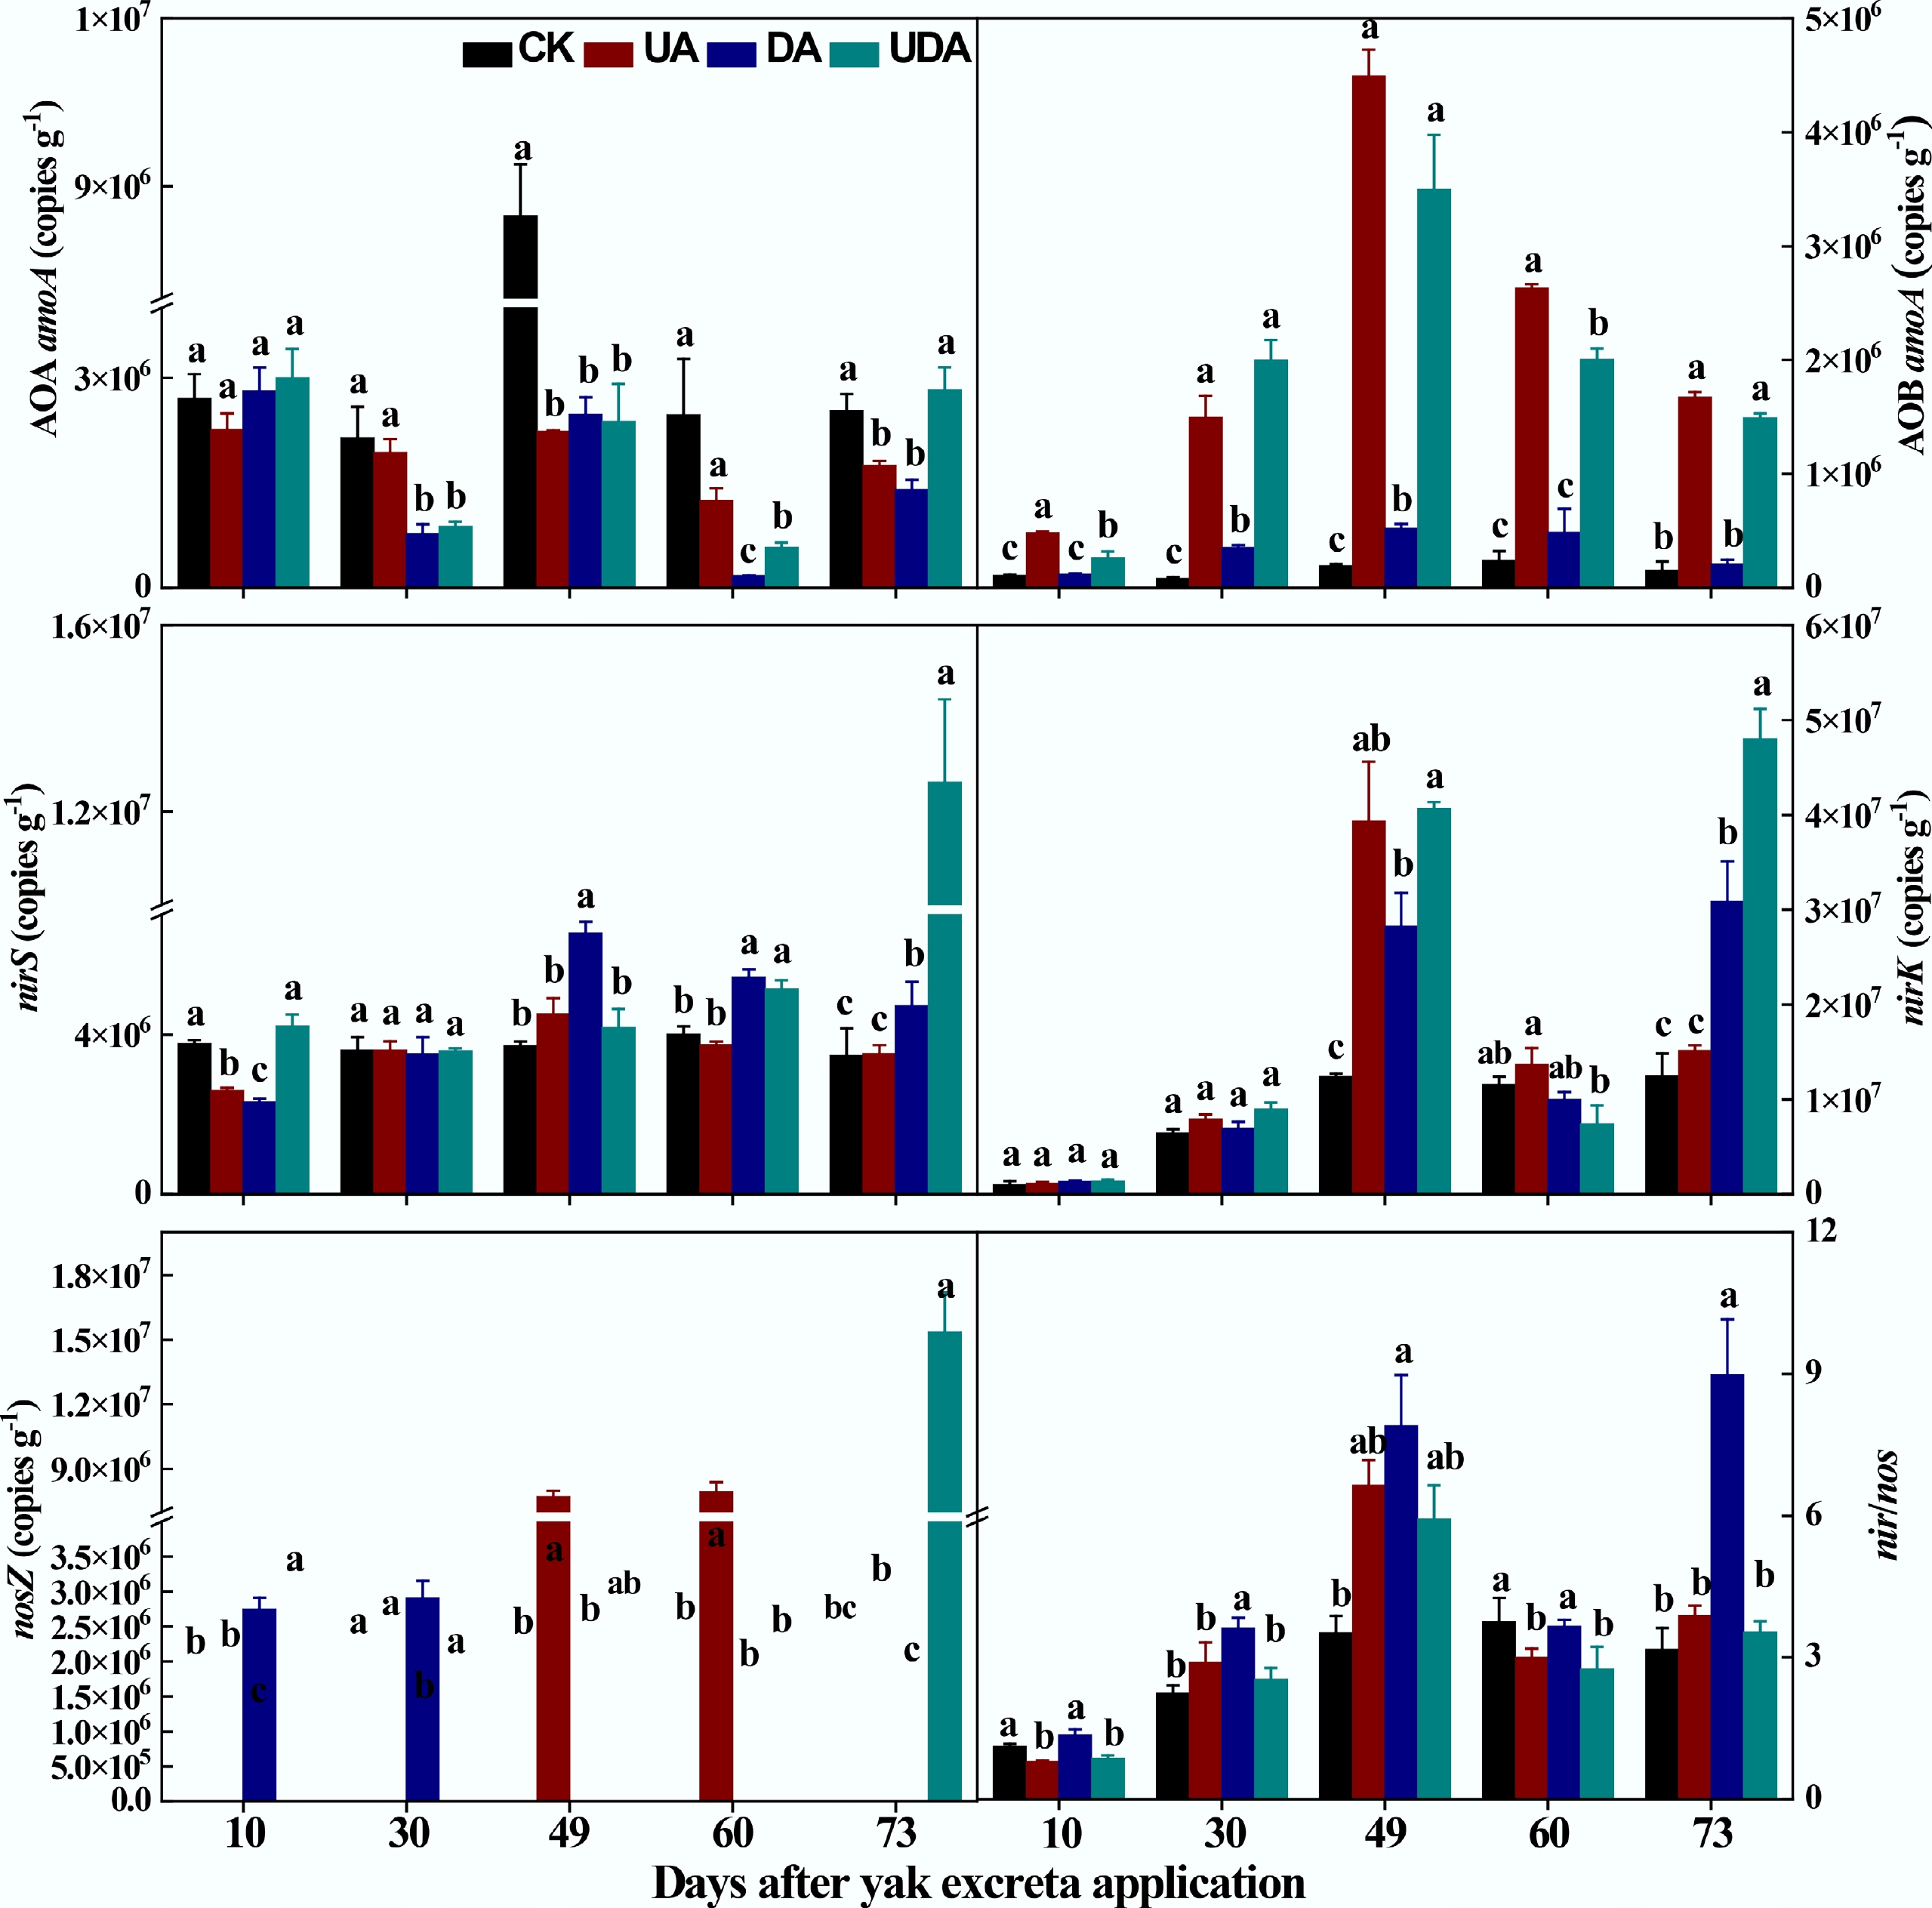
Figure 4.
The abundances of nitrifying functional gene (AOA amoA and AOB amoA), denitrifying functional gene (nirS, nirK and nosZ) and nir/nos under different yak excreta application treatments. CK, without excretion application; UA, urine application; DA, dung application; UDA, combined urine and dung application. The error bars represent the standard errors of the mean (n = 4). The lowercase letters indicate significant differences among treatments at the same sampling time (p < 0.05).
For denitrifying genes, the DA treatment exhibited significantly higher nirS gene abundance than the UA treatment on days 49, 60, and 73. In contrast, the UDA treatment showed significantly greater nirS gene abundance than both the UA and DA treatments on days 10 and 73 (Fig. 4). However, nirK gene abundance was significantly higher in the DA treatments than in the UA treatment on day 73. Soil nirK gene abundance was significantly higher in the UDA treatment relative to the DA treatment on days 49 and 73 (Fig. 4). The UA treatment had significantly higher nosZ gene abundance than the UA treatment on all sampling days. The UDA treatment showed higher (p < 0.05) nosZ gene abundance than the UA and DA treatments on days 10 and 73 (Fig. 4). Regarding the nir/nos ratio, the DA treatment had significantly higher values than the UA and UDA treatments on all sampling days except for day 49. Additionally, the UA treatment showed a higher value than the UDA treatment, although this difference was not statistically significant (Fig. 4).
Soil N2O emissions
-
All excreta deposition treatments enhanced soil N2O fluxes (Fig. 5), with a peak observed on day 13 followed by a gradual decline. The N2O flux in the UA treatment was significantly greater than that in the DA treatment on days 10, 13, 18, 21, 45, 49, and 58. Furthermore, the UDA treatment exhibited significantly greater fluxes than both UA and DA treatments on days 10 and 13. Overall, the emission pattern was biphasic, consisting of the early period (fluctuating phase, days 1–30) and the late period (stable phase, days 31–73).
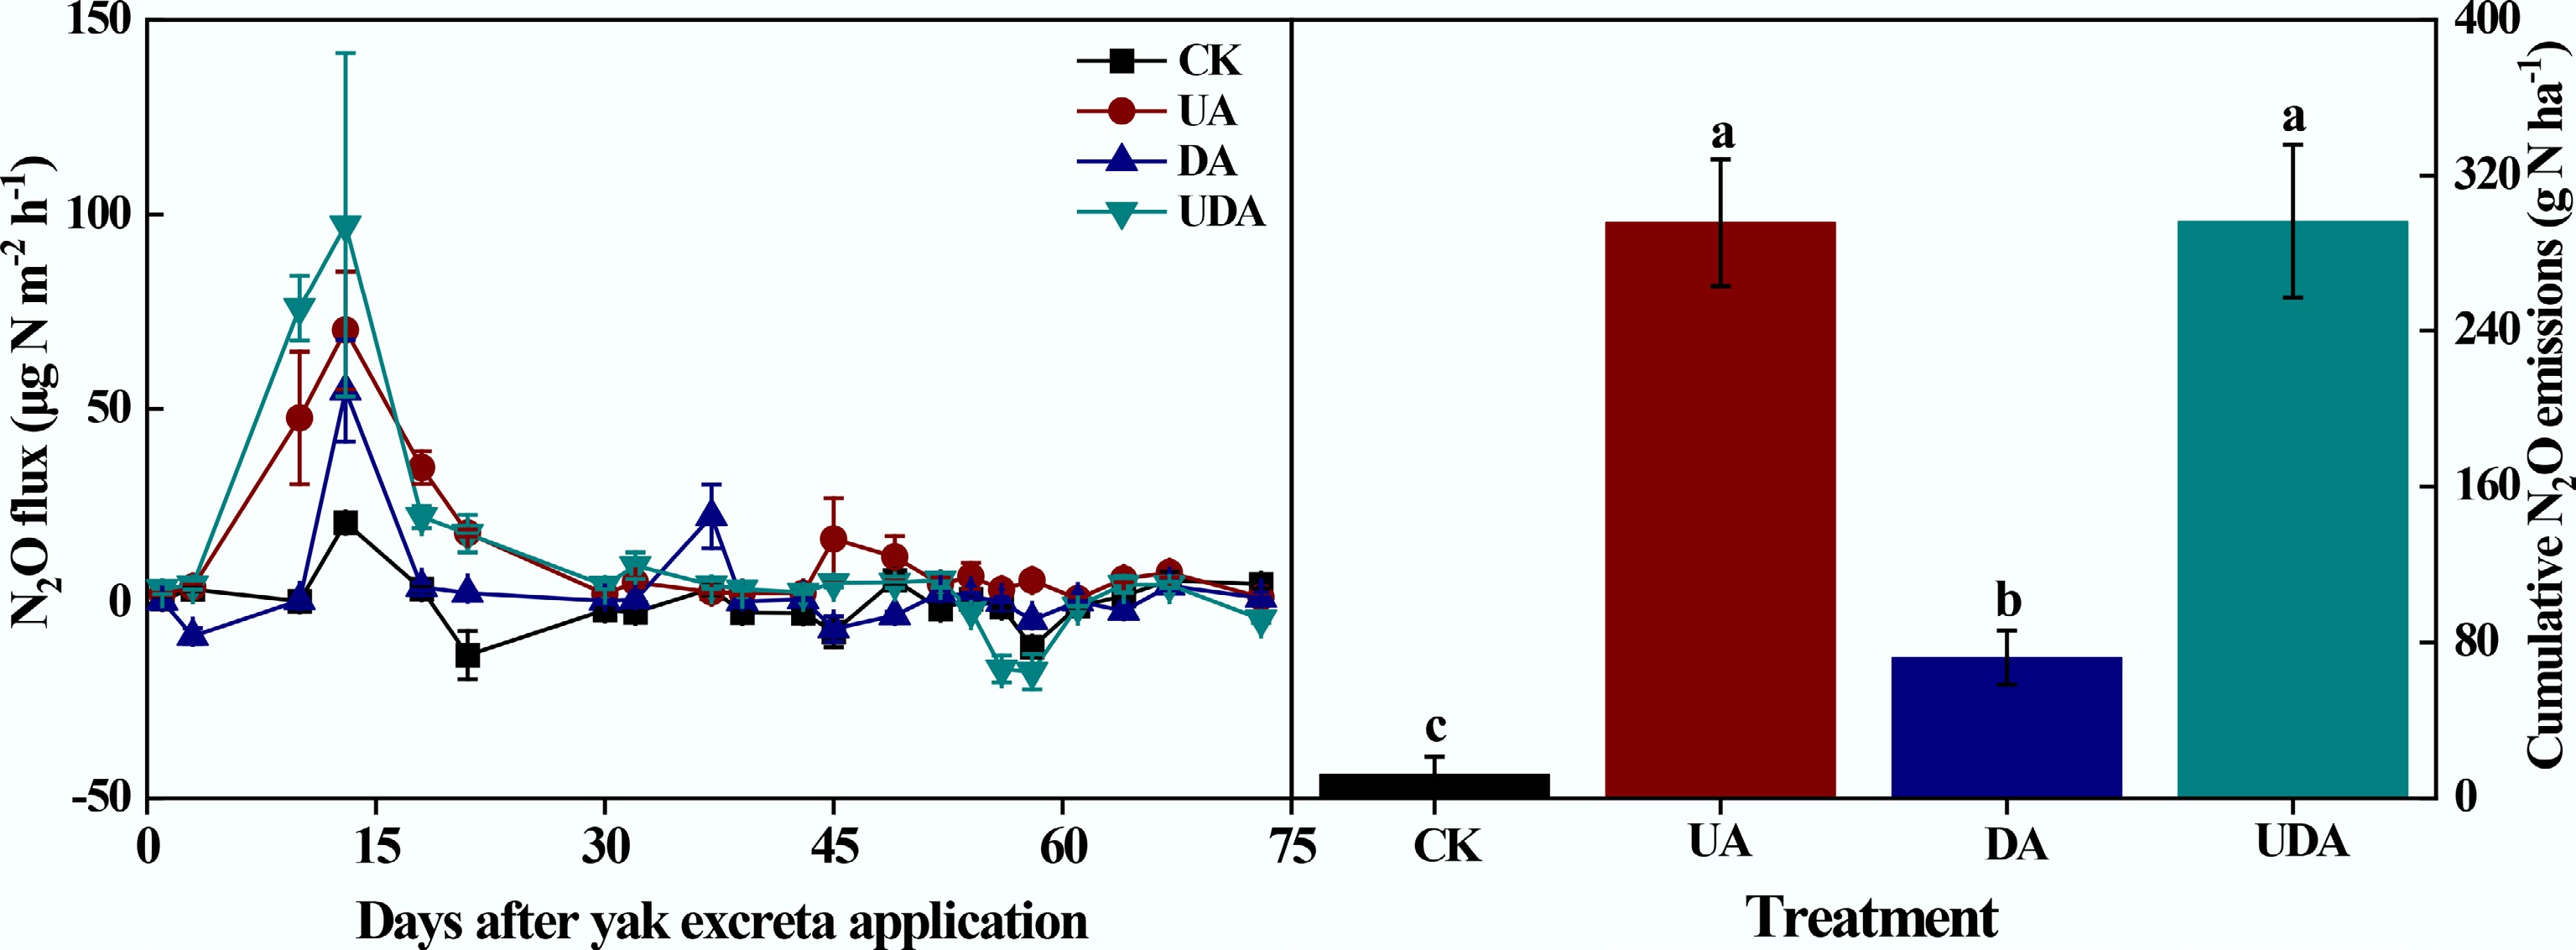
Figure 5.
Soil N2O fluxes and cumulative N2O emission under different yak excreta application treatments. CK, without excretion application; UA, urine application; DA, dung application; UDA, combined urine and dung application. The error bars represent the standard errors of the mean (n = 4). Different letters indicate significant differences between different treatments (p < 0.05).
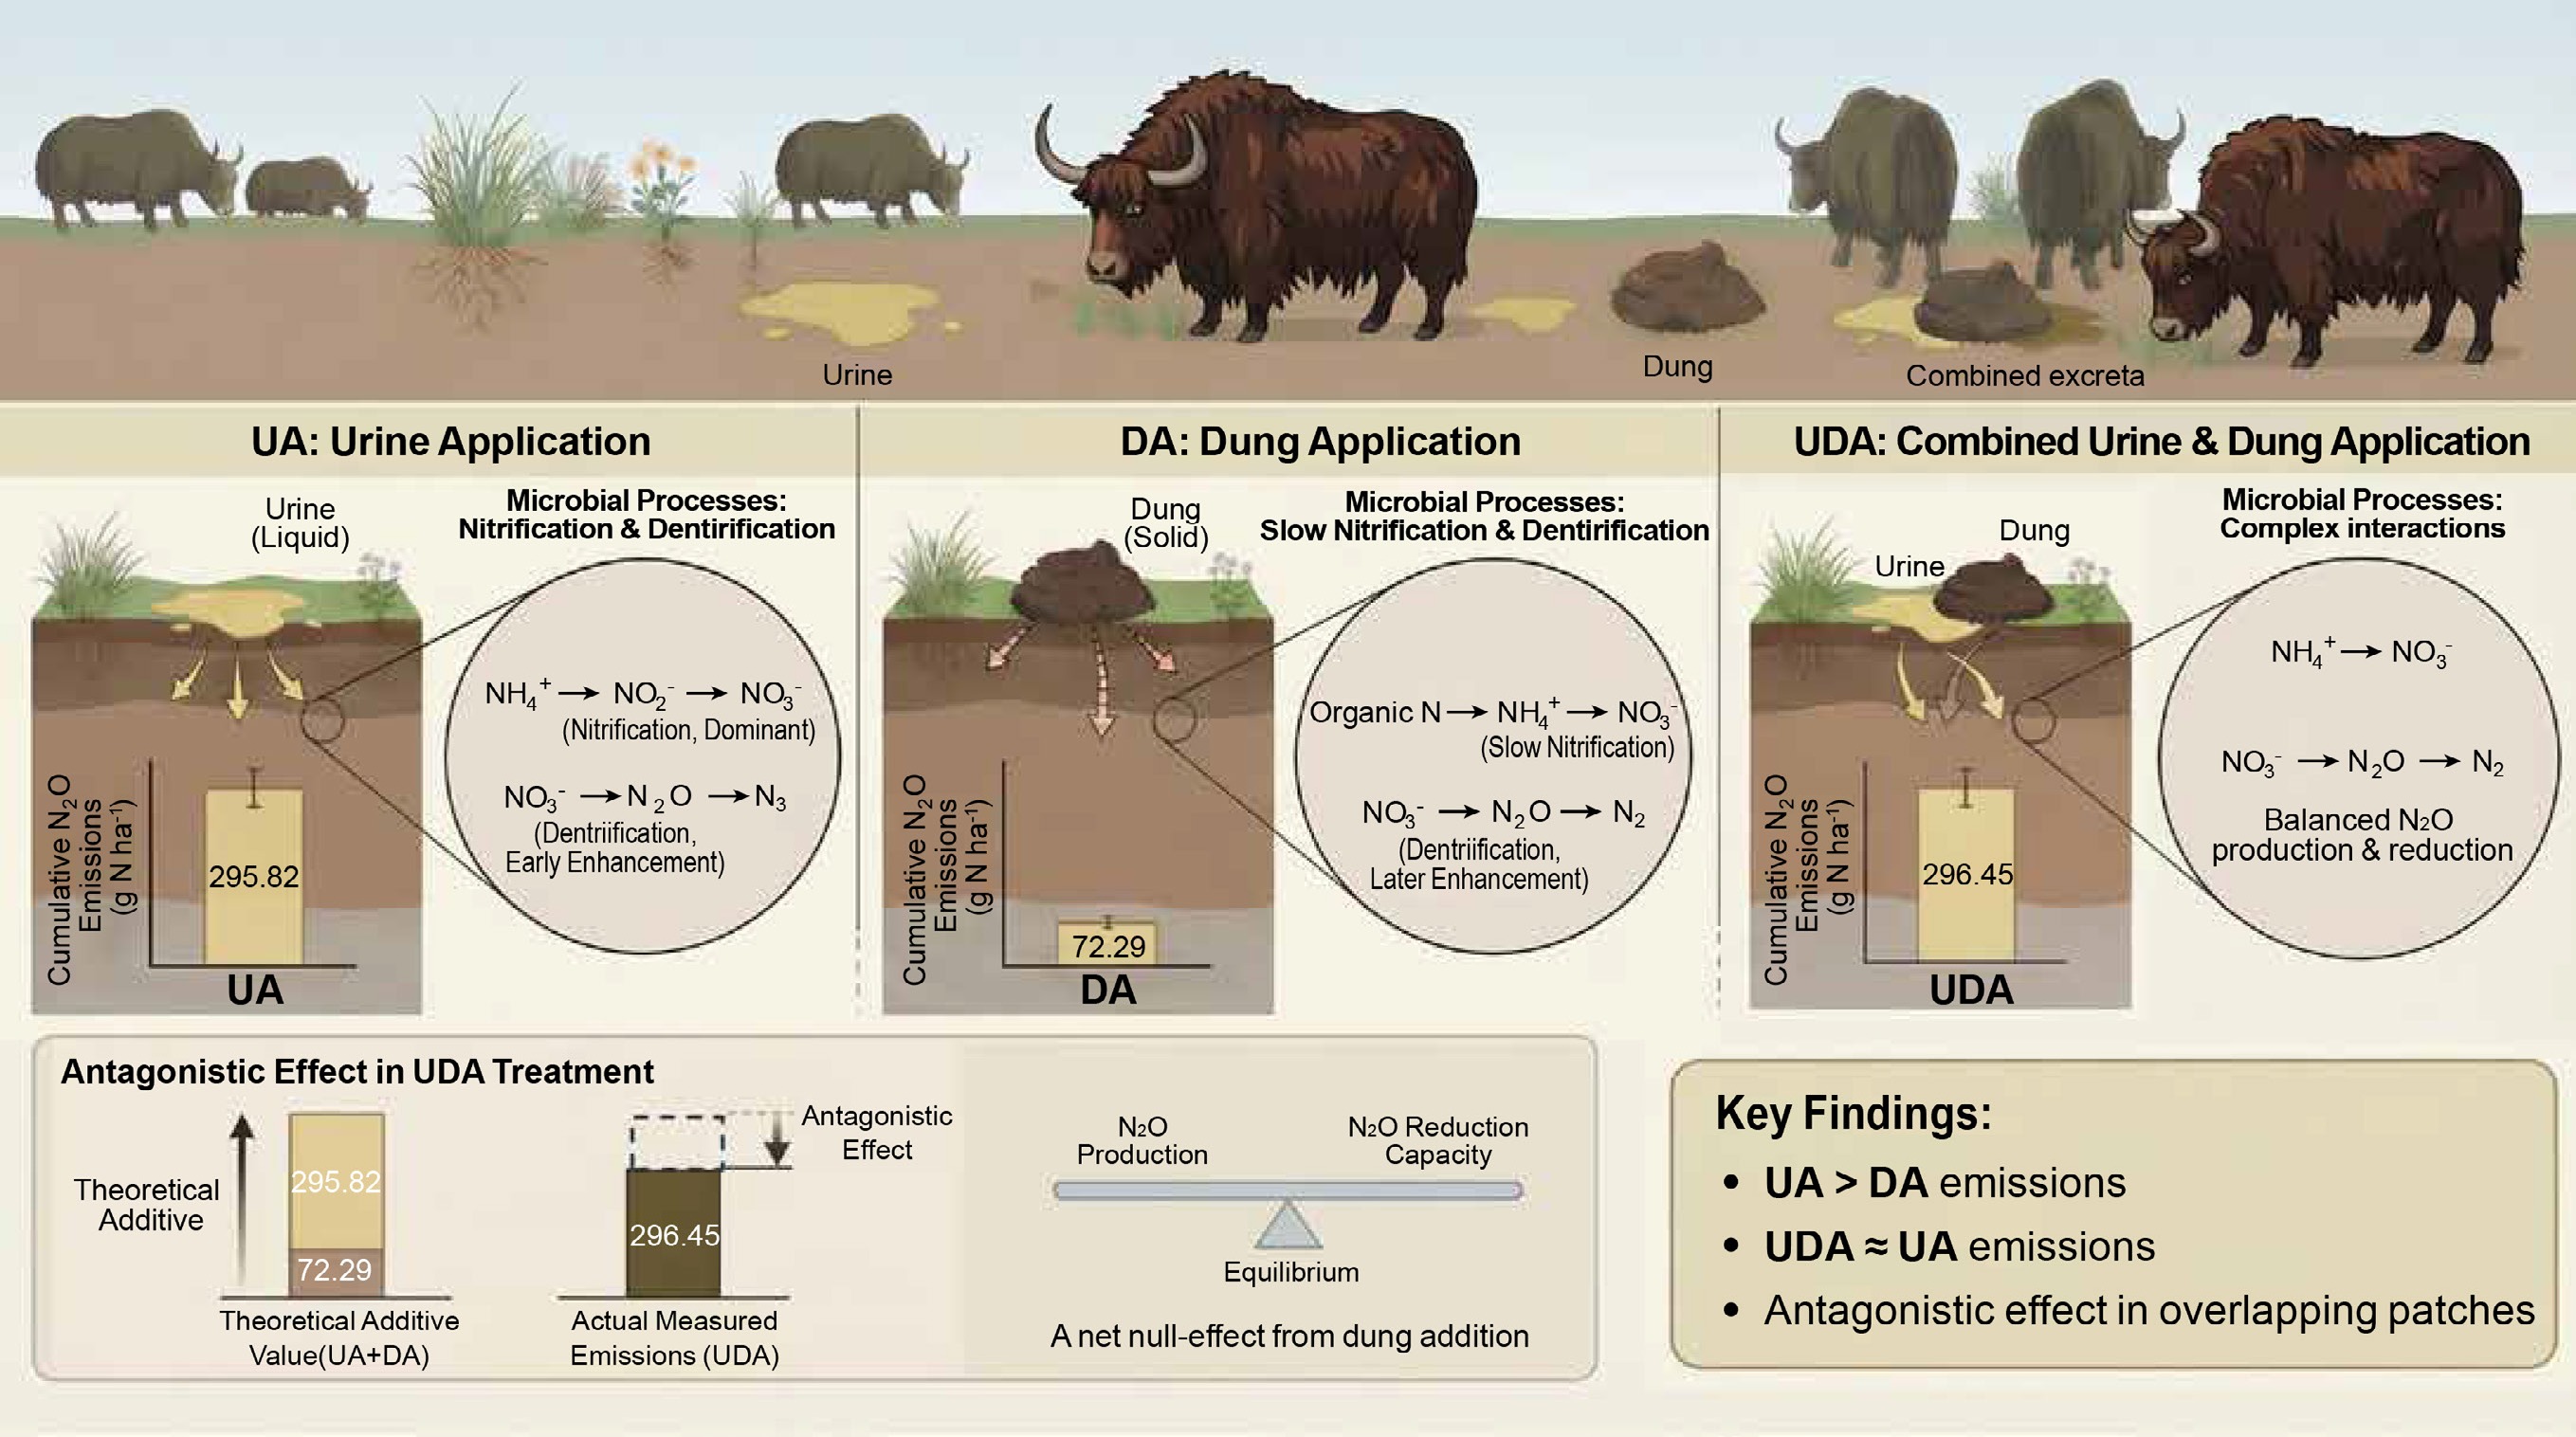
Cumulative soil N2O emissions were significantly higher in the excreta treatments compared to the CK treatment (Fig. 5). Cumulative N2O emission in the UA treatment (295.82 g N ha−1) was significantly greater than that in the DA treatment (72.29 g N ha−1). During the early period, cumulative emissions from the UA and DA treatments were 192.46 and 53.37 g N ha−1, accounting for 65.1% and 73.8% of the total emissions, respectively. In addition, cumulative N2O emission in the UDA treatment (296.45 g N ha−1) was similar to that in the UA treatment but was nearly 3.1 times higher than that in the DA treatment. The mean Δ value was 0.84 in this study (Fig. 6). The quantitative assessment of the data from this study and published literature showed a mean Δ value of 1.25 (Table 2; Fig. 6). Furthermore, the mean Δ value was 0.92 under dry conditions and 1.58 under wet conditions (Fig. 6).
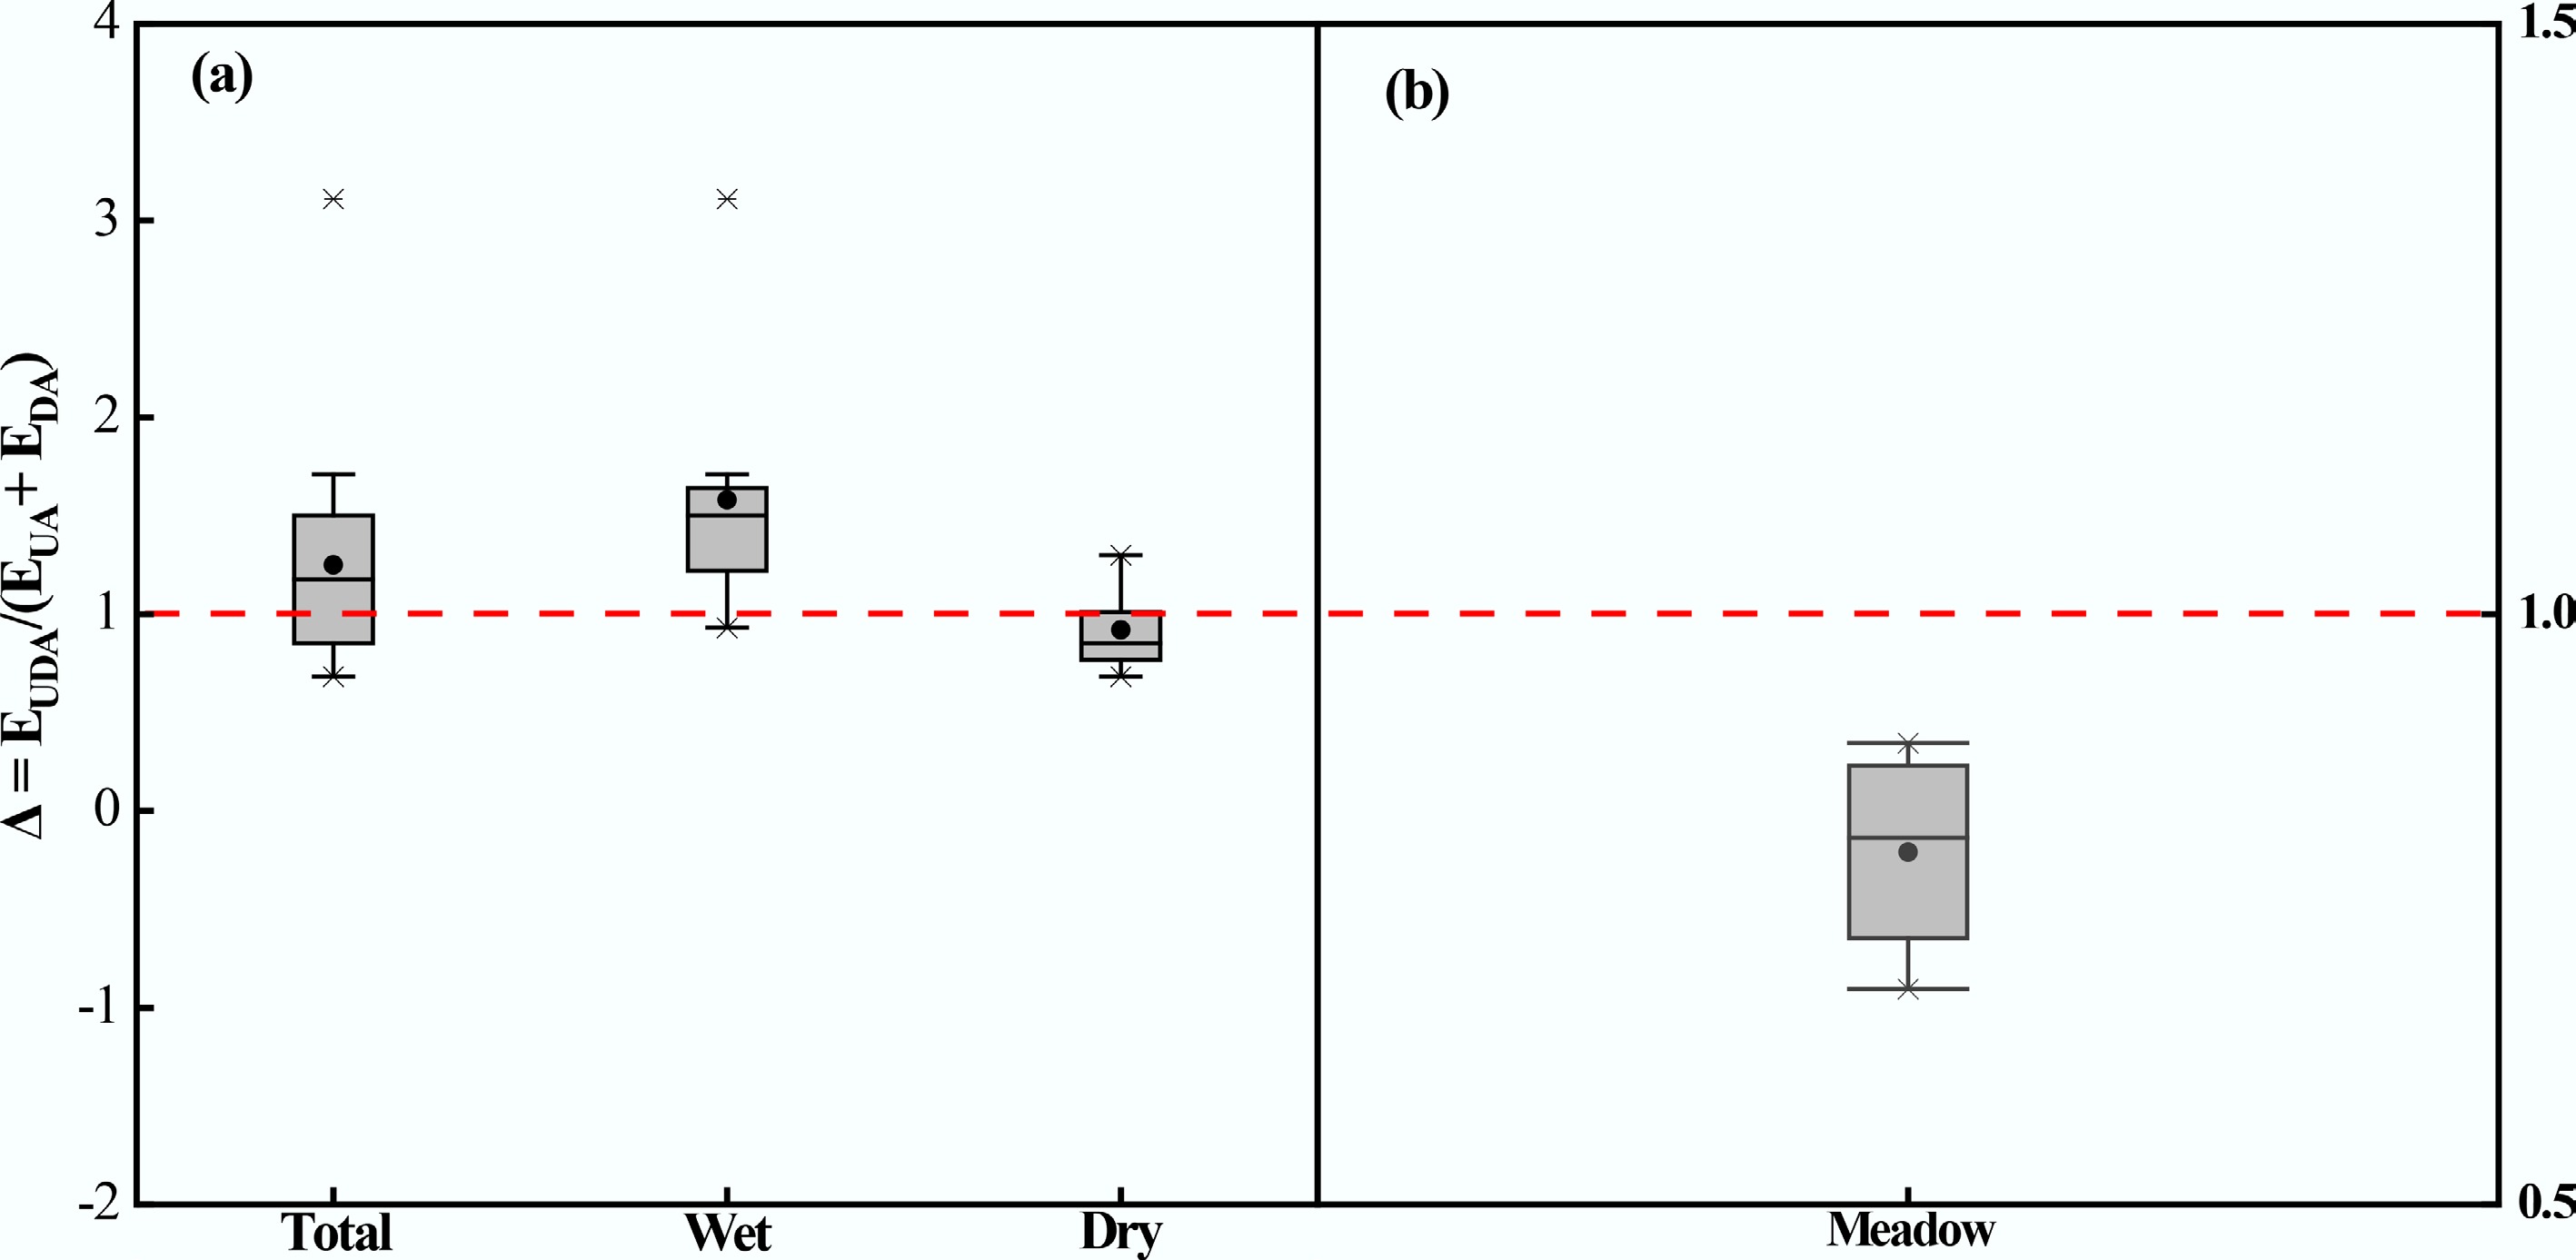
Figure 6.
Proportional change (Δ) in cumulative N2O emissions from the UDA treatment compared to the theoretical sum UA and DA of the individual treatments. UA, urine application; DA, dung application; UDA, combined urine and dung application; EUDA, cumulative N2O emissions from the UDA treatment; EUA + EDA, the theoretical sum of cumulative N2O emissions from the separate UA and DA treatments. The data set was compiled from (a) all studies (n = 18), including14 from previously published studies, and (b) 4 from the present study. If the relation is Δ = 1, then the effect of combining urine and dung on N2O emissions is additive. If Δ > 1, combining urine and dung results in a synergistic effect on N2O production, exceeding the sum of the individual emissions. Conversely, the Δ < 1, indicating that the effect of combining urine and dung excreta application on soil N2O emissions is antagonistic.
Table 2. Cumulative nitrous oxide (N2O) emissions from different excreta treatments (CK, without excretion application; UA, urine application; DA, dung application; UDA, combined urine and dung application), and the proportional increase (Δ) of the combined treatments relative to the theoretical sum of the individual patches across different trials
Location Conditions CK UA DA UDA Δ Ref. UNCPBA, Argentina Dry 6.9 72.6 192.7 327.7 1.24 [9] UNCPBA, Argentina Wet 3.4 103.2 133.4 736.9 3.11 [9] Wexford, Ireland Wet 5.95 6.49 5.99 6.54 0.93 [55] ILRI, Kenya Wet 3.8 22.4 6 29.5 1.22 [27] ILRI, Kenya Wet 2.8 8.9 18.7 27.6 1.13 [27] ILRI, Kenya Dry 1.7 2.2 4.5 4.8 0.72 [27] ILRI, Kenya Wet −0.9 1.2 −0.9 2.1 1.43 [8] ILRI, Kenya Dry −2.9 −1.3 −1.5 1.1 1.3 [8] Kaptumo, Kenya Wet 14.84 143.41 14.84 225.83 1.64 [28] Kaptumo, Kenya Wet 21.43 215.93 19.78 351.10 1.71 [28] Kaptumo, Kenya Dry 11.48 40.98 27.87 55.74 0.81 [28] Kaptumo, Kenya Dry 18.03 91.8 19.67 113.12 1.01 [28] Wageningen, Netherlands Wet 0.29 0.91 0.51 1.59 1.55 [26] Hamilton, New Zealand Wet 1.72 6.74 7.18 17.47 1.50 [18] QP, China Dry 18.14 319.73 65.91 339.31 0.93 This study QP, China Dry 4.47 280.32 36.04 221.91 0.71 This study QP, China Dry 14.42 368.51 99.05 368.51 0.85 This study QP, China Dry 12.09 214.72 88.15 238.92 0.82 This study Relationships between N2O emissions and soil properties
-
Correlation analysis showed that soil N2O emission in the UA treatment was significantly positively correlated with WFPS, pH, DOC, NH4+-N, urease activity, AOB amoA, and NEA (Supplementary Table S1; Supplementary Fig. S3). Hierarchical variance separation analysis identified pH, NH4+-N, urease activity and WFPS as the main contributors showing significant influence on soil N2O emission, accounting for 15.2%, 14.7%, 13.5%, and 13.3% of the variance, respectively (Fig. 7).
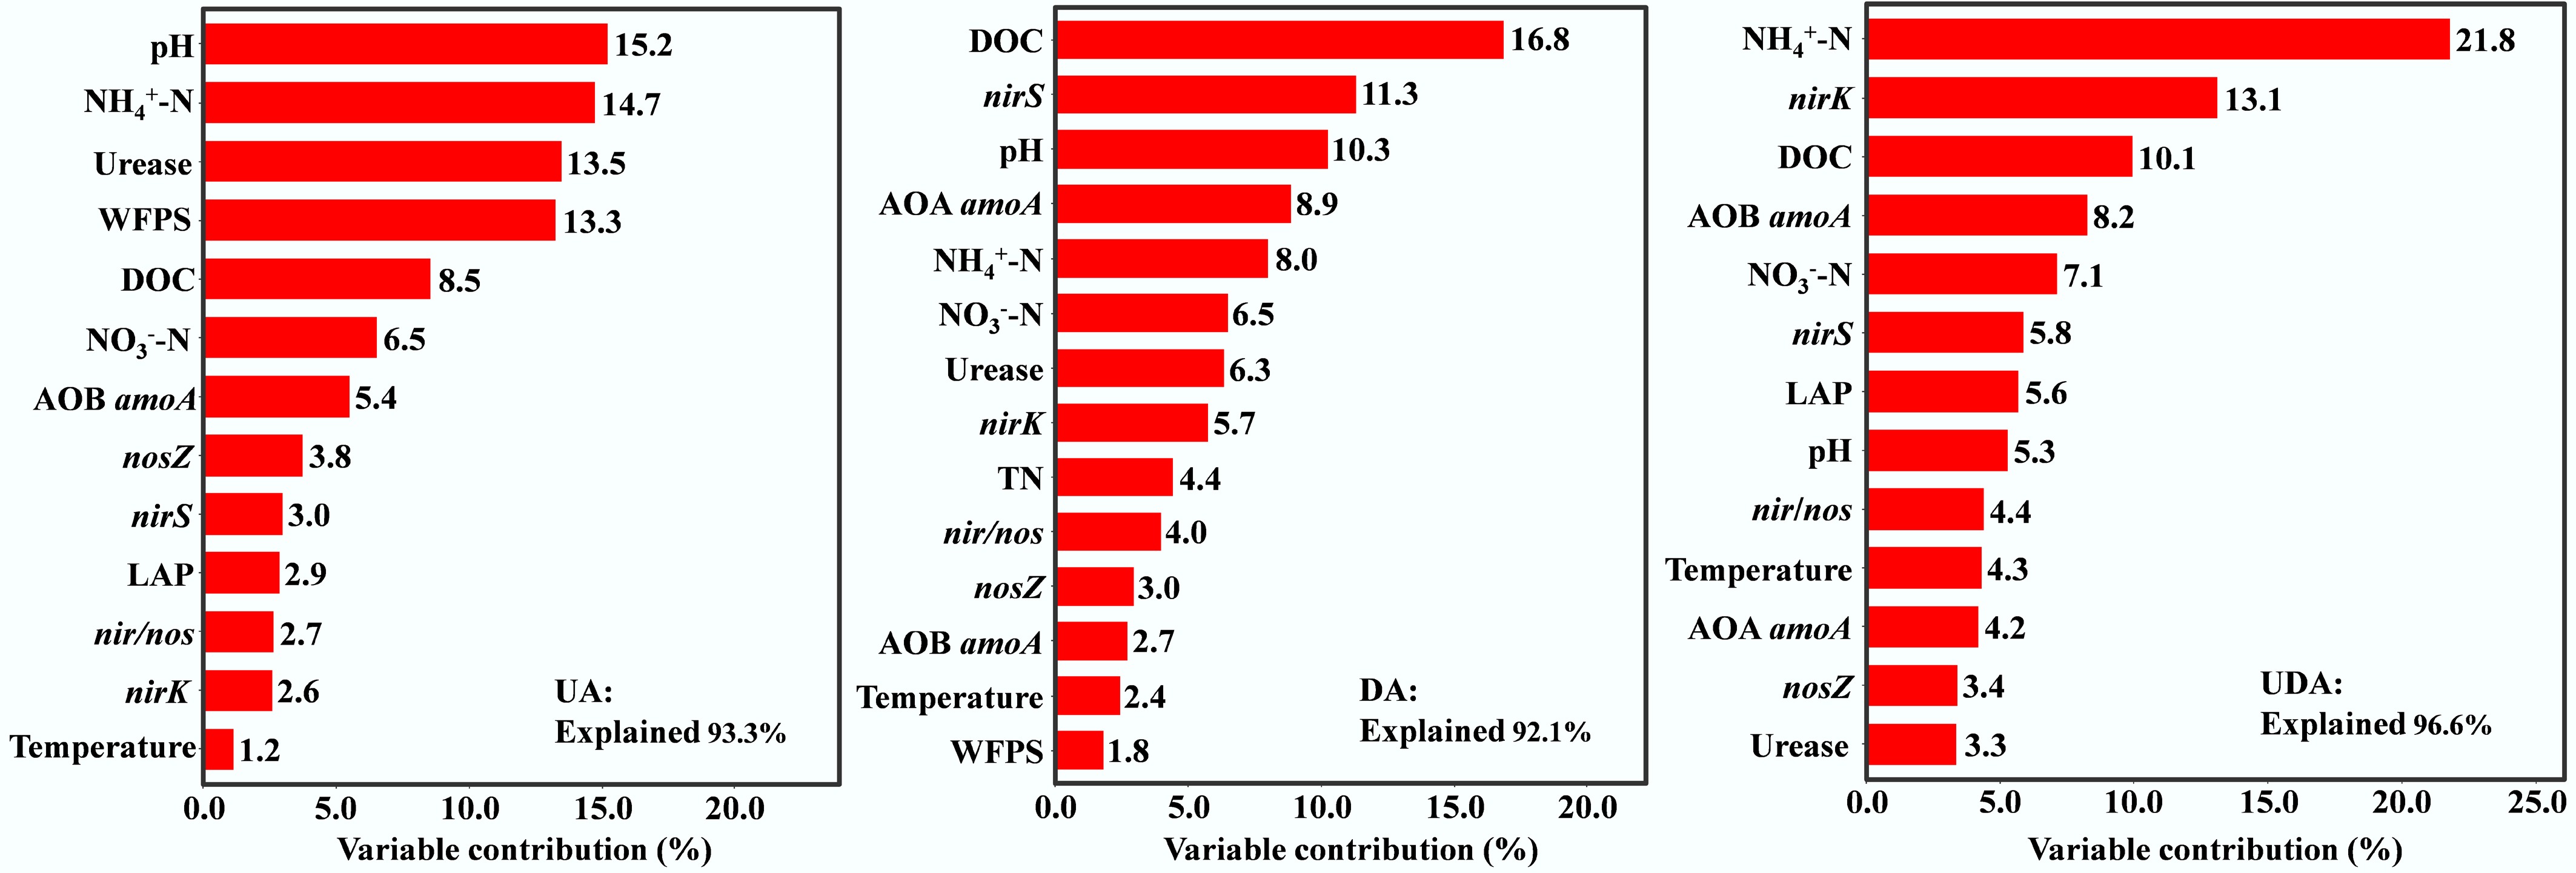
Figure 7.
Relative importance of soil properties on soil N2O emissions under different yak excreta application treatments. UA, urine application; DA, dung application; UDA, combined urine and dung application. N2O, soil N2O emissions; WFPS, water-filled pore space; DOC, dissolved organic carbon; NH4+-N, ammonium nitrogen; NO3−-N, nitrate nitrogen; NAG, β-N-acetylglucosaminidase activities; LAP, leucine aminopeptidase activities; nosZ, nosZ I gene abundance.
In the DA treatment, soil N2O emissions exhibited significant positive correlations with WFPS, DOC, AOA amoA, nirS, nirK, and DEA, but showed negative correlations with LAP activity (Supplementary Table S1; Supplementary Fig. S3). Hierarchical variance separation analysis identified that DOC, nirS, and pH were the most significant contributors to N2O emission variance, with contributions of 16.8%, 11.3% and 10.3%, respectively (Fig. 7).
Soil N2O emissions in the UDA treatment were significantly and positively correlated with soil temperature, WFPS, pH, DOC, NH4+-N, NO3−-N, LAP activity, AOB amoA, nirS, nir/nos, NEA and DEA, and negatively correlated with nosZ (Supplementary Table S1; Supplementary Fig. S3). Hierarchical variance separation analysis revealed that NH4+-N, nirK, and DOC were the primary factors significantly influencing soil N2O emission, with contributions of 21.8%, 13.1%, and 10.1%, respectively (Fig. 7).
-
In this study, both yak urine and dung deposition significantly increased soil N2O emissions compared to the CK treatment (Fig. 5). Similar findings have been reported in other pastures[8,9,18,26,27]. This stimulation is primarily attributed to increased soil N and C availability (Fig. 2), which provided substrates and energy sources for nitrifiers and denitrifiers (Fig. 4), thereby enhancing nitrification and denitrification and promoting N2O production[40,47].
As expected, cumulative N2O emissions from the UA treatment were 4.1 times those from the DA treatment (Fig. 5), supporting the first hypothesis. A similar magnitude of difference was reported by Zhu et al.[27], who found that N2O emissions from cattle urine treatment were 3.8 times greater than those from dung treatment. Together, these findings reinforce earlier evidence that urine deposition induces substantially greater soil N2O emissions than dung deposition under field conditions[8,20,28]. The greater N2O emissions induced by urine deposition compared to dung deposition were partly attributable to higher nitrification[3,13]. This was indicated by significantly higher NH4+-N concentration and AOB amoA gene abundance in the UA treatment (Figs 2, 4). Furthermore, the higher NEA in the UA treatment, coupled with the positive correlation between N2O emissions and NEA specifically in the UA treatment (rather than in the DA treatment), supports this view (Supplementary Table S1; Supplementary Fig. S2). Additionally, a higher DEA following urine application during the early period (Supplementary Table S2; Supplementary Fig. S2) was observed. This was attributed to a combination of factors: higher DOC concentration (Supplementary Table S3) sourced from increased soil C solubilization following urine deposition[48], greater NO3−-N availability driven by enhanced nitrification (as discussed above) (Fig. 2), and higher nirS gene abundance in the UA treatment compared to the DA treatment (Supplementary Table S2). Collectively, these conditions created favorable conditions for denitrification[40], thereby contributing to increased N2O production.
Notably, although the UA treatment exhibited a higher abundance of the nosZ gene that was responsible for reducing N2O to N2[49] compared to the DA treatment (Supplementary Table S2), the nosZ gene did not emerge as the dominant factor controlling N2O emissions (Fig. 7). This is further supported by the similar nir/nos in both treatments (Supplementary Table S2) and the weak correlation between N2O emission and nosZ abundance (Supplementary Fig. S3). A plausible explanation is that nosZ genes were not actively transcribed, as gene expression rather than gene abundance has been shown to govern N2O reduction[50]. In contrast, dung deposition resulted in a higher DEA than urine treatment during the late period (Supplementary Fig. S2), a phenomenon likely driven by greater nirS gene abundance (Supplementary Table S2), which could enhance denitrification-associated N2O production[44]. However, this had a negligible impact on total N2O emissions. This is because 73.8% of the cumulative N2O from the DA treatment had already been emitted during the early phase. Consequently, the late-stage increases in denitrification potential in the DA treatment was insufficient to alter the overall N2O emission pattern. Overall, the UA treatment exhibited substantially higher N2O emission than the DA treatment, driven by greater nitrification throughout the entire period and enhanced denitrification during the early period.
Antagonistic effect of urine and dung application on soil N2O emission
-
Our results indicated that the UDA treatment exhibited significantly higher N2O emissions than the CK treatment (Fig. 5). This finding is consistent with previous results reported by Lombardi et al.[9] and Zhu et al.[8]. As with individual urine and dung applications, this increase was primarily driven by increased soil N and C availability (Fig. 2).
A key and unexpected finding of this study was that cumulative N2O emission under the combined urine and dung application was significantly lower than the theoretical additive emission from the individual applications (Fig. 6b). This antagonistic effect indicates that the observed emissions from the combined treatment were substantially lower than the sum of the emissions from the urine-only and dung-only treatments. This result contradicts the second hypothesis and diverges from previous findings[8,9,18]. Such interaction might be dependent on soil moisture. According to the summarized data from published studies, the mean ratios of N2O emissions from overlapping urine and dung patches to the theoretical sum of emissions from individual patches were < 1 under dry conditions and > 1 under wet conditions (Table 2). Low moisture content probably restricts the formation of anaerobic microsites, thereby suppressing N2O production via denitrification[9,51]. Accordingly, the antagonistic effect observed in the study is likely attributable to the prevailing dry conditions, as indicated by the soil WFPS remaining below 50% throughout the experiment (Fig. 1).
Moreover, combined urine and dung application resulted in higher N2O emissions than dung application alone (Fig. 5), consistent with the majority of published research[8,26,28]. The underlying mechanism is attributed to the greater availability of N substrates in the UDA treatment compared to the DA treatment (Fig. 2), which stimulated higher abundances of AOB amoA and nirS genes (Supplementary Table S2) and consequently promoted N2O production via both denitrification and nitrification[40,52].
However, soil N2O emission following combined urine and dung application was comparable to that from the urine-only treatment (Fig. 5), indicating a net null-effect from dung addition to urine patches. Our findings reveal that this apparent lack of change masks a shift in the microbial pathways: adding dung to the urine patch fundamentally alters denitrification rather than nitrification (Supplementary Tables S2, S3). Specifically, readily available C from overlapping dung-to-urine patches could accelerate microbial oxygen consumption (Supplementary Tables S2, S3), creating more anaerobic microsites favorable for denitrification[53]. This is supported by a significant increase in nirS gene abundance and higher DEA under the UDA treatment (Supplementary Table S2), which would theoretically enhance N2O production. Nevertheless, this enhanced production potential was effectively counteracted by a greater capacity for N2O reduction. The negative correlation between nosZ and soil N2O emissions (Supplementary Fig. S3) points to this mechanism. It is possible that the higher DOC concentration in the UDA treatment (Fig. 2), combined with wetter soil conditions (Fig. 1), promoted a more complete reduction of N2O to N2[15]. Consequently, the UDA treatment exhibited a nir/nos ratio comparable to the UE treatment (Fig. 4; Supplementary Table S2), indicating a dynamic balance between N2O production and consumption. In contrast, nitrification was not stimulated by dung addition. Key indicators—such as concentrations of NH4+-N and NO3−-N, the abundances of AOA amoA and AOB amoA genes, and NEA—were all statistically similar between the UDA and UA treatments (Supplementary Tables S2, S3; Supplementary Fig. S2). Therefore, similar N2O emissions between the UDA and UA treatments likely result from a new equilibrium in which increased production was offset by enhanced reduction capacity.
Limitations and implications
-
While this study identified a significant antagonistic effect of combined urine and dung application on N2O emissions, several limitations warrant consideration. First, the underlying microbial mechanisms, particularly regarding the N2O reduction pathway, remain partially unresolved. Our results on the shift in denitrification pathways were primarily based on gene abundance (e.g., nosZ and nirS). However, gene abundance does not necessarily reflect actual enzymatic activity or gene expression levels. The weak correlation between nosZ abundance and N2O emissions suggests that transcriptional regulation is the dominant controlling factor. Consequently, the specific role of N2O reduction in mitigating emissions under combined application requires verification through gene expression analysis (e.g., RT-qPCR) or 15N stable isotope tracing techniques[54].
Second, the observed antagonistic effect was largely attributed to the prevailing low soil moisture conditions (WFPS < 50%), which likely restricted the formation of anaerobic microsites. It remains unclear whether this antagonism persists under higher soil moisture or variable field conditions, where wetter environments might shift the interaction toward synergism. Furthermore, this study was conducted using a single soil type, thereby failing to capture the spatial heterogeneity of excreta patches and potential interactions with plant roots. Therefore, the universality of these findings needs to be verified across multiple grassland soil types under diverse field conditions to develop more robust emission inventories and mitigation strategies for grazed ecosystems.
-
Our study investigated the effects of yak excreta deposition on soil N2O emissions in an alpine meadow, revealing distinct responses to urine and dung application. Yak urine deposition induced significantly greater N2O emissions than dung deposition. More importantly, it was observed that an antagonistic effect on cumulative N2O emission when urine and dung patches overlapped, with total emission lower than the sum of the individual applications. Therefore, the findings highlight a critical consideration for greenhouse gas budgeting: soil N2O emissions from congregation sites, where urine and dung are co-deposited, should not be extrapolated from the separate effects of urine and dung deposition to the wider grazing grassland.
-
It accompanies this paper at: https://doi.org/10.48130/nc-0026-0005.
-
Not applicable.
-
The authors confirm their contributions to the paper as follows: Bo Fan: conducted the experiment, analyzed the data, made the figures and tables, and wrote the first draft; Wenting Jiang: revised the manuscript and provided editorial advice; Yan Wang: revised the manuscript and provided editorial advice; Haibin Liang: designed and conducted the experiment; Huai Chen: revised the manuscript and provided editorial advice; Dongwei Liu: revised the manuscript and provided editorial advice; Kumuduni Niroshika Palansooriya: revised the manuscript; Yanjiang Cai: conceived the study, designed the experiment, revised the manuscript and provided editorial advice. All authors reviewed and approved the final manuscript.
-
All data generated or analyzed during this study are included in this published article and its supplementary information files.
-
This research was funded by the National Natural Science Foundation of China (Grant Nos 41877085, 41573070), and the Research and Development Fund of Zhejiang A&F University (Grant Nos 2018FR005, 2018FR006).
-
The authors declare that they have no known competing financial interests or personal relationships that could have appeared to influence the work reported in this paper.
-
Full list of author information is available at the end of the article.
- The supplementary files can be downloaded from here.
- Copyright: © 2026 by the author(s). Published by Maximum Academic Press, Fayetteville, GA. This article is an open access article distributed under Creative Commons Attribution License (CC BY 4.0), visit https://creativecommons.org/licenses/by/4.0/.
-
About this article
Cite this article
Fan B, Jiang W, Wang Y, Liang H, Chen H, et al. 2026. Co-application of yak urine and dung deposition antagonistically affected soil nitrous oxide emissions in an alpine meadow. Nitrogen Cycling 2: e018 doi: 10.48130/nc-0026-0005 

Co-application of yak urine and dung deposition antagonistically affected soil nitrous oxide emissions in an alpine meadow
- Received: 14 January 2026
- Revised: 10 March 2026
- Accepted: 22 March 2026
- Published online: 13 April 2026
Abstract: Owing to a substantial nitrogen (N) surplus persisting after plant uptake, livestock urine and dung patches on grazed grasslands have become significant hotspots for nitrous oxide (N2O) emissions, a potent greenhouse gas with high ozone-depleting potential. Overlapping urine and dung patches at congregation sites are thought to amplify N2O emissions, yet the interactive effects are not well quantified. An in-situ field experiment was conducted to investigate the responses of soil N2O emissions to yak (Bos grunniens) excreta deposition, including without excretion application (CK), urine application (UA), dung application (DA), and combined urine and dung application (UDA), in an alpine meadow on the Qingzang Plateau (QP). Cumulative N2O emissions were significantly greater in the UA treatment compared to the DA treatment, a disparity likely driven by greater nitrification throughout the entire period and enhanced denitrification during the early period. Cumulative N2O emission in the UDA treatment was comparable to that in the UA treatment, likely reflecting an equilibrium where increased production was offset by enhanced reduction capacity. Notably, an unexpected antagonistic effect was observed in overlapping urine and dung patches, where cumulative N2O emissions were far below the theoretical additive value of the individual applications. Our findings highlight that the overlapping deposition of yak urine and dung at congregation sites may not be estimated by the contribution of urine and dung deposition to soil N2O emissions from grazing grasslands.
-
Key words:
- N2O emissions /
- Urine and dung /
- Antagonistic effect /
- Greenhouse gas /
- Grazing grassland