-
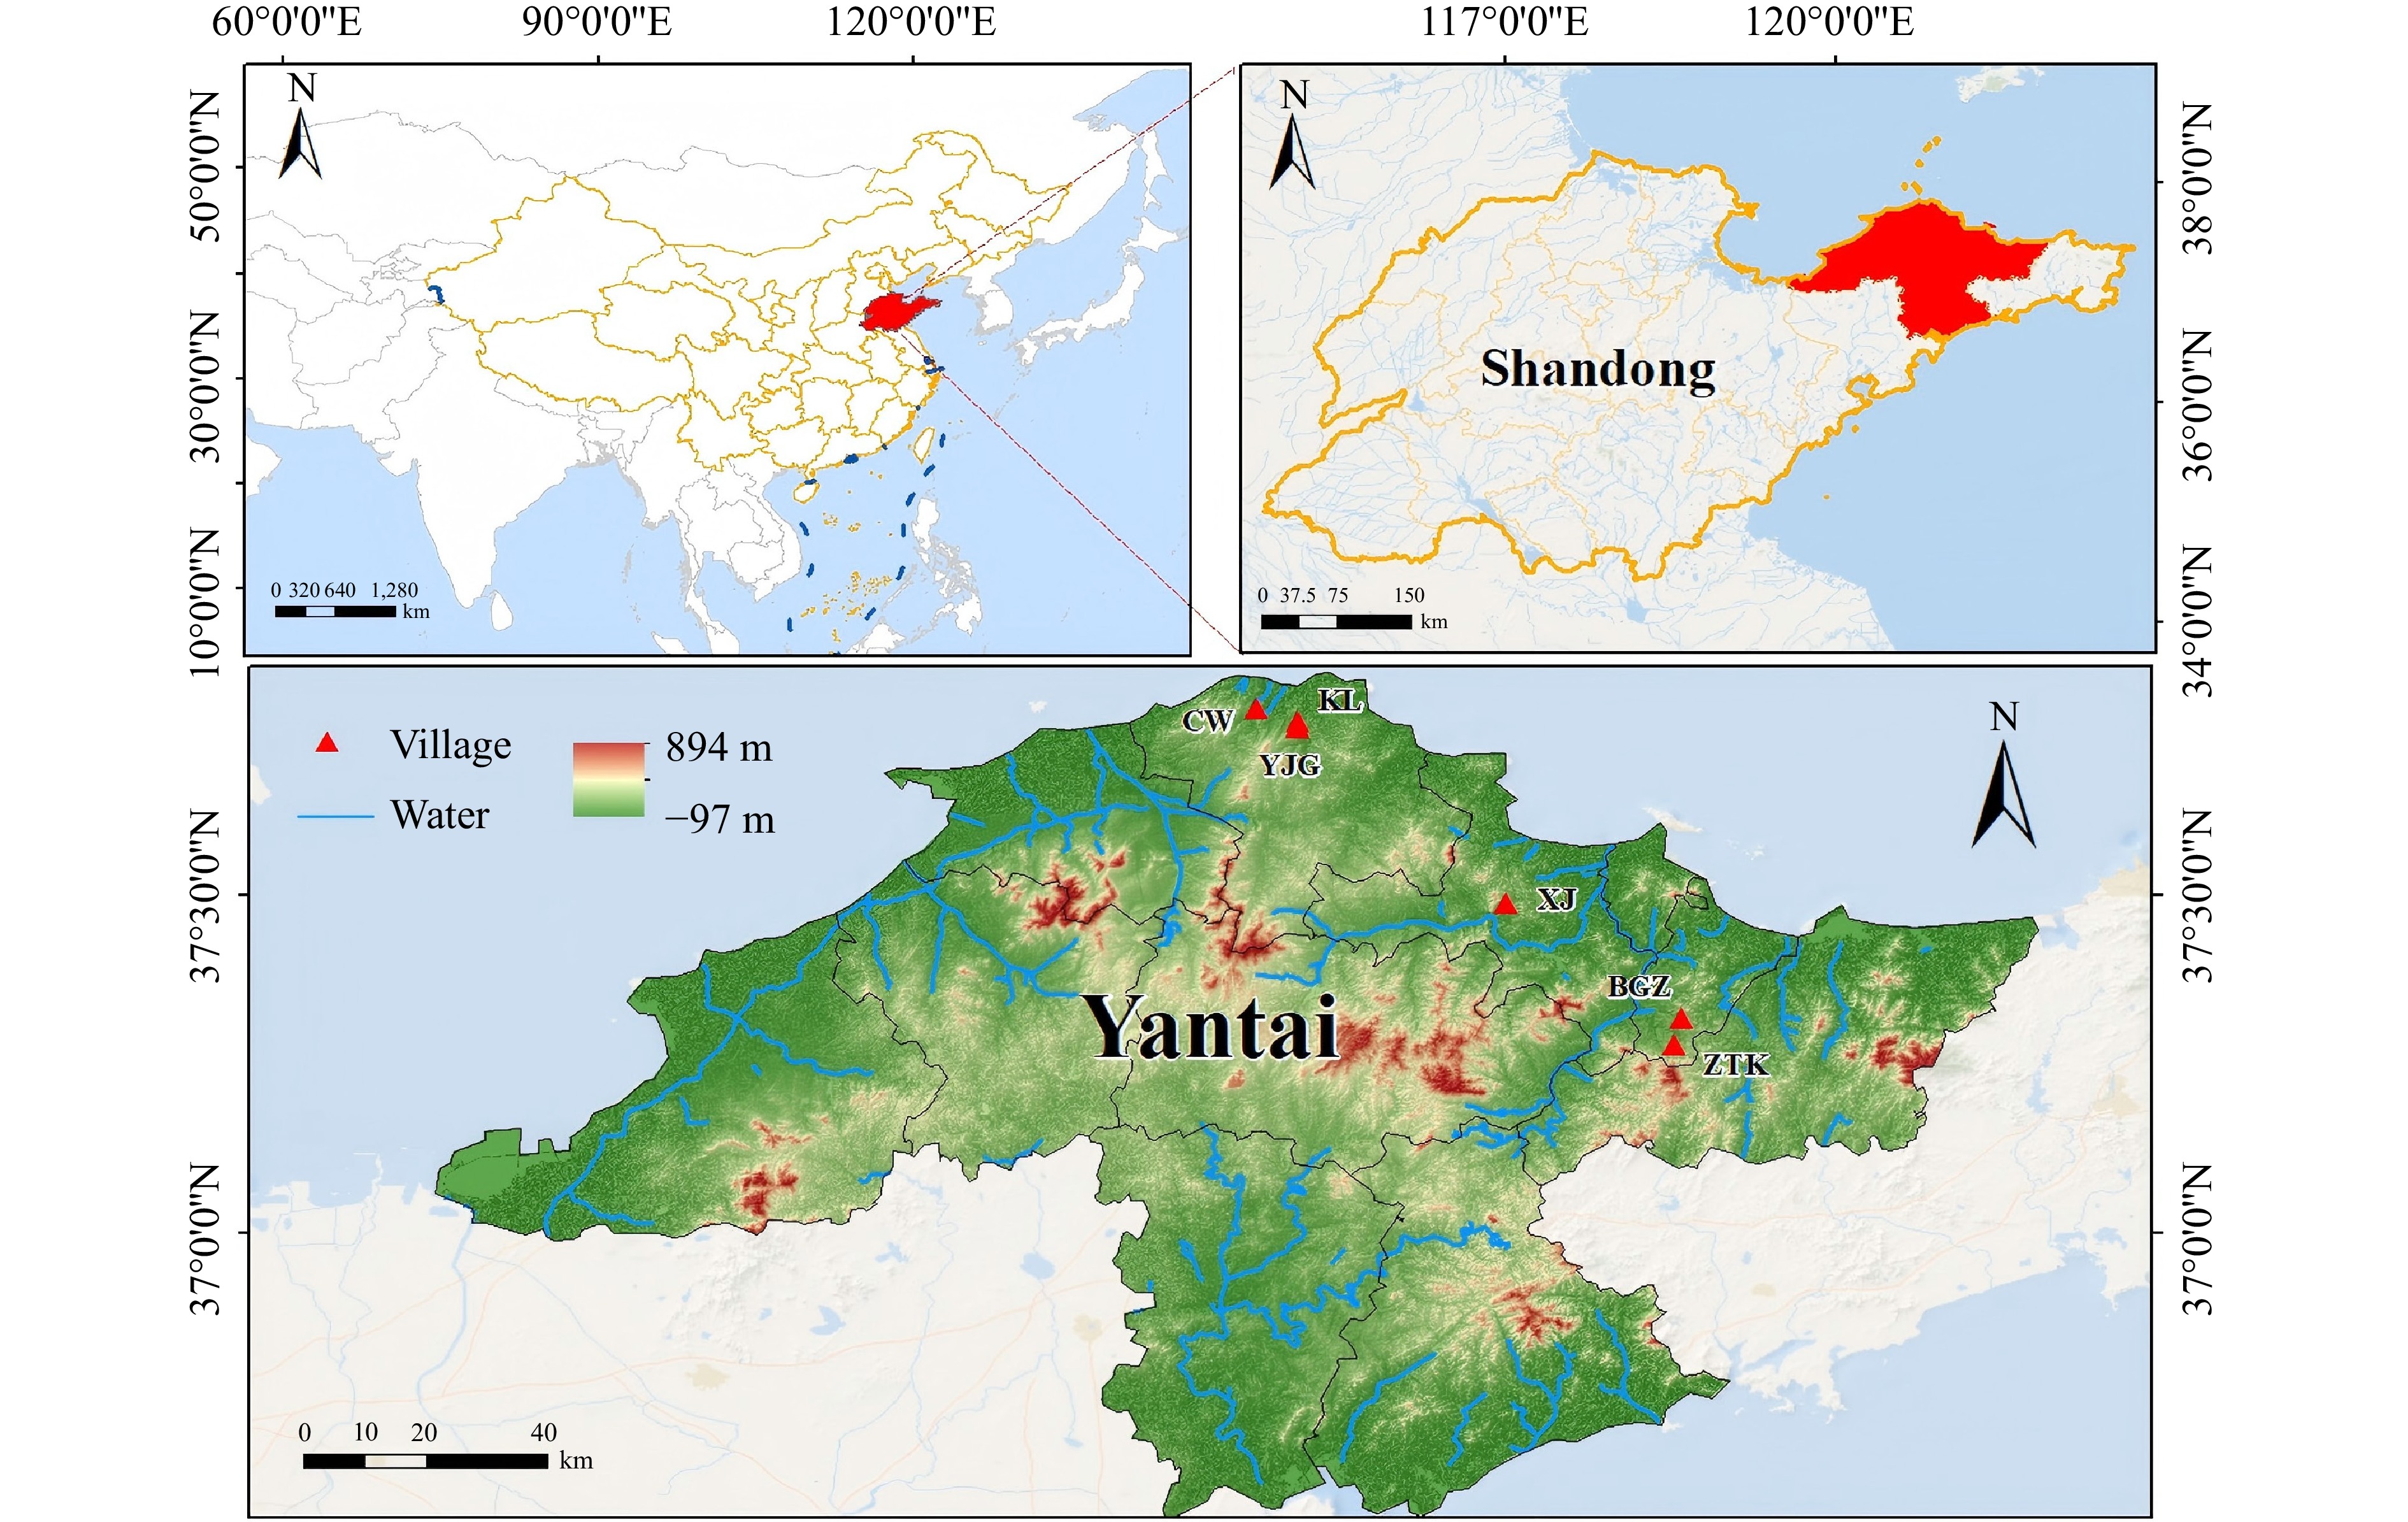
Figure 1.
Topographic map of the Yantai wine region and its subregions in Shandong, China. This map is based on the China Administrative Division Map (Review Number: GS(2023)2767-93) from the Standard Map Service System of the Ministry of Natural Resources.
-
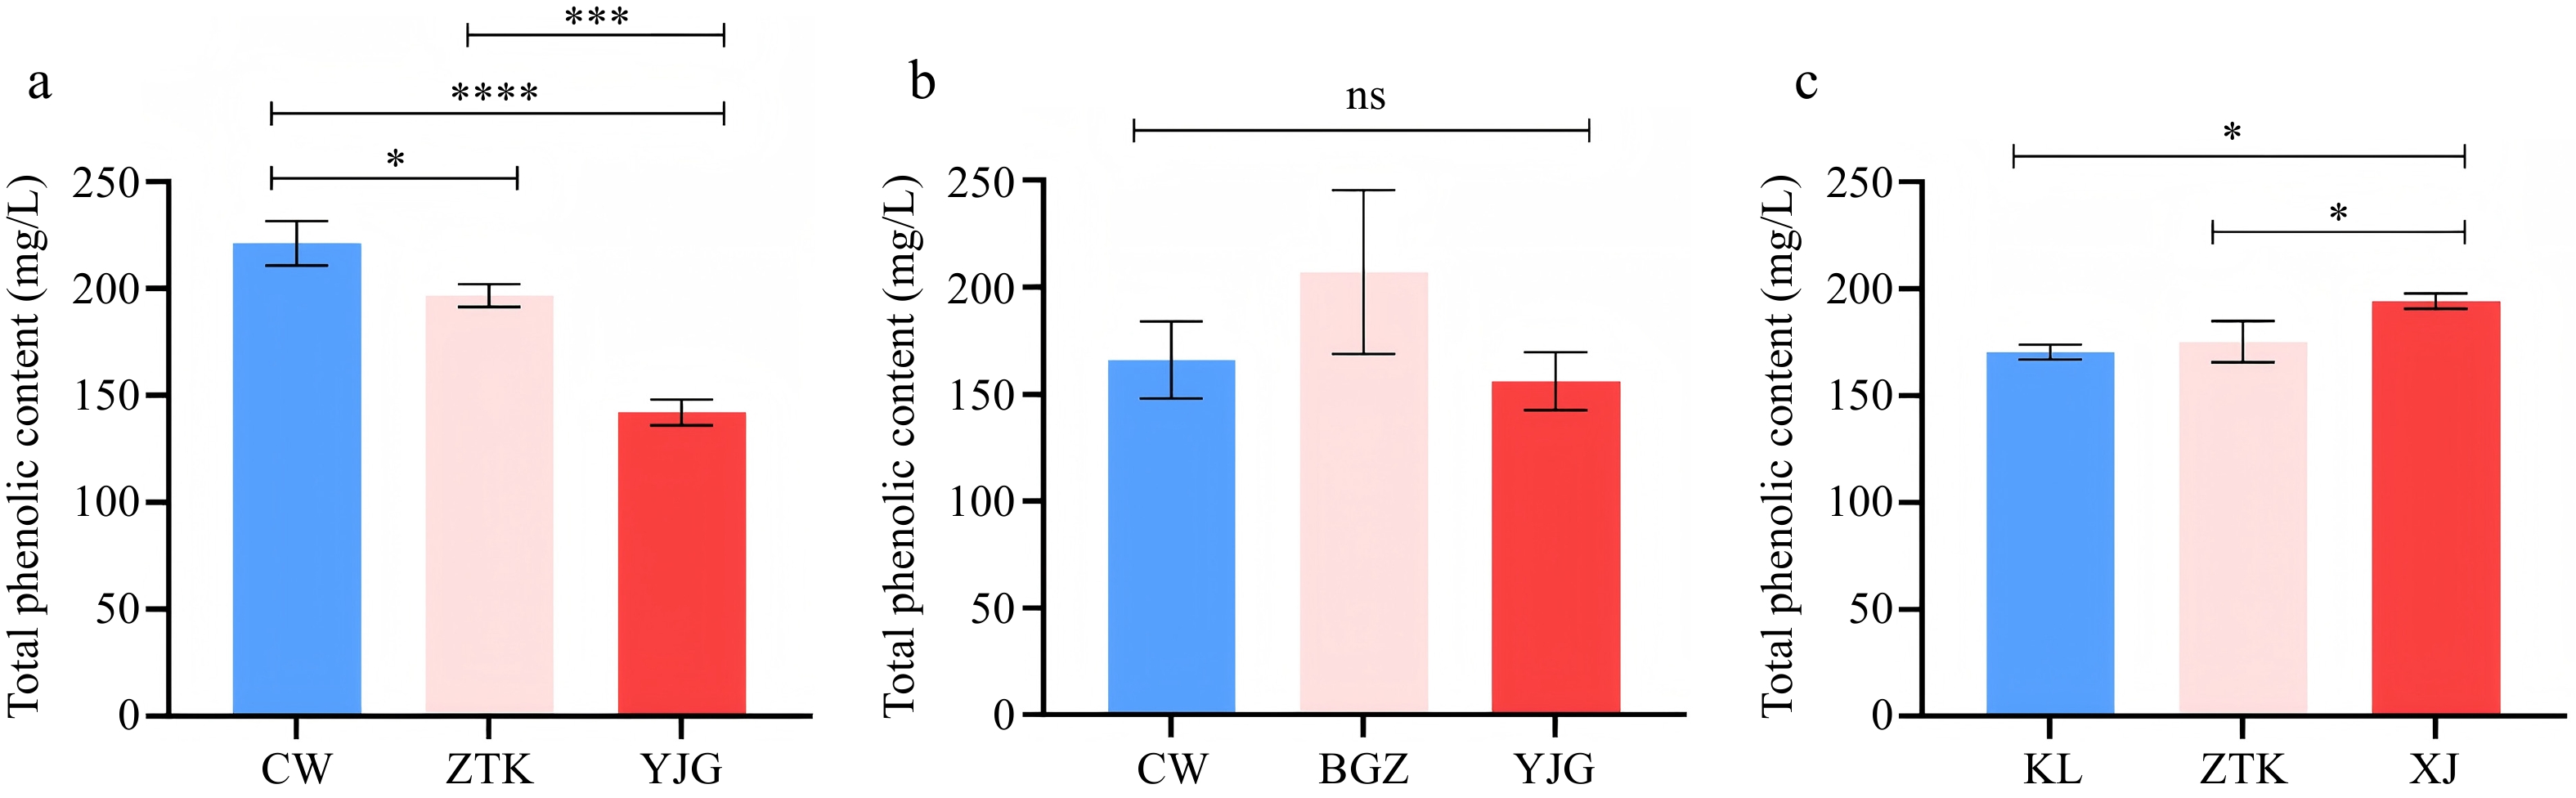
Figure 2.
Total phenolic content in (a) Chardonnay, (b) Italian Riesling, and (c) Petit Manseng from different regions. *, ***, and **** indicate significant differences at the 0.05, 0.005, and 0.001 levels, respectively; ns indicates no significant difference (p > 0.05).
-
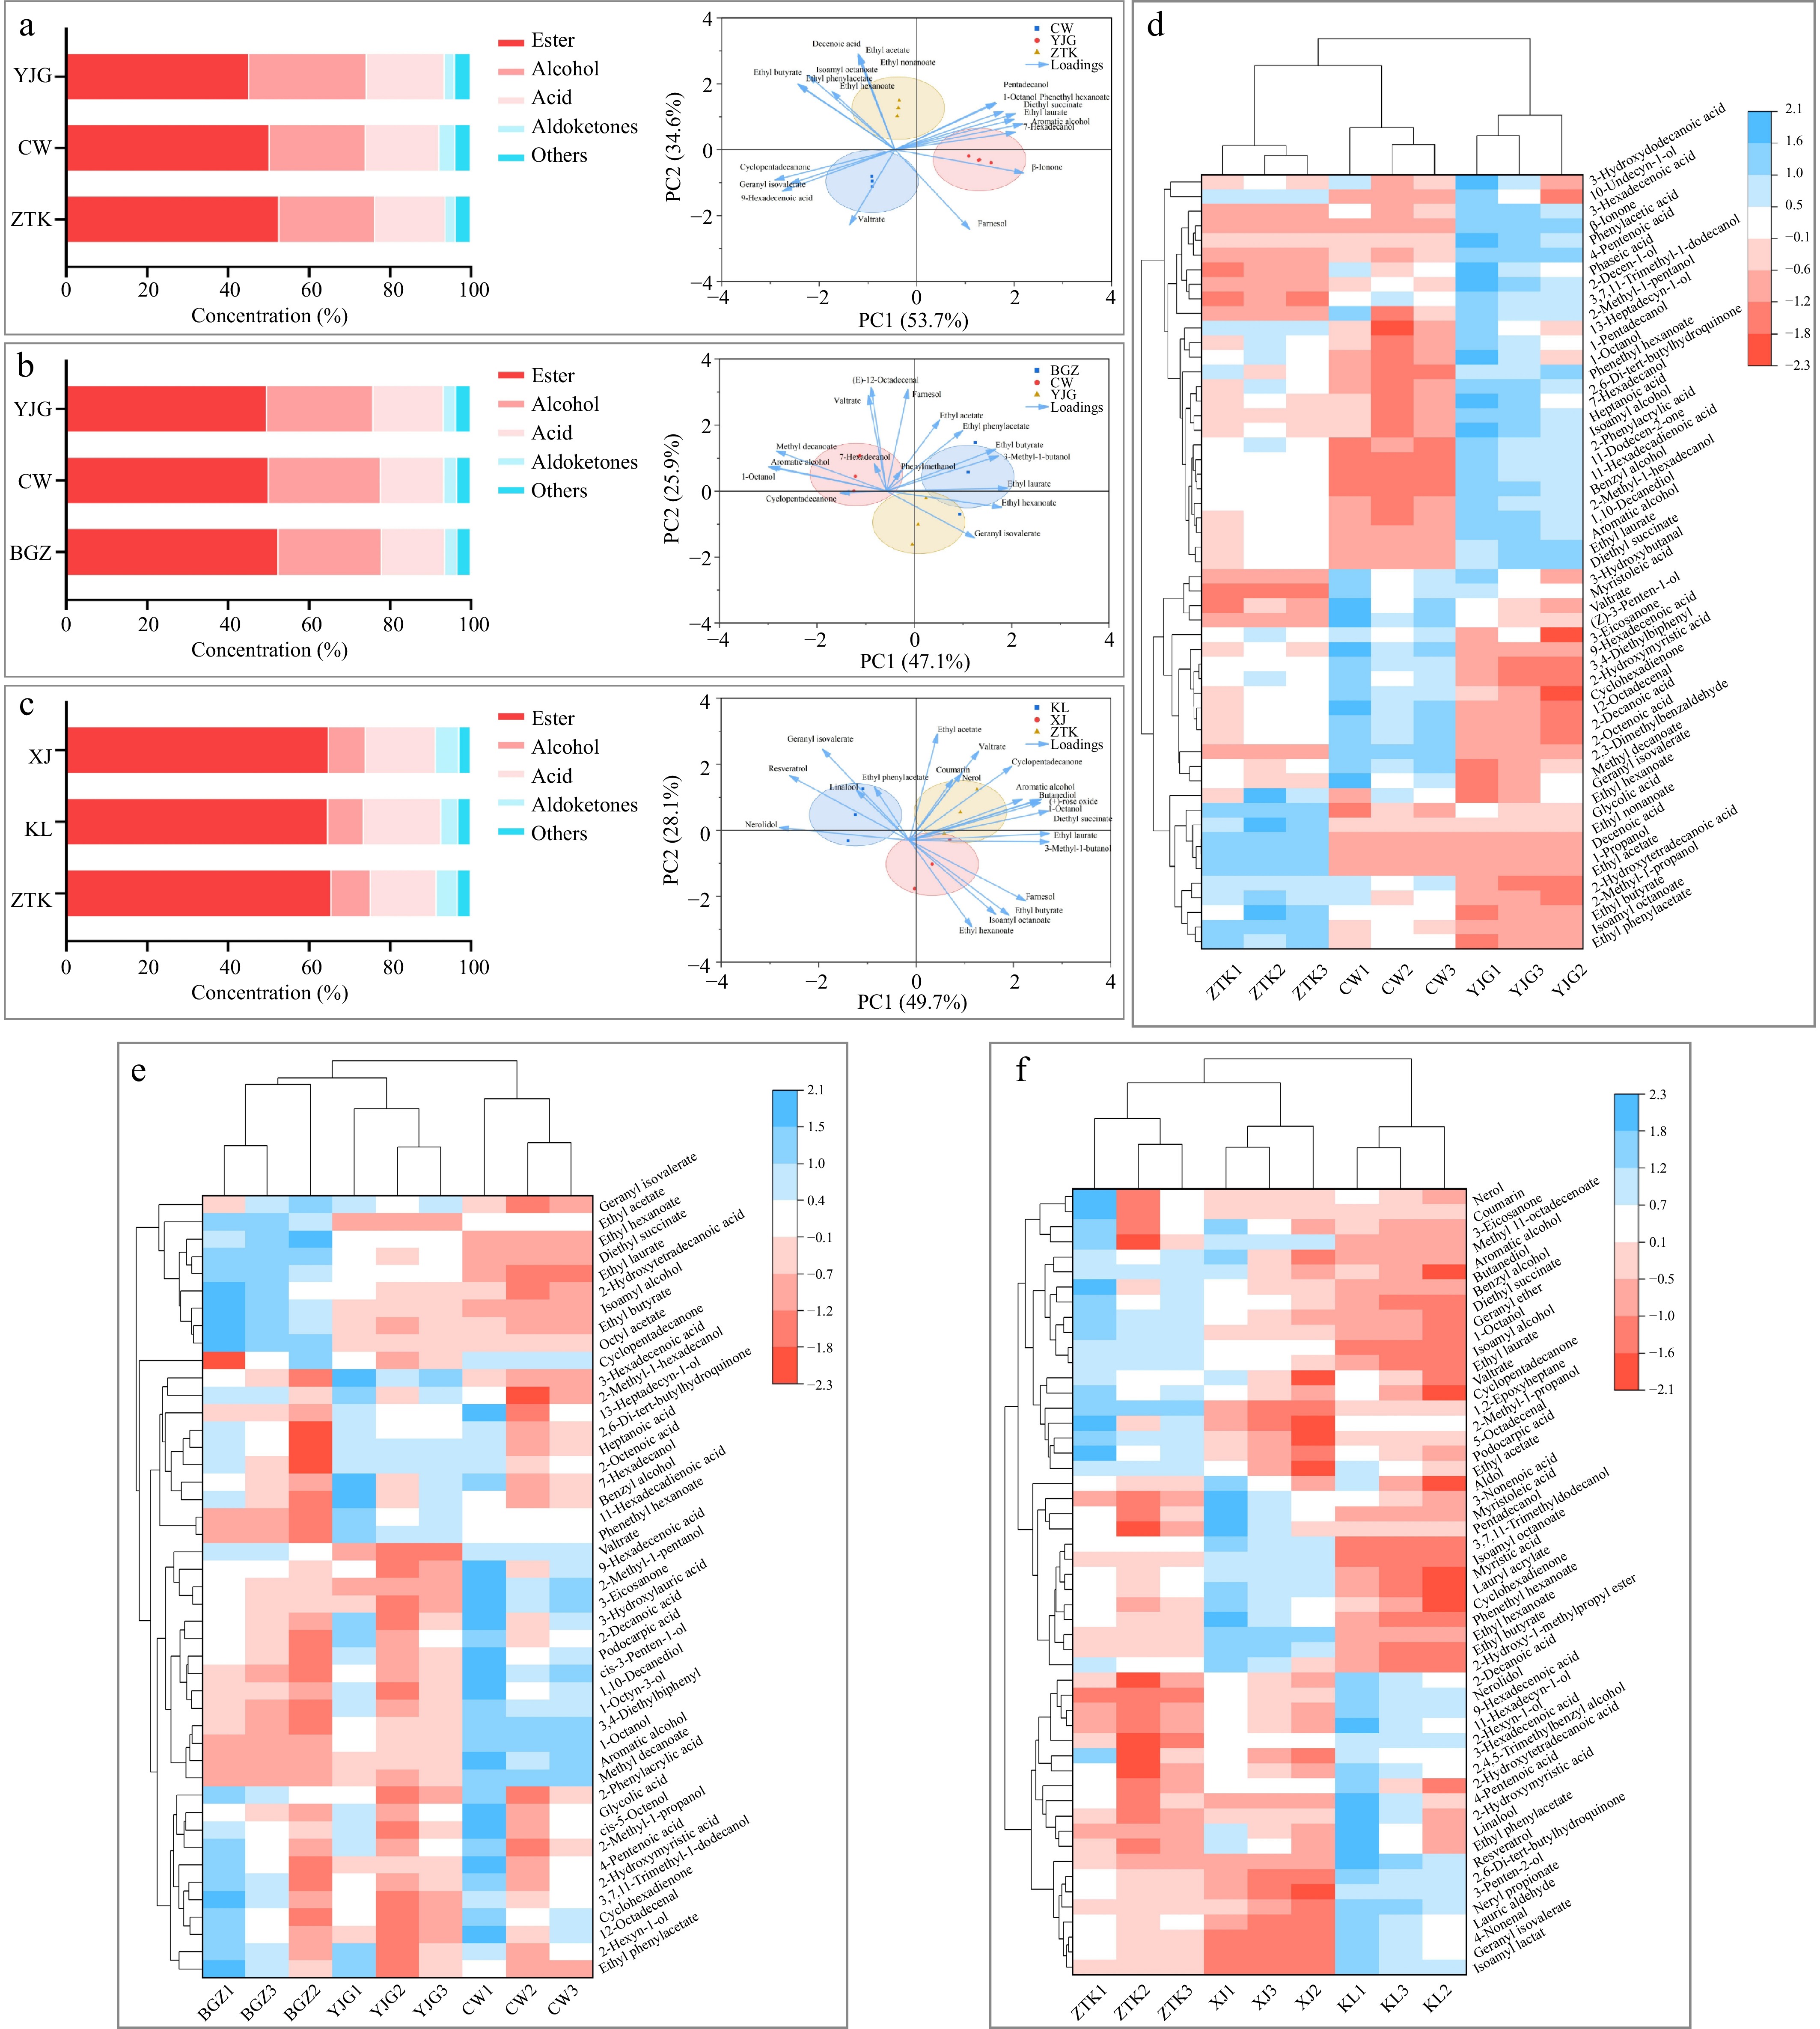
Figure 3.
Content of different aroma types and visual analysis of the aromas in different subregions using a biplot of (a) Chardonnay wine samples, (b) Italian Riesling wine samples, (c) Petit Manseng wine samples. Hierarchical clustering of aroma components at p < 0.05 of (d) Chardonnay wines, (e) Italian Riesling wines, and (f) Petit Manseng wines.
-
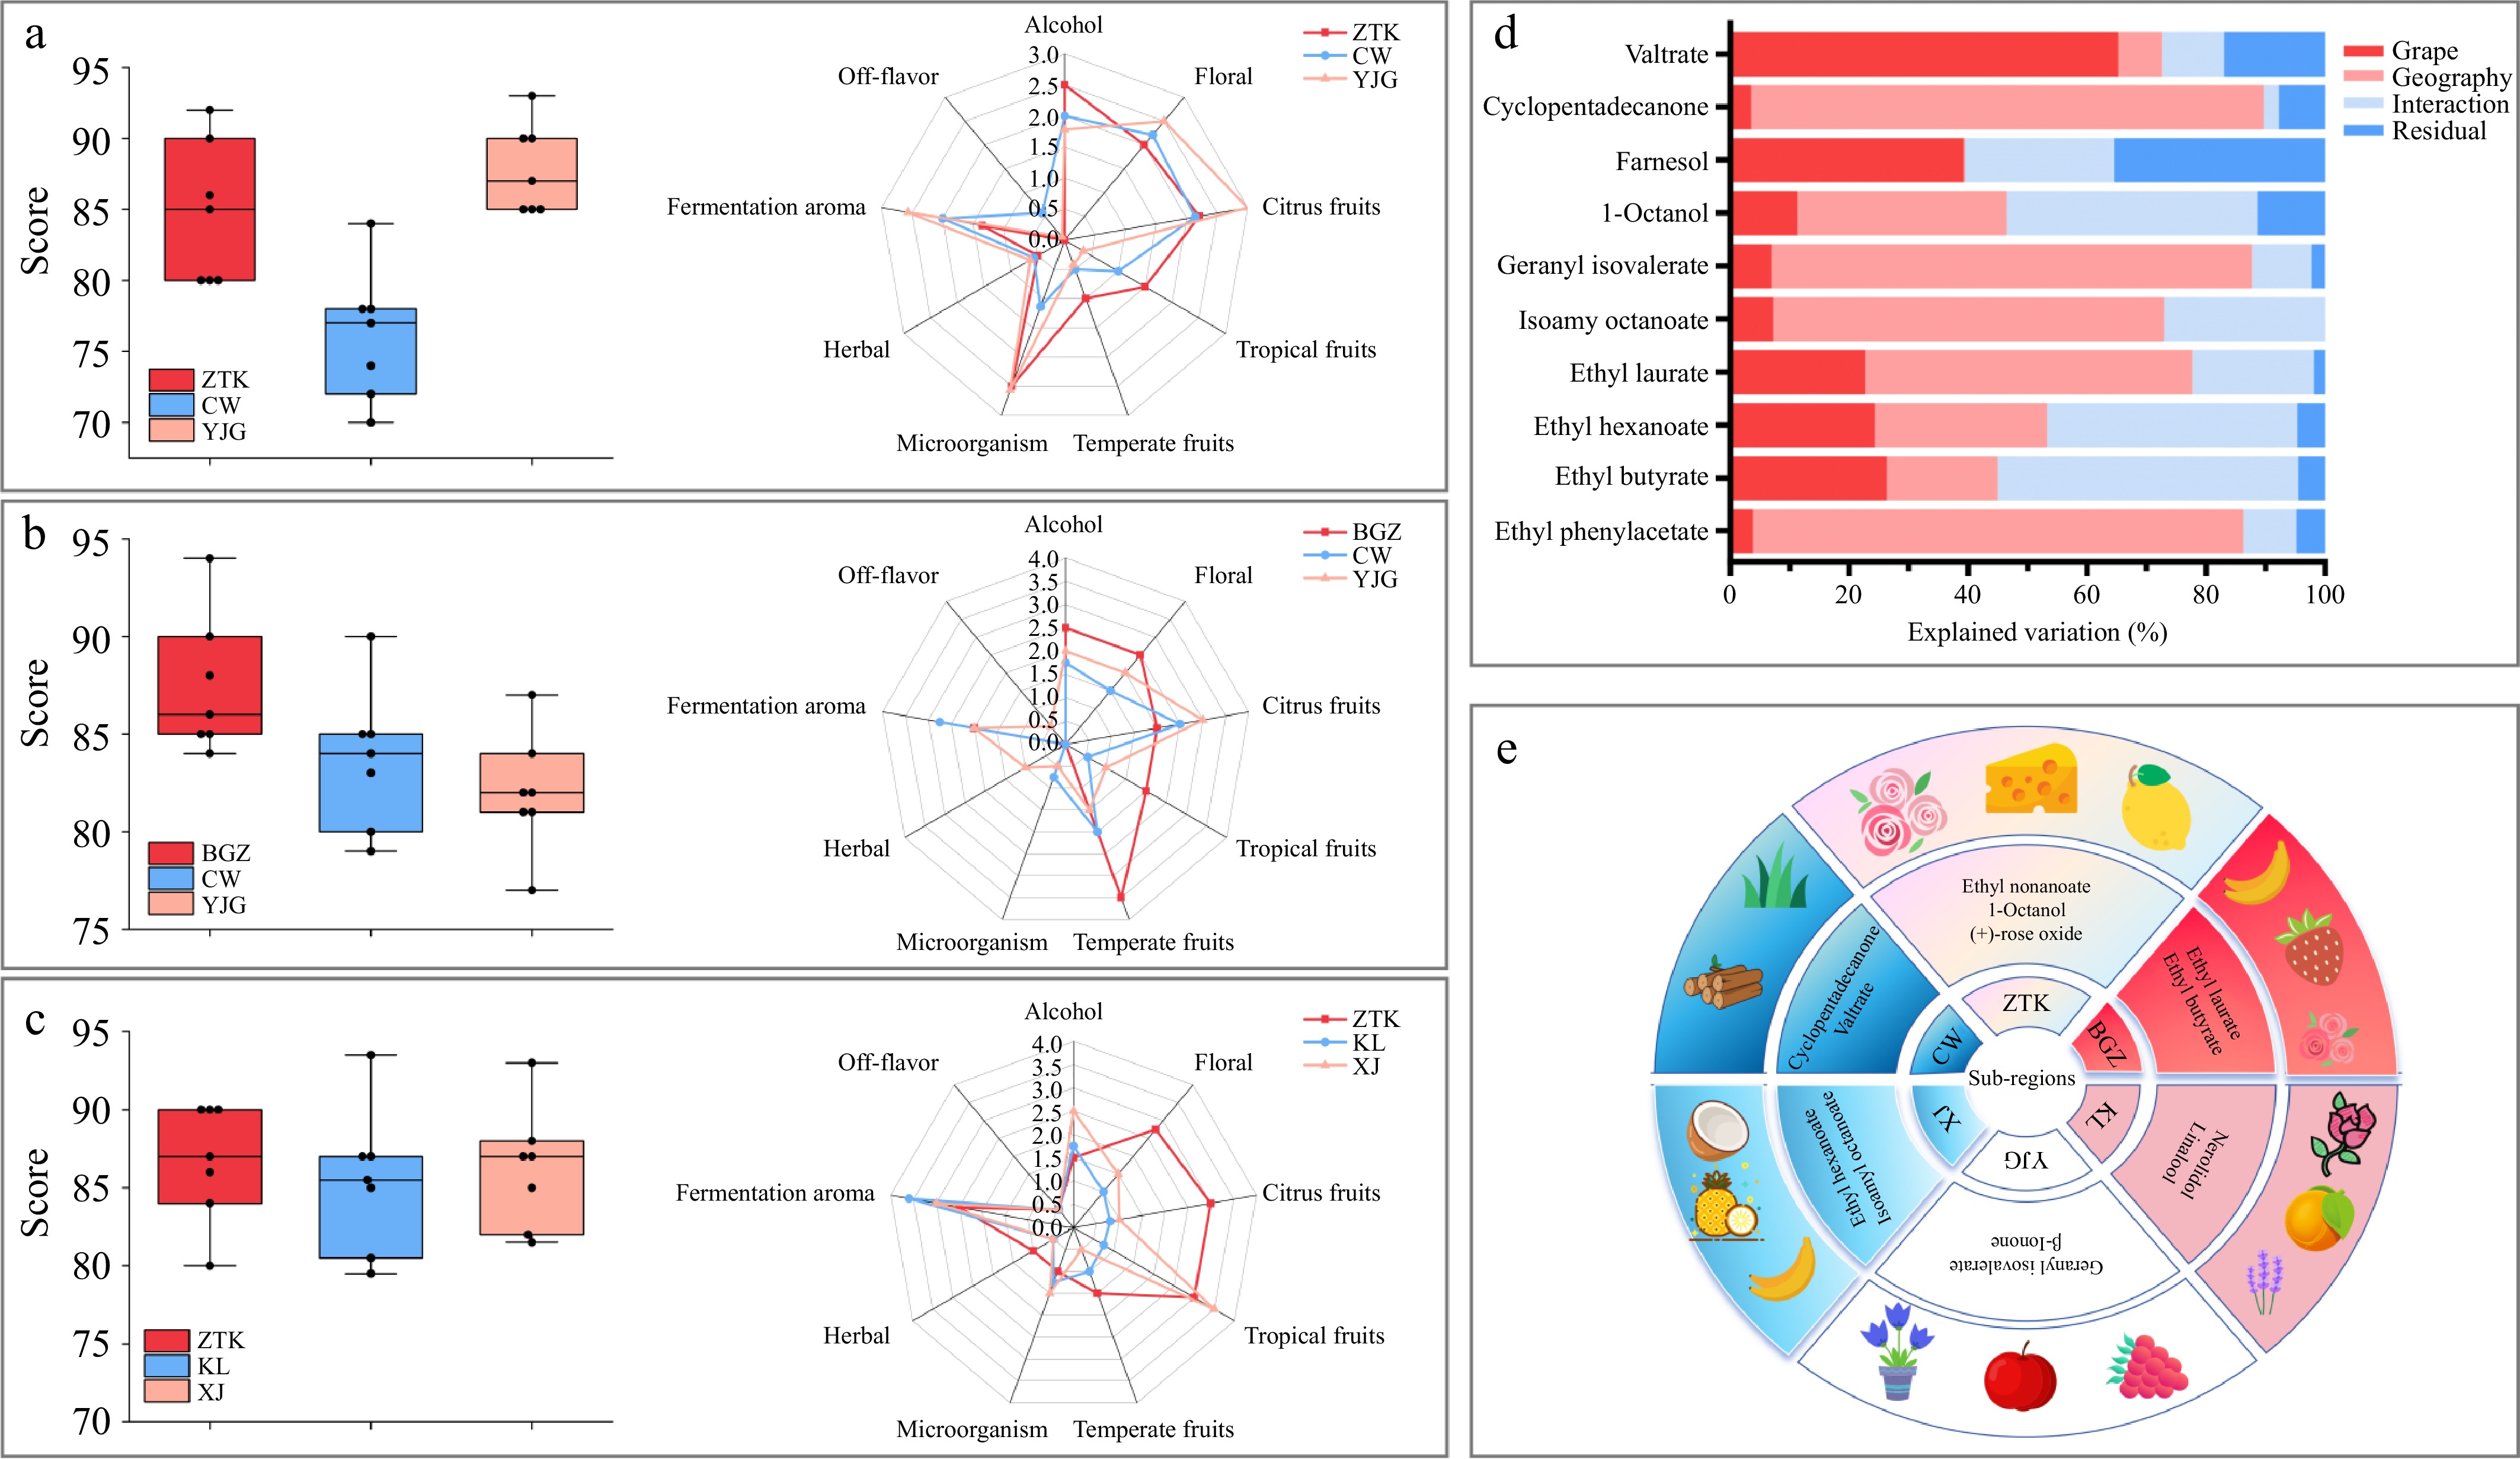
Figure 4.
The box plot of scores and flavor radar chart of different dry white from different subregions: (a) Chardonnay; (b) Italian Riesling; (c) Petit Manseng; (d) percentage of variation in various treatments attributed to strain, geography, their interactions, and residuals analyzed via two-way ANOVA; (e) each subregion is distinguished by its unique aroma compounds, especially when compared with commercial yeasts, along with the associated sensory aromas.
-
Grape variety Village Basic physicochemical indexes Residual
sugar
(g/L)Alcohol
content%
(vol)pH value Volatile acid
(g/L)Total acid
(g/L)Malic acid
(g/L)Succinic acid
(g/L)Tartaric acid
(g/L)Citric acid
(g/L)Lactic acid
(g/L)Chardonnay ZTK 3.82 ± 1.52a 9.93 ± 0.05a 2.98 ± 0.01b 0.45 ± 0.10c 7.68 ± 0.43b 3.13 ± 0.32b 2.22 ± 1.49a 9.07 ± 0.81a 0.41 ± 0.07a 0.57 ± 0.11a CW 3.91 ± 0.75a 7.50 ± 0.12c 2.87 ± 0.01c 1.03 ± 0.08a 8.73 ± 0.45a 4.60 ± 0.10a 1.59 ± 0.27a 7.16 ± 0.22b 0.41 ± 0.08a 0.47 ± 0.04a YJG 2.62 ± 0.45a 9.21 ± 0.00b 3.05 ± 0.03a 0.72 ± 0.20b 7.80 ± 0.19b 3.57 ± 0.15b 1.60 ± 0.25a 8.79 ± 0.24a 0.66 ± 0.21a 0.45 ± 0.02a Italian Riesling BGZ 3.73 ± 0.51a 10.31 ± 0.36a 3.03 ± 0.03a 0.29 ± 0.06c 7.20 ± 0.68a 1.90 ± 0.18b 0.74 ± 0.22a 11.46 ± 1.71a 0.62 ± 0.07a 0.79 ± 0.13a CW 3.43 ± 0.15a 9.80 ± 0.27a 2.85 ± 0.04b 0.45 ± 0.08b 7.90 ± 0.63a 2.63 ± 0.40a 1.02 ± 0.29a 12.59 ± 2.08a 0.29 ± 0.03b 0.81 ± 0.11a YJG 3.17 ± 0.31a 10.20 ± 0.17a 2.78 ± 0.15b 0.99 ± 0.05a 8.75 ± 0.72a 2.90 ± 0.17a 2.46 ± 1.88a 13.65 ± 1.20a 0.28 ± 0.17b 0.64 ± 0.12a Petit Manseng ZTK 3.75 ± 1.94a 13.21 ± 0.52a 2.93 ± 0.09a 1.54 ± 0.01a 13.50 ± 2.14a 4.10 ± 0.65a 1.04 ± 0.13b 17.88 ± 1.91a 0.39 ± 0.05a 0.49 ± 0.06b KL 3.71 ± 0.02a 13.62 ± 0.07a 2.83 ± 0.02a 0.70 ± 0.01b 11.18 ± 0.02a 3.10 ± 0.06a 1.40 ± 0.11a 18.07 ± 2.14a 0.29 ± 0.01a 0.70 ± 0.01a XJ 2.40 ± 0.01a 14.15 ± 1.20a 3.01 ± 0.04a 0.72 ± 0.23b 8.92 ± 0.01b 2.30 ± 0.02a 1.33 ± 0.13ab 14.12 ± 0.03a 0.40 ± 0.06a 0.69 ± 0.07a Data are the mean of three replicate fermentations ± SD. Values within the same row followed by a common letter are not significantly different according to Tukey's honestly significant difference (HSD) test (p < 0.05). Table 1.
Basic physicochemical indexes of fermented dry white from different sub-regions.
-
Phenolic
compoundsChardonnay Italian Riesling Petit Manseng ZTK CW YJG BGZ CW YJG ZTK KL XJ C 0.50 ± 0.01a 0.33 ± 0.02a 0.14 ± 0.00b 0.44 ± 0.17a 0.40 ± 0.24a 0.12 ± 0.01a 0.18 ± 0.04a 0.16 ± 0.03a 0.17 ± 0.02a EC 0.33 ± 0.02a 0.51 ± 0.20a 0.32 ± 0.02a 0.28 ± 0.01a 0.31 ± 0.07a 0.29 ± 0.01a 0.96 ± 0.14a 1.04 ± 0.41a 0.36 ± 0.02a EgC 11.47 ± 2.15a 8.91 ± 1.52b 0.59 ± 0.25b 21.57 ± 3.79a 13.22 ± 4.12b 3.42 ± 2.30c 0.76 ± 0.36b 1.39 ± 0.46b 3.55 ± 1.42a EgCg 0.52 ± 0.01a 0.31 ± 0.18a 0.23 ± 0.01a 0.77 ± 0.21a 0.50 ± 0.07ab 0.42 ± 0.01b 0.45 ± 0.09a 0.56 ± 0.16a 0.79 ± 0.10a Quercetin 0.18 ± 0.01b 0.24 ± 0.01a − 0.67 ± 0.48a 0.18 ± 0.01a 0.10 ± 0.01a 0.15 ± 0.04a 0.37 ± 0.01a 0.16 ± 0.01a Quercitrin 0.24 ± 0.00b 1.11 ± 0.01a − − − − − − − Rutin 1.40 ± 0.46a 2.08 ± 0.09a 0.57 ± 0.00b 5.44 ± 0.06a 1.16 ± 0.33b 0.18 ± 0.01b 0.61 ± 0.292b 2.99 ± 0.01a 1.77 ± 0.01ab Myricetin − − − 0.83 ± 0.02b 1.25 ± 0.01a − − − − Gallic acid 0.78 ± 0.06b 8.04 ± 1.55a 1.05 ± 0.44b 1.38 ± 0.48a 1.24 ± 0.53a 1.09 ± 0.23a 1.45 ± 0.33a 1.70 ± 0.22a 2.03 ± 0.63a Protocatechuic acid 33.07 ± 5.86a 14.09 ± 0.66b 2.68 ± 1.70c 25.10 ± 3.95a 14.15 ± 3.19b 2.49 ± 1.49c 8.93 ± 0.47b 9.26 ± 1.02b 12.70 ± 1.03a Chlorogenic acid 4.49 ± 0.23ab 7.19 ± 0.36a 3.73 ± 0.21b 17.88 ± 11.15a 7.62 ± 1.50a 11.01 ± 1.56a 10.38 ± 1.31b 12.28 ± 3.42b 22.45 ± 3.65a Caffeic acid 2.54 ± 0.29a 2.76 ± 0.21a 0.77 ± 0.16b 6.26 ± 3.66a 2.52 ± 0.85a 0.92 ± 0.20a 1.35 ± 0.58a 1.71 ± 0.37a 2.08 ± 0.52a p-Coumaric acid 0.92 ± 0.15a 1.20 ± 0.89a 0.62 ± 0.15a 0.61 ± 0.01a 0.46 ± 0.18ab 0.23 ± 0.01b 1.35 ± 0.58a 0.99 ± 0.30a 2.03 ± 1.13a Ferulic acid 0.86 ± 0.06a 0.99 ± 0.09a 0.84 ± 0.01a 0.73 ± 0.21a 0.71 ± 0.08a 0.56 ± 0.03a 0.74 ± 0.05a 0.82 ± 0.19a 0.83 ± 0.25a Data are the mean of three replicate fermentations ± SD. Values within the same row followed by a common letter are not significantly different according to Tukey's HSD test (p < 0.05). Table 2.
Phenolic compounds of fermented dry white wines from different subregions (mg/L).
-
Volatile Compounds Threshold
(ug/L)Flavor Description Chardonnay Italian Riesling Petit Manseng ZTK CW YJG BGZ CW YJG ZTK KL XJ Ethyl phenylacetate 650 Honey, Sweet 0.6 0.52 0.44 0.34 0.29 0.31 0.28 0.32 0.31 Ethyl butyrate 35 Strawberry, Banana 63.56 57.28 49.36 72.32 57.08 59.39 62.75 56.47 73.37 Ethyl hexanoate 5 Pineapple, Banana 24.73 20.6 − − − − 19.96 13.86 42.73 Ethyl laurate 150 Fruity, Floral 1.39 0.25 0.96 − − − − − − Ethyl nonanoate 0.85 Fruity, Floral 29.78 − − − − − − − − Isoamyl octanoate 125 Pineapple, Coconut 0.4 0.18 0.61 − − − − − − 1-Octanol 110 Sour, Cheese 0.81 0.31 0.94 0.08 0.44 0.21 0.72 0.16 0.35 Farnesol 20 Floral, Green 6.66 8.21 8.9 7.54 7.28 5.54 5.42 4.38 6.02 β-Ionone 0.007 Violet − − 5182.86 − − − − − − (+)-rose oxide 0.5 Rose − − − − − − 25.12 17.44 20.04 Nerolidol 1 Floral, Cedar − − − − − − 1.38 3.75 2.45 Linalool 25 Rose, Musk − − − − − − 1.44 1.82 1.62 Table 3.
Odor activity values of important aroma compounds
Figures
(4)
Tables
(3)