


-
China's vast territory, with its diverse natural environment and geographical climate, has given rise to distinctive characteristics of grape cultivation and wine production, making it an important wine-producing region worldwide[1]. In addition to grape varieties influencing the quality of dry white wines, different grape-growing regions also have a significant impact on the quality of dry white wines. Therefore, exploring the quality characteristics of wines from different regions is of great significance for identifying optimal growing regions for different grape varieties[2].
Chardonnay is one of the most widely planted white grape varieties in the world[3]. The dry white wines produced from this grape are characterized by their elegant aroma, rich and intense fruit flavors, and notes of melon, tropical fruits, and citrus fruits. With aging, Chardonnay wines become mellow, well-balanced, and of exceptional quality[4]. Chardonnay is indigenous to Burgundy, France, where there are four main subregions for dry white wines: Bourgogne Blanc, Mâcon Blanc, Chablis Blanc, and Côte de Beaune Blanc. Among them, Bourgogne Blanc is simple and easy to drink, featuring fresh apple and lemon flavors with a hint of savory nuttiness. The Mâcon region, located in the southernmost part of Burgundy, has a warm climate. Consequently, its white wines are fuller and rounder. Dry white Chardonnay wines from Mâcon have a lighter body and more rustic, natural flavors. Chablis, situated at the northernmost tip of Burgundy and the coolest area in the region, produces the most acidic Chardonnay wines. Chablis Blanc is lighter than Bourgogne Blanc and is distinguished by its crisp fruit aromas of lime, green apple, and unripe pear[3]. Côte de Beaune Blanc, on the other hand, is known among the French Chardonnays for its intense flavors and strong body, with aromas of yellow apple, lemon, mushrooms, and truffles[5]. Petit Manseng is a white wine grape variety native to the Manseng grape family in southwestern France. It features small berries with thick skins, loose clusters, low yield, late ripening, and a long hanging period, boasting high sugar content and high acidity[6]. It is most commonly made into a richly sweet wine with fruit characteristics such as peach and apricot. However, in Zhuozhou, Hebei, wines produced from Petit Manseng grapes exhibit unique pineapple and pear aromas[7]. Therefore, even wines made from the same grape variety can show significant differences depending on the region of production and production methods.
Yantai's terrain, characterized by low hills and well-drained ravines, provides an ideal topography for viticulture by minimizing waterlogging and optimizing sun exposure. Furthermore, its temperate monsoon climate, moderated by the coastal influence, offers ample sunlight and a long ripening season, which are crucial for developing the complexity of grape flavors[8,9]. Yantai shares a similar latitude with France, both falling within the Northern Hemisphere's wine-growing latitude belt of 30°–52° N, and their climates are comparable. Therefore, Yantai is well-suited for the cultivation of wine grapes and wine production. As the birthplace of China's wine industry and a well-known grape and wine-producing region, Yantai has many grape-growing areas. The primary wine grape varieties cultivated include Cabernet Gernischt, Cabernet Sauvignon, Merlot, Italian Riesling, Chardonnay, Ugni Blanc, Marselan, and Petit Manseng, each with unique characteristics. These unique regional features contribute to the distinct quality of the wine produced. Factors such as soil type, rainfall, and light and heat conditions can affect the growth and development of grapes, as well as the composition of the grape berries, thereby influencing wine quality[10].
The Yantai wine region currently produces high-quality dry white wines. However, the characteristics of its grape varieties and subregions are not yet defined clearly, which has hindered the rapid development of Yantai's wine industry. This study focused on dry white wines of the same variety from different village-level subregions in Yantai as shown in Fig. 1. The selected subregions (villages) included Zhutangkuang (ZTK), Yujagou (YJG), Chouwang (CW), Keliu (KL), Xingjia (XJ), and Beigezhuang (BGZ). This study investigated three varieties of dry white wines: Chardonnay, Italian Riesling, and Petit Manseng. Fermentation was conducted using the same yeast strain (EC1118). The study analyzed the basic physicochemical indicators, organic acids, phenolic compounds, volatile compounds, and sensory characteristics. By exploring the differences in the quality characteristics of dry white wines from these subregions in Yantai, this study is of great significance for enhancing the market recognition of Yantai's wines and accelerating the development of the region's wine industry.
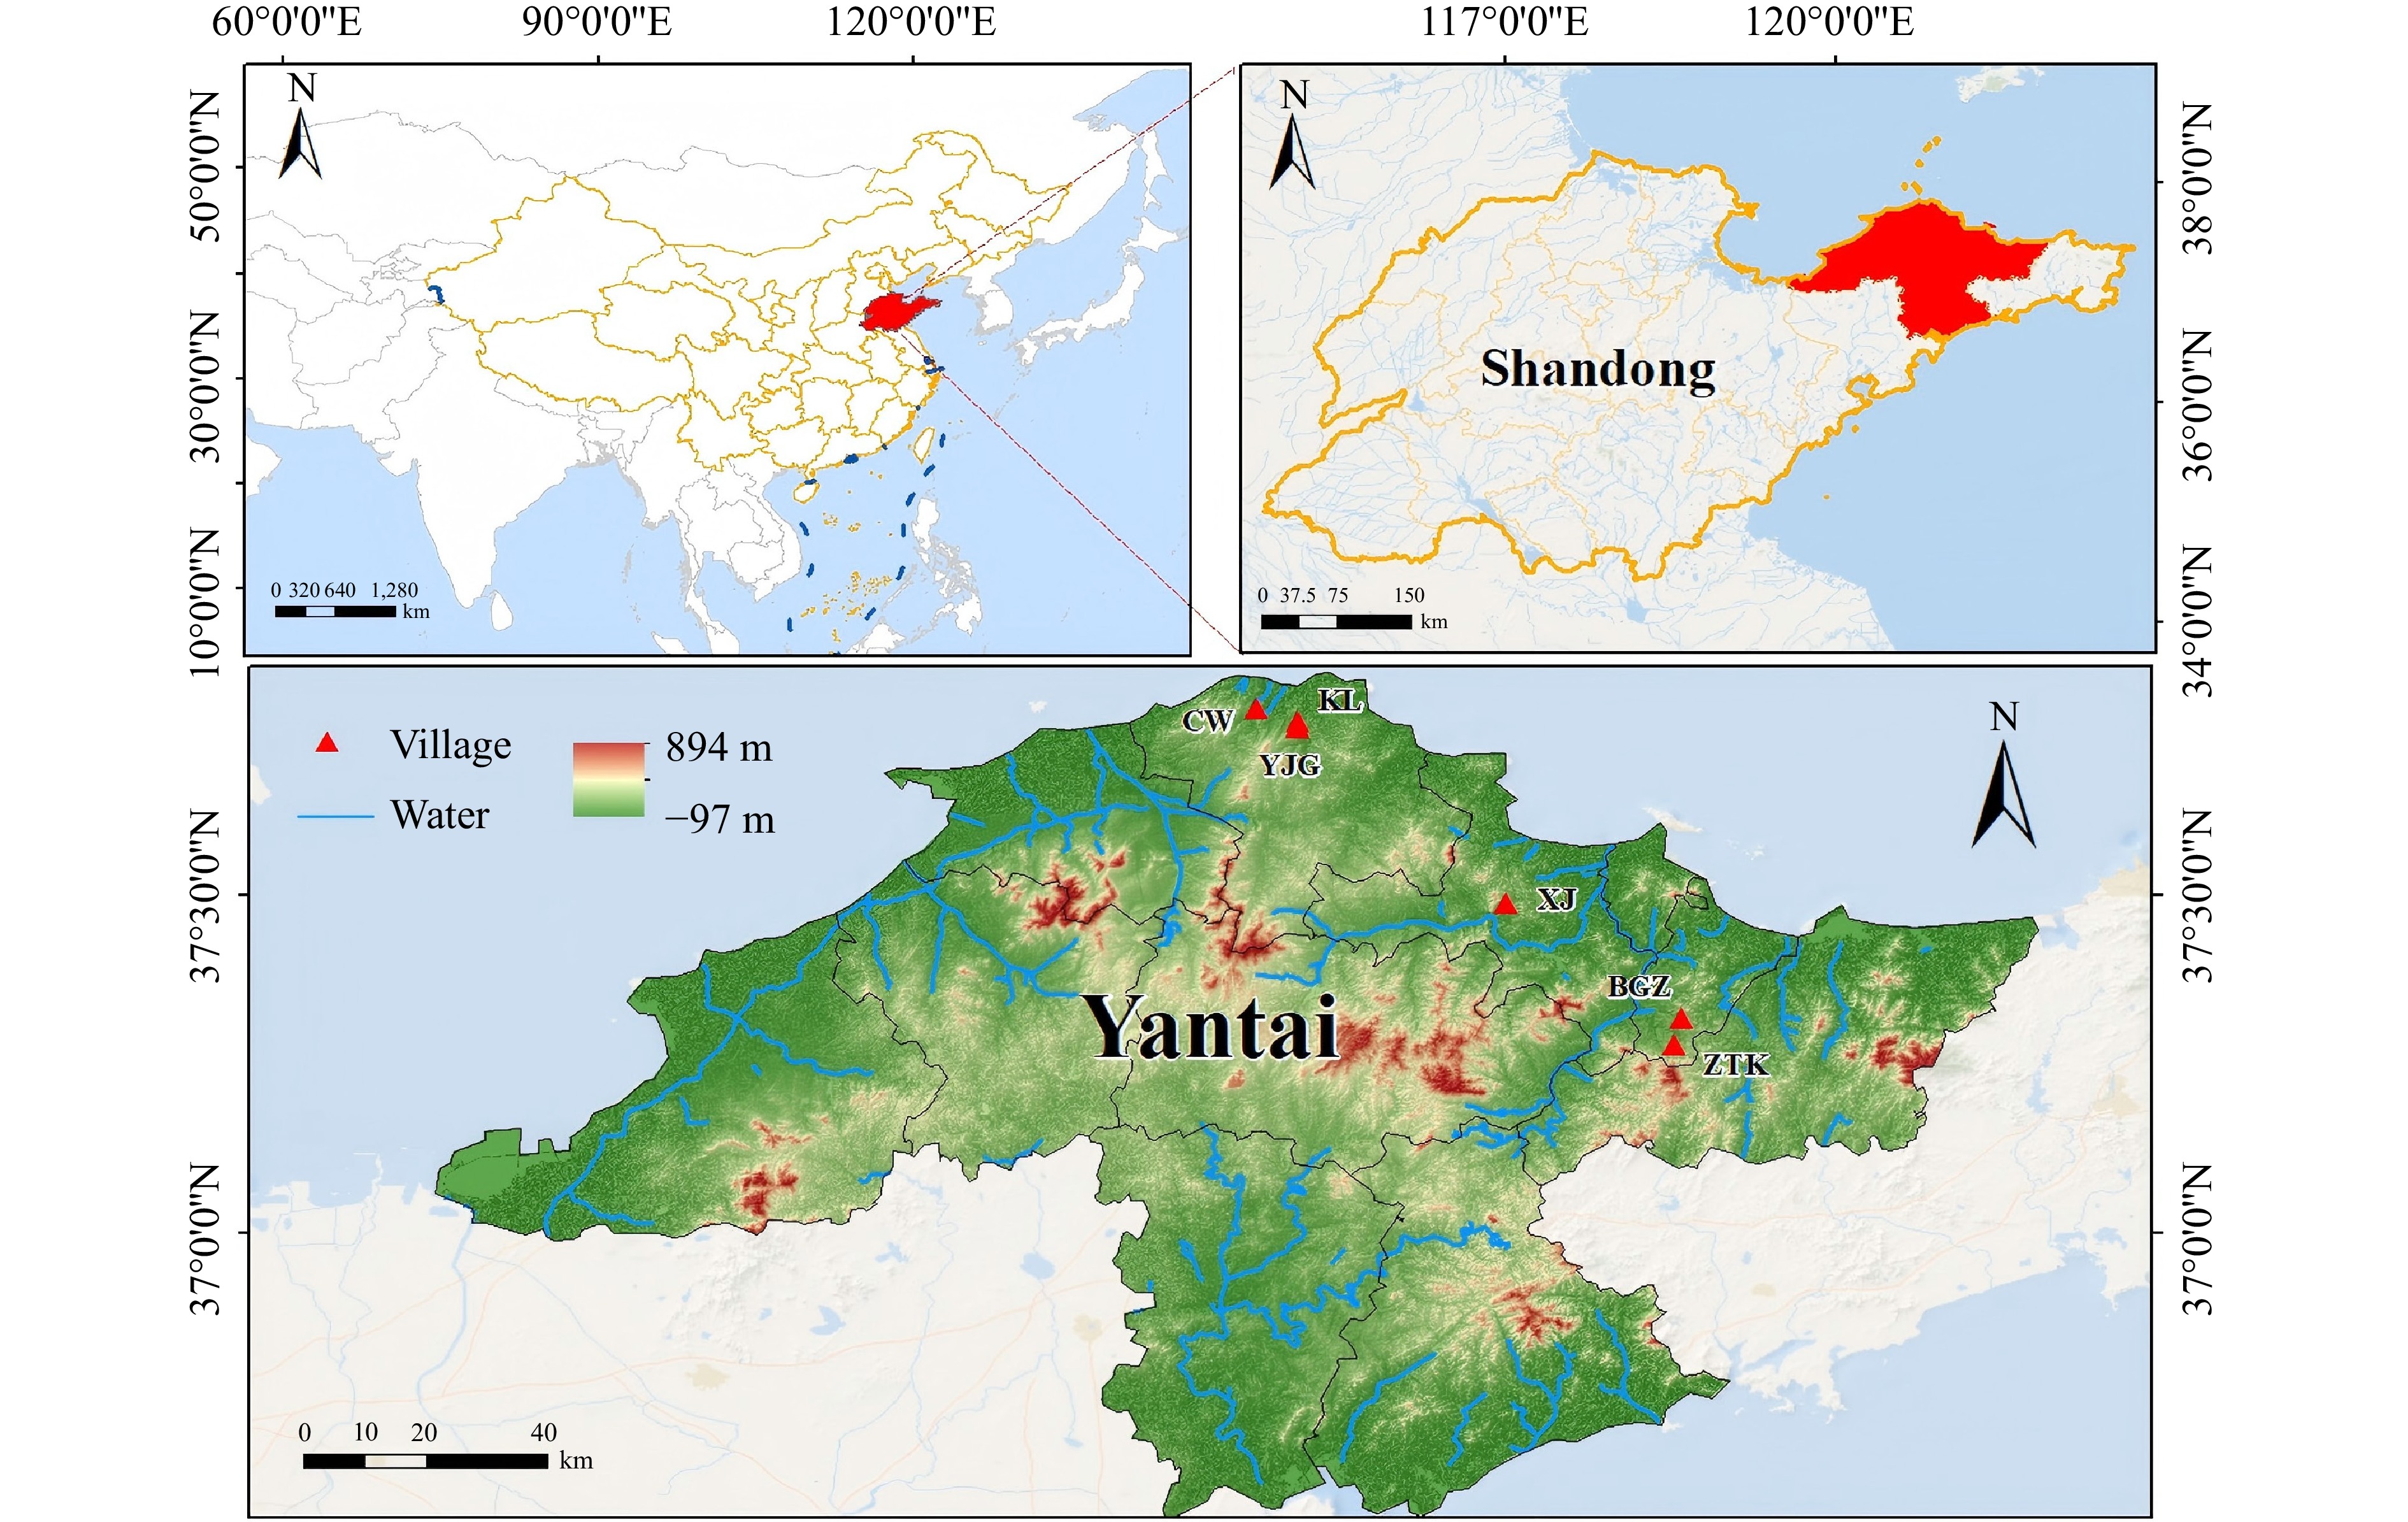
Figure 1.
Topographic map of the Yantai wine region and its subregions in Shandong, China. This map is based on the China Administrative Division Map (Review Number: GS(2023)2767-93) from the Standard Map Service System of the Ministry of Natural Resources.
-
In this experiment, three representative wine grape varieties from Yantai—Chardonnay, Petit Manseng, and Italian Riesling—were selected as the test materials in 2022. After evaluating the ripening periods of these grapes and coordinating the scheduling of harvesting personnel, specific harvesting locations for Chardonnay, Petit Manseng, and Italian Riesling in Yantai were identified. The locations where the raw grapes were harvested are shown in Supplementary Table S1, and the basic physical and chemical indicators of the grapes are listed in Supplementary Table S2. Because of the constraints imposed by the cultivation conditions, not every grape variety is cultivated across all subregions.
Grape berries were processed and fermented as described by Chambers[11]. Grape processing mainly includes several steps, such as harvesting, raw material selection, destemming, and crushing[12]. During the harvesting process, mechanical contact with grape berries was minimized to maintain the freshness and integrity of the raw materials, and any diseased or rotten berries were removed from the bunch. A pneumatic press was used to release the juice from both the pulp and skin[13]. The juice was divided into free-run juice, which accounted for approximately 70% of the total juice, and press juice, which accounted for approximately 30% of the total juice. Potassium metabisulfite (100 mg/L) was added to the grape juice[14]. Subsequently, 50 mg/L of pectinase was added to the white grape juice to facilitate pectin hydrolysis and accelerate sedimentation and clarification[15]. The grape juice was then placed in cold storage at 4 °C for 24 h for clarification. After racking, clarified grape juice filled 90% of the fermentation tanks. In total, 25 kg of grapes was used in this experiment. The grapes were allocated into fermentation groups, each set up in triplicate. Commercial yeast (EC1118) powder was prepared as a solution at a concentration of 250 mg/L and activated before being added to the clarified grape juice. The fermentation was conducted using the EC1118 yeast at a controlled temperature of 16–20 °C. The process' progression was monitored by daily measurement of the must temperature, pH, and Brix[16]. Each fermentation group was set up with three biological replicates (n = 3) to reduce experimental errors.
Determination of the physicochemical indices
-
The pH of the samples was determined using a pH meter, according to the method described by Bakkalbaşı[17]. The Brix level of the must and wines during fermentation was measured using a handheld refractometer[18], whereas the residual sugar content after fermentation was quantified with a wine analyzer, with all measurements performed in technical triplicates. The total acidity, alcohol content, and volatile acidity of the wine samples were analyzed using an automatic wine analyzer (F17-WineScan FT120 Beijing Zhongxi Yuanda Technology Co., Ltd., China), following the method described by Wang[19], whereas the organic acids in the wine were determined by high-performance liquid chromatography (HPLC), for which an XBridge® C18 column (4.6 mm × 250 mm, 5 μm) was used with the following settings according to Han[20]: column temperature, 35 °C; detection, potato dextrose agar (PDA) at 210 nm; mobile phase, 0.1% phosphoric acid solution/methanol (97.5:2.5, v/v); flow rate, 0.8 mL/min; injection volume, 10 μL.
Analysis of the phenolic compounds
-
The total phenol content in the wine was determined using the Folin–Ciocalteu colorimetric assay[21,22], with the results expressed as gallic acid equivalents (GAE, mg/L). A standard curve was constructed with gallic acid solutions at concentrations of 5, 10, 20, 50, and 70 mg/L, yielding a linear regression equation (y = 0.0265x – 0.0641) with a high coefficient of determination (R2 = 0.997). For the measurement, 2.5 mL of a 10-fold diluted wine sample was mixed with 5 mL of Folin–Ciocalteu reagent and 10 mL of a 7.5% sodium carbonate solution. The mixture was vortexed then incubated at 50 °C for 5 min, and its absorbance was measured at 760 nm against a blank.
The flavonols in the dry white wines were quantified[23]. Mobile Phases A (acetonitrile : methanol : water : tetrahydrofuran = 19:5:76:1, pH 3.0) and B (acetonitrile : methanol : water = 55:15:30, pH 3.0) and a 10 mg/L mixed-label solution of flavonols, including eight flavonols, such as rutin, were prepared. Different volumes of the mixed standard solution were diluted to a standard series of 1.0–10.0 mg/L and injected into the high-performance liquid chromatograph to draw the standard curve. After the sample was shaken well, it was filtered using a needle-type hydrophilic polyether sulfone membrane, and the filtrate was used as the sample to be tested after the primary filtrate was discarded.
The four flavan-3-ols (epigallocatechin, catechin, epigallocatechin gallate, and epicatechin) were quantified via external calibration curves established with standard solutions ranging from 1 to 50 mg/L[17]. The chromatographic conditions were as follows: LiChrospher 100 RP-18e column (4.6 mm × 250 mm, 5 μm), 30 °C, a detection wavelength of 280 nm, an injection volume of 10 μL, and a flow rate of 1 mL/min. For the mobile phase conditions, Mobile Phase A was 0.2% formic acid and Mobile Phase B was methanol, with the elution procedure as follows: 0–11 min, Mobile Phase A 96%→75%; 11–40 min, Mobile Phase A 75%→65%; 40–50 min, Mobile Phase A 65%→0%; 50–60 min, Mobile Phase A 0%; 60–65 min, Mobile Phase A 96%.
The phenolic acid monomers in the wine were determined using the method described by Chen[24], using HPLC with a methanol–acetic acid–water and methanol gradient elution program, detecting compounds at either 280 or 320 nm. Prior to injection, the wine samples underwent a liquid–liquid extraction with ethyl acetate, which was then concentrated to dryness under reduced pressure and reconstituted in methanol. The quantification of seven phenolic acids was achieved using an external standard method with calibration curves established for each compound. Gradient elution was performed, with Mobile Phase A being methanol : acetic acid : water (at a volume ratio of 10:2:88) and Mobile Phase B being methanol, at a flow rate of 0.8 mL/min. The elution procedure was as follows: 0–25 min, Mobile Phase B 0%→15%; 25–45 min, Mobile Phase B 15%→50%; 45–53 min, Mobile Phase B 50%→0%, with a column temperature of 30 °C and an injection volume of 20 μL.
Volatile compound analysis via headspace solid-phase microextraction (HS–SPME–GC–MS)
-
The volatile compounds in wine samples were extracted via headspace solid-phase microextraction (HS-SPME). Each 3-mL wine sample was placed in a 10-mL headspace vial with 0.5 g NaCl and 2 μL of 2-octanol internal standard (0.822 g/L). A preconditioned divinylbenzene/carboxen/polydimethylsiloxane (DVB/CAR/PDMS) fiber was exposed to the sample headspace at 50 °C under agitation at 500 rpm for 50 min, then desorbed in the gas chromatography (GC) injector at 250 °C for 5 min. All analyses were performed in triplicate. GC–mass spectrometry (MS) analysis was performed[25] by using a SUPELCOWAX10 column (60 m × 0.25 mm, 0.25 μm) with helium as the carrier gas at a constant flow rate of 1.2 mL/min. The injector temperature was set to 250 °C and the oven temperature were set as follows: held at 50 °C for 1 min, increased to 180 °C at 3 °C/min, then raised to 230 °C at 20 °C/min, and finally held for 15 min. The mass spectrometer was operated in electron ionization (EI) mode with the transfer line maintained at 280 °C and the ion source at 230 °C. The full-scan acquisition range was m/z 40–450.
Qualitative analysis was performed by matching the mass spectra with the NIST library and literature, retaining compounds with similarity index (SI) > 600 that were detected in all the replicates; 2-octanol (0.822 g/L) was added as the internal standard. The relative content of aroma compounds was determined by full-ion scan spectra compared with NIST 2011 and the literature, and calculated as the average of three replicates.
Sensory evaluation
-
To objectively evaluate the flavor characteristics of wines fermented from different grape varieties, a sensory analysis was conducted by a panel of seven trained volunteers (three men and four women, aged 22–35 years) from China Agricultural University. The study protocol was reviewed and approved by the Research Ethics Committee of China Agricultural University. All participants provided written informed consent prior to the experiment, acknowledging their voluntary participation, the right to withdraw at any time, and the anonymization of their data for research purposes. Samples were presented randomly in standardized tasting glasses under controlled lighting conditions. Using the five-point intensity method (International Wine and Spirit Education Trust Wine Tasting Guide), the panelists scored each sample (100-point scale) for appearance (color/clarity), aroma (intensity, harmony, freshness, complexity), and taste (body, balance, aftertaste) out of 20, 40, and 40 points respectively. Preference rankings were subsequently established. To minimize bias, the participants were instructed to rinse with water between samples, and the evaluations were conducted individually in separate booths.
Statistical analysis and data processing
-
Mapping topography was performed using ArcGIS. Significant differences were analyzed with IBM SPSS Statistics 26 software via an analysis of variance (ANOVA) (n = 3), where p < 0.05 indicates a significant difference. The results are expressed as the mean ± standard deviation (SD). Bar charts were drawn using GraphPad Prism 9.0 software. Heat maps, box plots, score plots, and flavor radar plots were generated using Origin 2025 software.
-
The results of the tests on the dry white wines at the end of fermentation are presented in Table 1. The final residual sugar at the end of fermentation for all fermentation groups was less than 4 g/L, which reached the standard of dry white wine[26].
Table 1. Basic physicochemical indexes of fermented dry white from different sub-regions.
Grape variety Village Basic physicochemical indexes Residual
sugar
(g/L)Alcohol
content%
(vol)pH value Volatile acid
(g/L)Total acid
(g/L)Malic acid
(g/L)Succinic acid
(g/L)Tartaric acid
(g/L)Citric acid
(g/L)Lactic acid
(g/L)Chardonnay ZTK 3.82 ± 1.52a 9.93 ± 0.05a 2.98 ± 0.01b 0.45 ± 0.10c 7.68 ± 0.43b 3.13 ± 0.32b 2.22 ± 1.49a 9.07 ± 0.81a 0.41 ± 0.07a 0.57 ± 0.11a CW 3.91 ± 0.75a 7.50 ± 0.12c 2.87 ± 0.01c 1.03 ± 0.08a 8.73 ± 0.45a 4.60 ± 0.10a 1.59 ± 0.27a 7.16 ± 0.22b 0.41 ± 0.08a 0.47 ± 0.04a YJG 2.62 ± 0.45a 9.21 ± 0.00b 3.05 ± 0.03a 0.72 ± 0.20b 7.80 ± 0.19b 3.57 ± 0.15b 1.60 ± 0.25a 8.79 ± 0.24a 0.66 ± 0.21a 0.45 ± 0.02a Italian Riesling BGZ 3.73 ± 0.51a 10.31 ± 0.36a 3.03 ± 0.03a 0.29 ± 0.06c 7.20 ± 0.68a 1.90 ± 0.18b 0.74 ± 0.22a 11.46 ± 1.71a 0.62 ± 0.07a 0.79 ± 0.13a CW 3.43 ± 0.15a 9.80 ± 0.27a 2.85 ± 0.04b 0.45 ± 0.08b 7.90 ± 0.63a 2.63 ± 0.40a 1.02 ± 0.29a 12.59 ± 2.08a 0.29 ± 0.03b 0.81 ± 0.11a YJG 3.17 ± 0.31a 10.20 ± 0.17a 2.78 ± 0.15b 0.99 ± 0.05a 8.75 ± 0.72a 2.90 ± 0.17a 2.46 ± 1.88a 13.65 ± 1.20a 0.28 ± 0.17b 0.64 ± 0.12a Petit Manseng ZTK 3.75 ± 1.94a 13.21 ± 0.52a 2.93 ± 0.09a 1.54 ± 0.01a 13.50 ± 2.14a 4.10 ± 0.65a 1.04 ± 0.13b 17.88 ± 1.91a 0.39 ± 0.05a 0.49 ± 0.06b KL 3.71 ± 0.02a 13.62 ± 0.07a 2.83 ± 0.02a 0.70 ± 0.01b 11.18 ± 0.02a 3.10 ± 0.06a 1.40 ± 0.11a 18.07 ± 2.14a 0.29 ± 0.01a 0.70 ± 0.01a XJ 2.40 ± 0.01a 14.15 ± 1.20a 3.01 ± 0.04a 0.72 ± 0.23b 8.92 ± 0.01b 2.30 ± 0.02a 1.33 ± 0.13ab 14.12 ± 0.03a 0.40 ± 0.06a 0.69 ± 0.07a Data are the mean of three replicate fermentations ± SD. Values within the same row followed by a common letter are not significantly different according to Tukey's honestly significant difference (HSD) test (p < 0.05). It can also be seen that there were significant differences in the alcohol content of Chardonnay from different villages after fermentation. The alcohol content of the Chardonnay dry white wine from ZTK was the highest, reaching 9.93 ± 0.05 %vol, whereas that from CW was the lowest, reaching 7.50 ± 0.12 %vol. This is because the initial sugar content of Chardonnay grape juice from ZTK is higher; through fermentation, more sugar is converted into alcohol, resulting in a significantly higher alcohol content in the dry white wine after fermentation compared with that from the other two villages. However, in terms of pH, volatile acidity, total acidity, and malic acid content, CW exhibited significantly higher values than the other groups. Elevated acidity contributes to a crisp and vibrant taste profile in dry white wine, which serves as a crucial indicator for evaluating its quality. According to the data in the table, the pH of the Italian Riesling dry white wine from BGZ was the highest, reaching 3.03 ± 0.03, whereas the pH of the wines from CW and YJG was 2.85 ± 0.04 and 2.78 ± 0.15, respectively. This may result from the different amounts of acidic substances produced during the fermentation of Italian Riesling. For Petit Manseng wines, the significantly higher volatile acidity in the ZTK wine (1.54 ± 0.01 g/L) compared with the other two subregions clearly indicates that geographical origin plays an important role in regulating acetic acid production during fermentation.
Organic acids are the main components that affect the acidity of dry white wines[27]. They are the primary metabolites present in grapes and have a strong influence on the chemical balance of wine and grape juice, directly affecting the taste balance, chemical stability, and pH of wine, and its sensory acceptance by consumers[28]. The organic acid content in dry white Chardonnay wines from three different villages (ZTK, CW, and YJG) was determined. Tartaric acid is the most abundant organic acid in wines. Among the three villages, the ZTK vintage had the highest content, reaching 9.07 ± 0.81 g/L. This may be caused by the higher altitude of ZTK, where the relatively cooler climate slows grape ripening, allowing for the preservation of a higher amount of potassium bitartrate. For Italian Riesling, the citric acid content in BGZ was relatively high, reaching 0.62 ± 0.07 g/L, whereas that of CW and YJG was 0.29 ± 0.03 and 0.28 ± 0.17 g/L, respectively, which was significantly lower than that of BGZ. For white wines, higher citric acid content enhances freshness and intensifies citrus-like aromas, thereby improving the sensory quality of the wine.
The influence of different subregions in Yantai on the organic acid content in dry white wines would cause different tastes and flavors, thus forming the unique characteristics of each subregion.
Phenolic content of dry white wines
-
Phenolic compounds can affect the bitterness, astringency, aroma, and color of wine and have health benefits[29]. They are the main components of wine. Therefore, determining the total amount of phenolic compounds in wine is of great significance for evaluating wine quality.
As shown in Fig. 2a, the total phenolic content of Chardonnay from CW reached the highest value of 221.10 ± 10.42 mg/L after fermentation, which was significantly higher than that of Chardonnay from ZTK and YJG. As shown in Fig. 2b, there were no significant differences among the three Italian Riesling wines. Figure 2c shows that the total phenolic content of Petit Manseng from XJ was relatively high, reaching 194.20 ± 3.68 mg/L, and there were significant differences in the total phenolic content of Petit Manseng from KL and ZTK. The results indicated that different production areas lead to differences in the total phenolic content of different varieties of dry white wine.
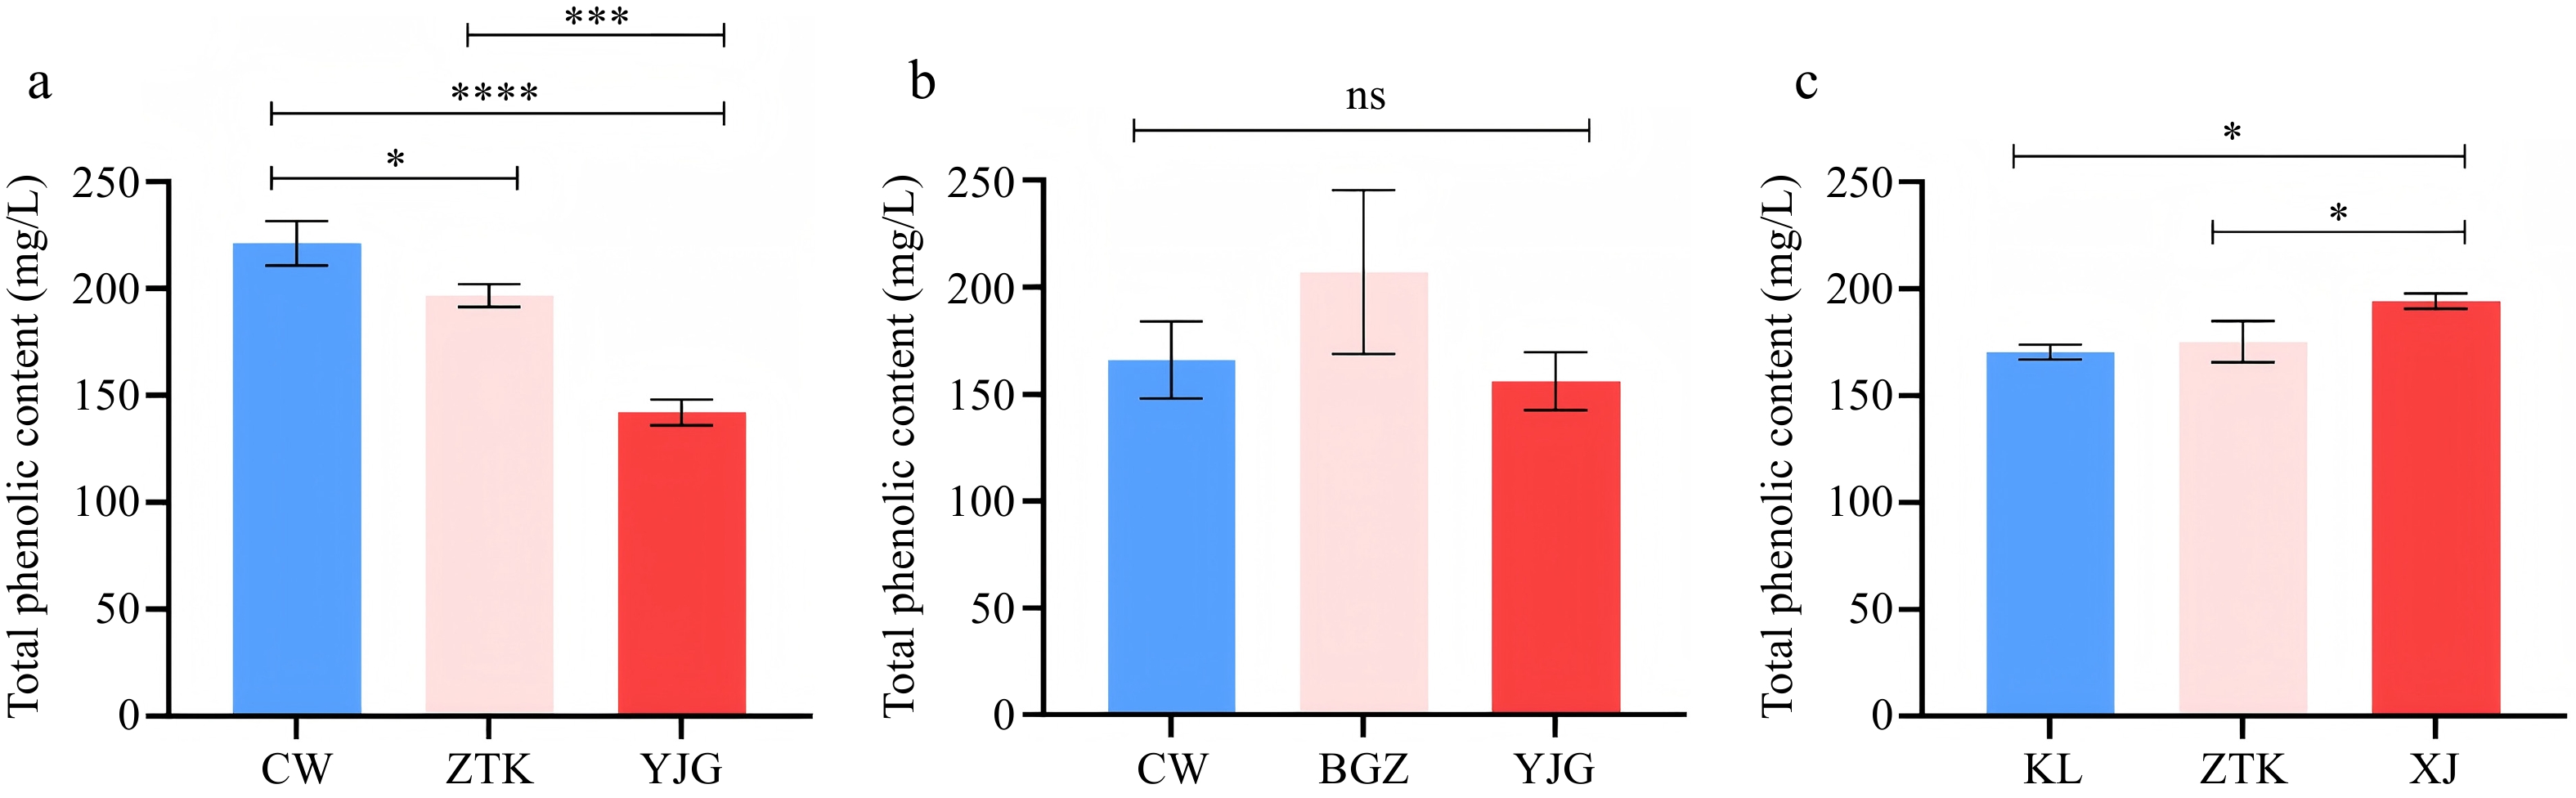
Figure 2.
Total phenolic content in (a) Chardonnay, (b) Italian Riesling, and (c) Petit Manseng from different regions. *, ***, and **** indicate significant differences at the 0.05, 0.005, and 0.001 levels, respectively; ns indicates no significant difference (p > 0.05).
Table 2 shows the contents of various phenolic compounds in different dry white wines. Flavan-3-ols are important flavor substances in wine[30], and include (−)-epigallocatechin (EgC), (+)-catechin, (−)-epigallocatechin gallate (EgCg), and (−)-epicatechin (EC). They have strong antioxidant functions and influence the color, taste, and health characteristics of wine[31] and can positively affect platelet and endothelial function[32]. The content of catechin in dry white Chardonnay wine from ZTK was the highest, reaching 0.50 ± 0.01 mg/L, whereas the content in the Chardonnay from YJG was the lowest (only 0.14 ± 0.01 mg/L). According to the ANOVA, there was a significant difference between the Chardonnay samples from ZTK and YJG. EgC is a relatively high content flavan-3-ol found in wine. The EgC content in Chardonnay from ZTK was the highest, reaching 11.47 ± 2.15 mg/L, which was significantly higher than that in wine from the other two villages. The content of EgC in Italian Riesling from BGZ was the highest, reaching 21.57 ± 3.70 mg/L, followed by the wines from CW and YJG, with contents of 13.22 ± 4.12 and 3.42 ± 2.30 mg/L, respectively. As the most biologically active monomer in green tea polyphenols, a high EgCg content is directly correlated with enhanced antioxidant activity, enabling free radical scavenging and suppression of lipid peroxidation. These properties may contribute to its putative roles in antiaging, anti-inflammation, and chronic disease prevention[33]. The content of EgCg was relatively high in the dry white wine from BGZ, reaching 0.77 ± 0.21 mg/L, and the lowest was in that from YJG, only 0.42 ± 0.01 mg/L. According to the ANOVA, there was a significant difference between the wines from BGZ and YJG. Regarding Petit Manseng, that from XJ had the highest EgC content, which was significantly higher than that of the other two groups.
Table 2. Phenolic compounds of fermented dry white wines from different subregions (mg/L).
Phenolic
compoundsChardonnay Italian Riesling Petit Manseng ZTK CW YJG BGZ CW YJG ZTK KL XJ C 0.50 ± 0.01a 0.33 ± 0.02a 0.14 ± 0.00b 0.44 ± 0.17a 0.40 ± 0.24a 0.12 ± 0.01a 0.18 ± 0.04a 0.16 ± 0.03a 0.17 ± 0.02a EC 0.33 ± 0.02a 0.51 ± 0.20a 0.32 ± 0.02a 0.28 ± 0.01a 0.31 ± 0.07a 0.29 ± 0.01a 0.96 ± 0.14a 1.04 ± 0.41a 0.36 ± 0.02a EgC 11.47 ± 2.15a 8.91 ± 1.52b 0.59 ± 0.25b 21.57 ± 3.79a 13.22 ± 4.12b 3.42 ± 2.30c 0.76 ± 0.36b 1.39 ± 0.46b 3.55 ± 1.42a EgCg 0.52 ± 0.01a 0.31 ± 0.18a 0.23 ± 0.01a 0.77 ± 0.21a 0.50 ± 0.07ab 0.42 ± 0.01b 0.45 ± 0.09a 0.56 ± 0.16a 0.79 ± 0.10a Quercetin 0.18 ± 0.01b 0.24 ± 0.01a − 0.67 ± 0.48a 0.18 ± 0.01a 0.10 ± 0.01a 0.15 ± 0.04a 0.37 ± 0.01a 0.16 ± 0.01a Quercitrin 0.24 ± 0.00b 1.11 ± 0.01a − − − − − − − Rutin 1.40 ± 0.46a 2.08 ± 0.09a 0.57 ± 0.00b 5.44 ± 0.06a 1.16 ± 0.33b 0.18 ± 0.01b 0.61 ± 0.292b 2.99 ± 0.01a 1.77 ± 0.01ab Myricetin − − − 0.83 ± 0.02b 1.25 ± 0.01a − − − − Gallic acid 0.78 ± 0.06b 8.04 ± 1.55a 1.05 ± 0.44b 1.38 ± 0.48a 1.24 ± 0.53a 1.09 ± 0.23a 1.45 ± 0.33a 1.70 ± 0.22a 2.03 ± 0.63a Protocatechuic acid 33.07 ± 5.86a 14.09 ± 0.66b 2.68 ± 1.70c 25.10 ± 3.95a 14.15 ± 3.19b 2.49 ± 1.49c 8.93 ± 0.47b 9.26 ± 1.02b 12.70 ± 1.03a Chlorogenic acid 4.49 ± 0.23ab 7.19 ± 0.36a 3.73 ± 0.21b 17.88 ± 11.15a 7.62 ± 1.50a 11.01 ± 1.56a 10.38 ± 1.31b 12.28 ± 3.42b 22.45 ± 3.65a Caffeic acid 2.54 ± 0.29a 2.76 ± 0.21a 0.77 ± 0.16b 6.26 ± 3.66a 2.52 ± 0.85a 0.92 ± 0.20a 1.35 ± 0.58a 1.71 ± 0.37a 2.08 ± 0.52a p-Coumaric acid 0.92 ± 0.15a 1.20 ± 0.89a 0.62 ± 0.15a 0.61 ± 0.01a 0.46 ± 0.18ab 0.23 ± 0.01b 1.35 ± 0.58a 0.99 ± 0.30a 2.03 ± 1.13a Ferulic acid 0.86 ± 0.06a 0.99 ± 0.09a 0.84 ± 0.01a 0.73 ± 0.21a 0.71 ± 0.08a 0.56 ± 0.03a 0.74 ± 0.05a 0.82 ± 0.19a 0.83 ± 0.25a Data are the mean of three replicate fermentations ± SD. Values within the same row followed by a common letter are not significantly different according to Tukey's HSD test (p < 0.05). Flavonols are important flavonoids that affect the color, taste, and health properties of grapes. They are closely related to the sensory and nutritional quality of grapes and wine and have become an important issue restricting the quality improvement of grapes and wine. The flavonols in wine mainly include quercetin, rutin, quercitrin, and myricetin and their corresponding derivatives[34]. Among the Chardonnay samples, that from CW had the highest content of quercetin, quercitrin, and rutin, with levels significantly higher than the wine from YJG. For Italian Riesling, myricetin was only detected in the BGZ and CW wines, with contents of 0.83 ± 0.02 and 1.25 ± 0.01 mg/L, respectively, and there was a significant difference between them. Quercetin and rutin were detected in all three wines. For rutin, the content in BGZ was the highest, reaching 5.44 ± 0.06 mg/L. Only quercetin and rutin were detected in the dry white wine made from Petit Manseng. Galangin, kaempferol, isorhamnetin, and morin were not detected in the dry white wines. This may be because these flavonols are primarily found in grape skins, whereas dry white wine undergoes fermentation of the clear juice. As a result, these skin-derived flavonols cannot transfer into the wine, leading to undetectably low levels.
Phenolic acids are polyphenolic substances, including gallic, protocatechuic, chlorogenic, caffeic, p-coumaric, and ferulic acids. They significantly affect the color, astringency, taste, and flavor of wines[35]. The influence of grape varieties, wine-making practices, and aging on the polyphenolic components can lead to changes in wine flavor[36]. Table 2 shows that the gallic acid content in the dry white wine made from Chardonnay grapes from CW was the highest, reaching 8.04 ± 1.51 mg/L. The content of this phenolic acid monomer was the second highest in wines from YJG and ZTK, which were 1.05 ± 0.44 and 0.78 ± 0.06 mg/L, respectively. At low concentrations, gallic acid imparts subtle fresh notes; however, at higher concentrations, it may contribute to astringency and a coarse mouthfeel. Protocatechuic acid is a phenolic acid monomer with a relatively high content. The protocatechuic acid content in the dry white wine made from fermented Chardonnay grapes from ZTK was the highest, reaching 33.07 ± 5.95 mg/L, which was significantly higher than that in the wines from the other two villages. The phenolic acid content in Italian Riesling wines from BGZ, CW, and YJG was 25.10 ± 3.95, 14.15 ± 3.10, and 2.49 ± 1.40 mg/L, respectively. The BGZ samples showed significantly higher protocatechuic acid levels than those of the other two villages. For Petit Manseng, the protocatechuic acid content in wines from ZTK, KL, and XJ was 8.93 ± 0.47, 9.26 ± 1.00, and 12.70 ± 1.03 mg/L, respectively. According to the analysis of differences, the protocatechuic acid content in the XJ wine was significantly higher than that in the ZTK and KL wines. The chlorogenic acid content in the dry white wine fermented from Petit Manseng grapes from ZTK, KL, and XJ was 10.38 ± 1.31, 12.28 ± 3.42, and 15.78 ± 8.80 mg/L, respectively. The analysis of differences revealed that the chlorogenic acid content in the XJ wine was significantly higher than that in the ZTK and KL moment.
The content of volatile compounds in dry white wines from different regions
-
Wine aroma is derived from volatile compounds, including acids, alcohols, esters, aldehydes, ketones, and terpenes. The balance and coordination of these aromas have an important impact on wine quality[10]. Therefore, detecting the content of volatile compounds in wine is of great significance for assessing its quality. This study determined the types and contents of volatile compounds in Chardonnay, Italian Riesling, and Petit Manseng wines from different subregions in Yantai. The results are presented in Fig. 3 and Table 3.
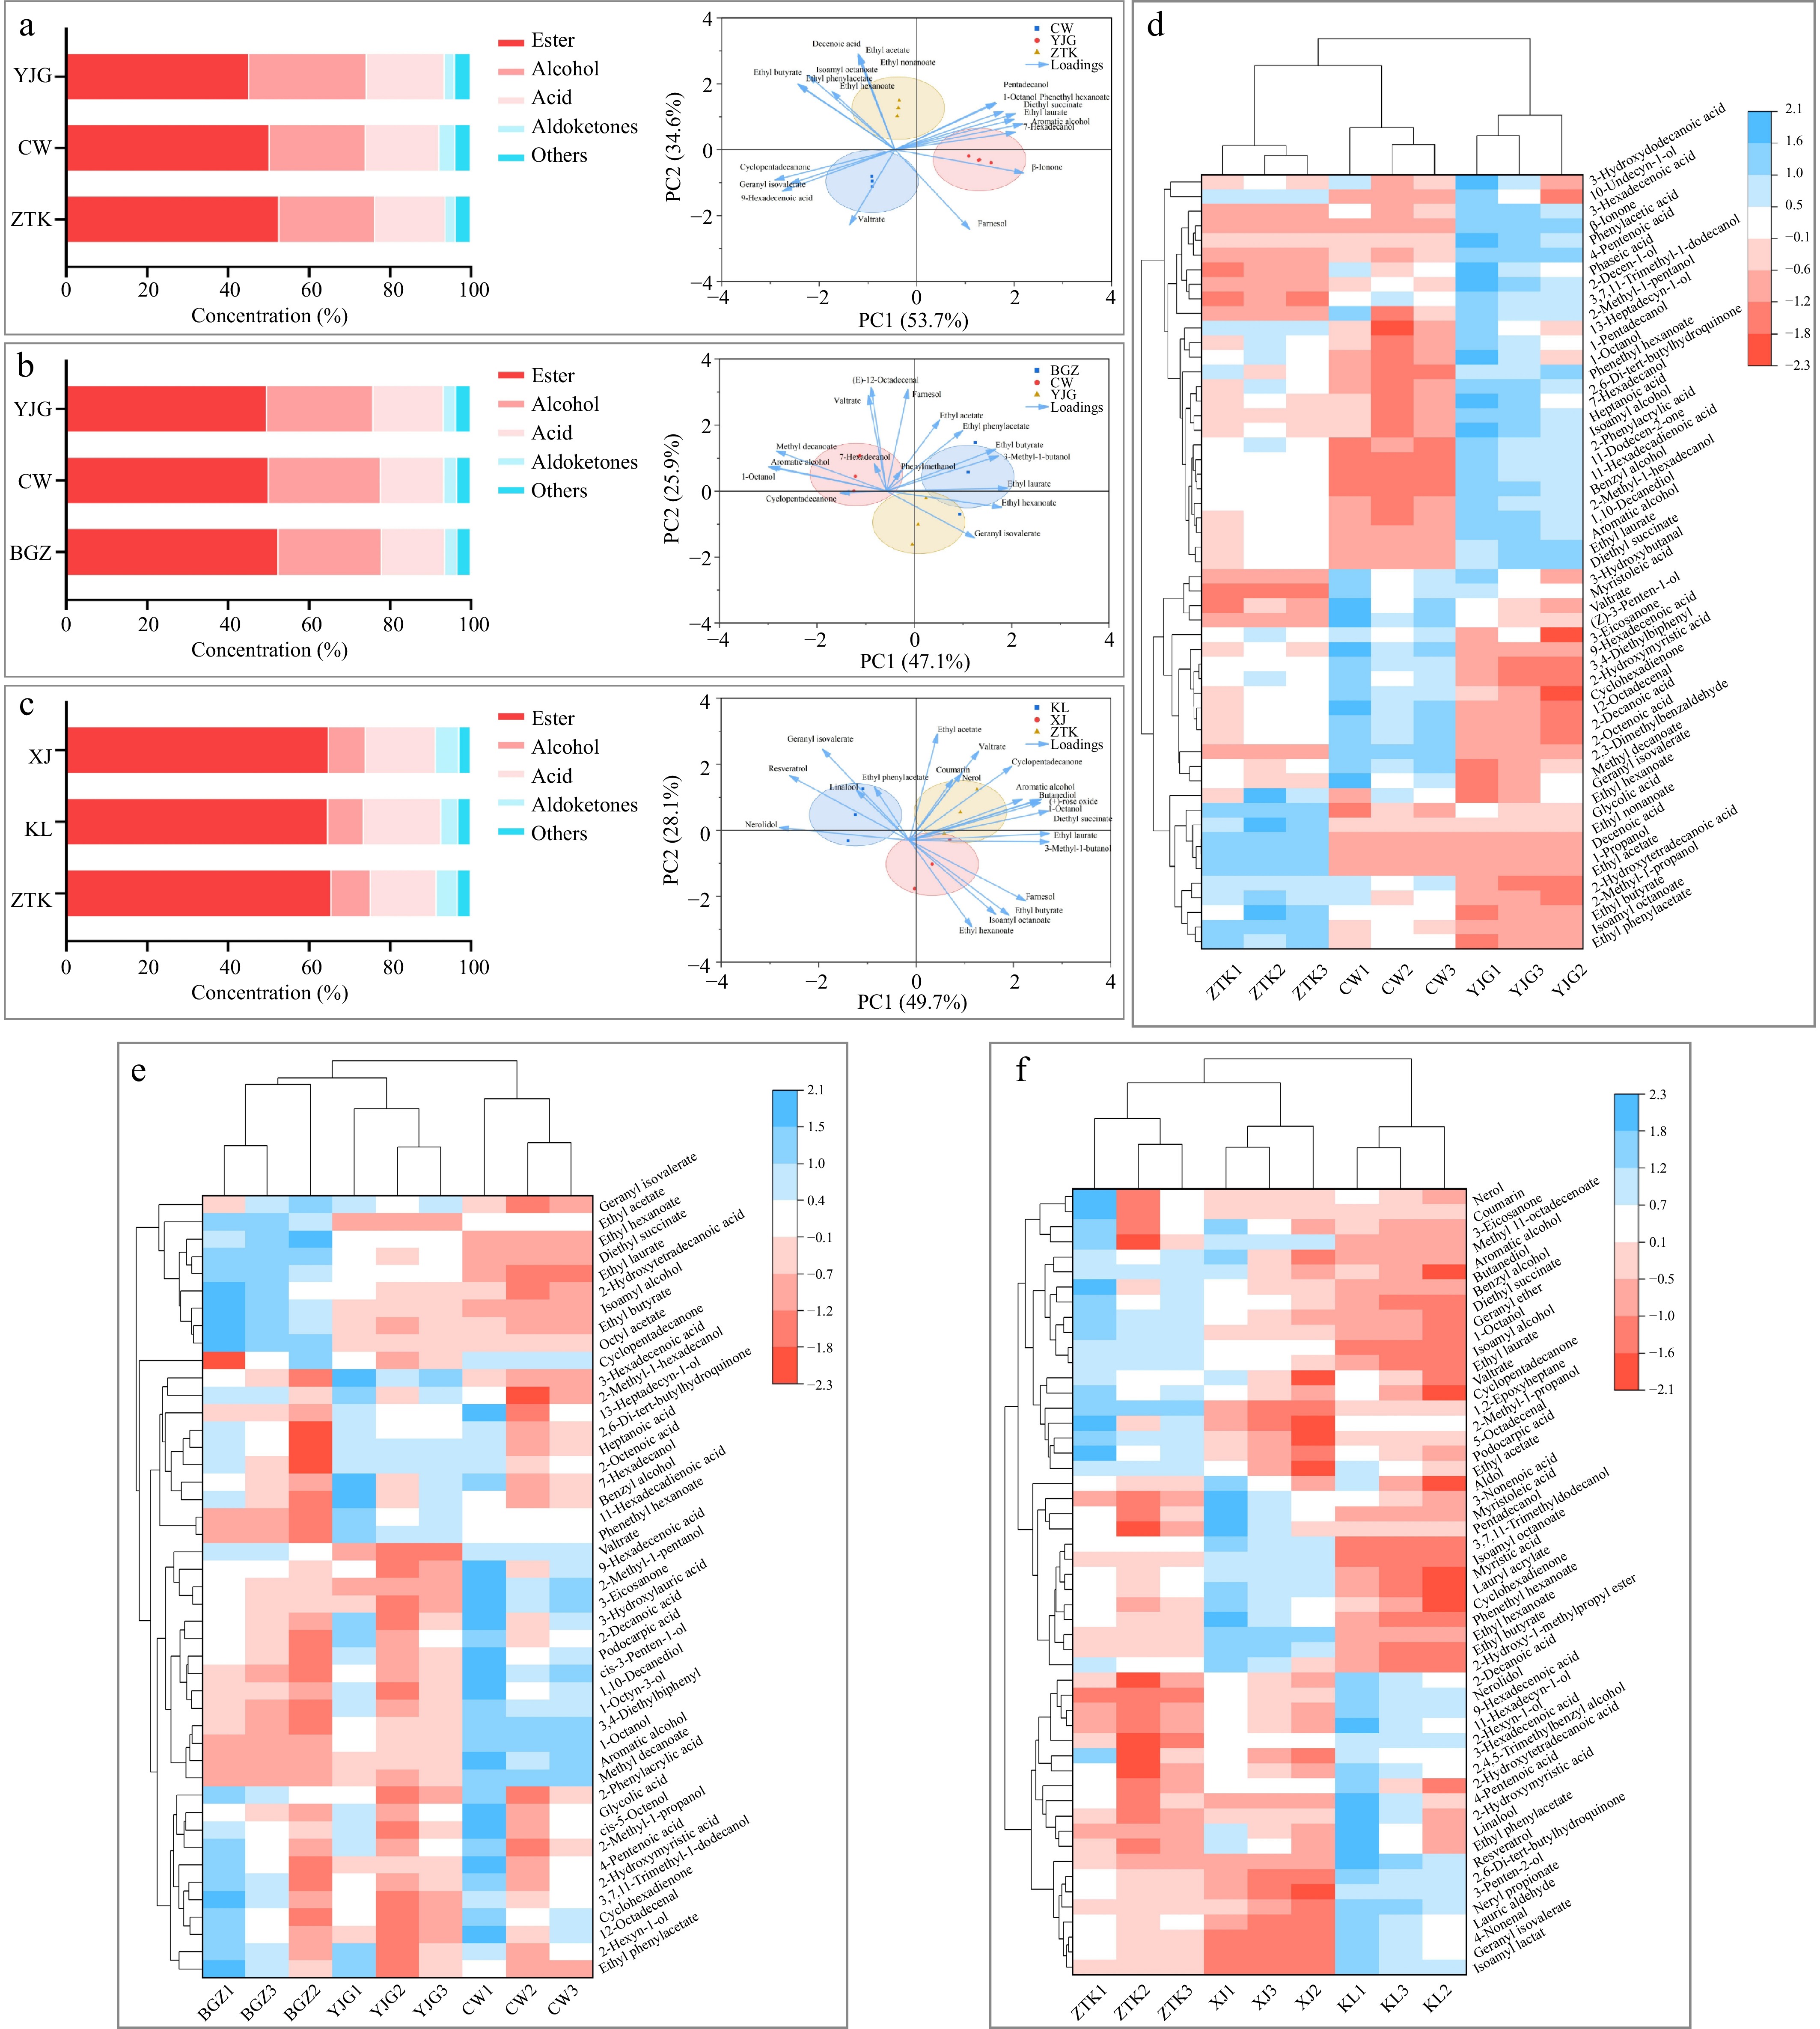
Figure 3.
Content of different aroma types and visual analysis of the aromas in different subregions using a biplot of (a) Chardonnay wine samples, (b) Italian Riesling wine samples, (c) Petit Manseng wine samples. Hierarchical clustering of aroma components at p < 0.05 of (d) Chardonnay wines, (e) Italian Riesling wines, and (f) Petit Manseng wines.
Table 3. Odor activity values of important aroma compounds
Volatile Compounds Threshold
(ug/L)Flavor Description Chardonnay Italian Riesling Petit Manseng ZTK CW YJG BGZ CW YJG ZTK KL XJ Ethyl phenylacetate 650 Honey, Sweet 0.6 0.52 0.44 0.34 0.29 0.31 0.28 0.32 0.31 Ethyl butyrate 35 Strawberry, Banana 63.56 57.28 49.36 72.32 57.08 59.39 62.75 56.47 73.37 Ethyl hexanoate 5 Pineapple, Banana 24.73 20.6 − − − − 19.96 13.86 42.73 Ethyl laurate 150 Fruity, Floral 1.39 0.25 0.96 − − − − − − Ethyl nonanoate 0.85 Fruity, Floral 29.78 − − − − − − − − Isoamyl octanoate 125 Pineapple, Coconut 0.4 0.18 0.61 − − − − − − 1-Octanol 110 Sour, Cheese 0.81 0.31 0.94 0.08 0.44 0.21 0.72 0.16 0.35 Farnesol 20 Floral, Green 6.66 8.21 8.9 7.54 7.28 5.54 5.42 4.38 6.02 β-Ionone 0.007 Violet − − 5182.86 − − − − − − (+)-rose oxide 0.5 Rose − − − − − − 25.12 17.44 20.04 Nerolidol 1 Floral, Cedar − − − − − − 1.38 3.75 2.45 Linalool 25 Rose, Musk − − − − − − 1.44 1.82 1.62 From Fig. 3a–c, we can see that the composition of aroma components in wines from different small production areas has certain similarities. Ester substances are the main components of aroma, followed by alcohol and acid. Esters are the main source of fruit and floral flavors in wines. Among the three grape varieties, Petit Manseng had the highest proportion of ester compounds and the lowest content of alcohol compounds, indicating that its fruity and floral aromas were more prominent. In the Chardonnay and Italian Riesling wines, those from ZTK and BGZ exhibited the highest levels of ester compounds.
According to the biplot analysis for Chardonnay, the second principal component separates ZTK from the other two villages, and according to the direction of the aroma substance arrows, the second principal component distinguishes floral and fruity aromas. It can be observed that the ester characteristics of the aroma in the ZTK wine are extremely prominent, which is related to its highest ester content, giving it a rich fruity aroma. In contrast, the YJG wine had violet and grassy notes. Among the Italian Riesling white wines, the aroma compounds of the BGZ wine, located on the positive half-axis of the first principal component, exhibited strong ester characteristics with a rich fruity profile of strawberry and banana. In contrast, the CW group was situated on the negative half-axis, and its associated aroma compounds were primarily characterized by waxy, soapy, and rancid aromas. This suggests that the first principal component primarily distinguishes between light and heavy aromas. The biplot of Petit Manseng clearly revealed a high similarity in aroma profiles between the XJ and ZTK wines, distinguishing them from the wine from KL. The aroma characteristics most closely associated with XJ are sweet, ester-like wine aromas reminiscent of over-ripe, fermented fruit.
Figure 3d–f presents the hierarchical cluster analysis (HCA) of the aroma data, generating dendrograms that illustrate the separation of villages according to the similarities in their aroma profiles.
The Chardonnay wine from ZTK exhibited significantly higher concentrations of ethyl hexanoate, isoamyl octanoate, and ethyl butyrate than the other two wines, contributing to the distinct tropical fruit aromas (pineapple, banana). Notably, β-ionone was detected exclusively in the Chardonnay from YJG (36.28 ± 4.37 μg/L), imparting a unique violet note to this wine. Among three samples of Italian Riesling, the BGZ group contained significantly higher levels of ethyl laurate, diethyl succinate, ethyl hexanoate, and ethyl butyrate. Among these, ethyl hexanoate and ethyl butyrate exhibited notably high OAV values, contributing to a more intense floral aroma and tropical fruit notes in the wine. The heatmap and OAV table indicated that the concentrations of ethyl hexanoate, isoamyl octanoate, and ethyl butyrate in the XJ wine were significantly higher than those in wines from the other two villages. These three aroma compounds also exhibited high OAV values, endowing Petit Manseng grapes from XJ with more intense tropical fruit aromas.
Sensory evaluation and characteristic aromas of wines from different subregions
-
To evaluate the influence of raw grape materials from different regions on the aroma of dry white wine in a more intuitive and comprehensive manner, in addition to instrumental analysis, seven professionals with rich experience in wine tasting were invited to conduct sensory evaluations of the dry white wines from different regions. The total score for this evaluation was 100 points, consisting of three items: appearance (color and clarity), aroma (harmony, intensity, complexity, and freshness), and taste (body, balance, and aftertaste).
Figure 4a presents the box plot of scores and a flavor radar chart for Chardonnay. The highest score was achieved by the Chardonnay from YJG, with an average score of 88.86. The Chardonnay from ZTK ranked second, with an average score of 85. The lowest score was obtained for the Chardonnay from CW, with an average score of 76.14. In the five-point scoring method, the citrus fruit aroma was frequently mentioned by the evaluators for ZTK. Figure 4b presents the box plot of the scores and flavor radar chart for Italian Riesling. As evident from the visualization, BGZ achieved the highest score (87.42). The radar chart also demonstrates that the fruity aroma was particularly prominent among the three groups, and the floral aroma score was the highest. Figure 4c shows the score box plot and flavor radar chart for Petit Manseng. ZTK and XJ ranked as the top two, with scores of 86.71 and 86.21, respectively. The radar chart revealed that ZTK exhibited prominent floral and citrus fruit aromas, whereas XJ scored higher for tropical fruit notes and alcohol-related aromas.
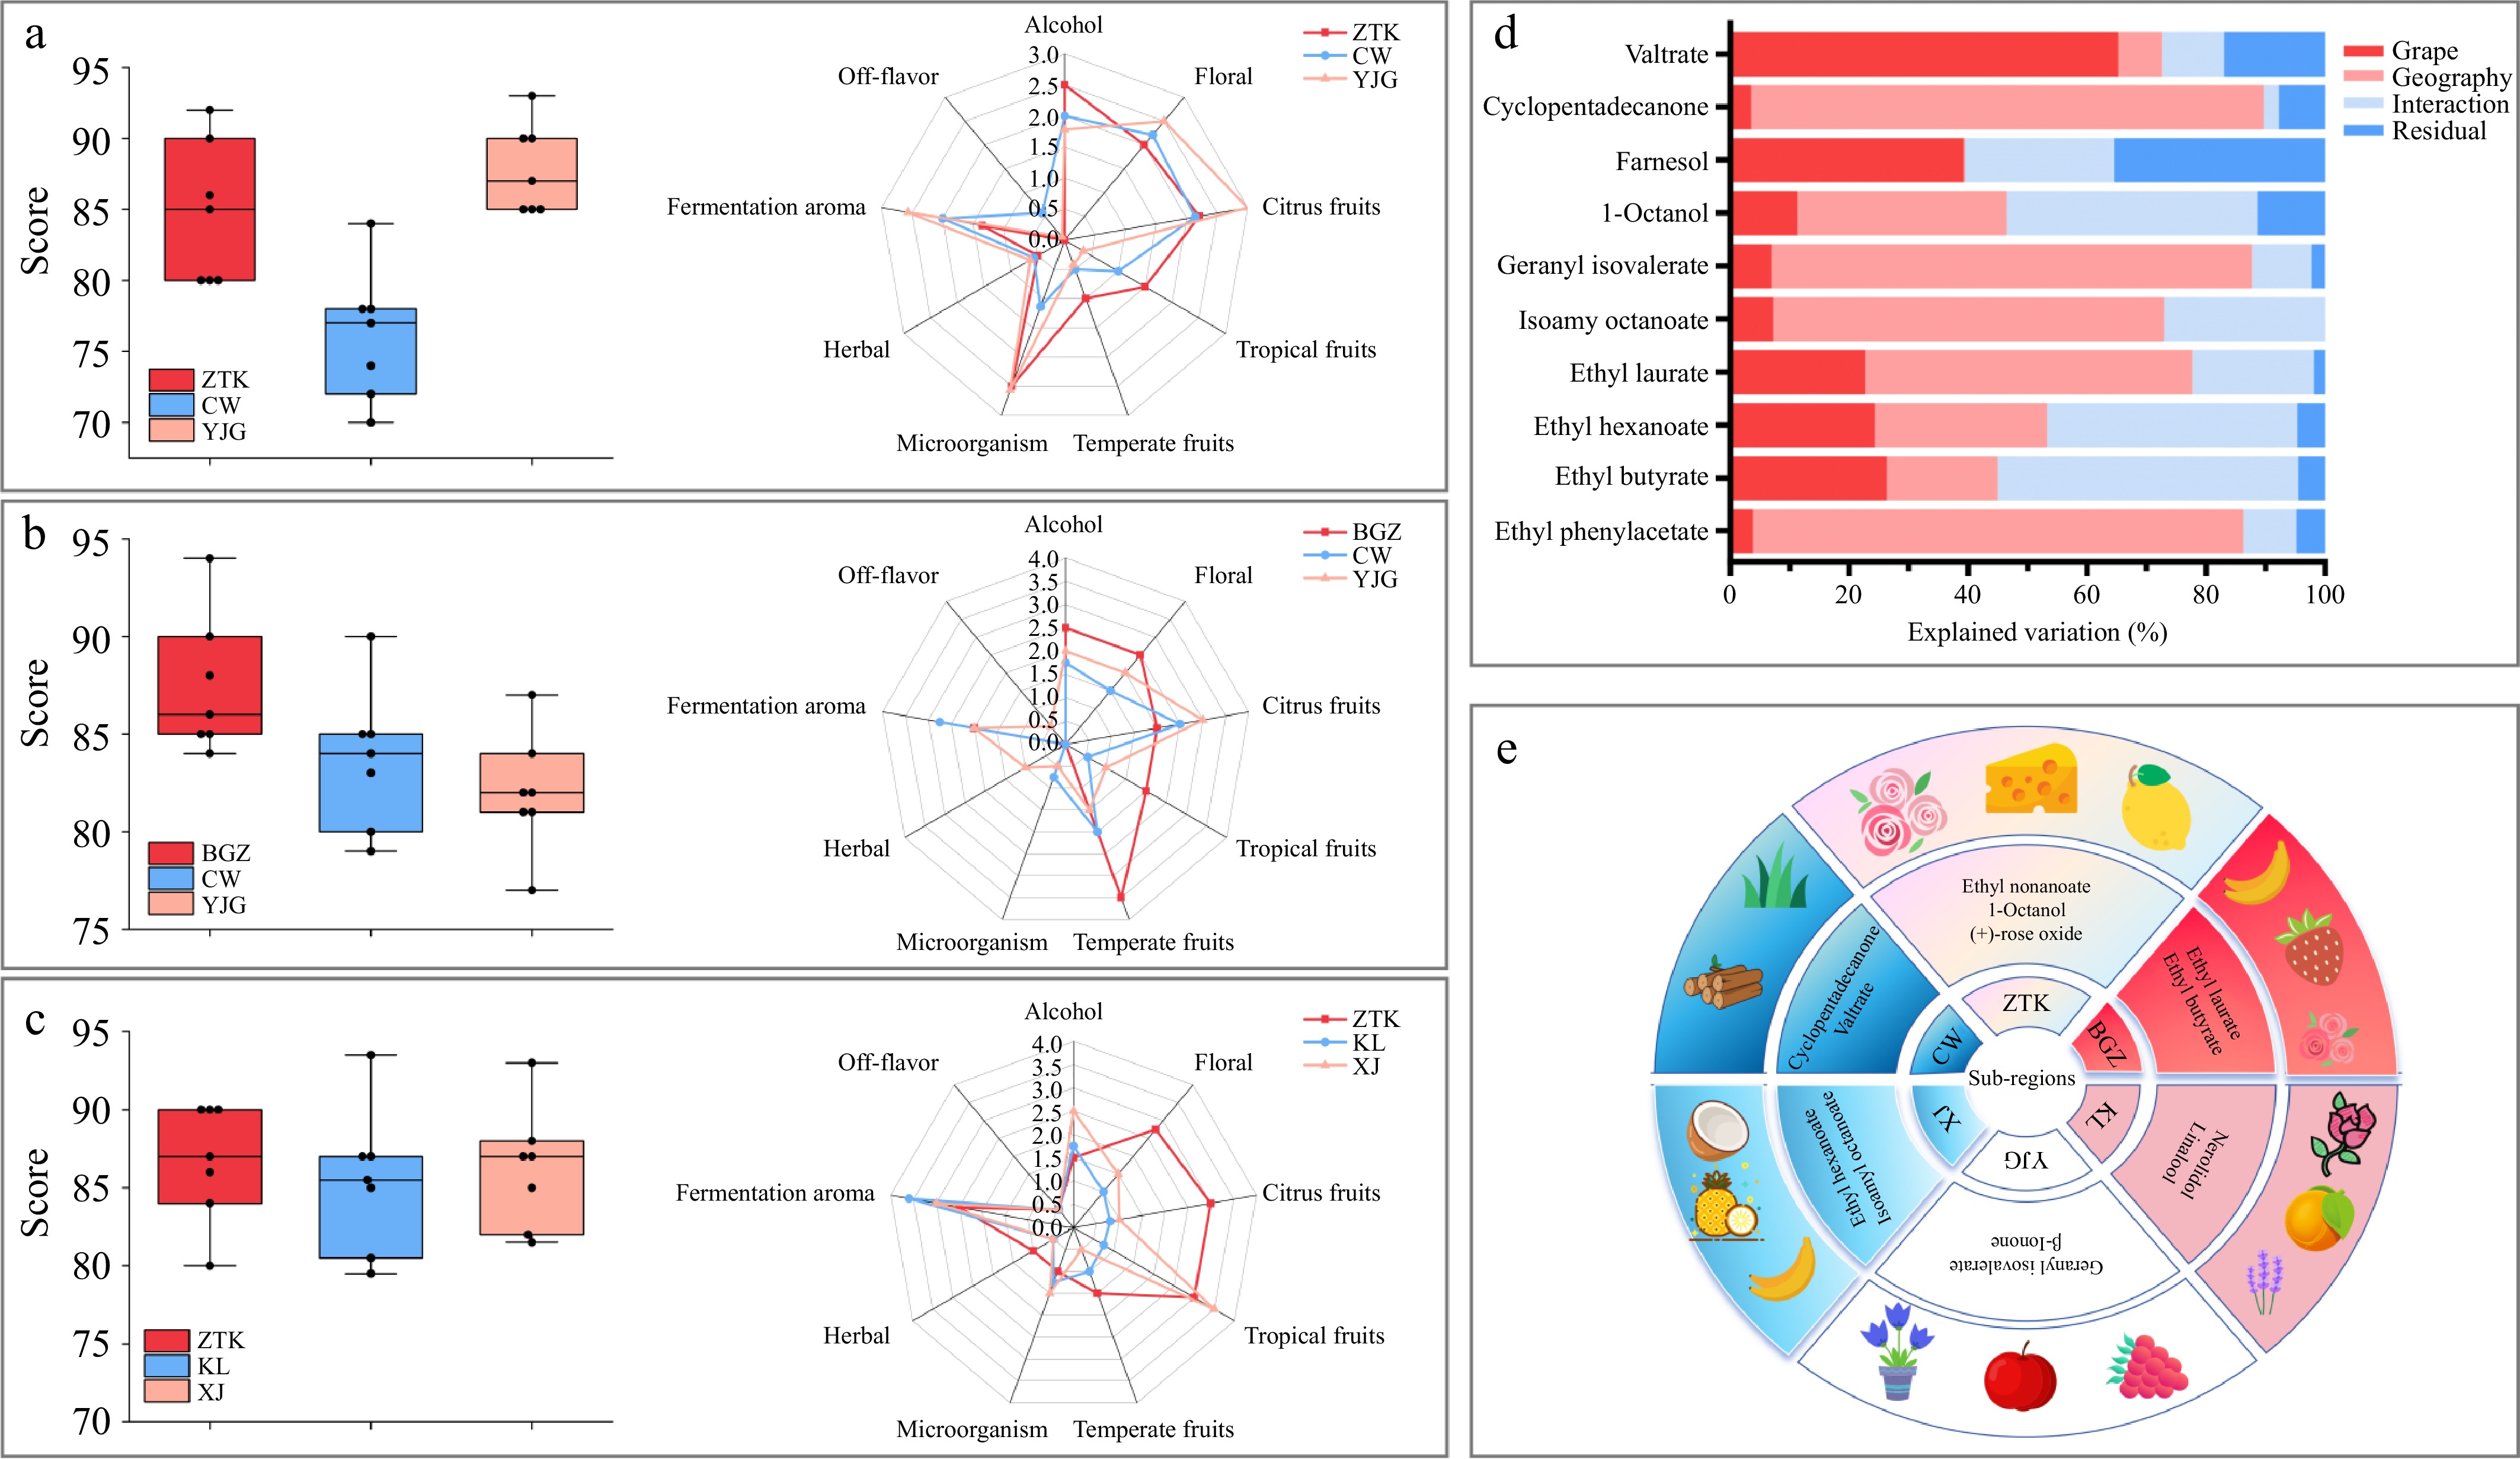
Figure 4.
The box plot of scores and flavor radar chart of different dry white from different subregions: (a) Chardonnay; (b) Italian Riesling; (c) Petit Manseng; (d) percentage of variation in various treatments attributed to strain, geography, their interactions, and residuals analyzed via two-way ANOVA; (e) each subregion is distinguished by its unique aroma compounds, especially when compared with commercial yeasts, along with the associated sensory aromas.
A two-way ANOVA was performed on the compounds present in all three grape varieties[37] with high OAV values to investigate how strain and geographical location influence these compounds (Fig. 4d). The results demonstrated that ethyl butyrate, farnesol, and valtrate were more significantly affected by grape variety, whereas ethyl phenylacetate, ethyl hexanoate, ethyl laurate, isoamyl octanoate, geranyl isovalerate, 1-octanol, and cyclopentadecanone showed greater dependence on the geographical location. Aroma compounds for which the variation explained by geographical factors exceeded that of grape variety, along with those exhibiting significantly higher concentrations in specific subregions, were identified as representative aroma markers for those subregions (Fig 4e). It can be observed that geographically adjacent subregions exhibited similarities in their representative aroma profiles. For instance, ZTK and BGZ, being located in close proximity, shared a distinctive rose-like floral character. Similarly, KL and YJG, which are also geographically close, were characterized by notes of acidic fruits and purple flowers. Wines from the XJ subregion displayed a pronounced tropical fruit aroma, whereas those from CW were marked by distinct woody and grassy notes. The fact that each subregion possesses a distinguishable aromatic fingerprint provides critical guidance for viticultural planning in different subregions of Yantai. This finding offers a scientific basis for addressing the issue of wine homogenization in the Yantai region.
-
This study highlights the significant impact of terroir on the quality characteristics of dry white wines produced from Chardonnay, Italian Riesling, and Petit Manseng grapes across different subregions of Yantai. The results demonstrated that Chardonnay from ZTK exhibited superior aromatic complexity and sensory scores, whereas Italian Riesling is most suited to BGZ, showing an optimal balance of acidity and volatile compounds. Petit Manseng thrives in XJ, developing distinctive tropical fruit aromas and the earning highest sensory evaluation rating. Furthermore, we conducted a comprehensive analysis of the characteristic aroma compounds and their sensory profiles across various village-level subregions in Yantai. This study provides a theoretical foundation for the regionalization of wine grape varieties in Yantai, as well as offering both theoretical support and technical assurance for producing high-quality dry white wines with distinct regional characteristics. This is of significant importance for enhancing the overall quality of Yantai wines and promoting the economic development of the Yantai region.
-
This research was conducted in accordance with the Declaration of Helsinki. All panelists were fully informed of the study's purpose, procedures, and voluntary nature prior to participation. Informed consent was obtained from each panelist by signing a written consent form, and measures were taken to ensure the confidentiality of their personal information. No potential risks or discomforts were associated with participation in this study.
-
The authors confirm their contributions to the paper as follows: study conception and design: Huang W, Zhan J, Kong W, Xia G, You Y; data collection: Zhai Z, Kang K, Zhang P; analysis and interpretation of results: Zhai Z, Zhang P, Deng Q; draft manuscript preparation: Zhai Z, Kang K, Zhang P, You Y. All authors reviewed the results and approved the final version of the manuscript.
-
All data generated or analyzed during this study are included in this published article and its supplementary information files.
-
This work was supported by National Key Research and Development Program of China (Grant No. 2024YFD1600304-4) and The Grape and Wine Innovation Team of the Yantai Research Institute of China Agricultural University (Grant No. 101110102) to Yilin You.
-
The authors declare that they have no conflict of interest.
-
accompanies this paper online at: https://doi.org/10.48130/fia-0026-0007.
-
Authors contributed equally: Zihao Zhai, Kun Kang
- Supplementary Table S1 The place where raw grapes are harvested.
- Supplementary Table S2 Basic physicochemical indexes of must in different sub-regions.
- Copyright: © 2026 by the author(s). Published by Maximum Academic Press on behalf of China Agricultural University, Zhejiang University and Shenyang Agricultural University. This article is an open access article distributed under Creative Commons Attribution License (CC BY 4.0), visit https://creativecommons.org/licenses/by/4.0/.
-
About this article
Cite this article
Zhai Z, Kang K, Zhang P, Deng Q, Huang W, et al. 2026. Investigating the quality characteristics of dry white wines from subregions in Yantai. Food Innovation and Advances 5(2): 153−162 doi: 10.48130/fia-0026-0007 

Investigating the quality characteristics of dry white wines from subregions in Yantai
- Received: 24 November 2025
- Revised: 19 January 2026
- Accepted: 22 January 2026
- Published online: 14 April 2026
Abstract: Investigating the distinct wine styles of subregions in Yantai is of great significance for enhancing the market recognition of this region and promoting the development of its local wine industry. In this study, three main white grape varieties from six village-level subregions in Yantai were used as raw materials to explore the quality characteristics of dry white wine. The physicochemical indices, phenolic compounds, and volatile aroma compounds were analyzed, and a two-way analysis of variance (ANOVA) was conducted on the significant aroma substances. The results indicated that Chardonnay, Italian Riesling, and Petit Manseng were more suitable for planting in Zhutangkuang, Beigezhuang, and Xingjia, respectively. The signature aroma profile of Keliu and Yujagou is characterized by purple floral notes and tart fruits, whereas that of Chouwang is distinguished by woody and herbal notes. These findings underscore the importance of site-specific cultivation for optimizing wine quality in Yantai's diverse microclimates, providing valuable insights for addressing the issue of wine style homogenization in this region.
-
Key words:
- Yantai /
- Subregion /
- Volatile compounds /
- Dry white wine /
- Grape variety regionalization