-
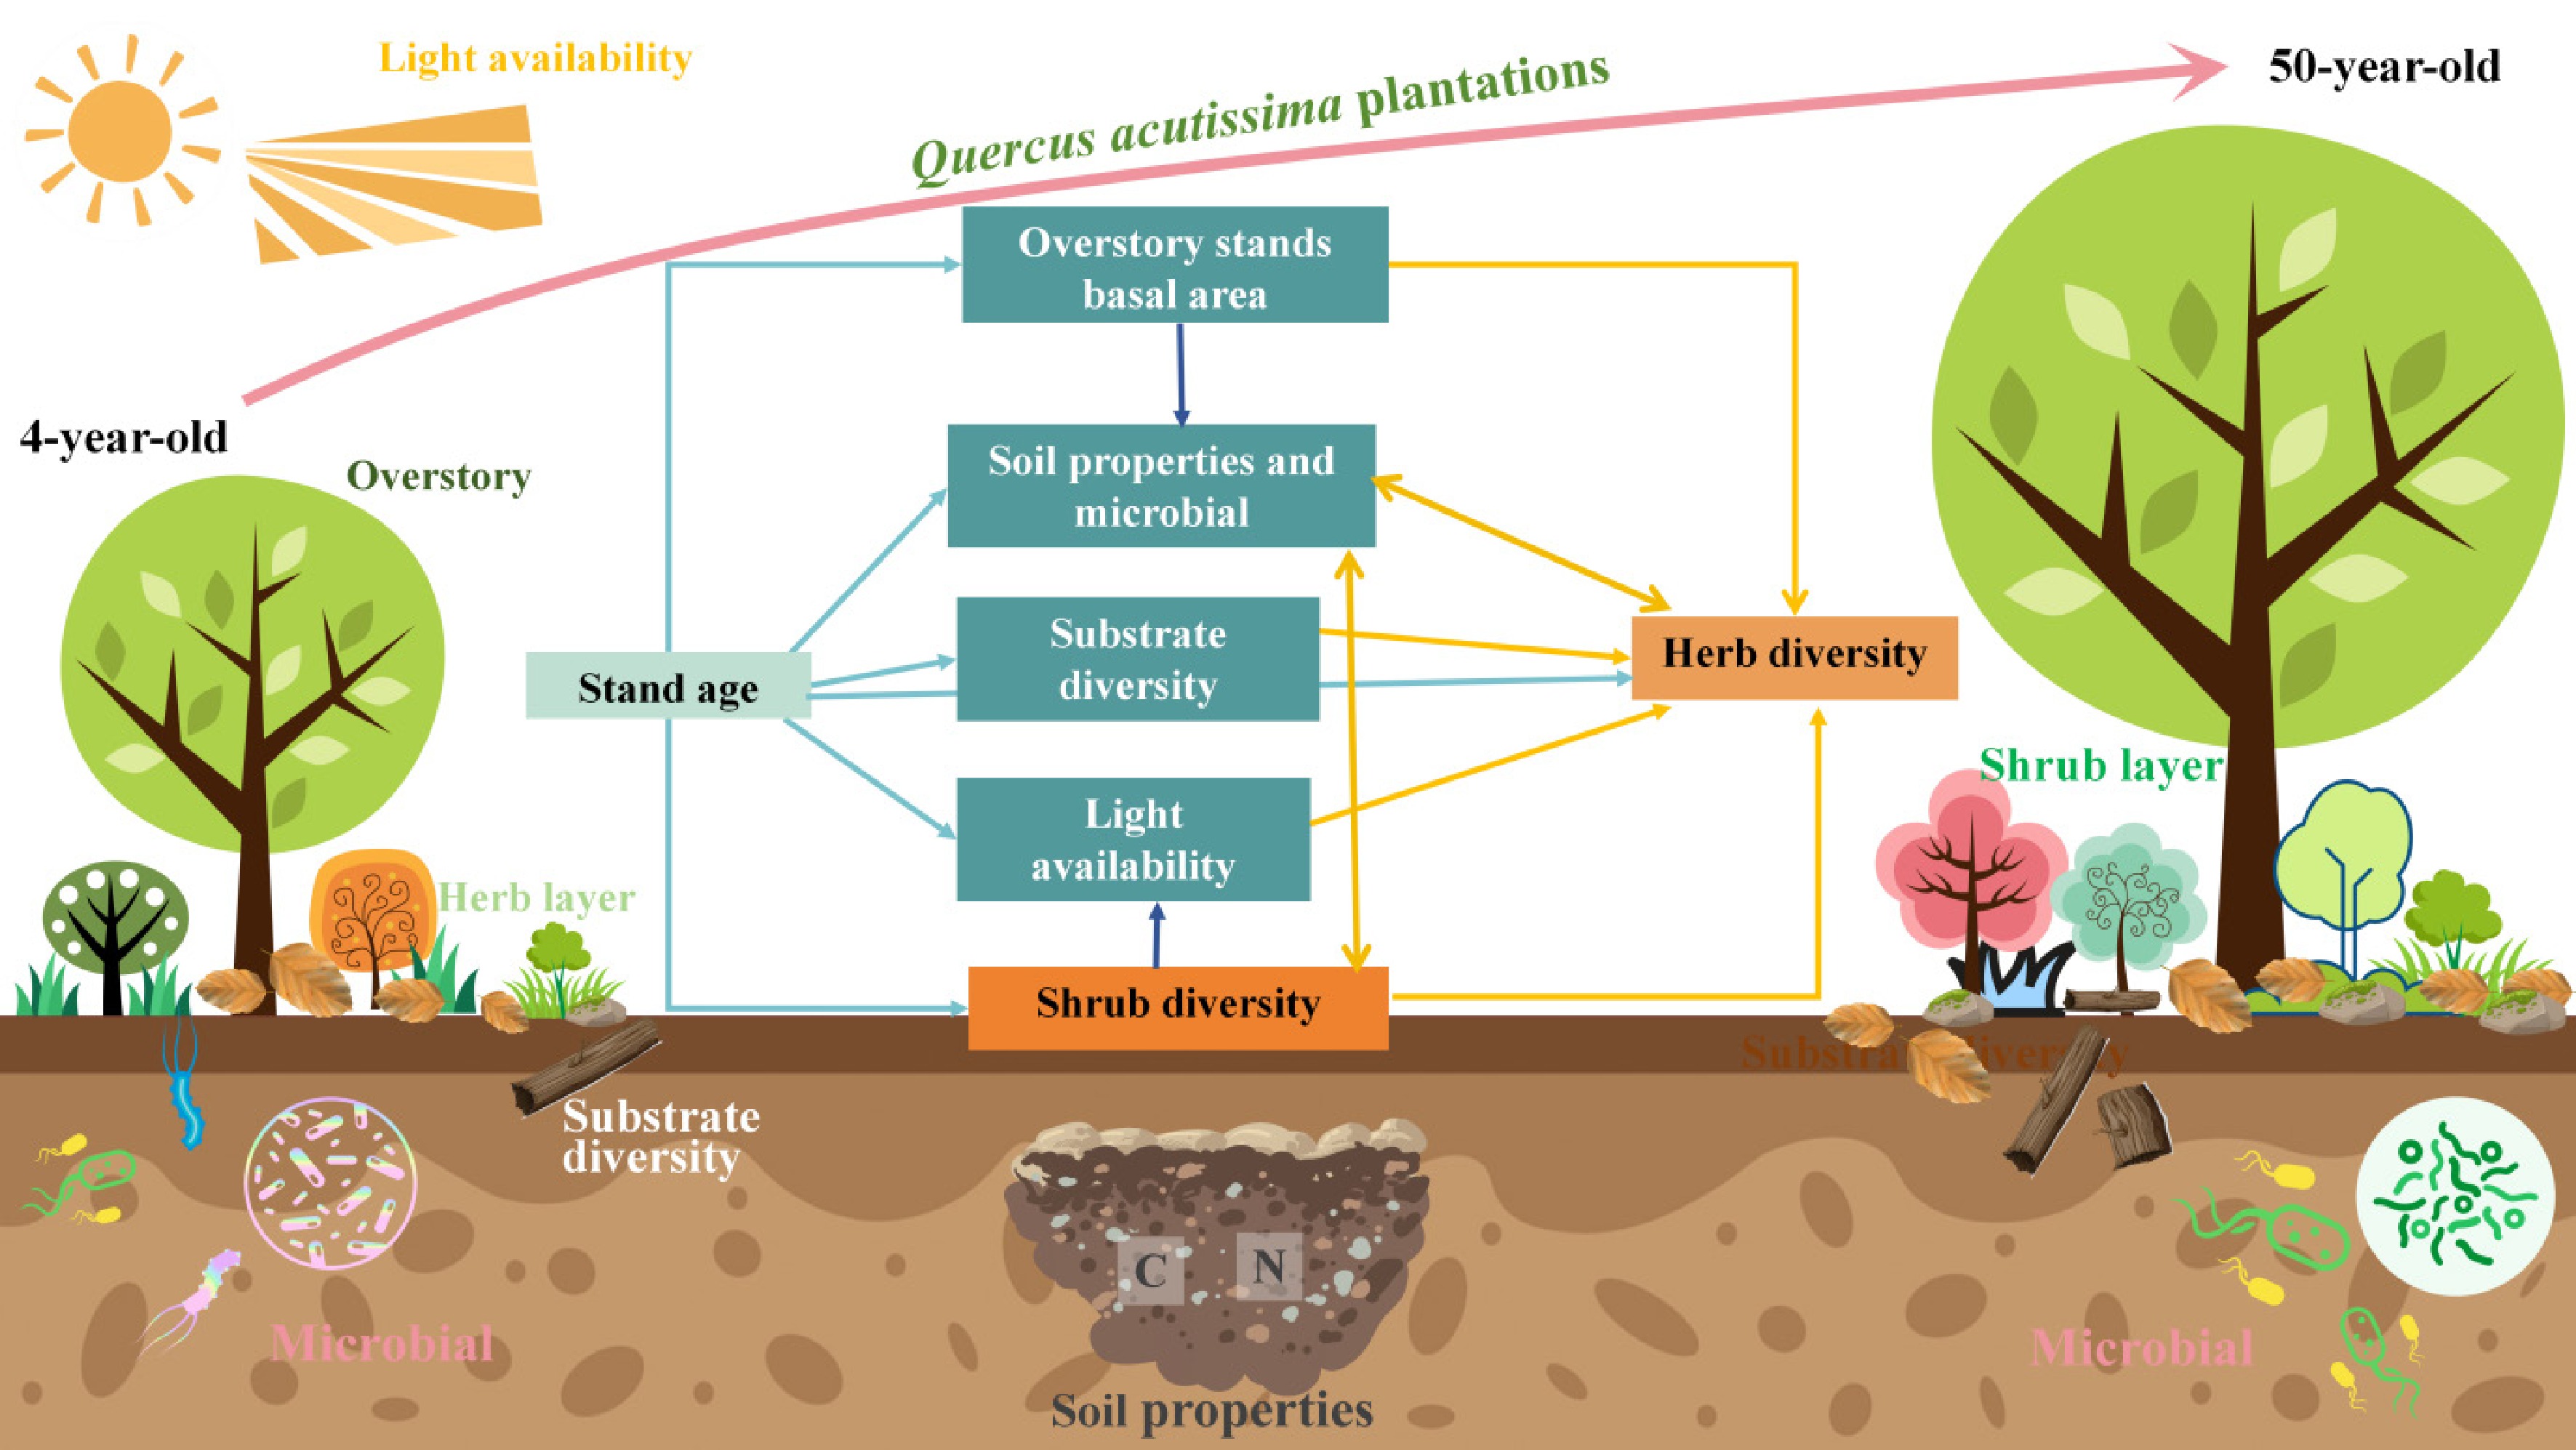
Figure 1.
Conceptual model of hypothesized relationships between the light availability, substrate diversity, and soil conditions on understory vegetation diversity.
-
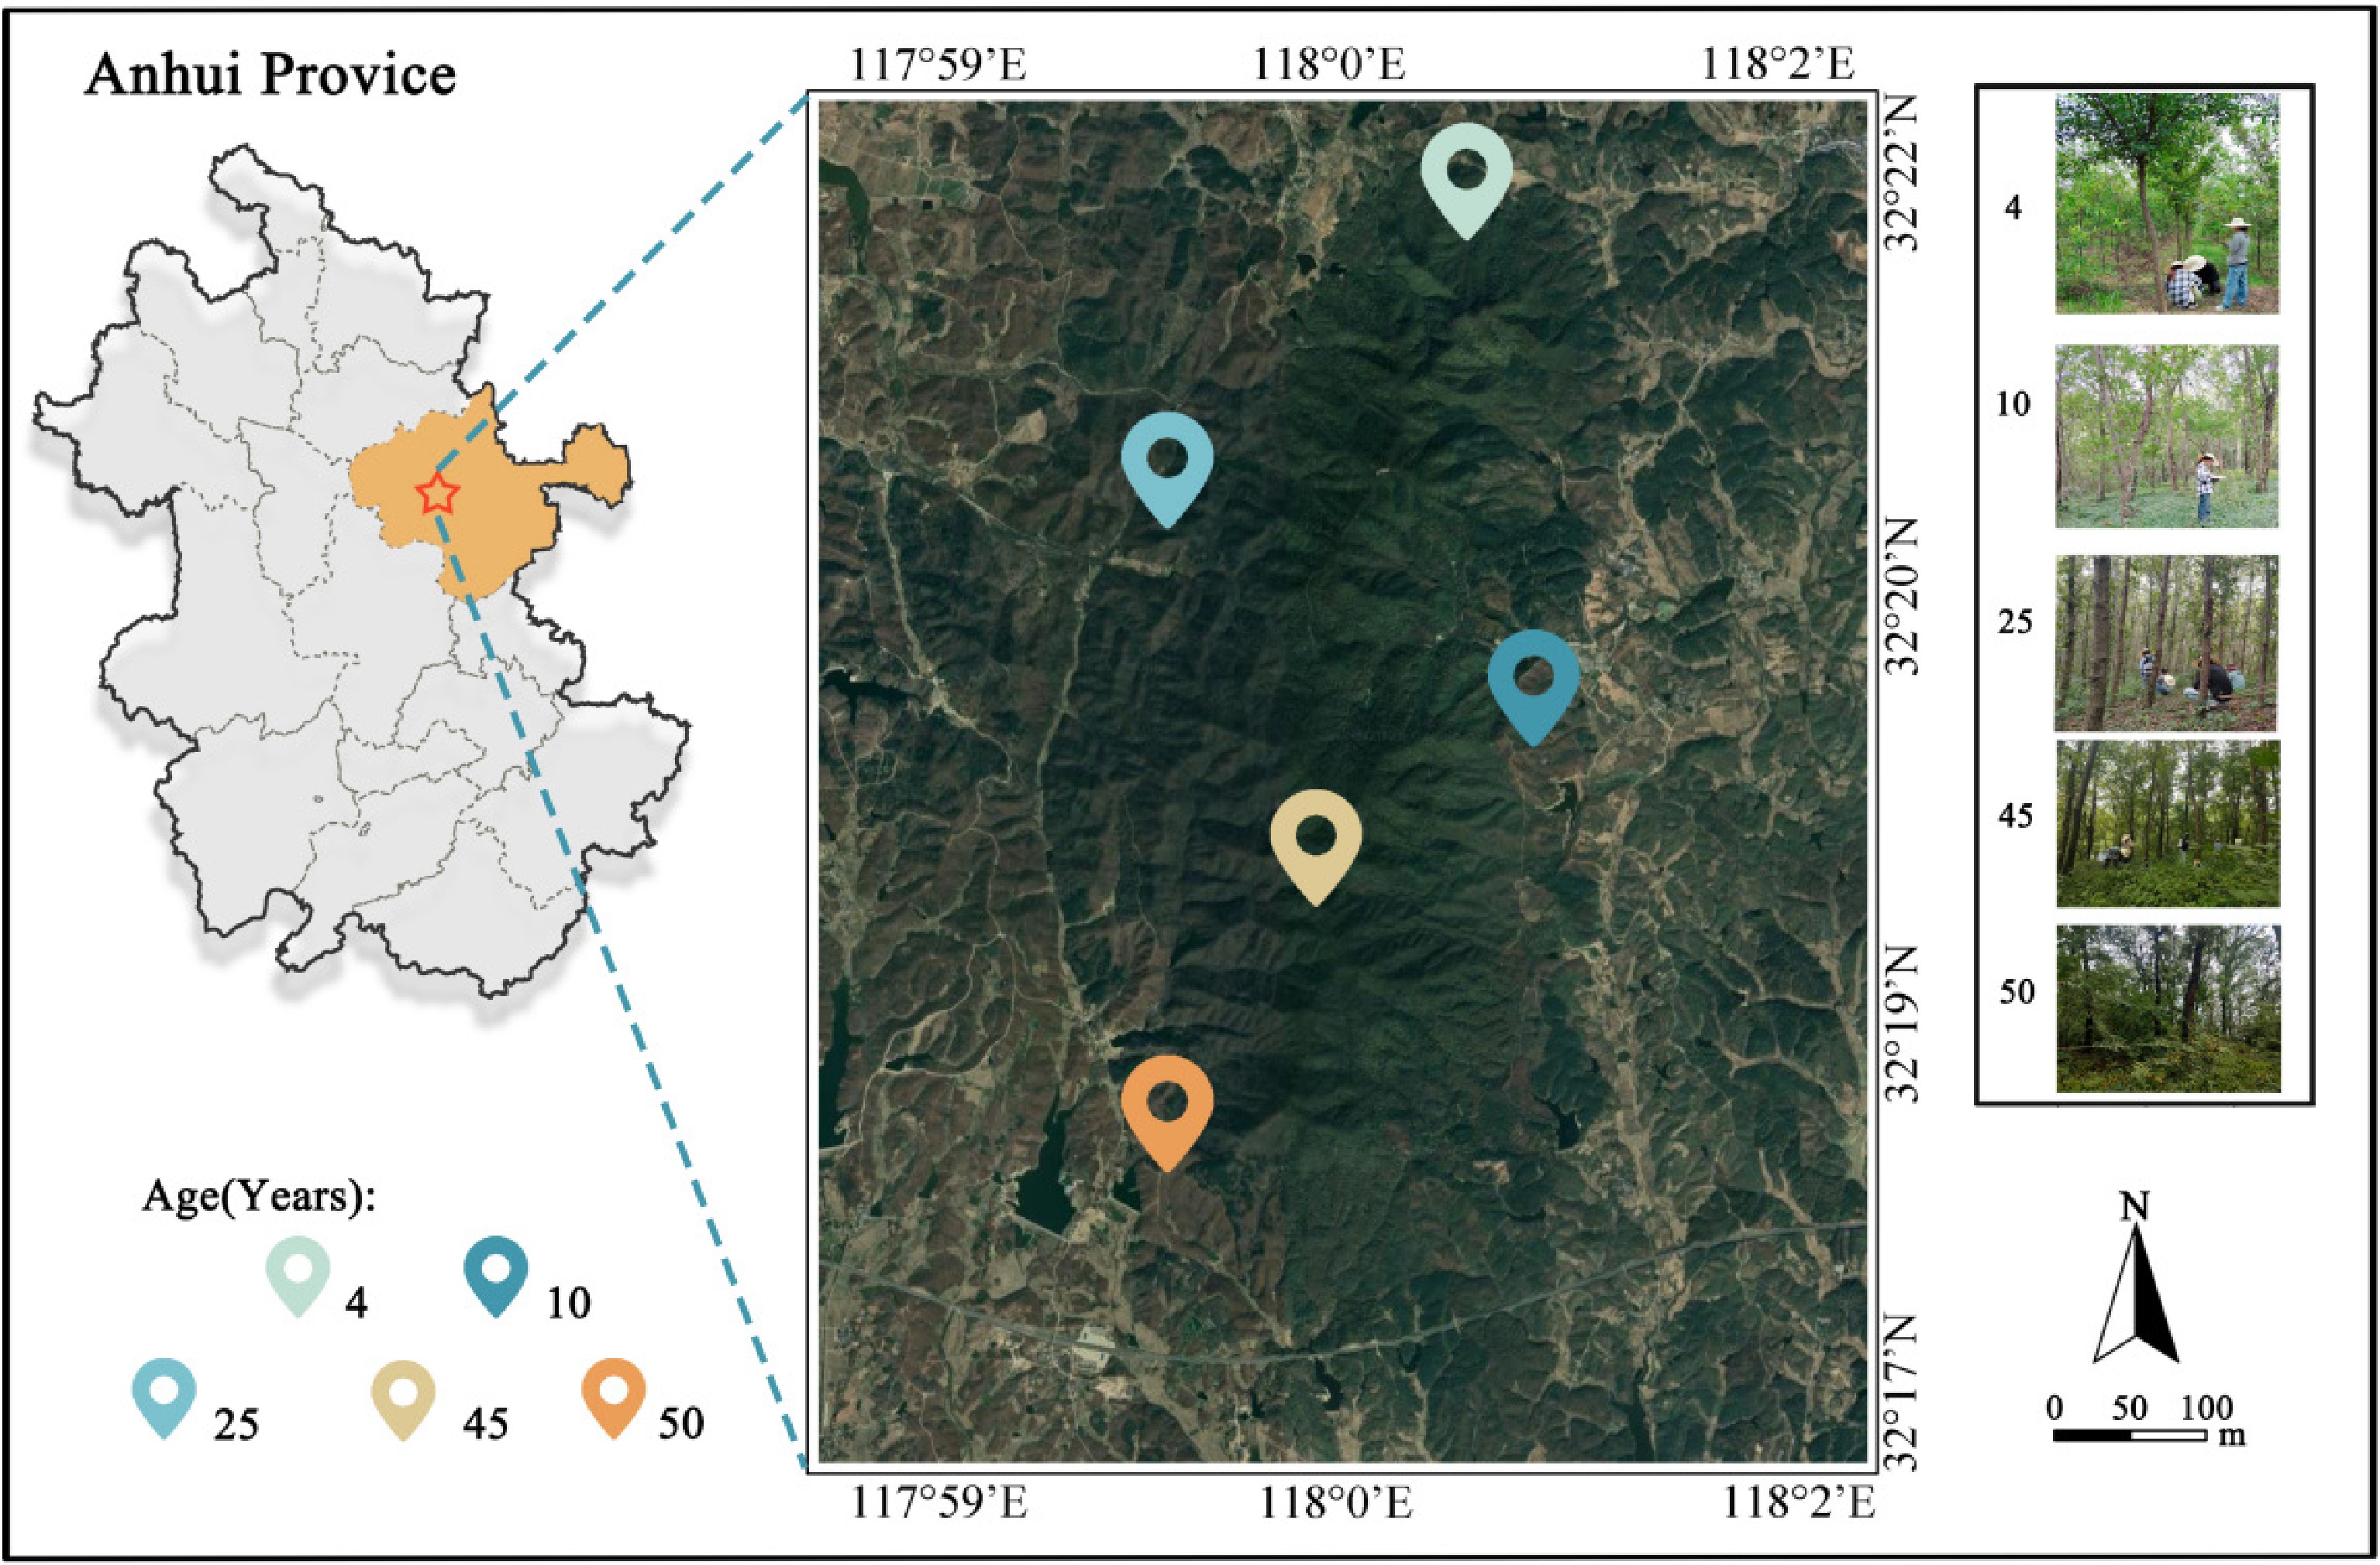
Figure 2.
Geographic context and distribution of sampling plots in Q. acutissima plantations at Huangfu Mountain, Chuzhou, Anhui Province, China. Geographical location of sampling sites in Anhui Province. Base map: Google Earth satellite imagery. Sampling sites were labeled by the authors using Photoshop. Map approval number: GS (2024) 0650.
-
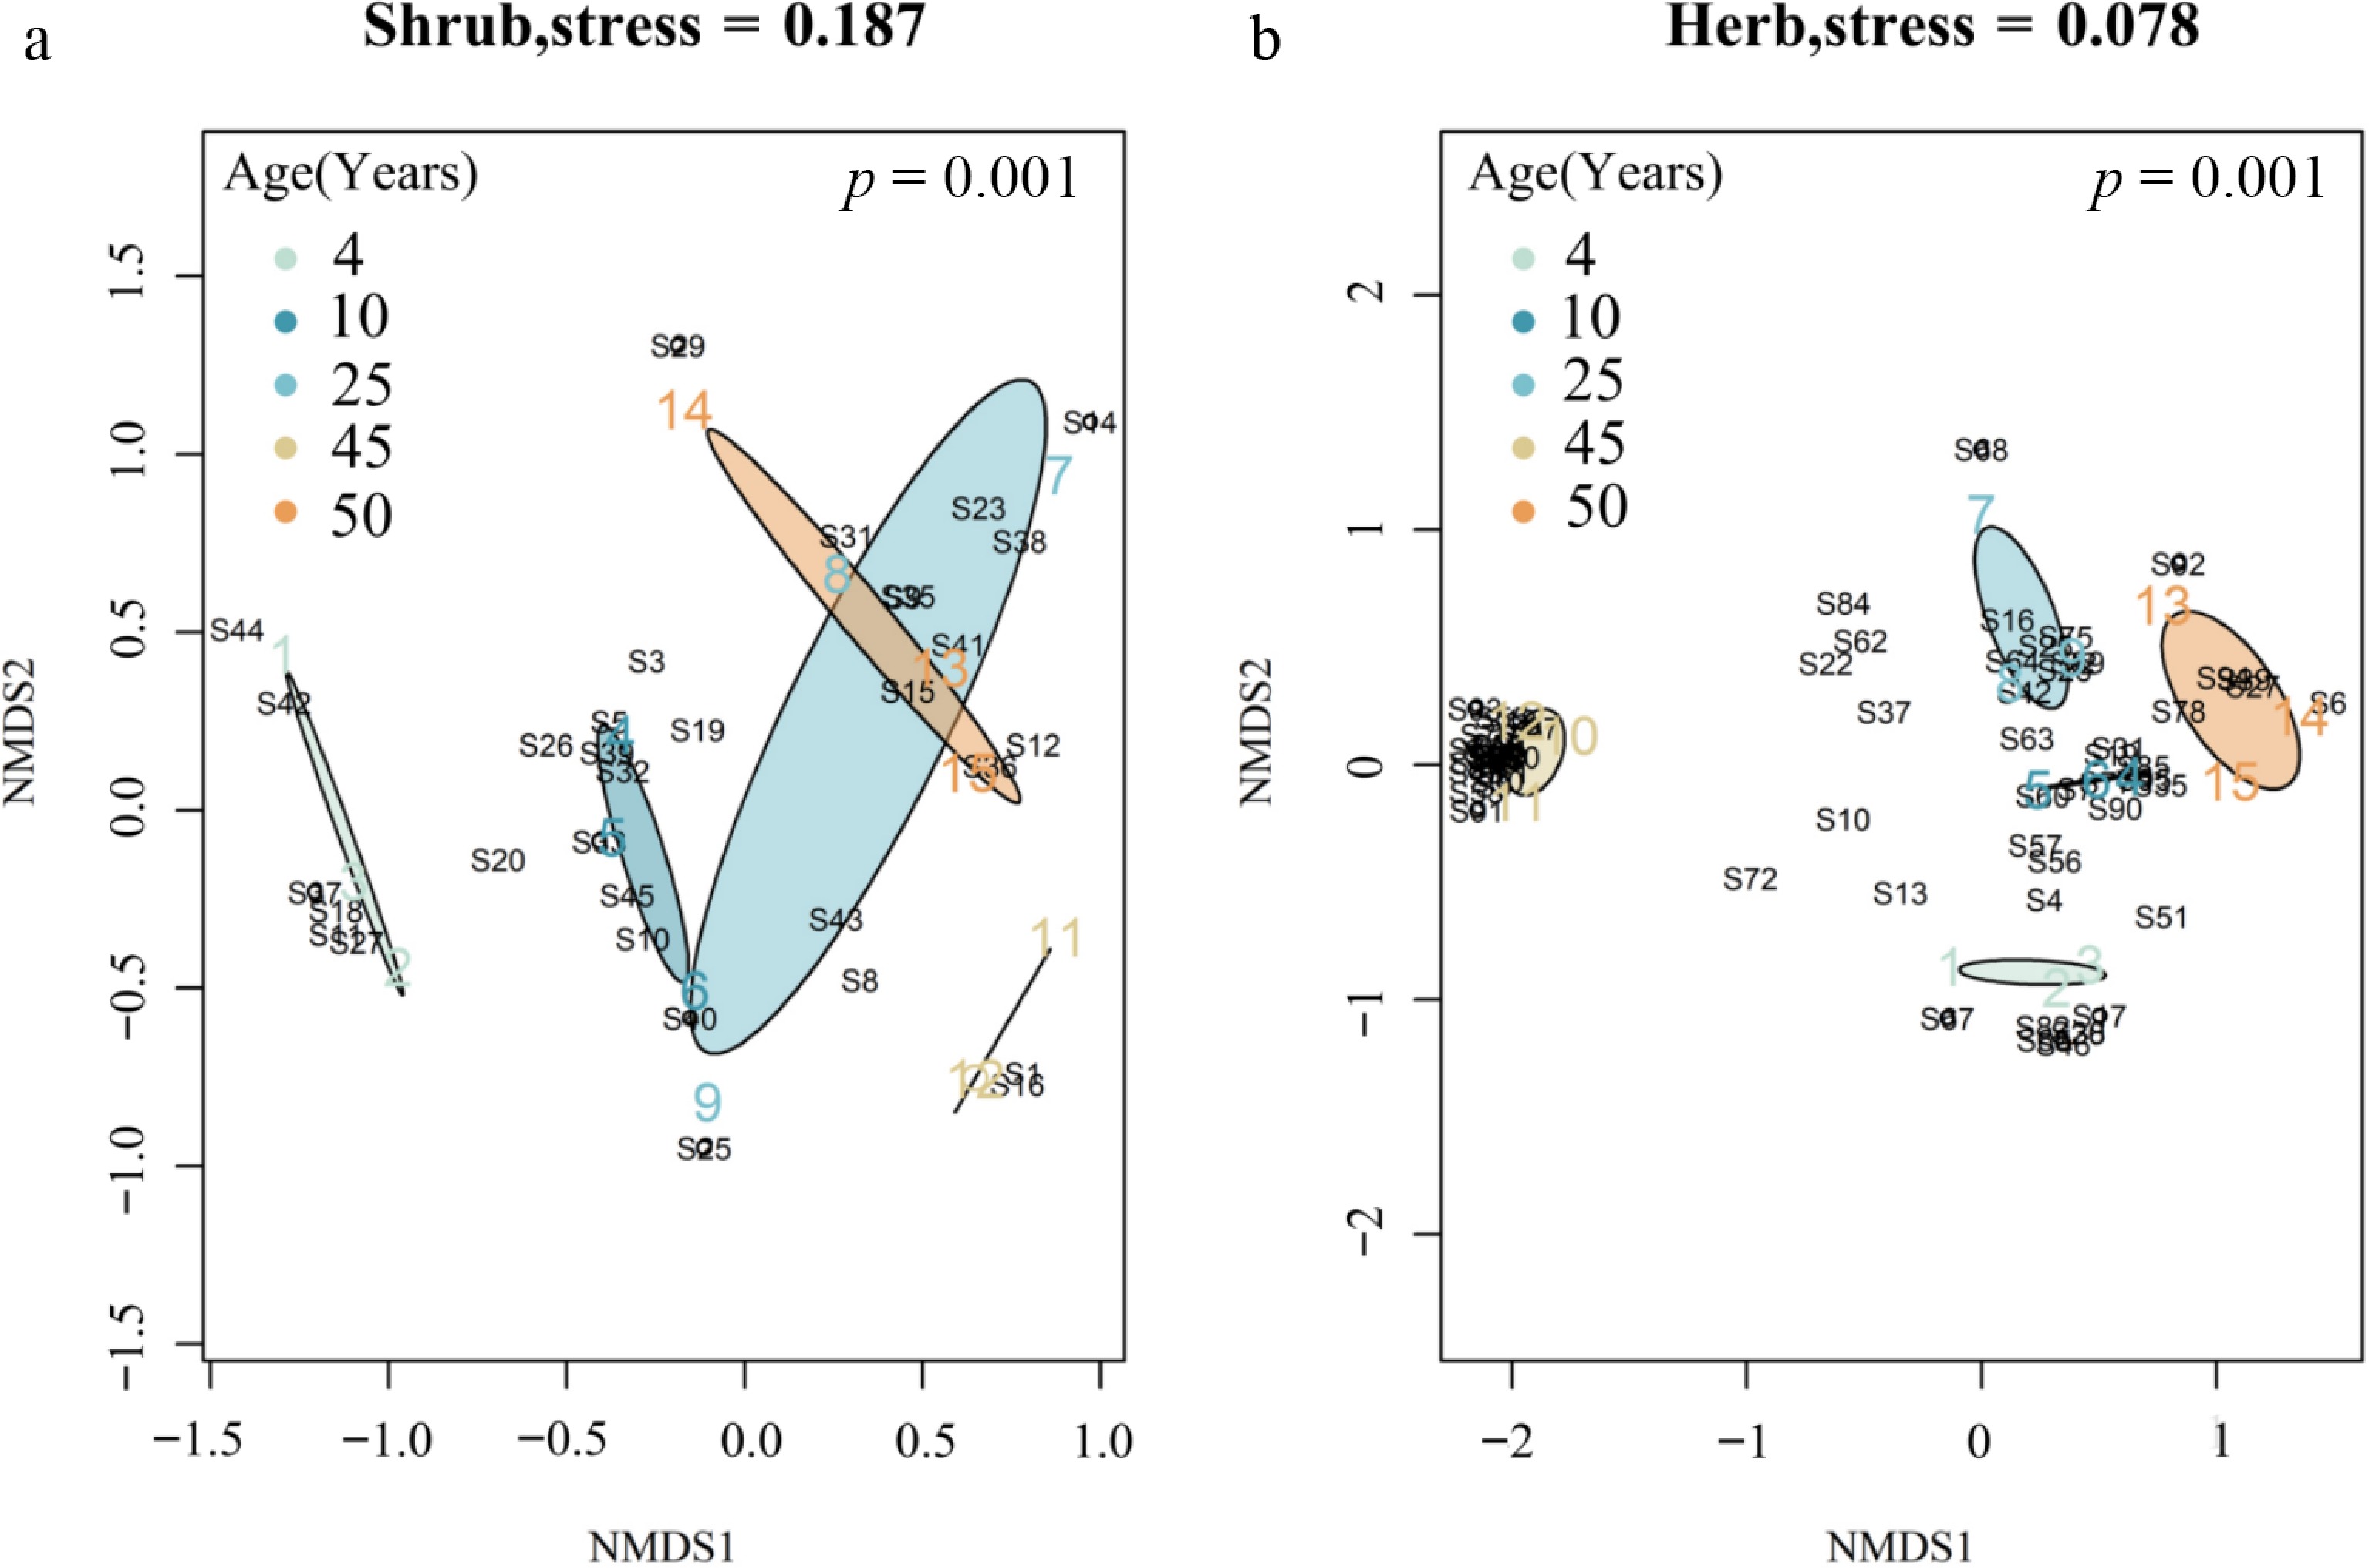
Figure 3.
Non-metric multidimensional scaling (NMDS) ordinations of shrub- and herb-layer species composition across stand-age classes. Each point represents a plot, distances among points reflect differences in community composition (closer points indicate more similar assemblages). Ellipses show the standard error around stand-age centroids, based on weighted-average scores.
-
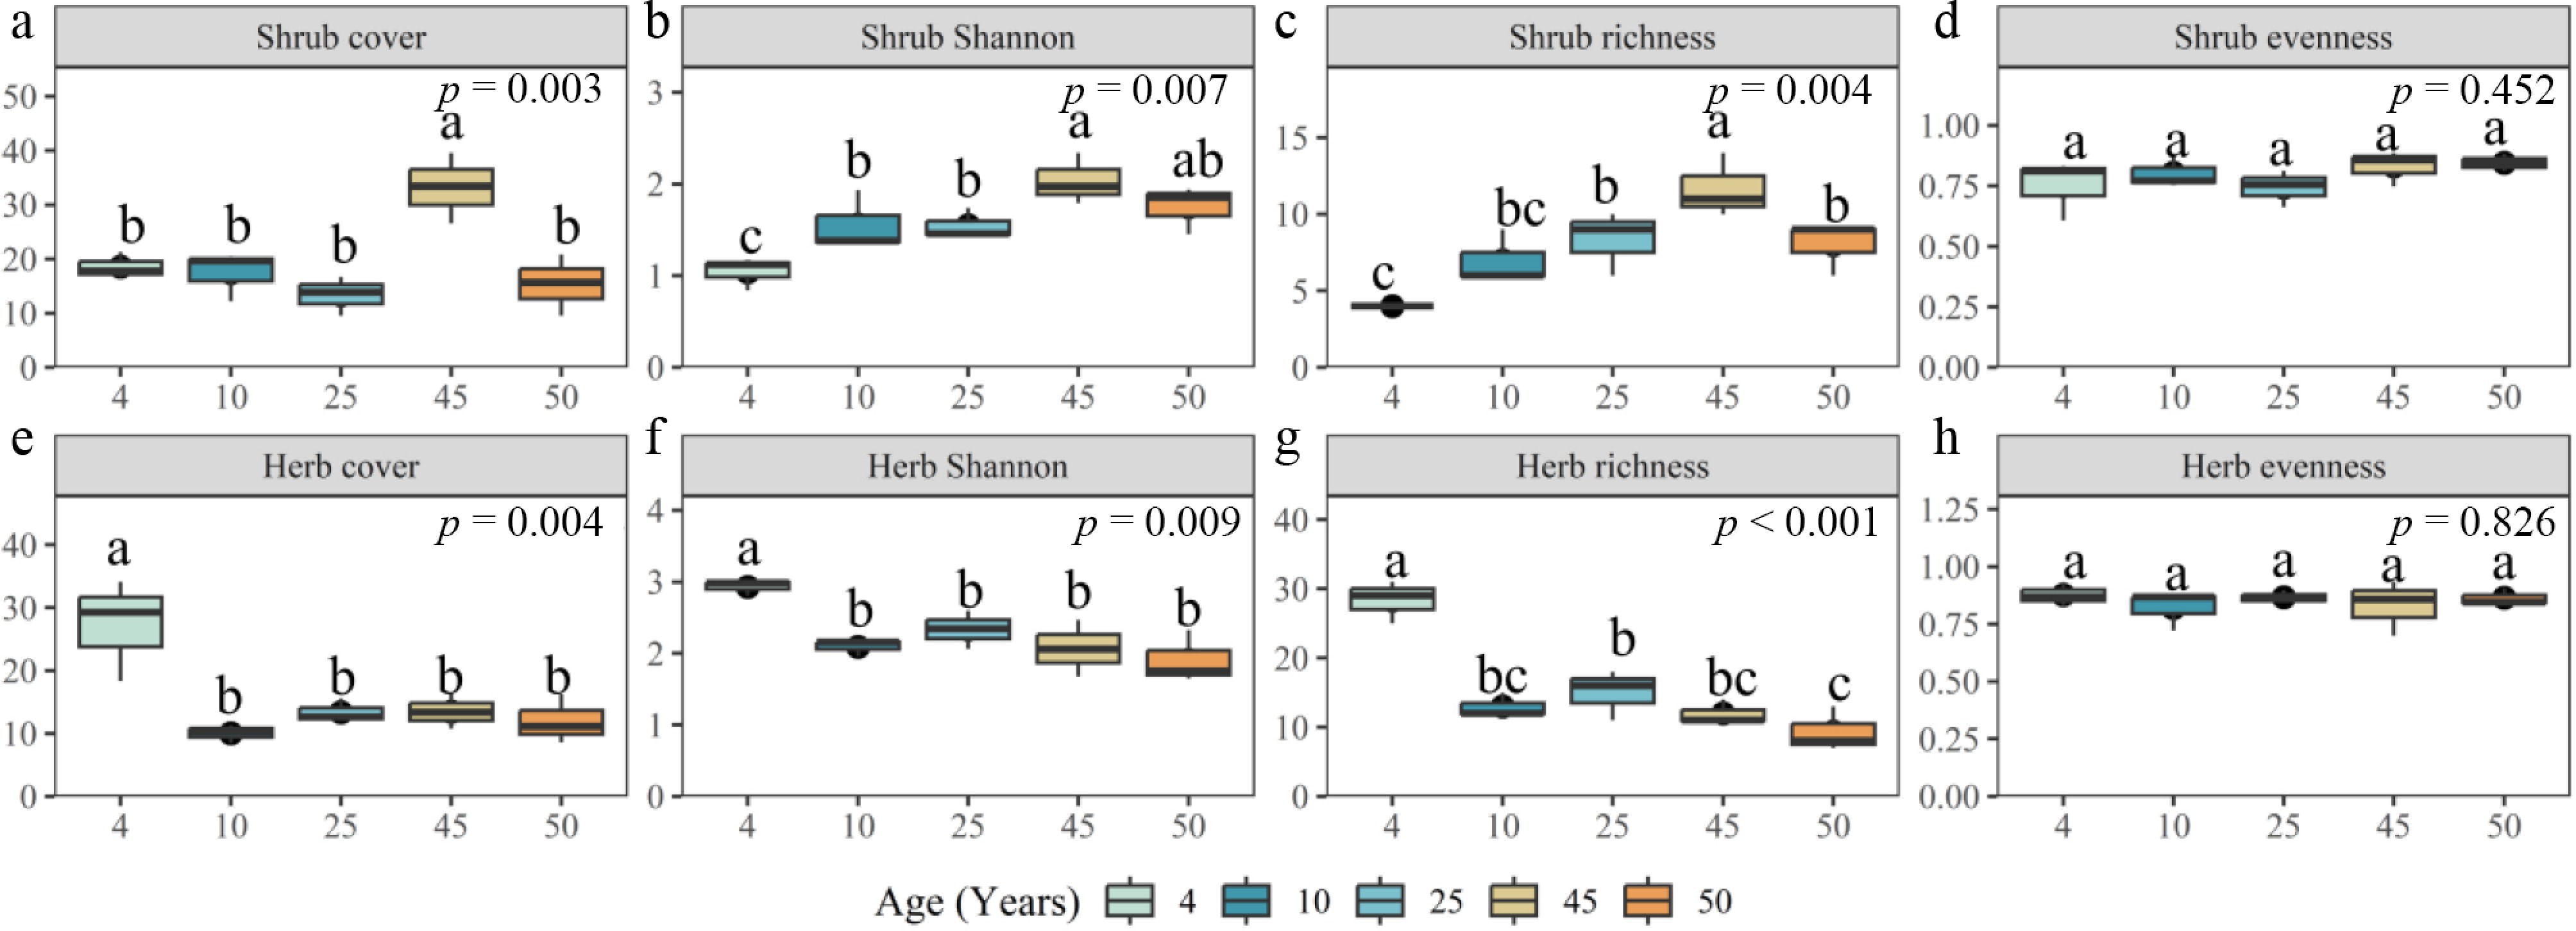
Figure 4.
Effects of stand age on understory vegetation cover and diversity in the shrub and herb layers of Q. acutissima plantations. For each age class, the figure summarizes plot-level estimates (n = 3) of (a), (e) percent cover; (b), (f) Shannon diversity (H′); (c), (g) species richness, and (d), (h) evenness. Data are presented as mean ± standard error. Where group comparisons were significant, different lowercase letters indicate statistically distinguishable age classes based on post hoc tests following one-way ANOVA (α = 0.05).
-
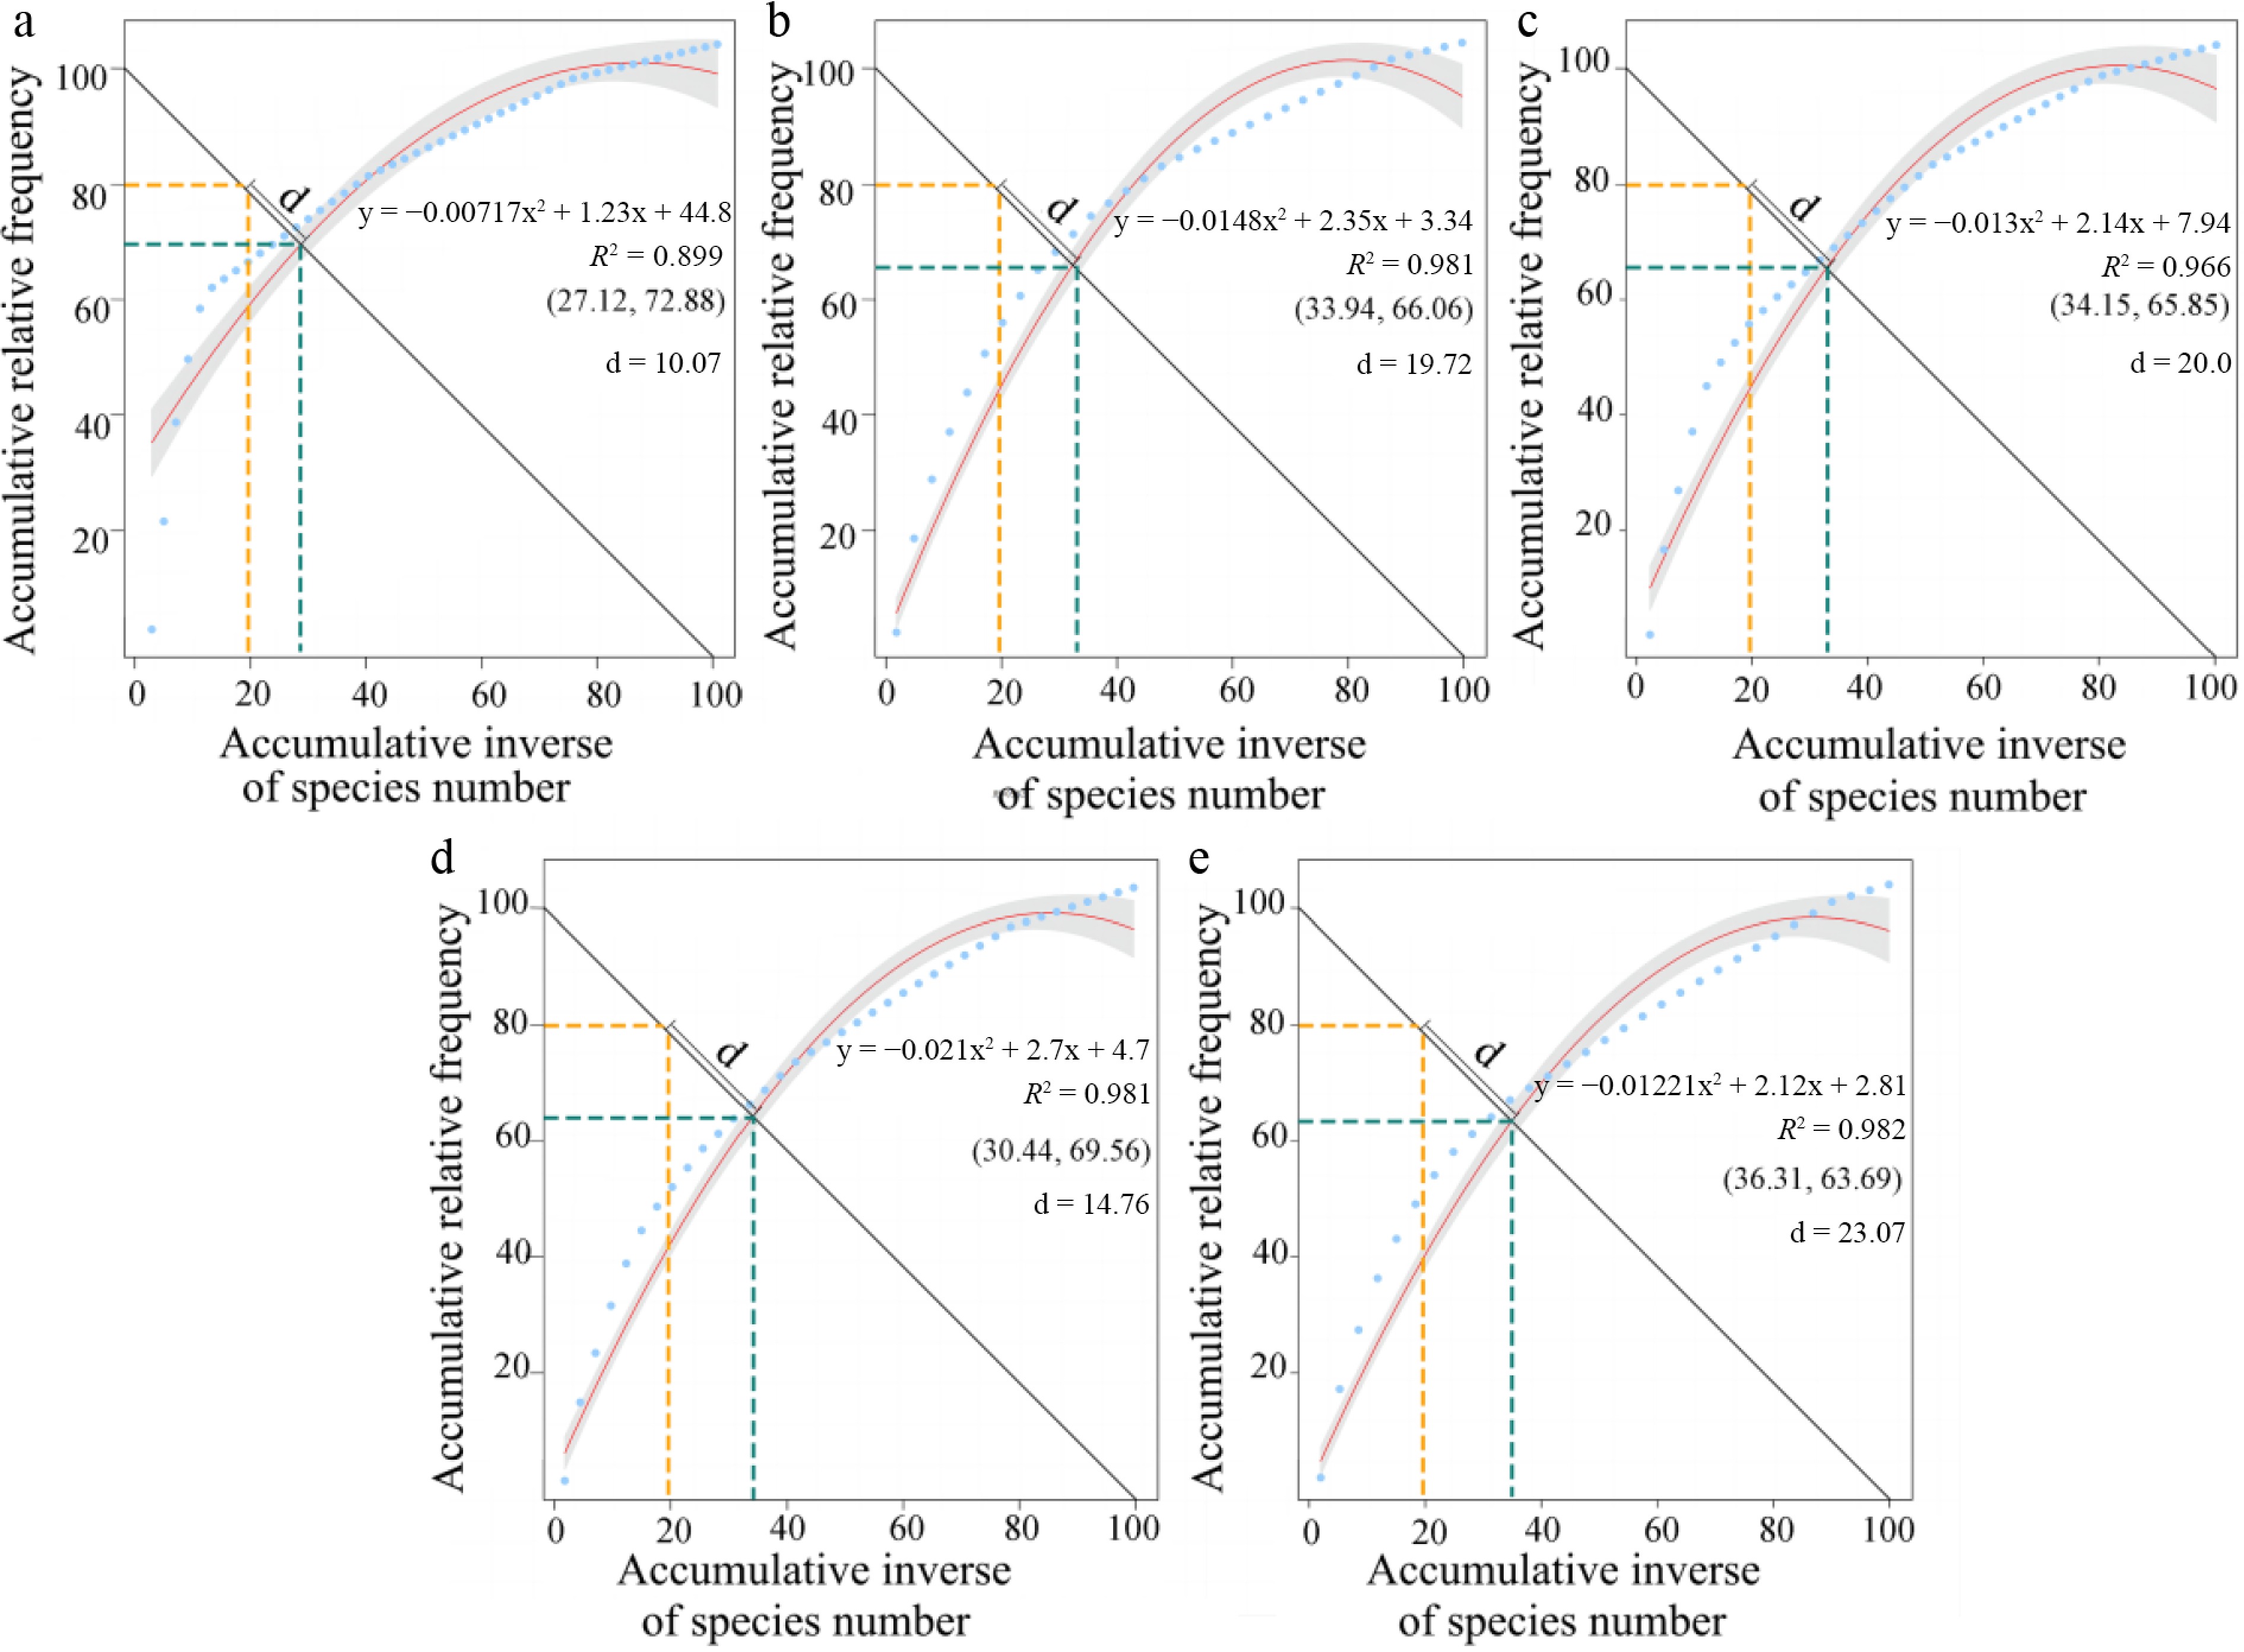
Figure 5.
Stand-age variation in dominance structure and inferred community stability in Quercus acutissima plantations based on the Godron approach. Panels (a)–(e) correspond to stands aged 4, 10, 25, 45, and 50 years, respectively. In each panel, species are ranked by decreasing relative importance and plotted as cumulative relative importance (x), against cumulative species proportion (y). A quadratic function is fitted to the (y)–(x) relationship to describe community dominance structure. The stability index (d) is calculated as the Euclidean distance between the fitted intersection point ([x, y]), and the theoretical reference point (20, 80), where smaller (d) values indicate a dominance structure closer to the reference configuration. Line types indicate the reference point (yellow), the fitted intersection (green), and the fitted curve (red).
-
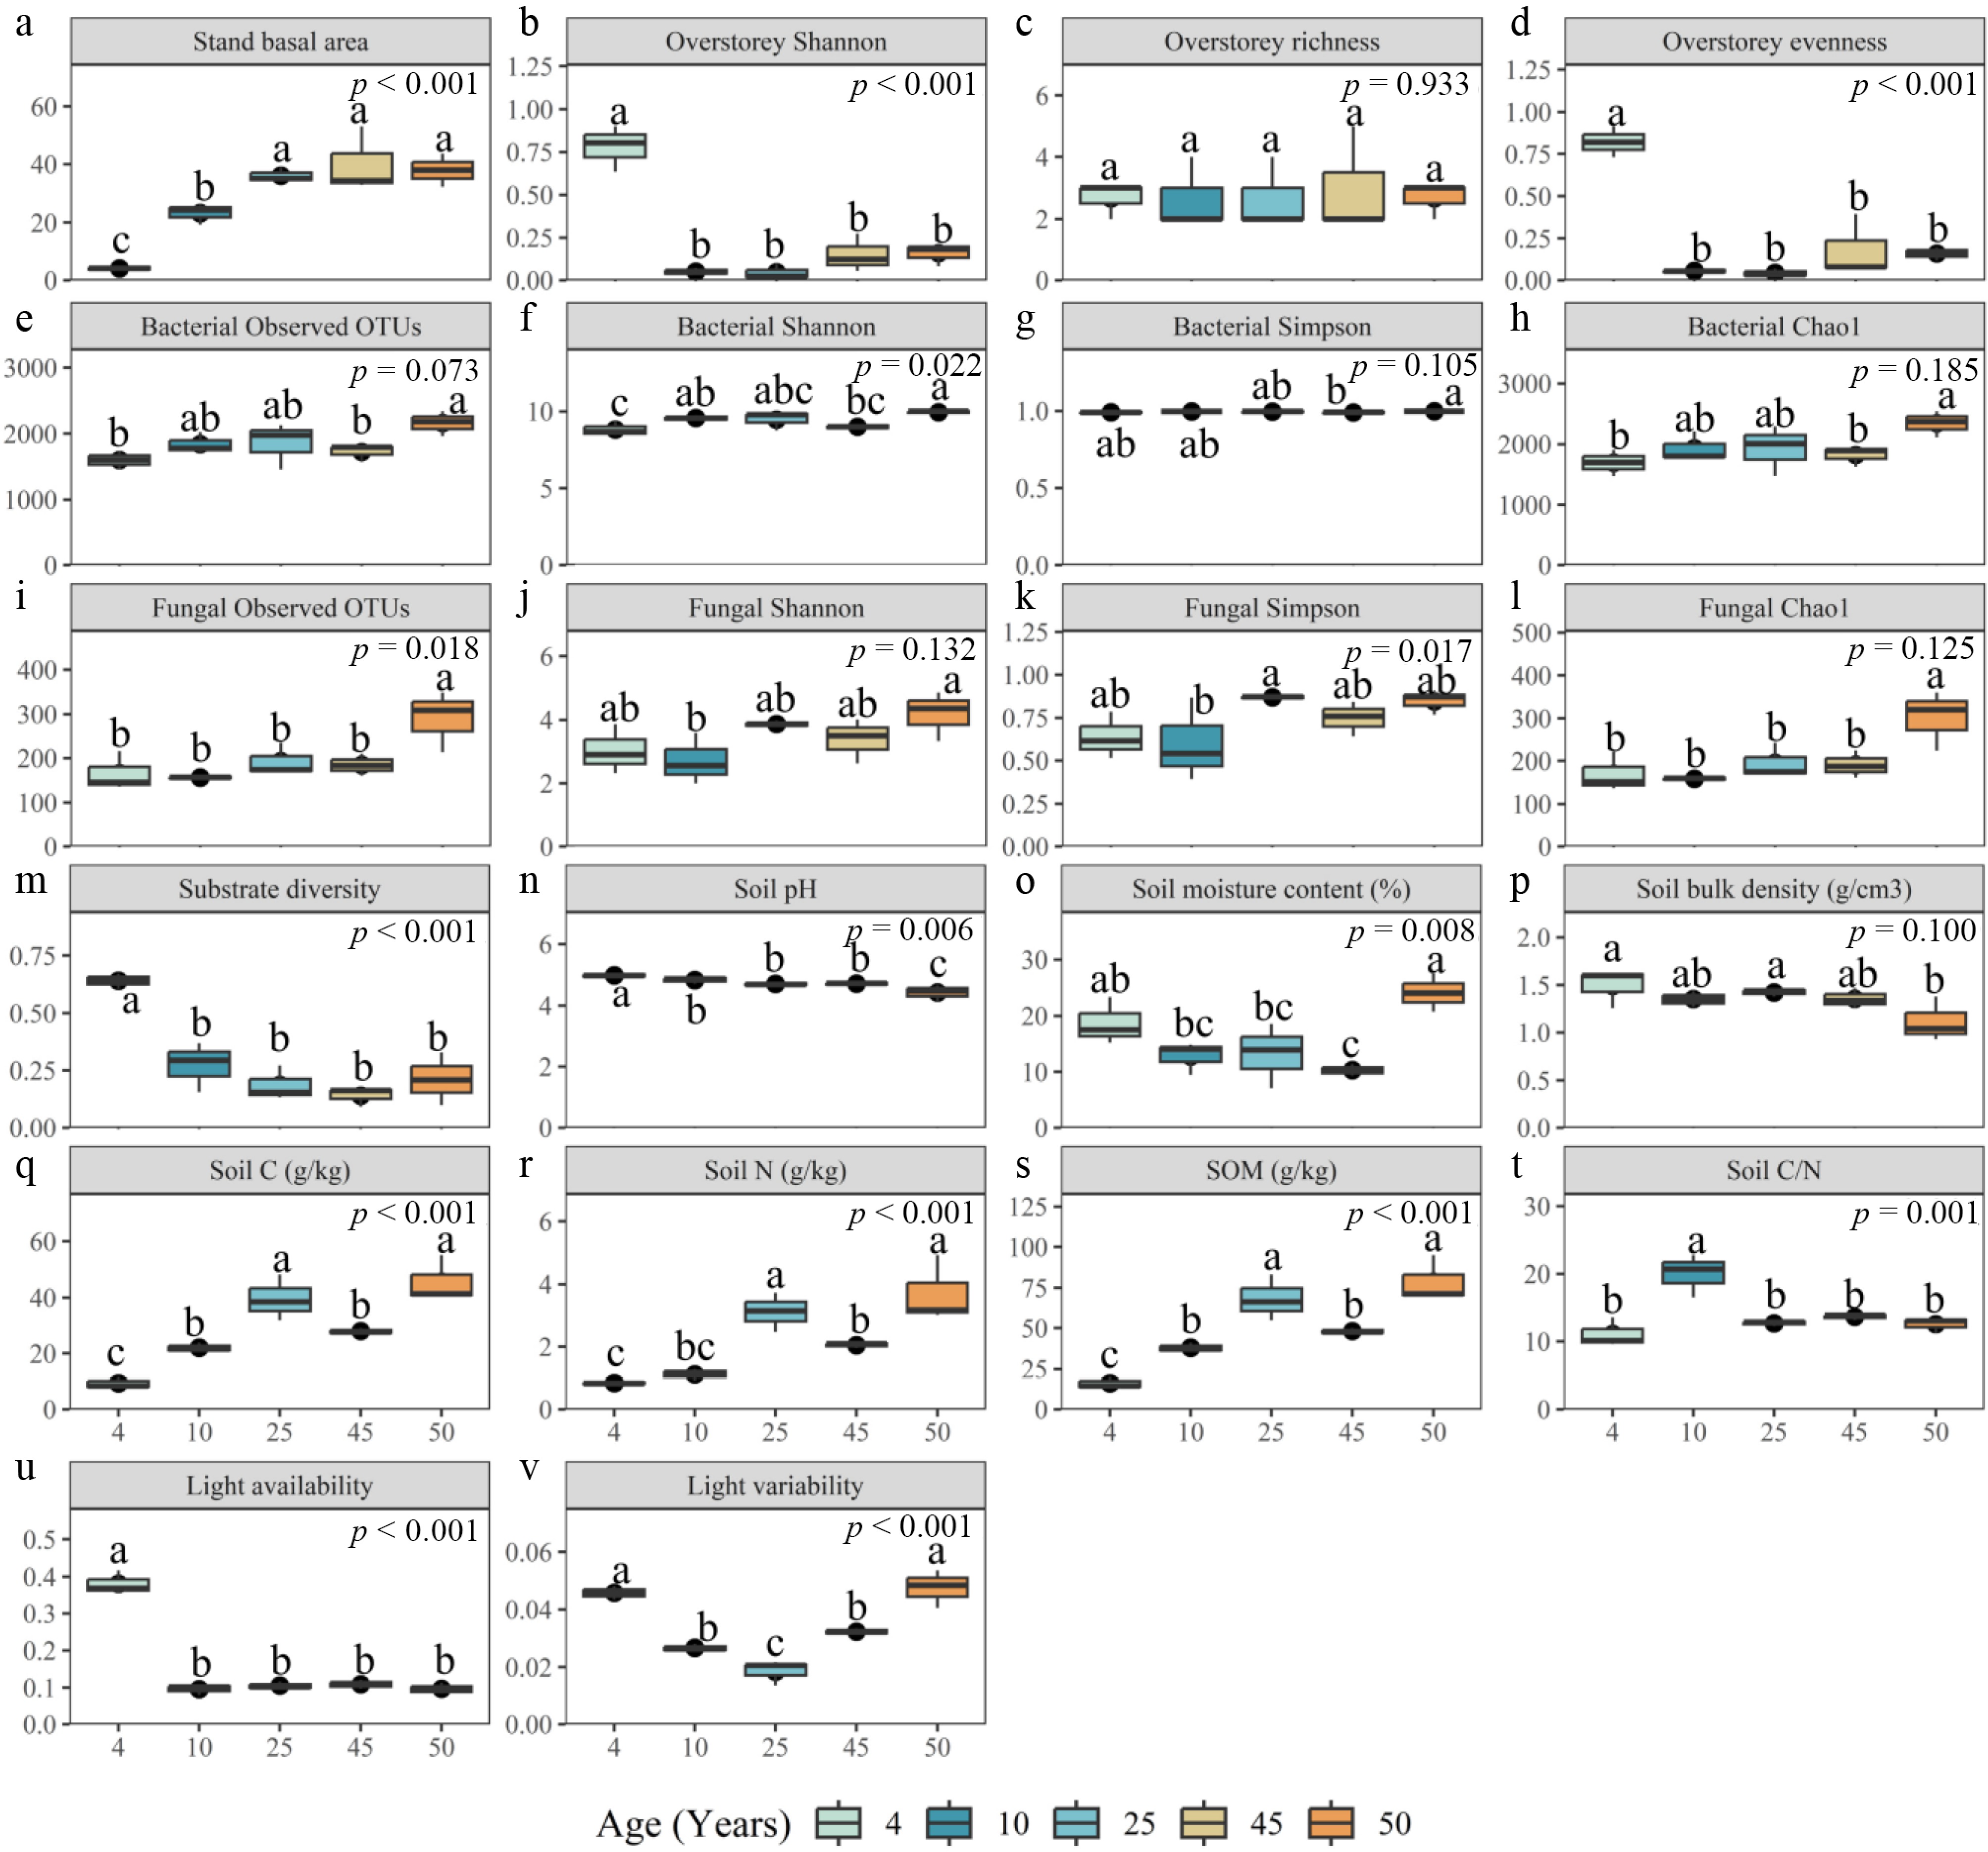
Figure 6.
Stand-age differences in overstory structure, soil properties, light environment, substrate heterogeneity, and microbial diversity in Quercus acutissima plantations. Panels show (a) stand basal area; (b)–(d) overstory diversity metrics (Shannon, richness, evenness); (e)–(h) bacterial diversity indices (observed OTUs, Shannon, Simpson, Chao1); (i)–(l) fungal diversity indices (observed OTUs, Shannon, Simpson, Chao1); (m) substrate diversity; (n)–(t) soil physicochemical variables (pH, moisture content, bulk density, soil C, soil N, organic matter, and C/N), and (u)–(v) canopy light metrics (mean light availability and light variability). Data is summarized across plots within each age class (4, 10, 25, 45, and 50 years; n = 3 per class). Boxes indicate the interquartile range with the median; whiskers show the 5th–95th percentiles, and points represent the plot values. Reported p values are from one-way ANOVA. Different letters denote significant pairwise differences among age classes based on post hoc comparisons (α = 0.05).
-
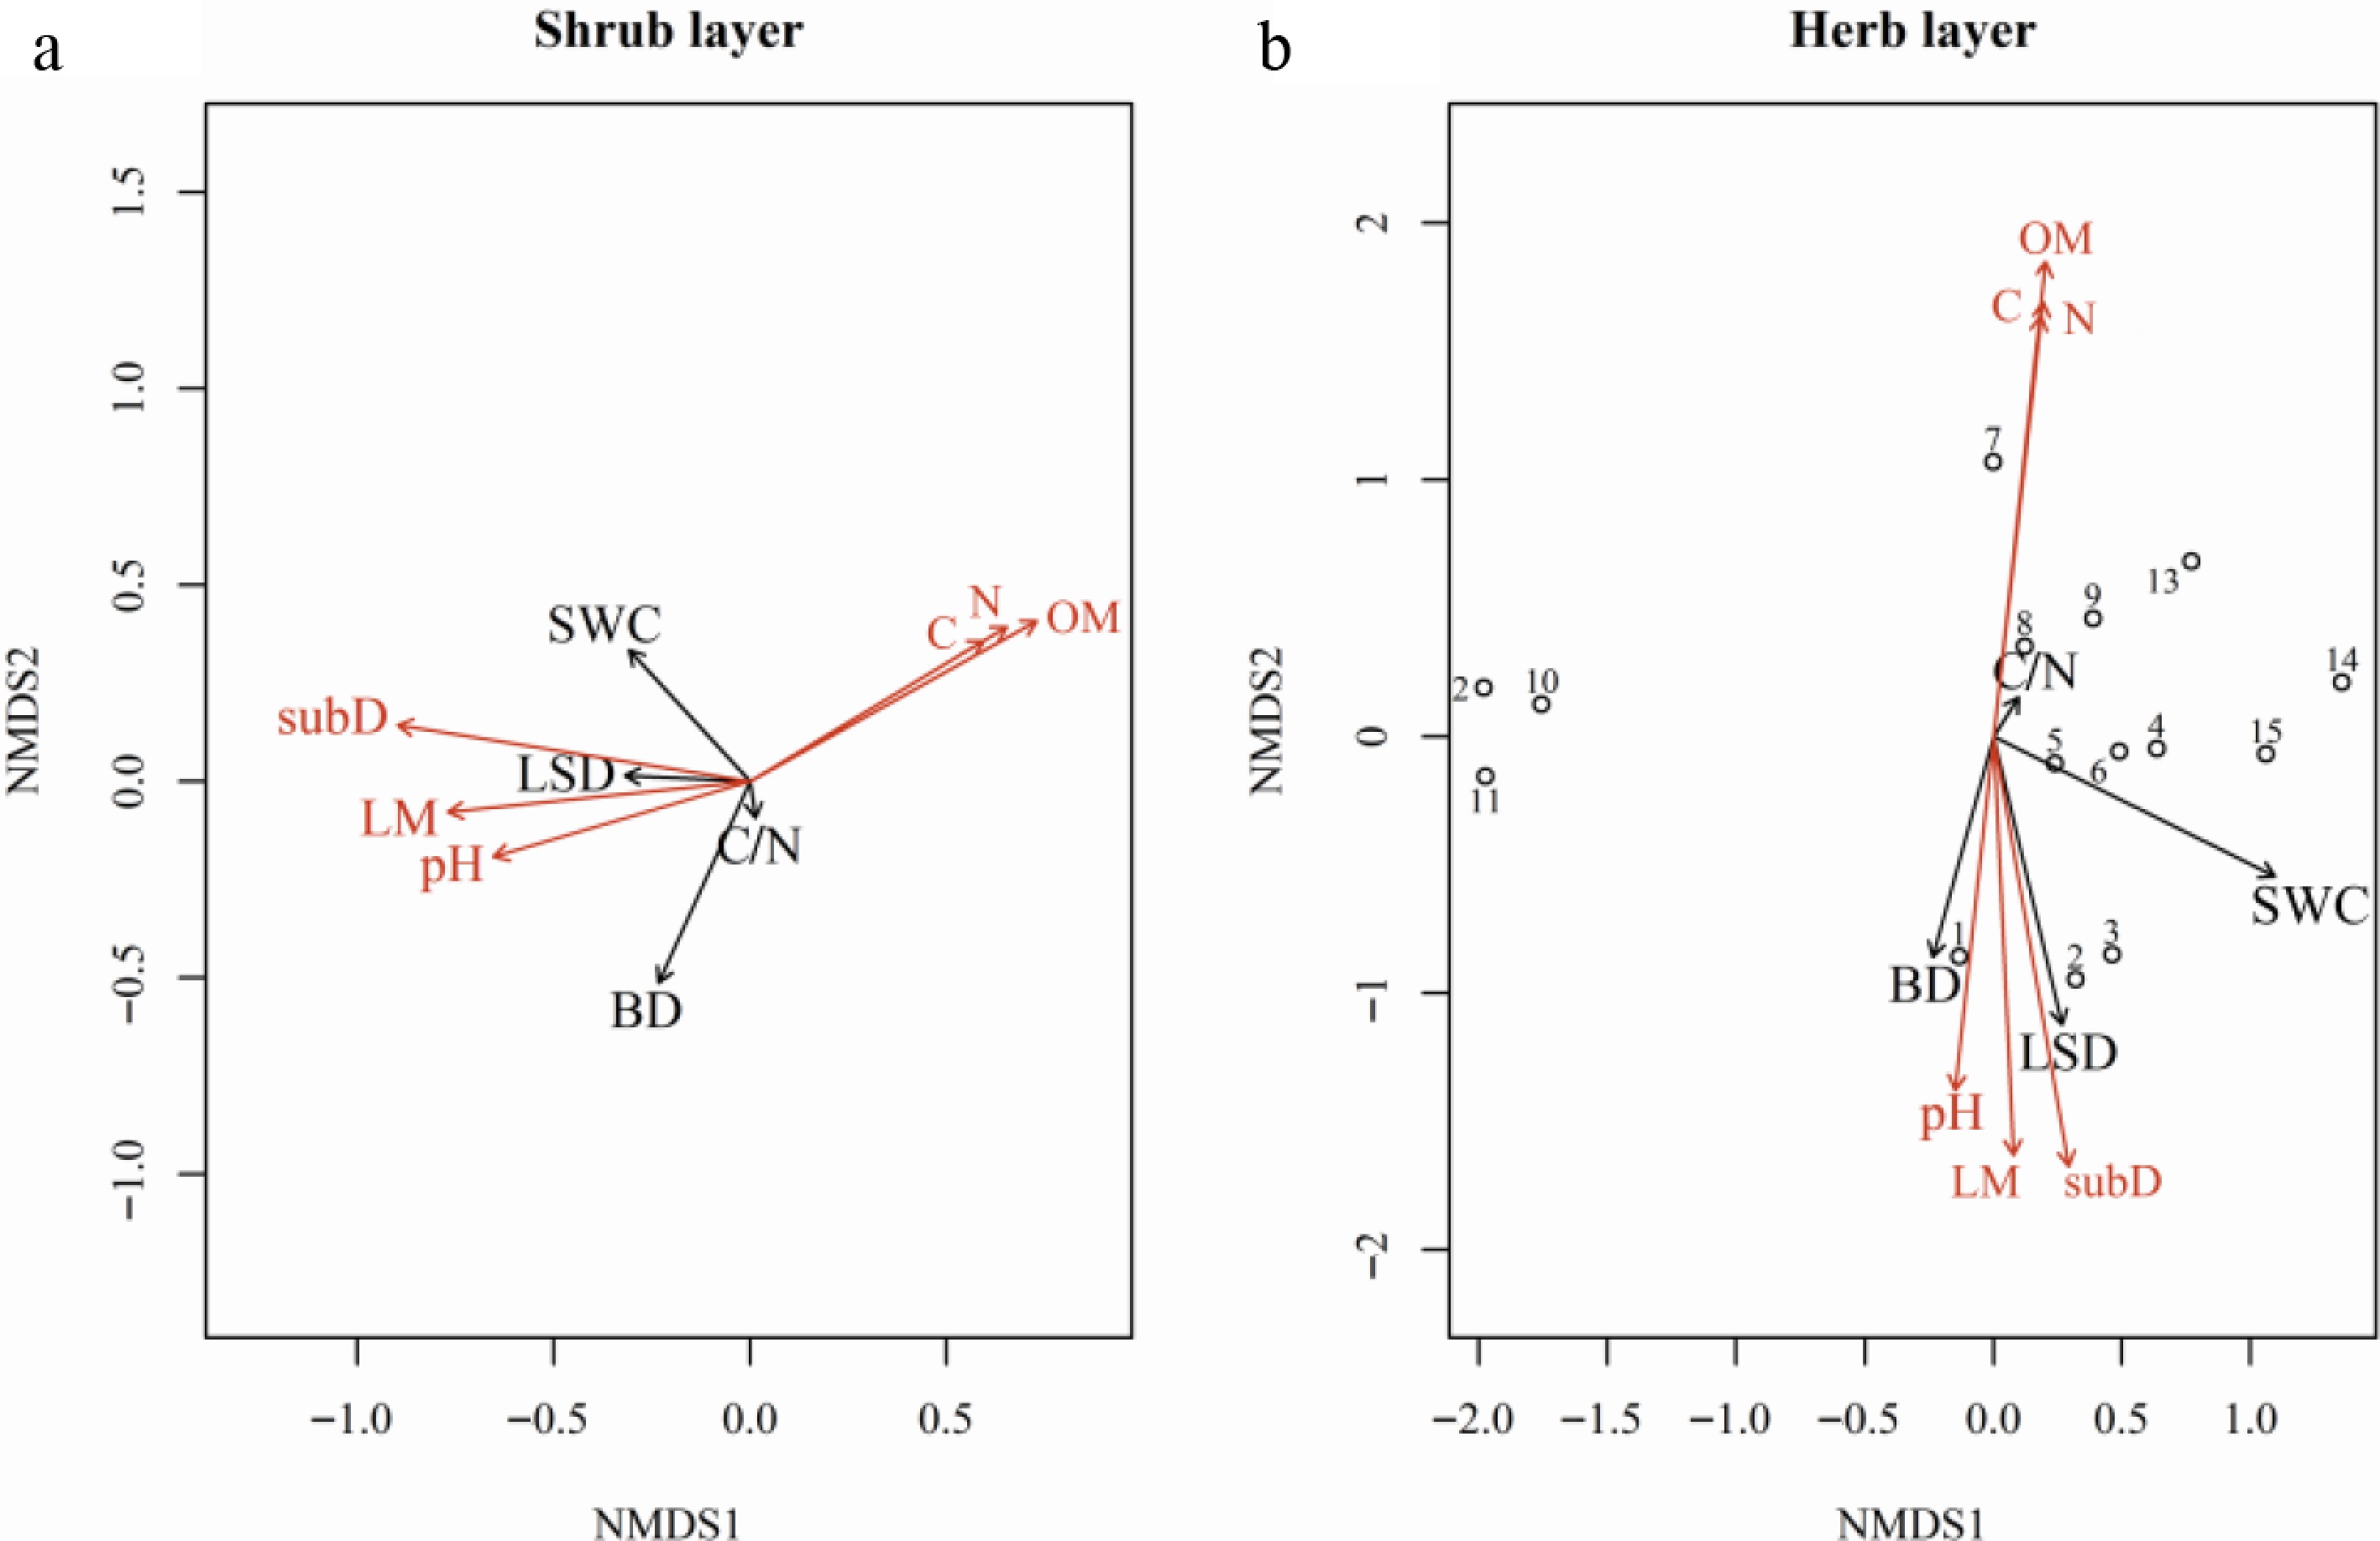
Figure 7.
NMDS ordinations of understory community composition with fitted environmental vectors for the (a) shrub, and (b) herb layers. Points represent plots, and arrows show the direction and strength of correlations between community structure and measured variables: mean light availability (LM), light variability (LSD), substrate diversity (subD), soil carbon (C), soil nitrogen (N), soil organic matter (SOM), soil C/N ratio, soil pH, soil water content (SWC), and soil bulk density (BD). Arrow length is proportional to the correlation magnitude, and arrow direction indicates increasing values of the corresponding variable. Vectors are colored by significance of the fitted relationship (red: p < 0.05; black: p ≥ 0.05).
-
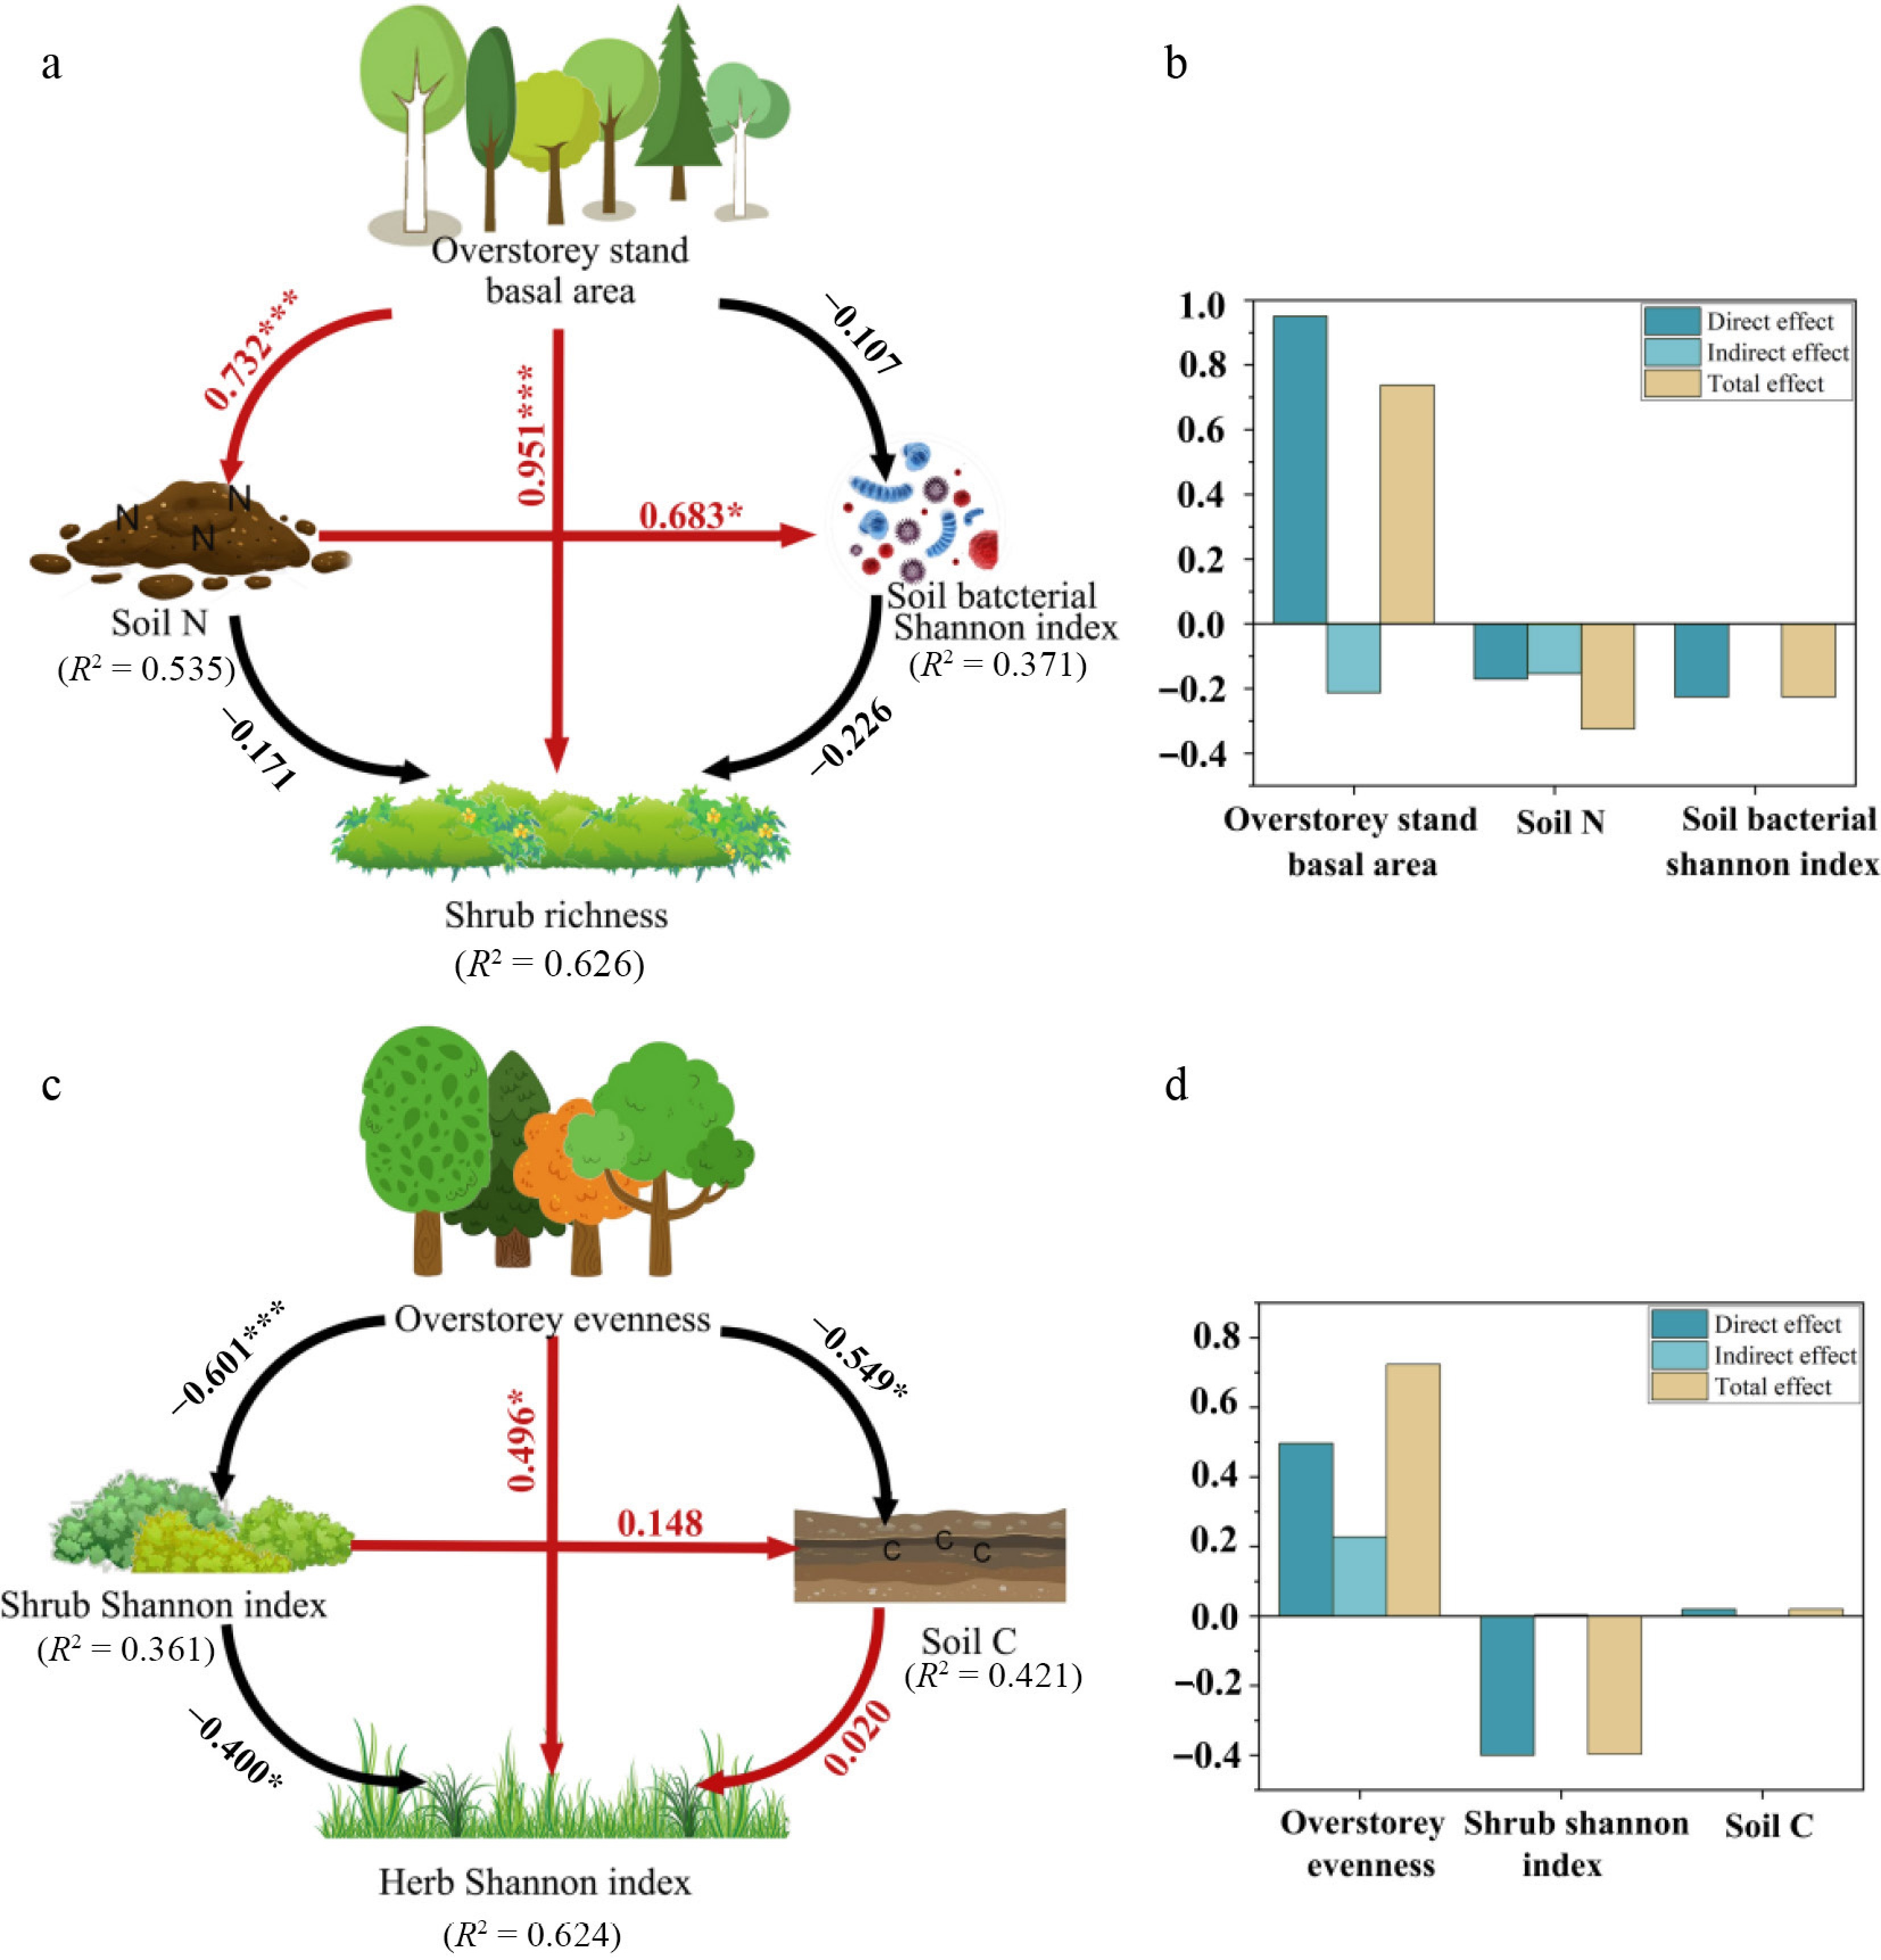
Figure 8.
Structural equation models summarizing hypothesized pathways linking overstory attributes, soil conditions, soil bacterial diversity, and understory diversity in Quercus acutissima plantations. Panels presenting the models for (a), (b) shrub richness, and (c), (d) for the herb-layer Shannon diversity. Solid arrows indicate directional relationships; arrow colors denote the sign of the effect (red = positive, black = negative), and only statistically supported paths are shown (p < 0.05). Numbers on arrows are standardized path coefficients. Values adjacent to response variables report the proportion of variance explained (R2). Bar plots on the right decompose the total effects for the predictors retained in each model into direct and indirect components. ***, * denote p < 0.001, and p < 0.05, respectively.
-
Stand age (years) Longitude Latitude Altitude (m) Direction Slope Canopy density Shrubs layer cover (%) Herbs layer cover (%) 4 118°00'00" 32°24'00" 130 South 10 0.38 ± 0.03a 18.56 ± 2.43b 27.23 ± 8.08a 10 118°01'12" 32°19'48" 139 South 12 0.10 ± 0.01b 17.43 ± 4.57b 10.05 ± 1.44b 25 117°59'24" 32°21'36" 166 South 13 0.11 ± 0.01b 13.35 ± 3.58b 13.37 ± 1.90b 45 118°00'36" 32°19'12" 153 South 12 0.11 ± 0.01b 33.17 ± 6.50a 13.46 ± 2.77b 50 117°59'24" 32°18'00" 169 South 11 0.10 ± 0.02b 15.33 ± 5.62b 11.99 ± 3.89b Different letters among stand age means different levels of significance, p < 0.05. Table 1.
Stand and site attributes of the sampledplots in eastern China (values are mean ± SD; n = 3 plots per stand-age class).
-
Stand age (years) Indicator species Life forms Specificity Sensitivity Indicator value p Shrub layer 4 Triadica sebifera Tree (seedling) 1.0000 1 1.000 0.013 Cymbopogon citratus Herb 1.0000 1 1.000 0.013 10 Paederia foetida Herb 0.8896 1 0.943 0.012 Rhus chinensis Tree (seedling) 0.8879 1 0.942 0.022 50 Maclura tricuspidata Shrub 0.8261 1 0.909 0.010 Ligustrum sinense Shrub 0.8333 1 0.913 0.010 Herb layer 4 Erigeron annuus Herb 1.0000 1 1.000 0.011 Euphorbia maculata Herb 1.0000 1 1.000 0.011 Justicia procumbens Herb 1.0000 1 1.000 0.011 Elsholtzia cyprianii Herb 1.0000 1 1.000 0.011 Gelsemium elegans Herb 1.0000 1 1.000 0.011 Xanthium strumarium Herb 1.0000 1 1.000 0.011 Erigeron sumatrensis Herb 1.0000 1 1.000 0.011 Rubus hirsutus Shrub (seedling) 1.0000 1 1.000 0.011 Cuscuta japonica Herb 1.0000 1 1.000 0.011 Kummerowia striata Herb 1.0000 1 1.000 0.011 Oxalis corniculata Herb 0.8166 1 0.904 0.011 10 Aristolochia debilis Herb 1.0000 1 1.000 0.016 25 Isotrema mollissimum Vine (seedling) 0.9055 1 0.797 0.020 Ophiopogon japonicus Herb 0.6359 1 0.797 0.033 45 Quercus acutissima Tree (seedling) 0.7894 1 0.888 0.014 50 Juncus effusus Herb 1.0000 1 1.000 0.009 Maclura tricuspidata Tree (seedling) 0.8980 1 0.948 0.009 Paederia foetida Herb 0.3746 1 0.612 0.016 Table 2.
Indicator taxa associated with stand-age classes in the shrub and herb layers of Q. acutissima plantations.
Figures
(8)
Tables
(2)