-
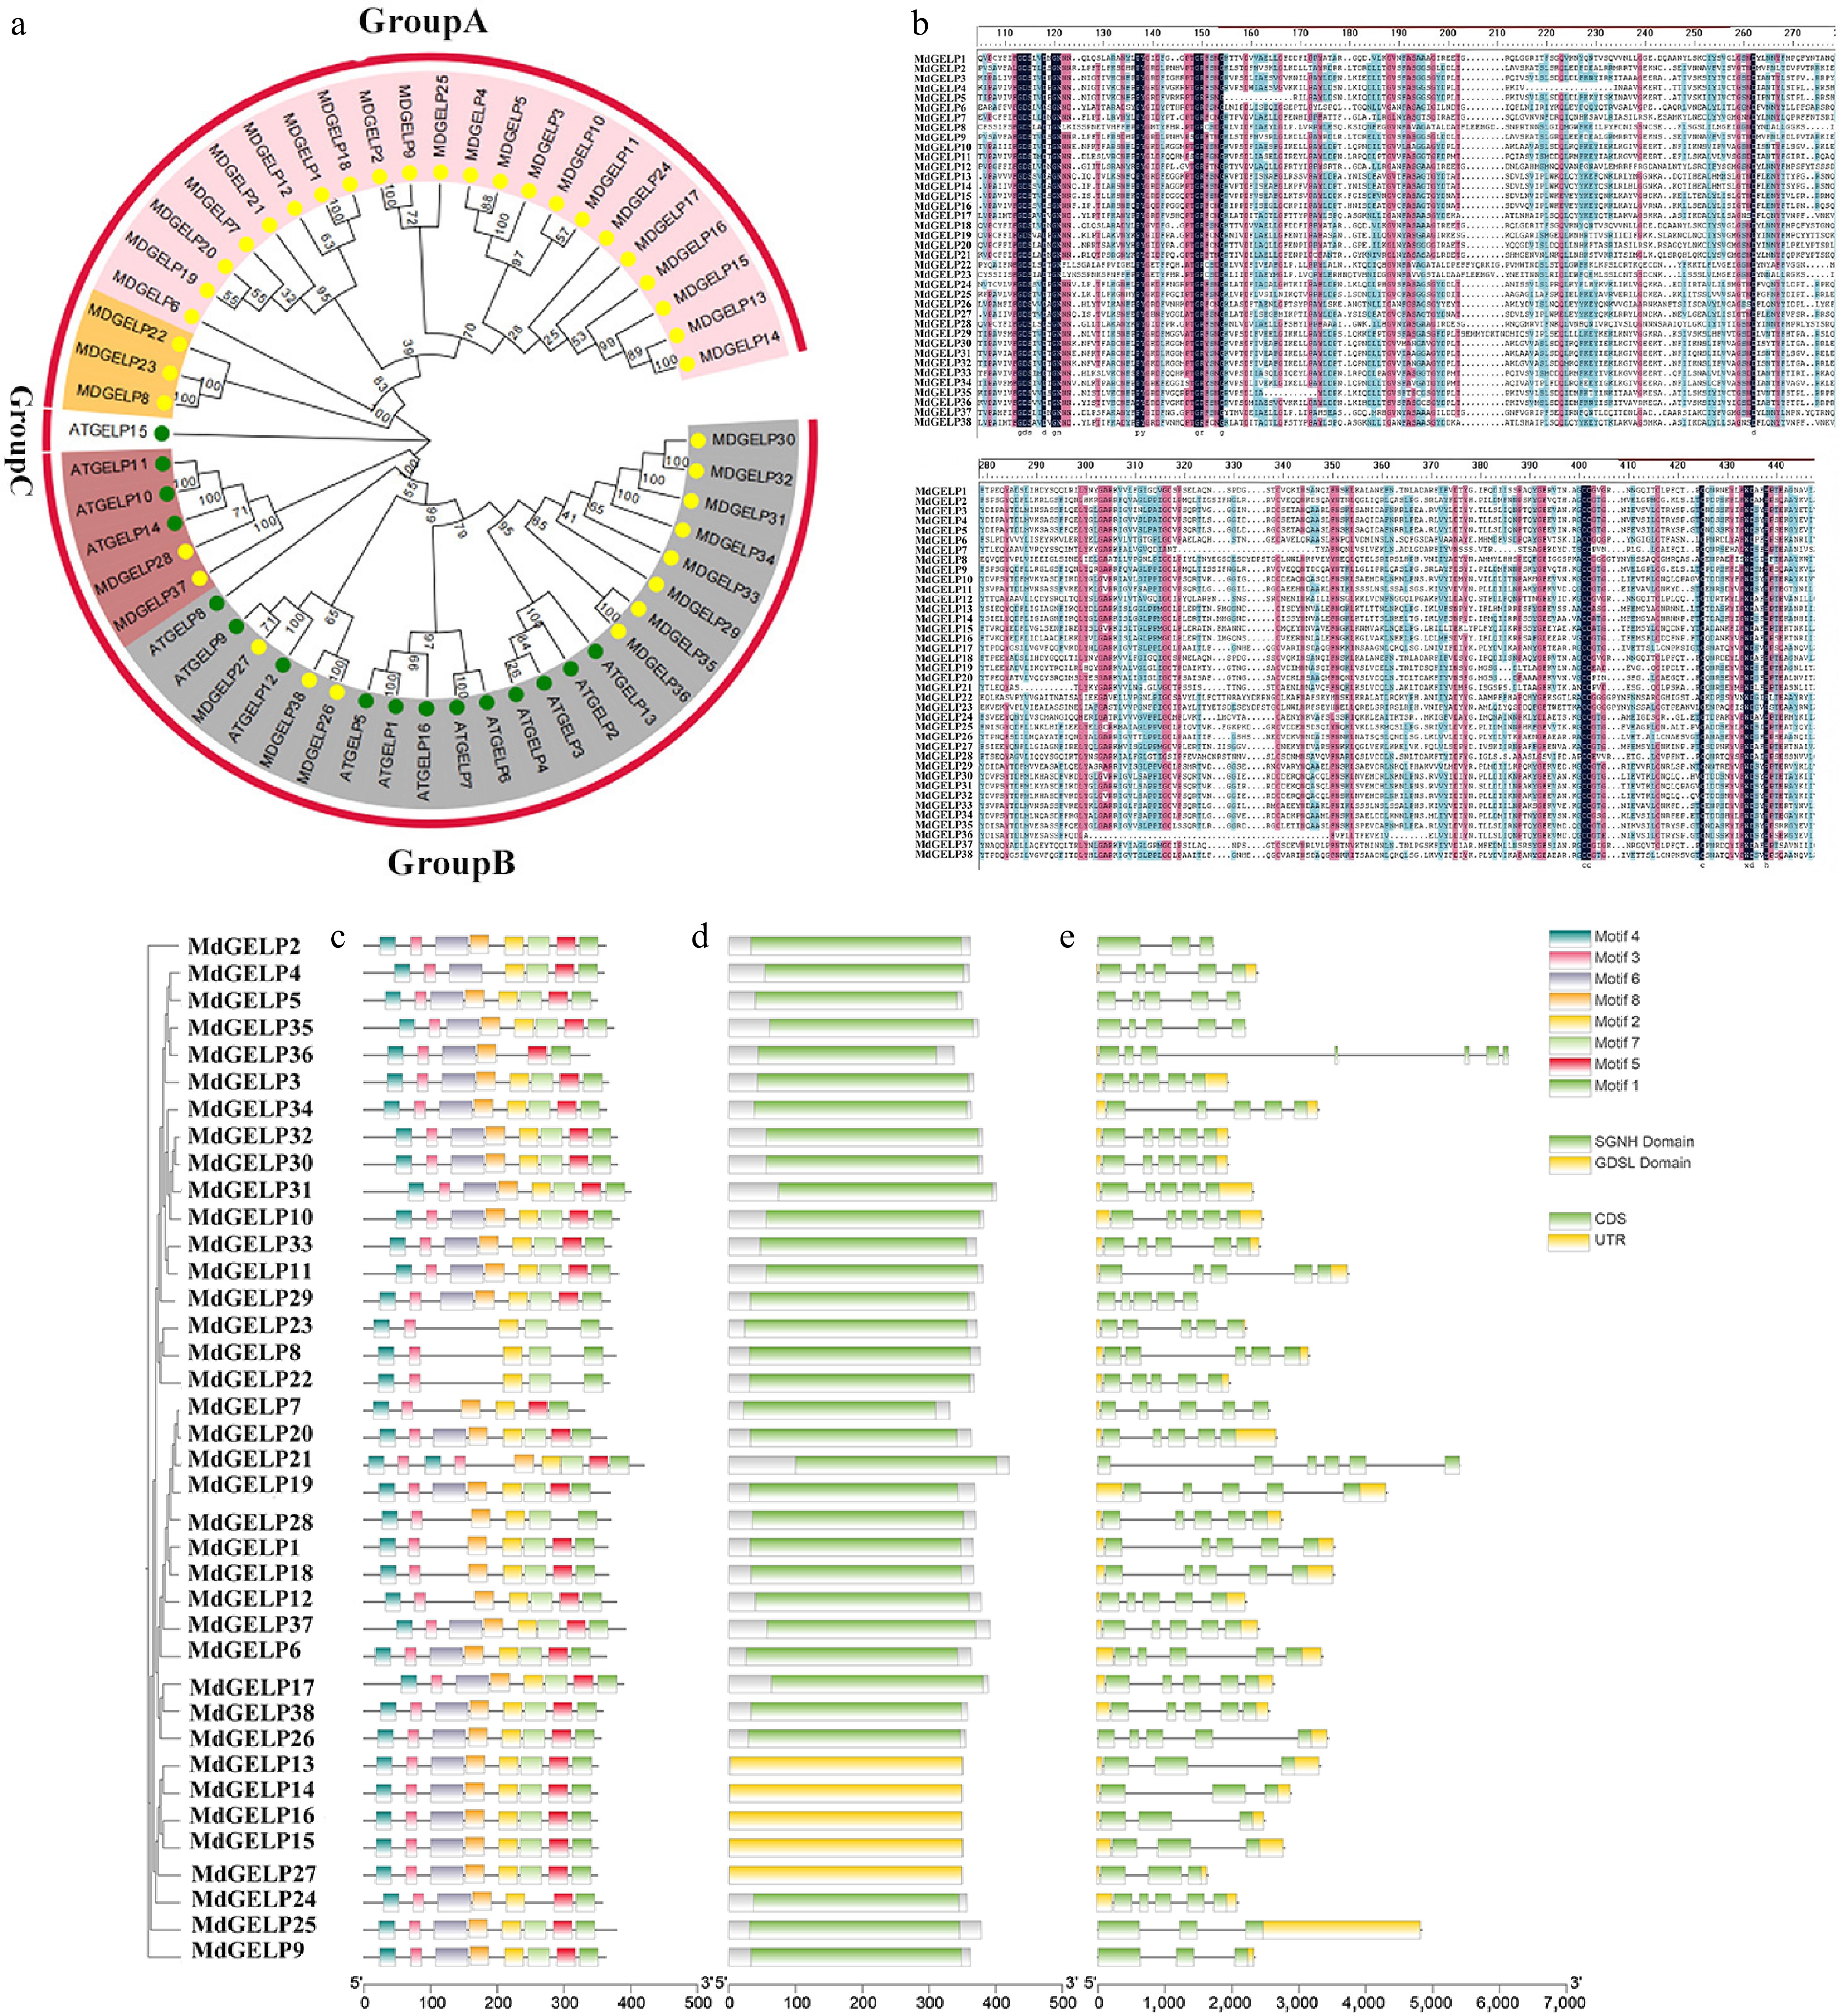
Figure 1.
Phylogenetic tree and conserved region analysis. (a) Phylogenetic tree of GELP proteins from Malus domestica and Arabidopsis thaliana. (b) Multiple sequence alignment of MdGELP family protein. (c) Distribution of conserved motifs MdGELP family proteins. (d) Distribution of conserved domains in MdGELP family proteins. (e) Gene structure analysis of MdGELPs.
-
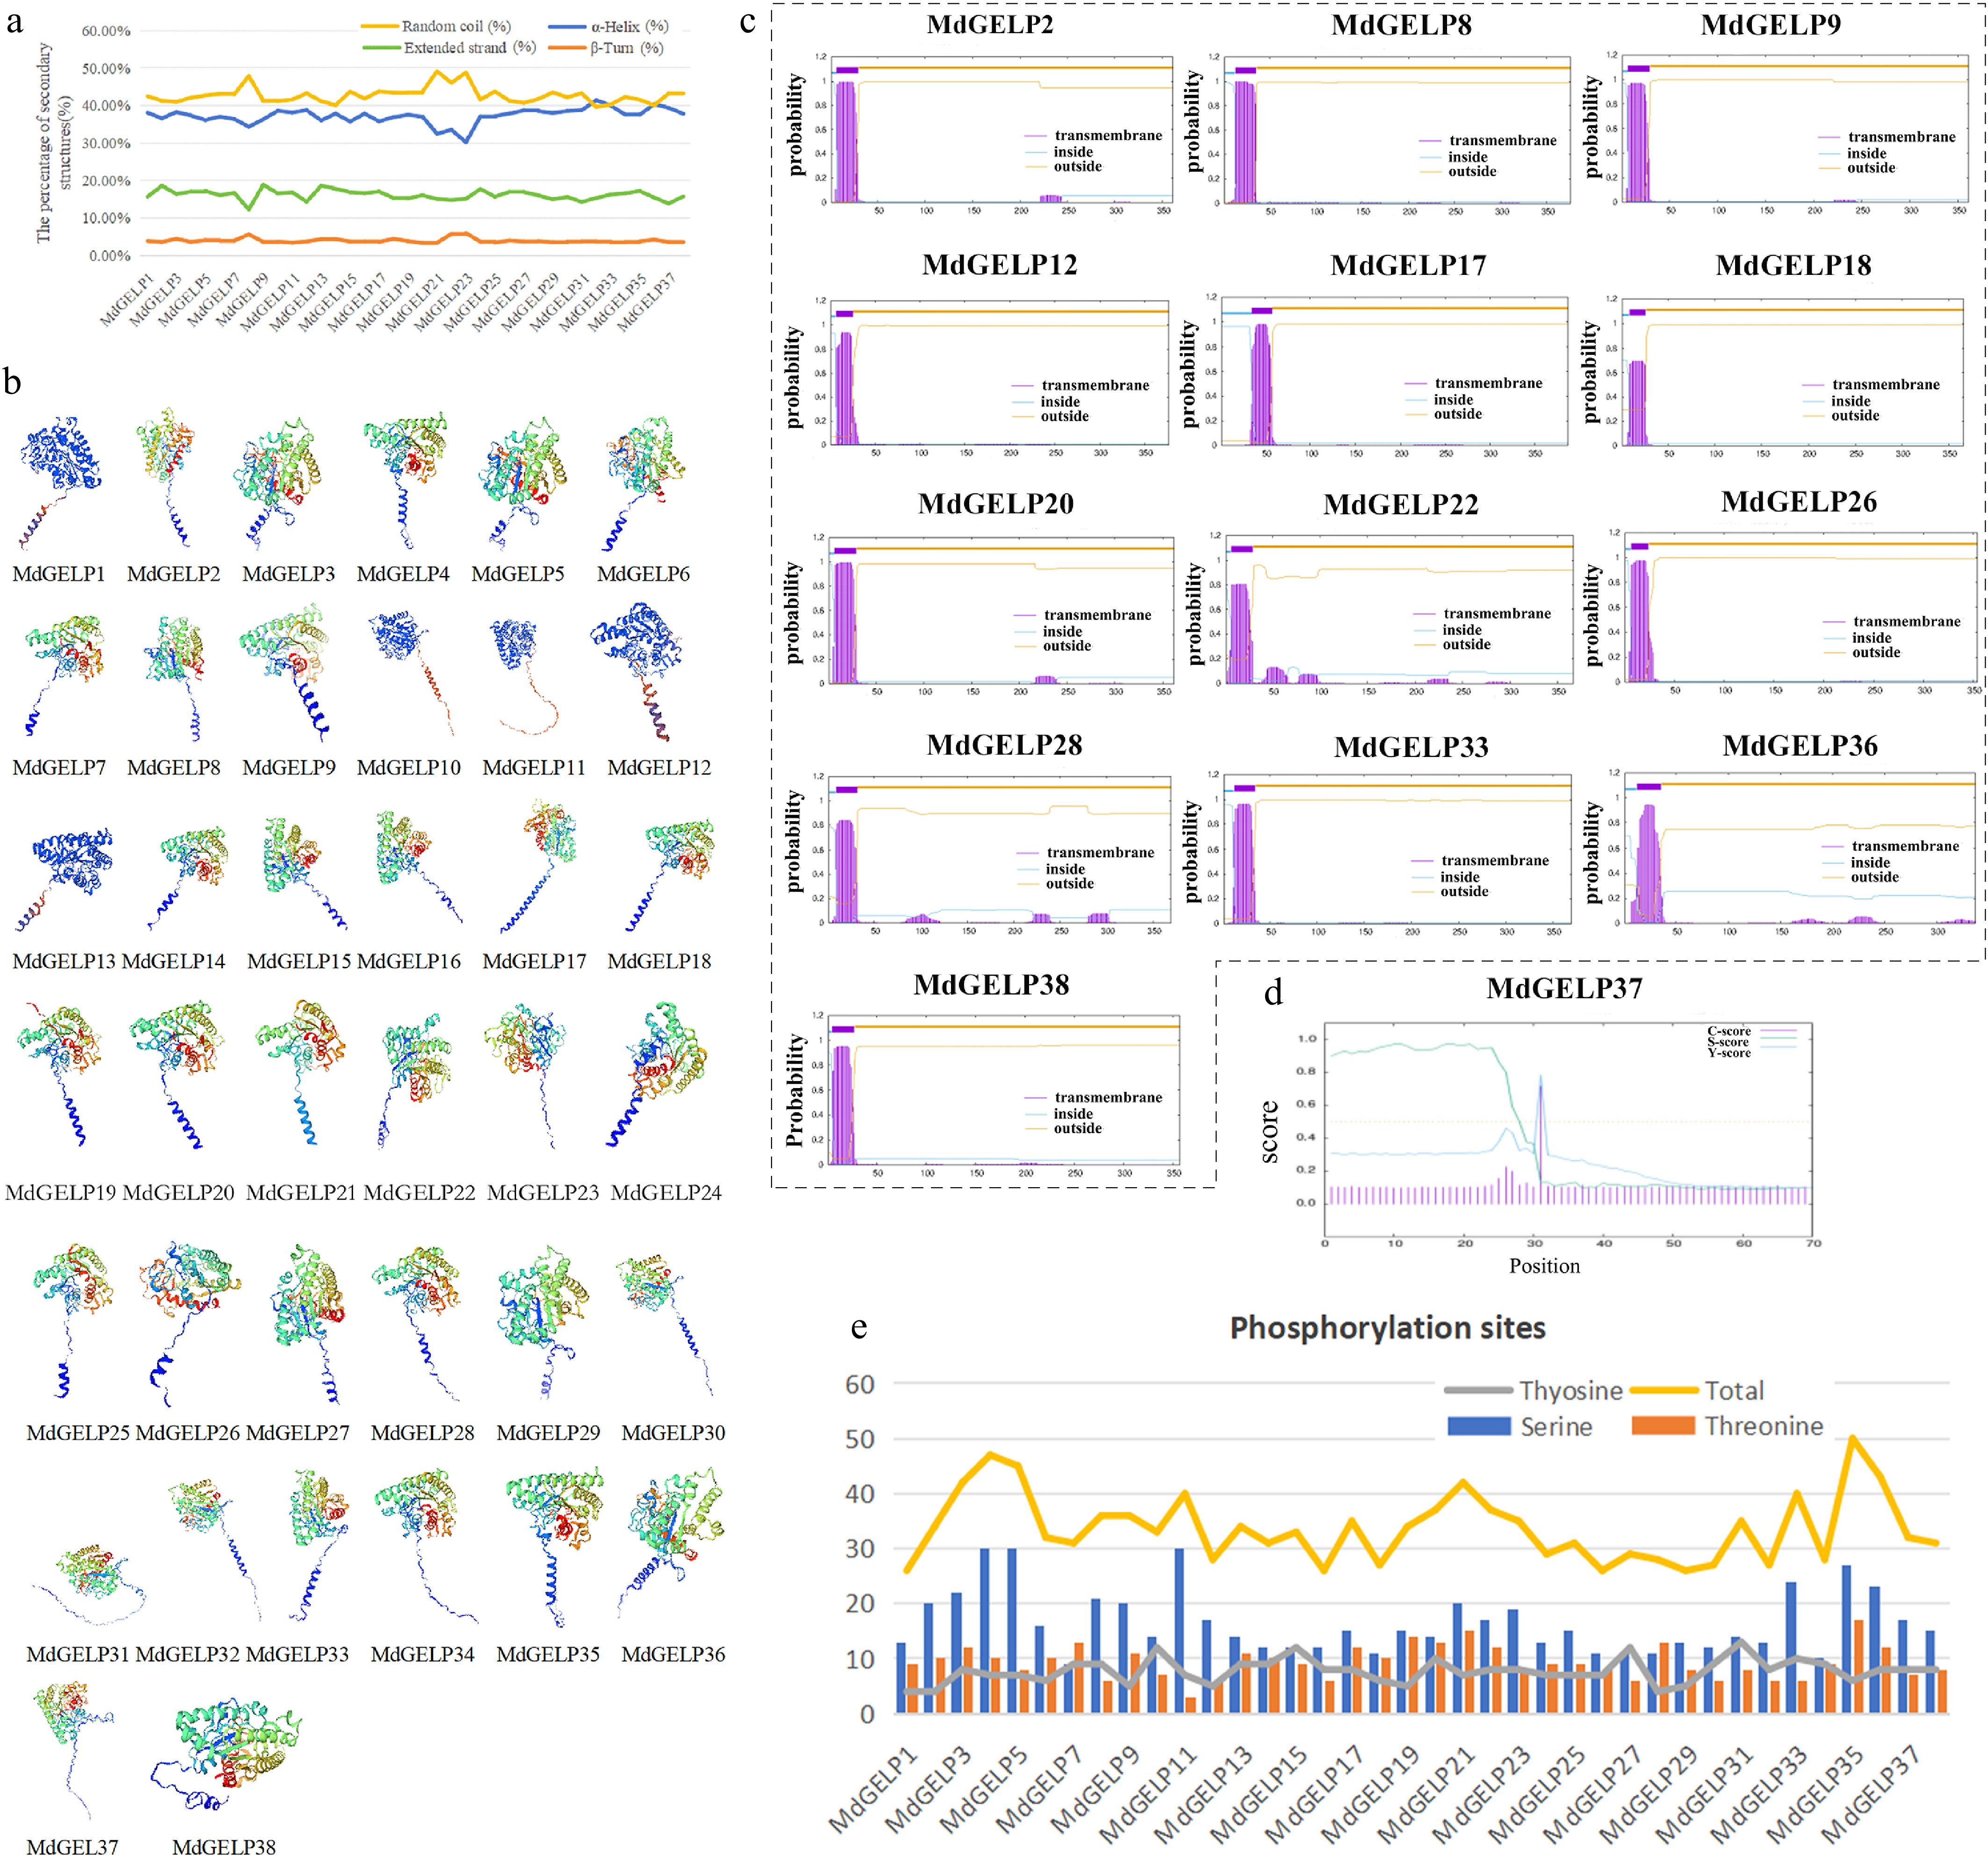
Figure 2.
Characteristics and structural prediction of MdGELP protein. (a) Secondary structure prediction of MdGELP proteins; the four colors represent different secondary structure elements, respectively. (b) Tertiary structure prediction of MdGELP proteins; the four colors represent different subunits, respectively. (c) Transmembrane domain prediction of MdGELP proteins. Gene names are listed above the plot. In the plot, the x-axis represents protein sequence length and the y-axis represents the probability of transmembrane regions. (d) Signal peptide prediction for MdGELP37. (e) Prediction of phosphorylation site distribution in MdGELP amino acid sequences.
-
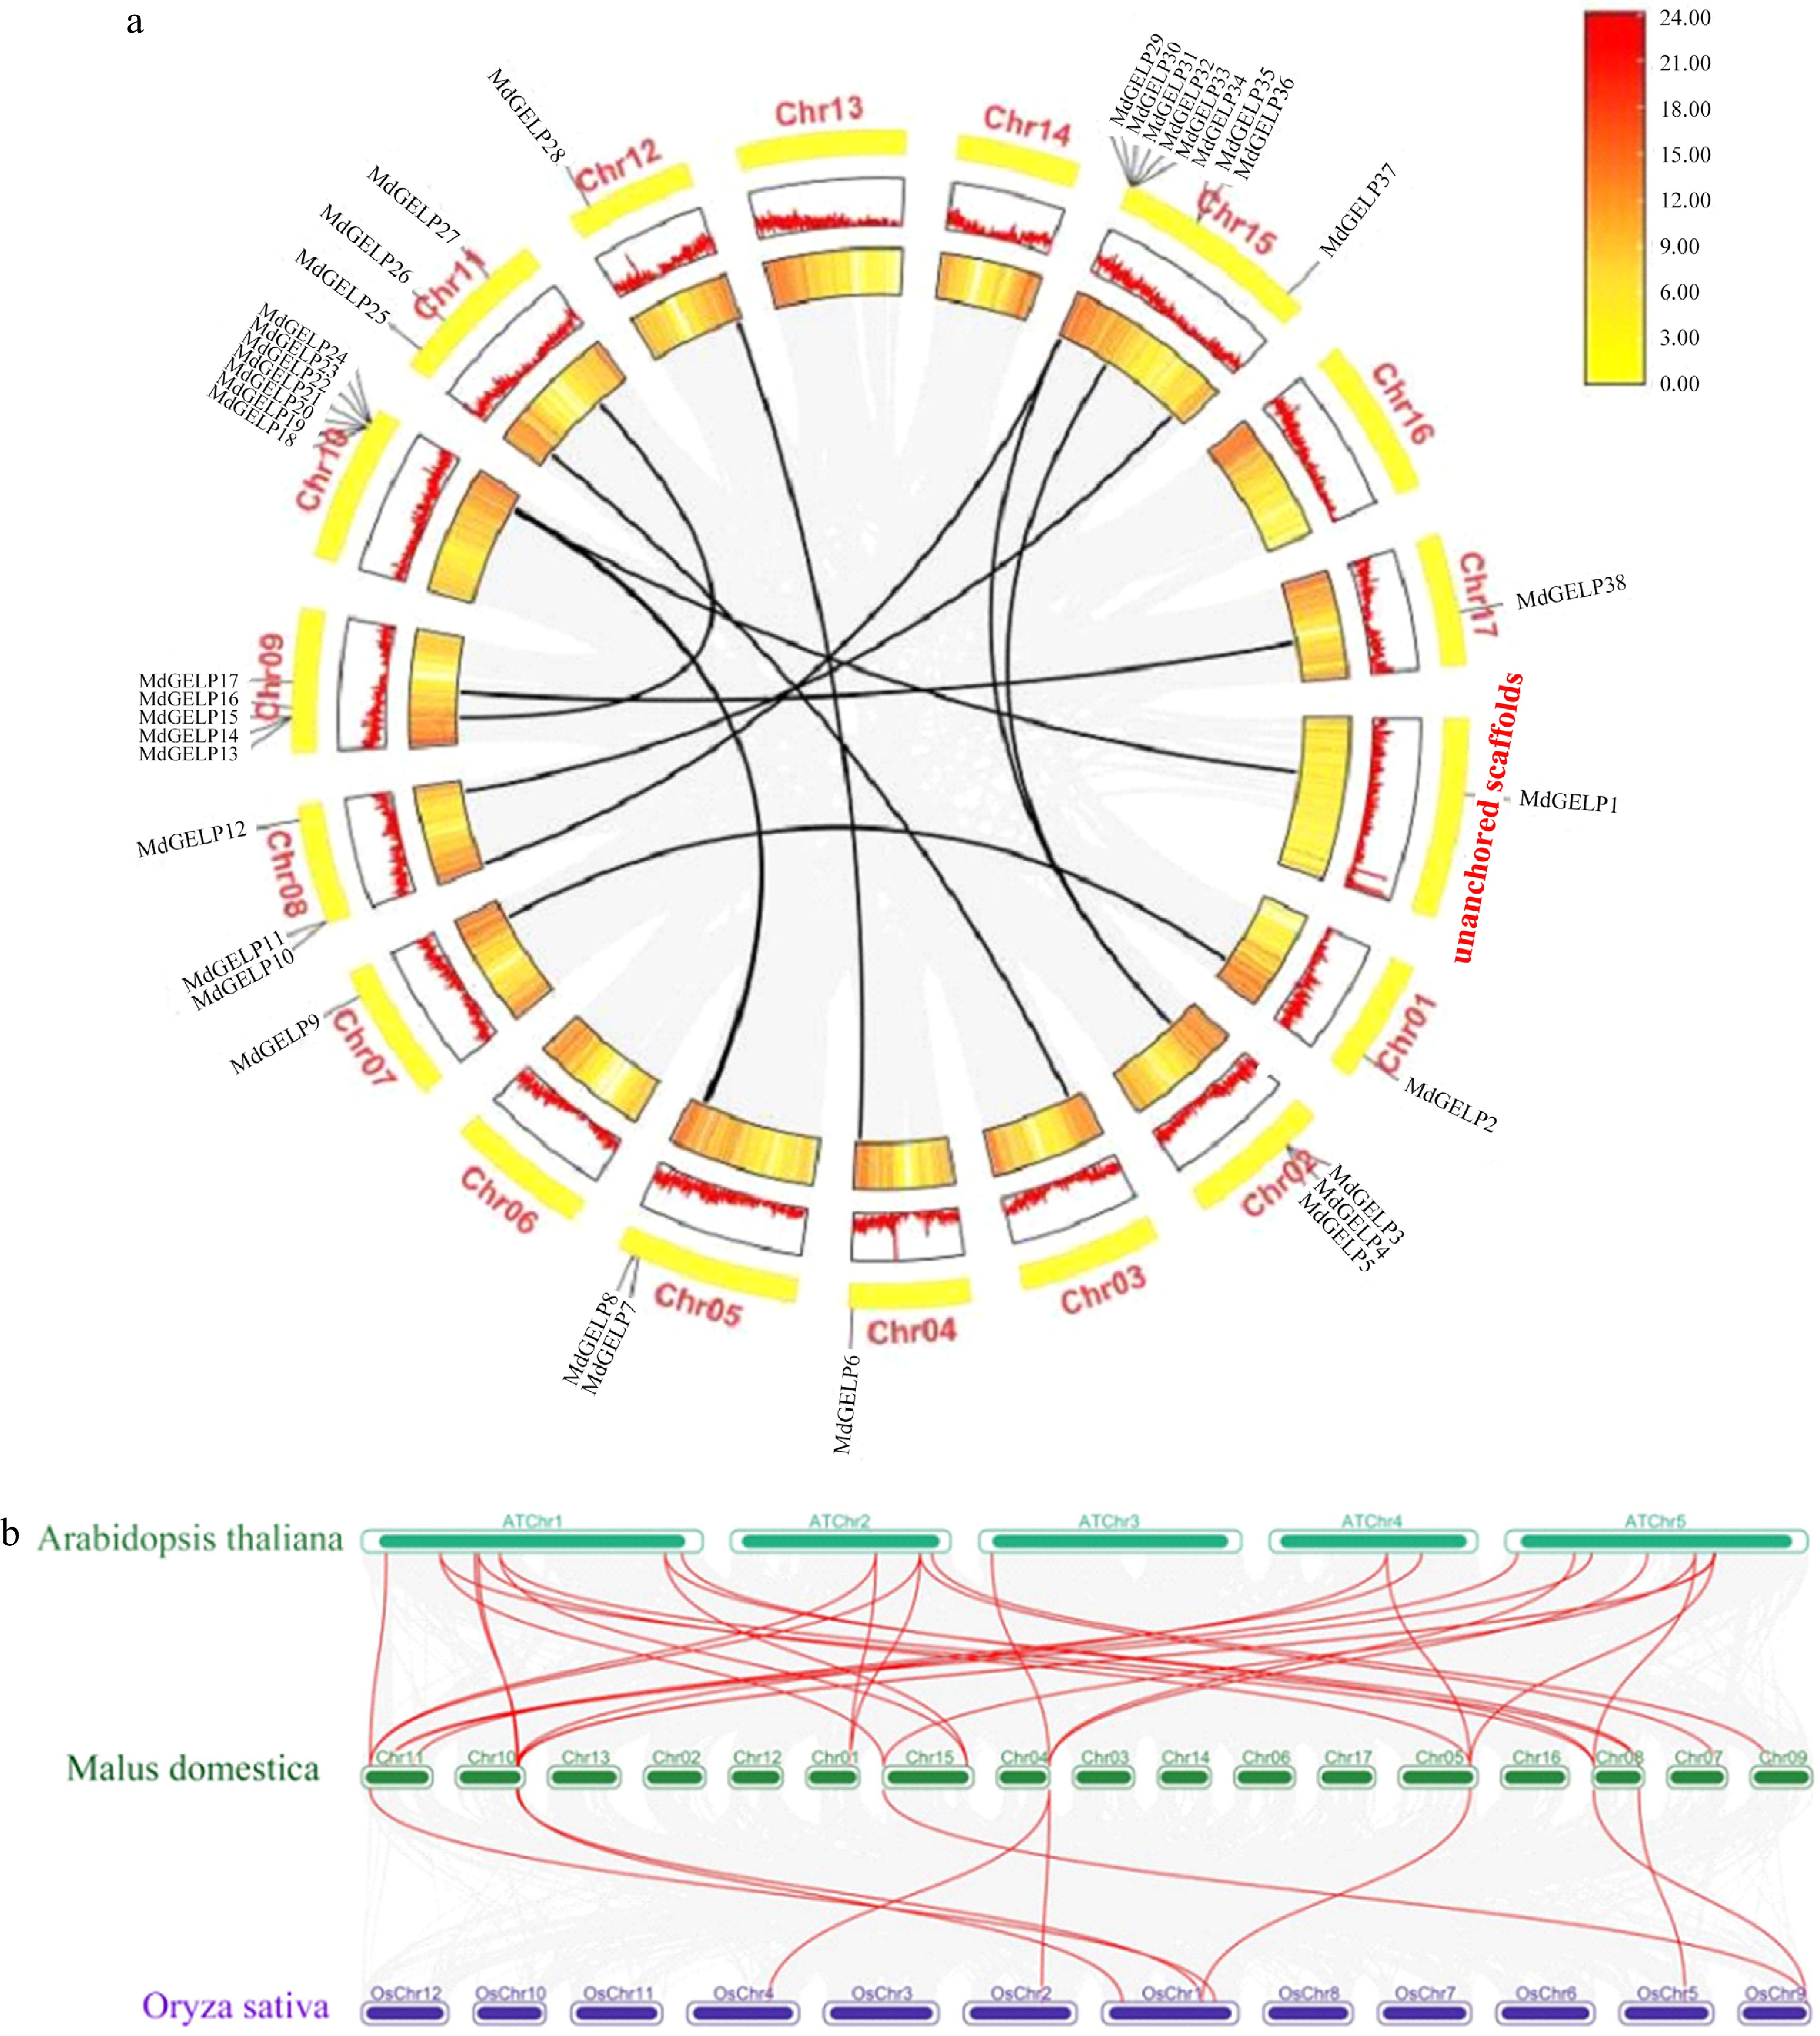
Figure 3.
Chromosomal localization and collinearity analysis. (a) Chromosomal distribution of MdGELPs and tandem/fragment repetition, with MdGELP1 located in unanchored scaffolds. (b) Collinearity analysis among apple, Arabidopsis thaliana, and rice. Dark green boxes represent the 17 apple chromosomes, green boxes represent the five Arabidopsis thaliana chromosomes, and purple boxes represent the 12 rice chromosomes. Red lines indicate homologous gene pairs.
-
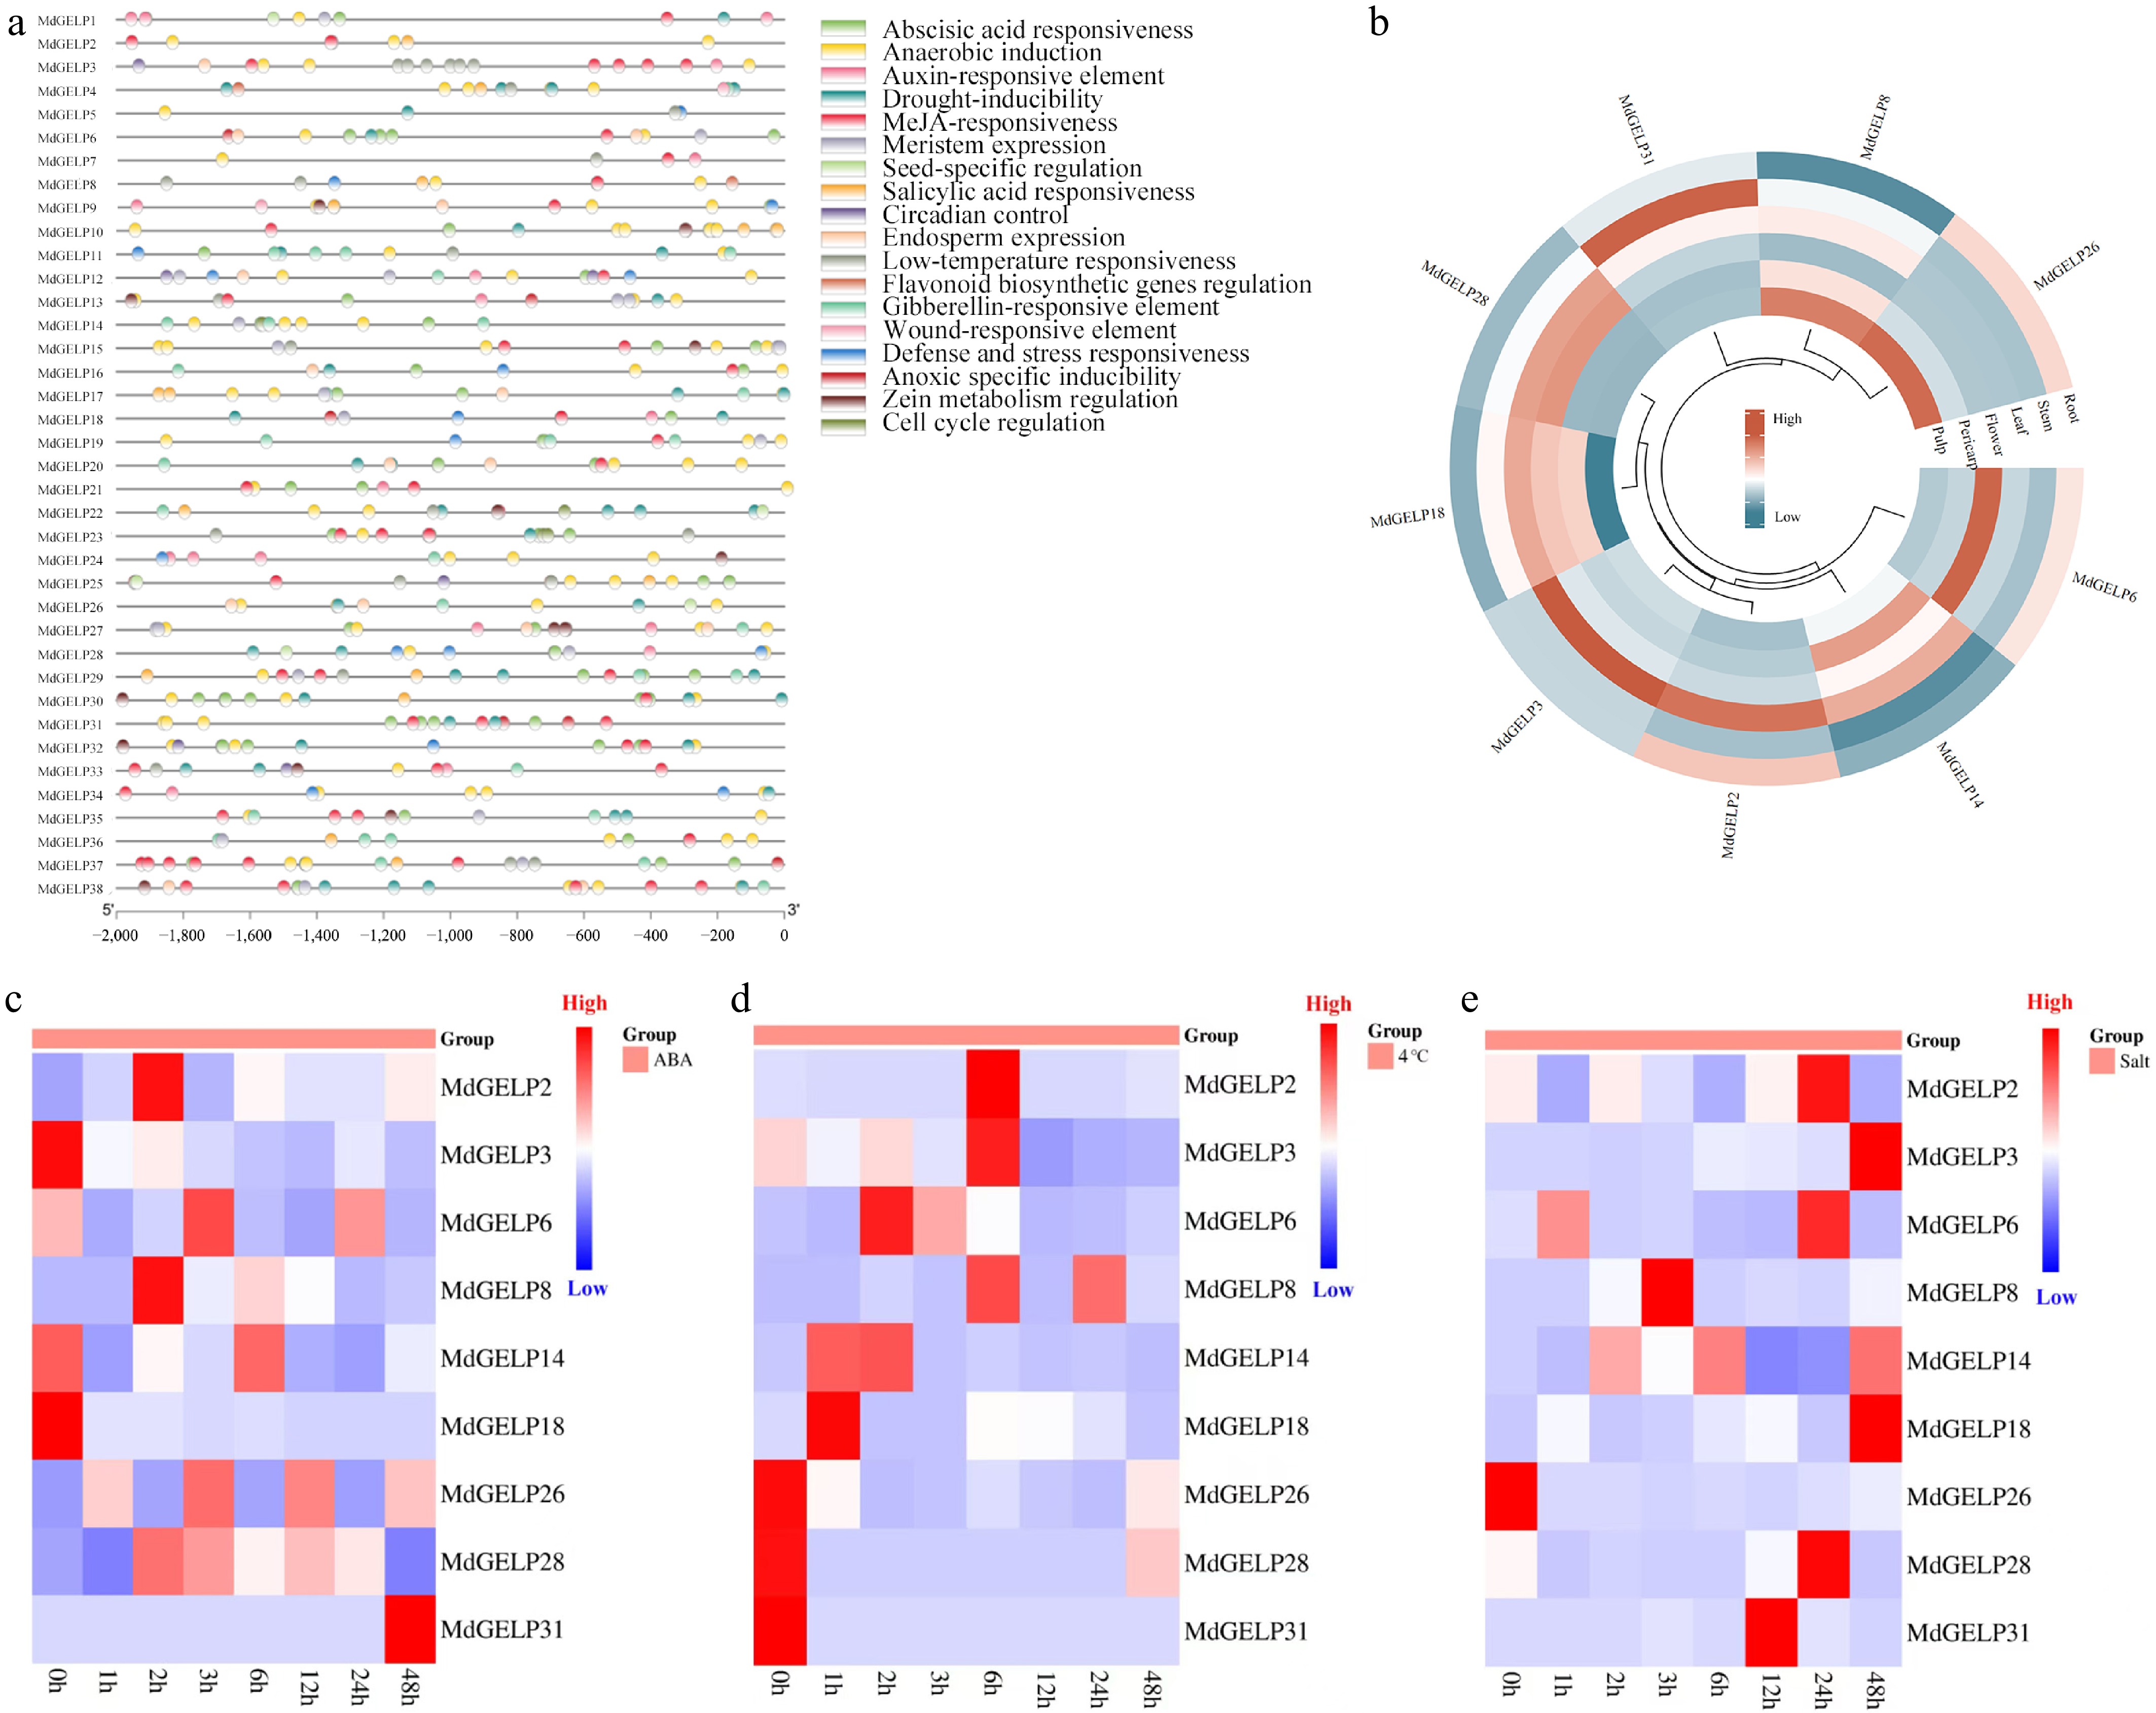
Figure 4.
Promoter cis-acting element analysis and expression profiling. (a) Analysis of cis-acting elements in the promoter regions of MdGELPs. (b) Expression levels of MdGELPs in roots, stems, leaves, flowers, pericarp, and flesh as determined by qRT-PCR. (c) Relative expression under ABA treatment. (d) Relative expression under low-temperature stress. (e) Relative expression under salt stress.
-
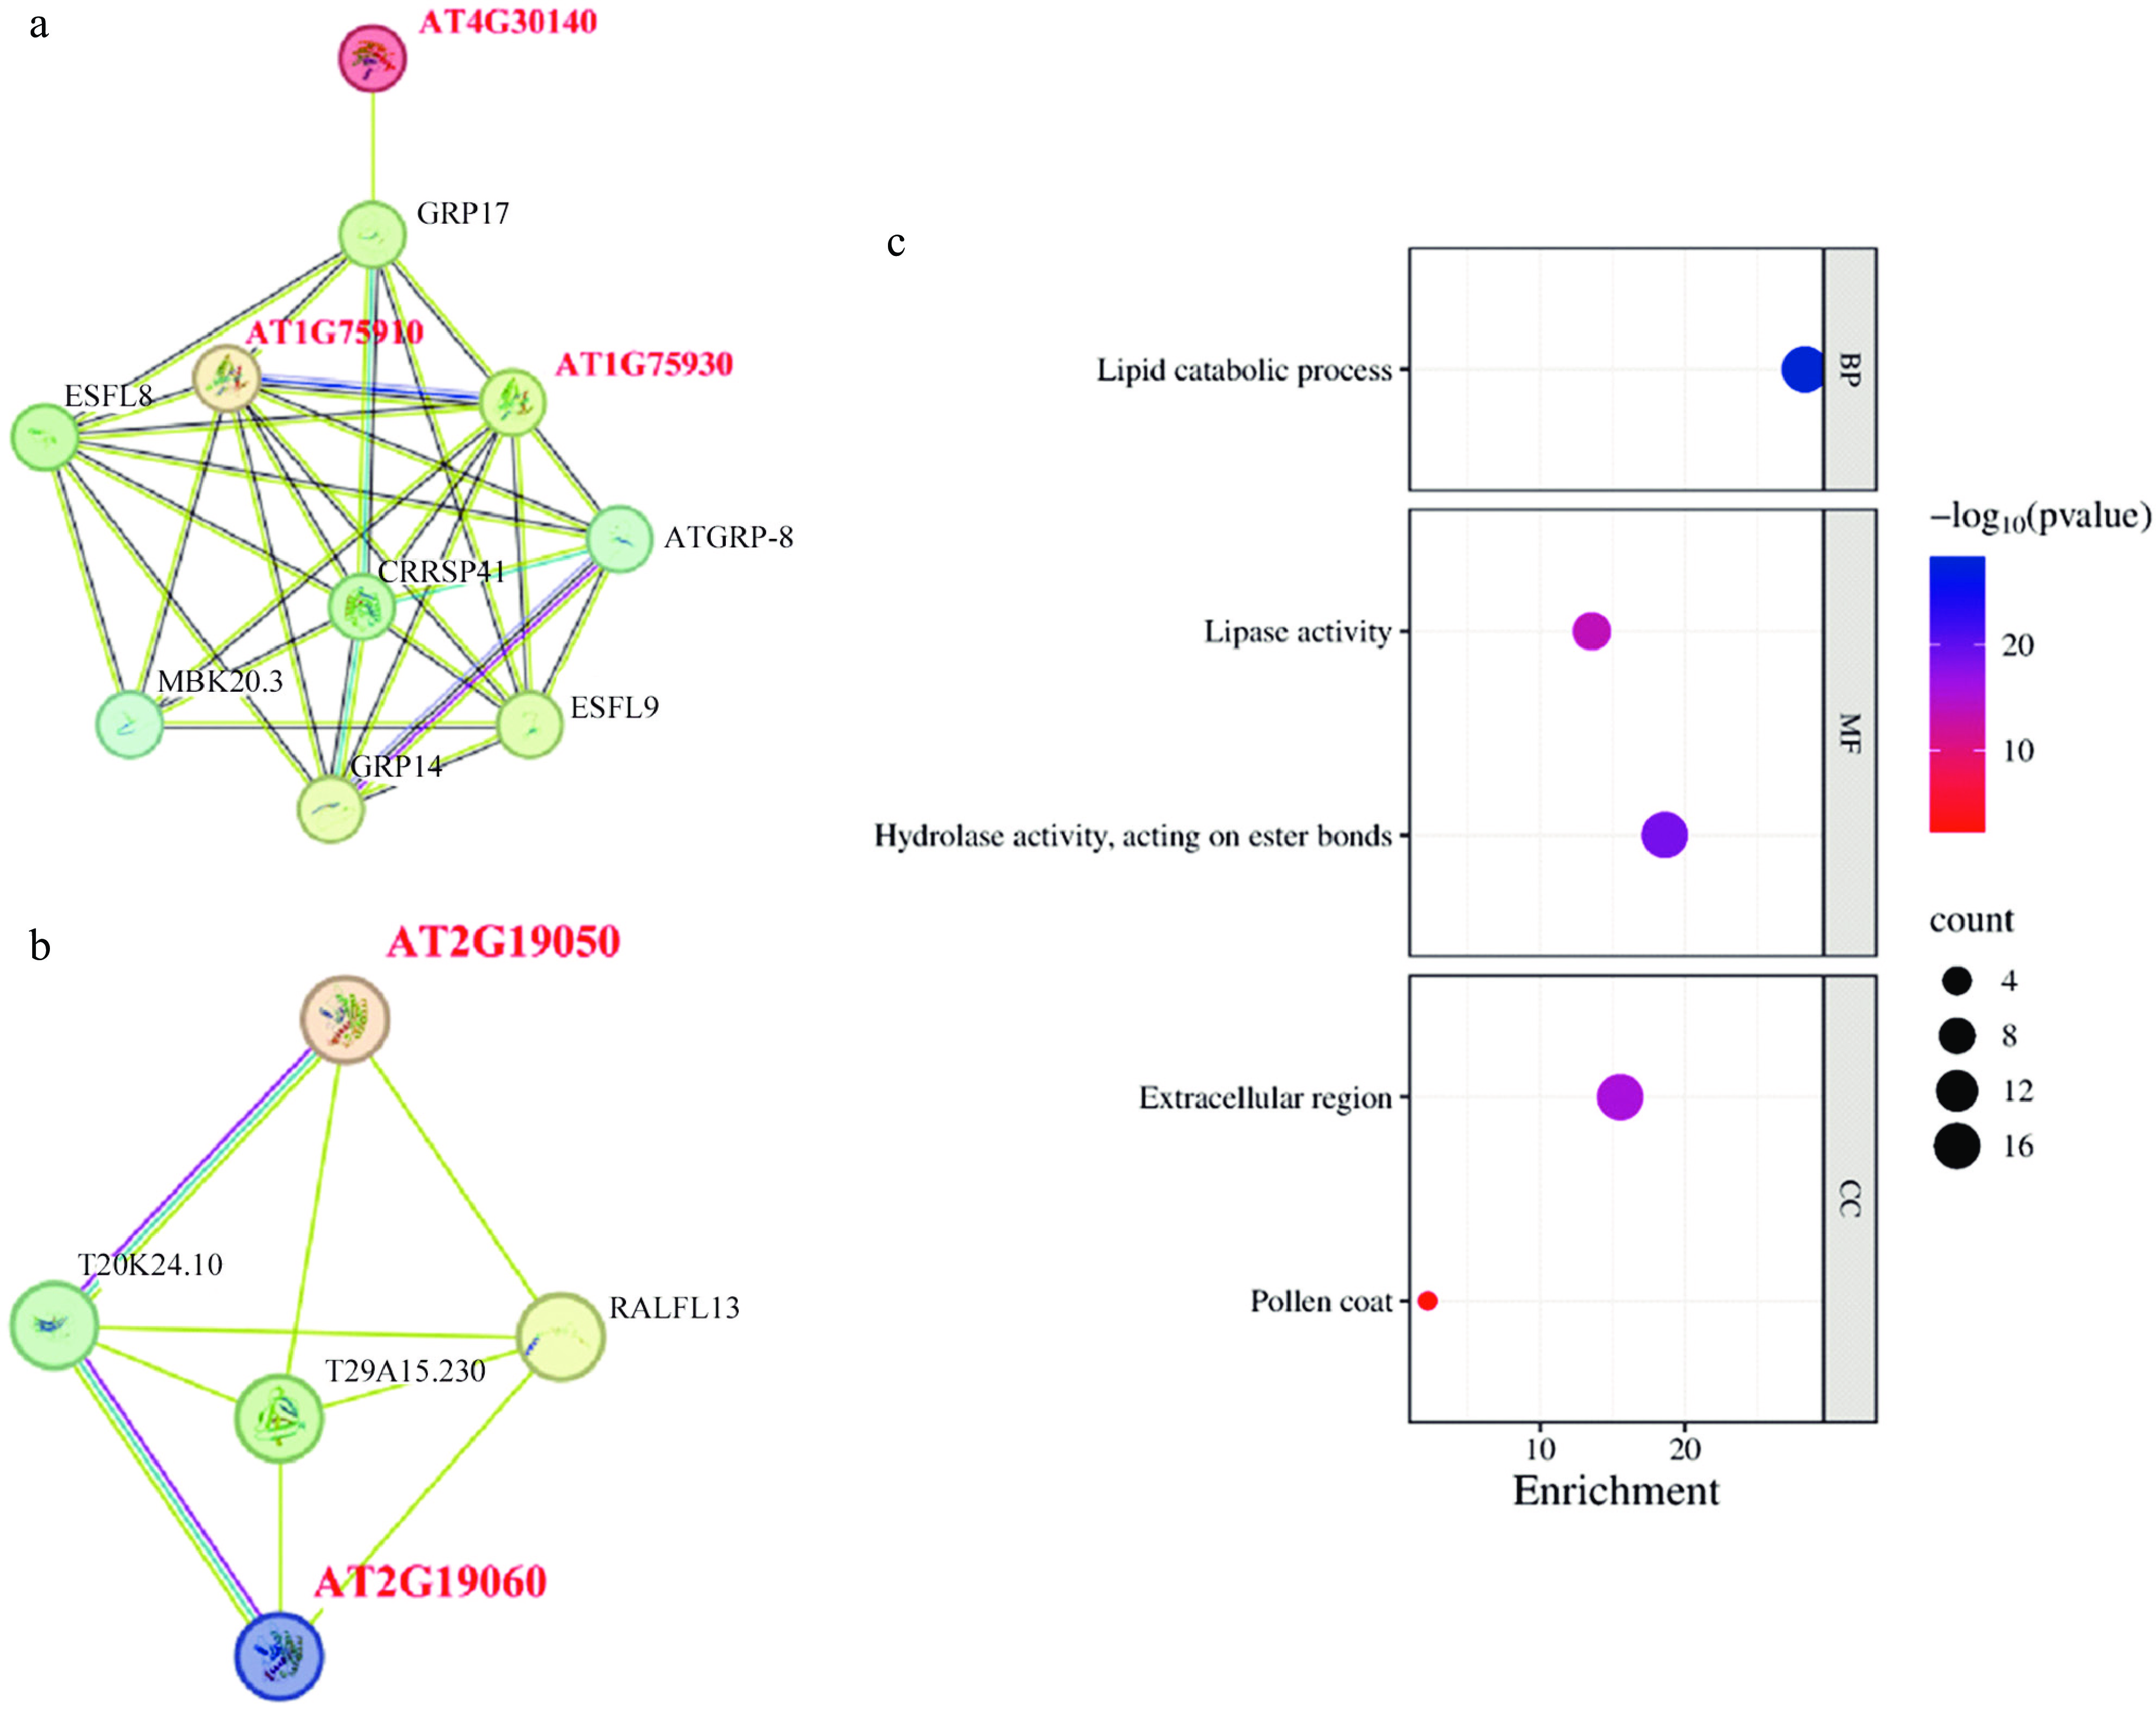
Figure 5.
Protein interaction network and GO annotation. (a), (b) Prediction of the AtGELP protein interaction network. (c) GO enrichment analysis of AtGELP proteins. Bubble size indicates the number of genes, and color indicates the p-value.
-
Gene Forward primer (5′-3′) Reverse primer (5′-3′) MdGELP2 GACTTTGATGAAGCGTTGAGGAG GAATGAACGACCCGAGTCTTTTG MdGELP3 AAATAGGGATTGCTCCGAGACTG TAACGAGTACACAGGACGCTAAC MdGELP6 TGCTAGATCTCGCCAATTCTCTC CGACTAGTTGTGGGTTGAACAAG MdGELP8 CTTTGAAGGGGGAGTGAATTTCG CTCCCATGAGAATTAGAGAGCCC MdGELP14 GTTACAACAATGTGGCCTTGGAG GTAGCCCATTTCAAACATCCCAG MdGELP18 CCAAAACACAGTGTCTCAAGTGG GTTGACCGTAATCGTGAATGAGC MdGELP26 ATCTATATGCACTGGGAGCAAGG AGCGGTTGGTAGATATCAAGGAC MdGELP28 GCAGCAGGTATTCGTGATGAATC GGCGGCTAGTTGAGTATAACCTT MdGELP31 GGTGATATTGTCCAGATGCATGC GCCGGTATCAACAATCGAATCTC Table 1.
Real-time fluorescence quantitative PCR primers for relative expression of MdGELPs.
-
Gene name Gene ID Number of amino acid Molecular weight (Da) Theoretical pI Instability index Aliphatic index Grand average of hydropathicity Subcellular localization prediction MdGELP1 MD00G1093600 365 40,038.95 6.72 26.17 78.6 −0.168 Extracellular MdGELP2 MD01G1156400 361 39,941.92 9.12 40.29 88.31 −0.106 Extracellular MdGELP3 MD02G1126900 366 40,088.96 8.42 37.79 96.69 0.029 PlasmaMembrane MdGELP4 MD02G1127000 359 39,242 8.95 34 92.56 0.009 PlasmaMembrane MdGELP5 MD02G1127100 349 38,230.71 8.67 33.06 96.07 0.02 PlasmaMembrane MdGELP6 MD04G1234300 362 39,890.29 5.26 31.61 92.18 0.002 PlasmaMembrane MdGELP7 MD05G1293600 330 36,765.6 7.54 38.02 84.52 −0.125 PlasmaMembrane MdGELP8 MD05G1304000 376 41,660.12 4.59 44.12 86.14 −0.002 PlasmaMembrane MdGELP9 MD07G1225100 361 39,543.43 8.13 37.94 91.27 0.025 Extracellular MdGELP10 MD08G1009700 381 41,885.18 6.82 31.83 93.1 −0.02 Cytoplasmic MdGELP11 MD08G1009800 380 41,341.35 5.03 40.88 95.34 0.099 PlasmaMembrane MdGELP12 MD08G1215700 377 41,683.24 9.03 33.69 81.78 −0.102 PlasmaMembrane MdGELP13 MD09G1116400 350 39,094.76 8.34 34.53 86.11 −0.052 PlasmaMembrane MdGELP14 MD09G1116500 349 38,651.25 8.34 35.09 83.87 −0.045 PlasmaMembrane MdGELP15 MD09G1116600 350 39,579.22 5.54 28.05 84.69 −0.159 Vacuole MdGELP16 MD09G1148500 349 39,053.98 6.35 30.2 88.88 −0.038 PlasmaMembrane MdGELP17 MD09G1199700 388 41,943.68 8.88 25.24 85.31 −0.036 Extracellular MdGELP18 MD10G1270600 366 40,134.91 4.95 24.81 82.1 −0.151 Extracellular MdGELP19 MD10G1270700 368 40,247.69 5.65 22.19 84.84 −0.149 Extracellular MdGELP20 MD10G1270800 362 39,373.54 5.59 34.47 84.09 −0.047 Extracellular MdGELP21 MD10G1270900 419 46,368.76 8.68 30.98 76.09 −0.252 Extracellular MdGELP22 MD10G1283000 367 40,296.18 8.52 36.87 85.64 0.028 Extracellular MdGELP23 MD10G1283400 371 41,088.41 4.65 44.34 87.82 −0.019 PlasmaMembrane MdGELP24 MD10G1286100 356 38,944.27 8.5 25.47 97.47 0.092 PlasmaMembrane MdGELP25 MD11G1058600 377 41,838.96 6.6 37.12 89.71 −0.105 Extracellular MdGELP26 MD11G1153800 354 38,492.65 5.41 28.38 92.37 0.056 Extracellular MdGELP27 MD11G1210200 349 39,157.06 7.51 26.79 89.66 −0.003 PlasmaMembrane MdGELP28 MD12G1049900 369 40,378.84 6.97 32.11 90.38 0.038 Extracellular MdGELP29 MD15G1008700 368 41,202.58 8.89 28.53 89.73 −0.111 Cytoplasmic MdGELP30 MD15G1008800 379 42,085.47 6.88 30.74 94.59 −0.005 PlasmaMembrane MdGELP31 MD15G1008900 400 44,117.95 7.49 30.63 100.15 0.075 PlasmaMembrane MdGELP32 MD15G1009100 379 42,003.4 6.02 31.44 97.18 0 PlasmaMembrane MdGELP33 MD15G1009500 370 40,696.89 6.87 37.02 93.73 0.076 PlasmaMembrane MdGELP34 MD15G1009600 362 39,653.51 4.83 22.11 95.86 0.071 PlasmaMembrane MdGELP35 MD15G1241700 373 41,369.63 9.1 32.72 88.53 −0.014 PlasmaMembrane MdGELP36 MD15G1241800 337 37,835.66 5.63 29.19 101.72 0.249 PlasmaMembrane MdGELP37 MD15G1400200 391 42,794.36 5.29 33.22 84.35 −0.137 Extracellular MdGELP38 MD17G1180300 357 38,251.51 6.5 22.84 91.06 0.099 Extracellular Table 2.
Physical and chemical properties of MdGELPs.
Figures
(5)
Tables
(2)