-
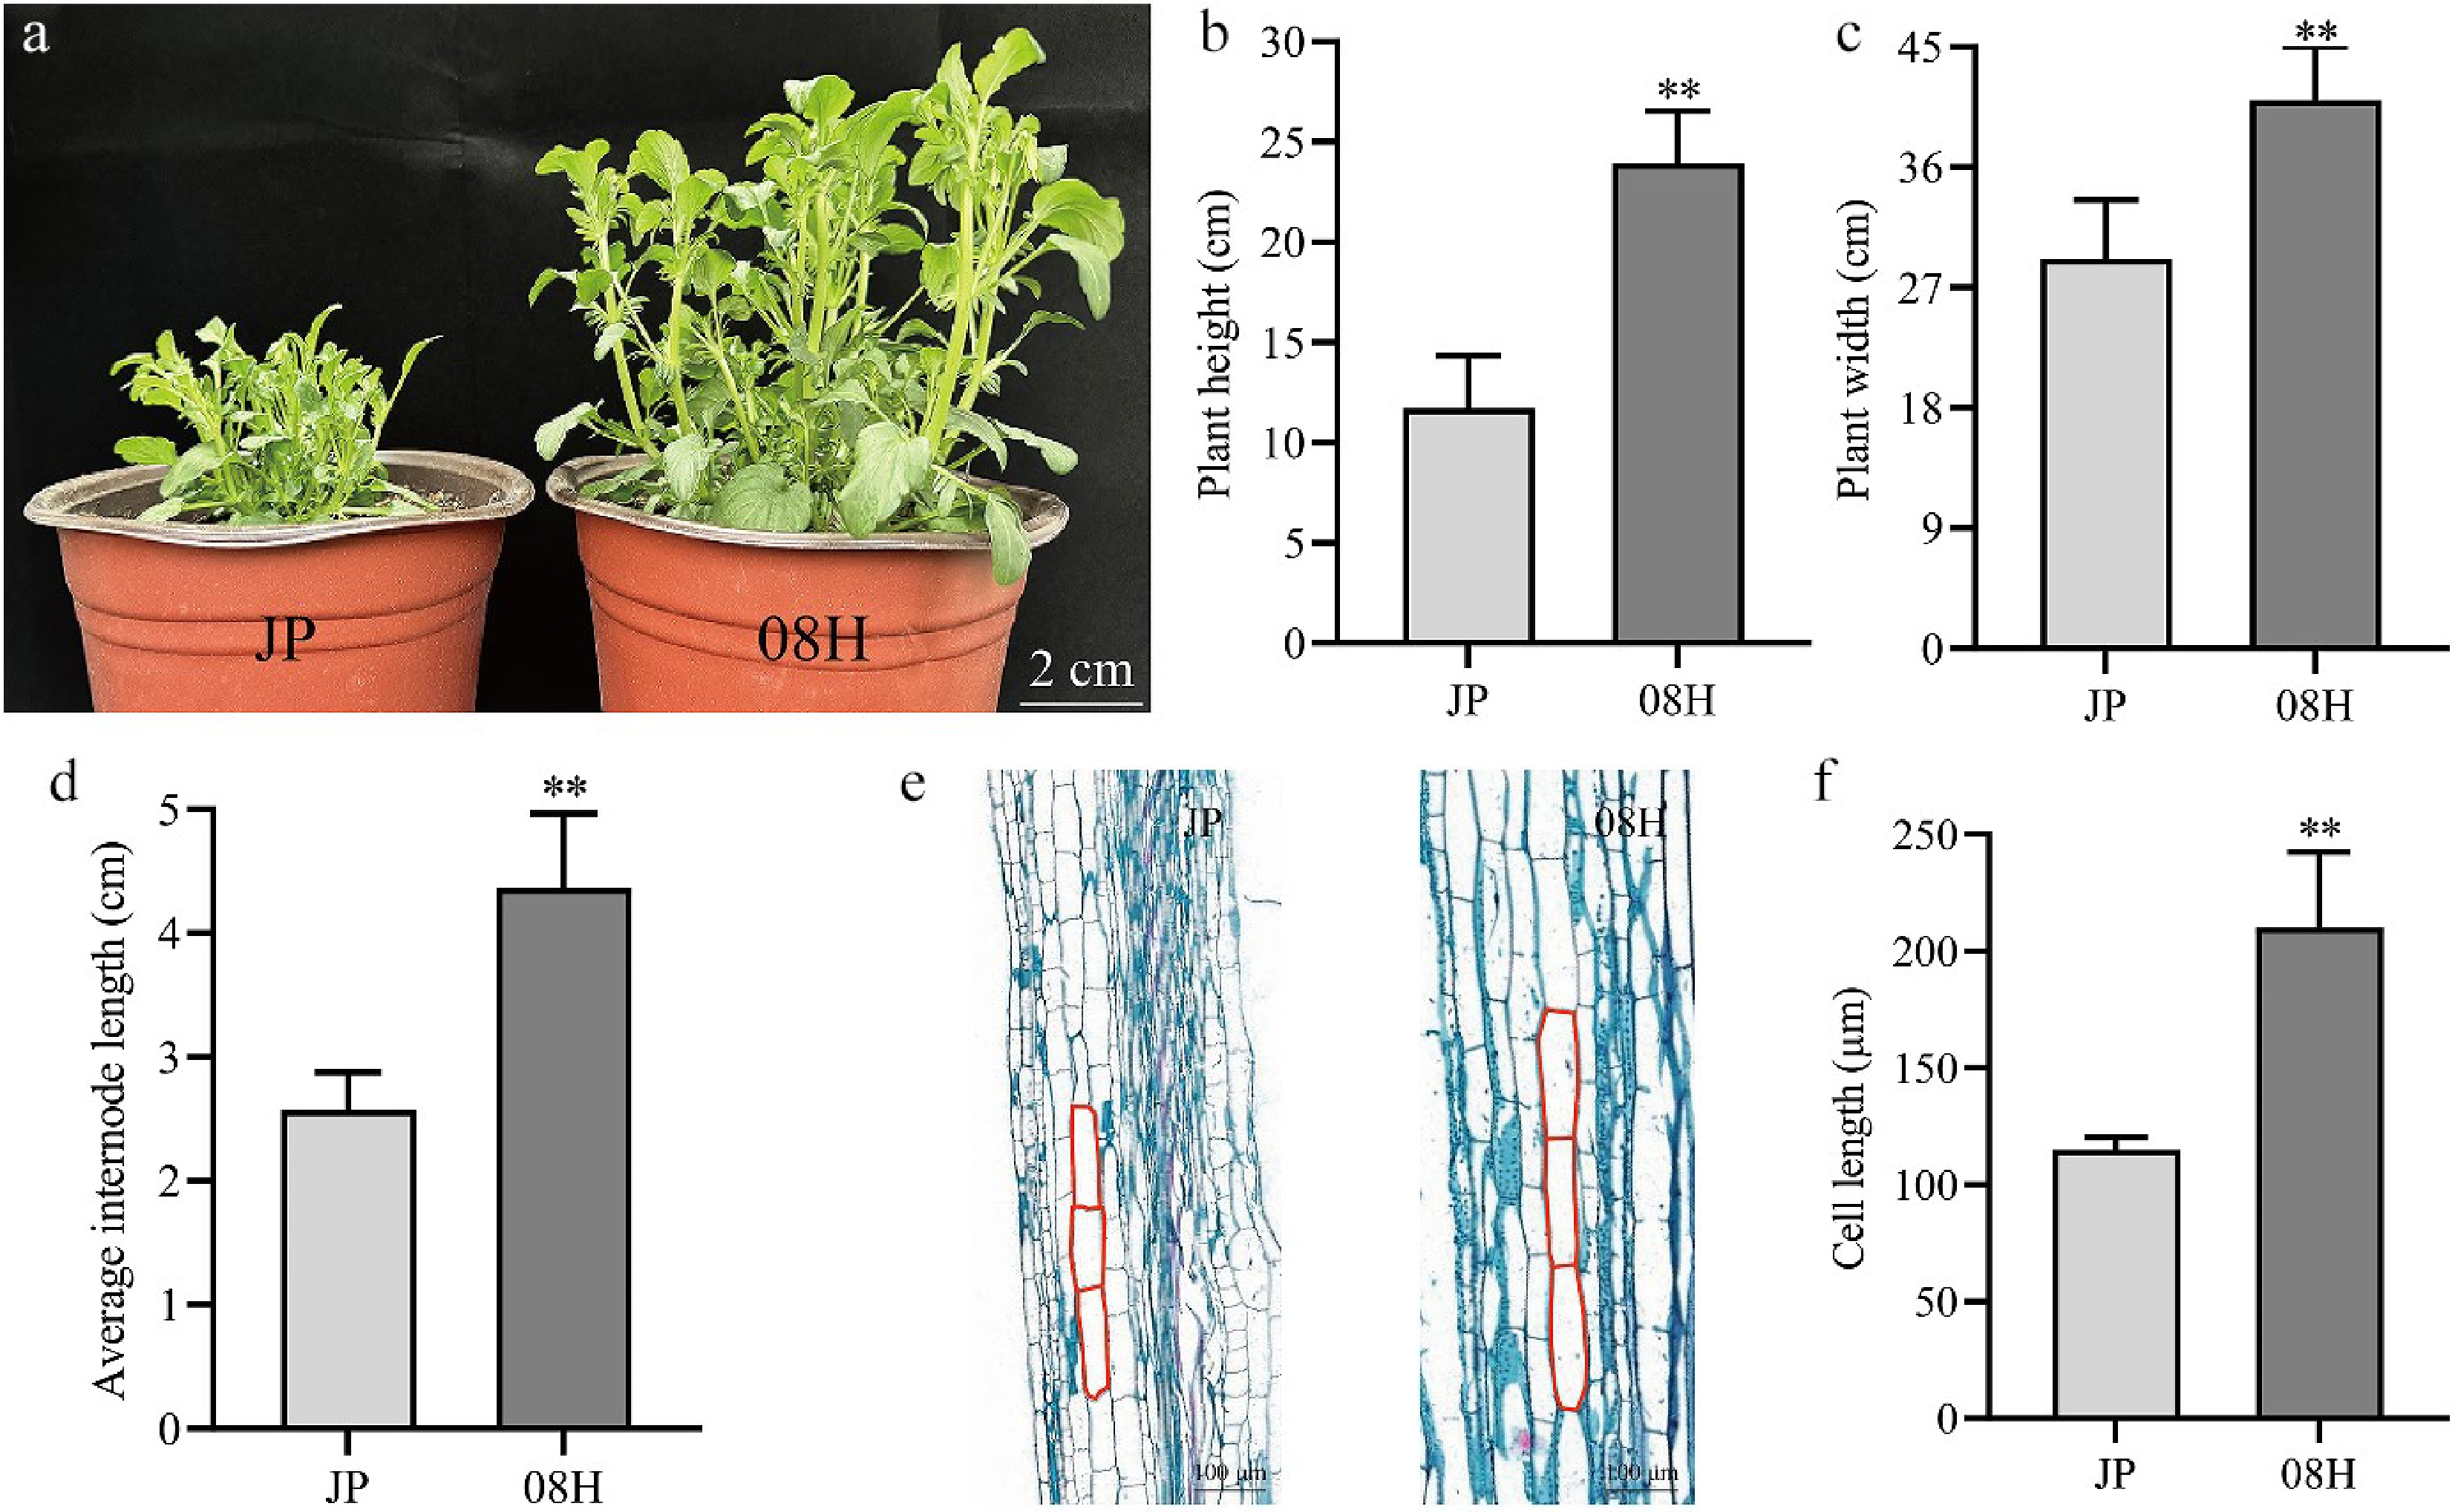
Figure 1.
The phenotype of JP and 08H. (a) Phenotypic characteristics of long-internode and short-internode inbred lines at 70 d. Scale bar = 2 cm. (b)–(d) The plant height, plant width, and average internode length of the strains are shown in the diagram. (e) Longitudinal paraffin sections of JP and 08H. (f) Length of cell in internode from JP and 08H. Data are means (± SD). Error bars are the standard deviation. ** p < 0.01, Student's t-test was used to calculate the p-value.
-
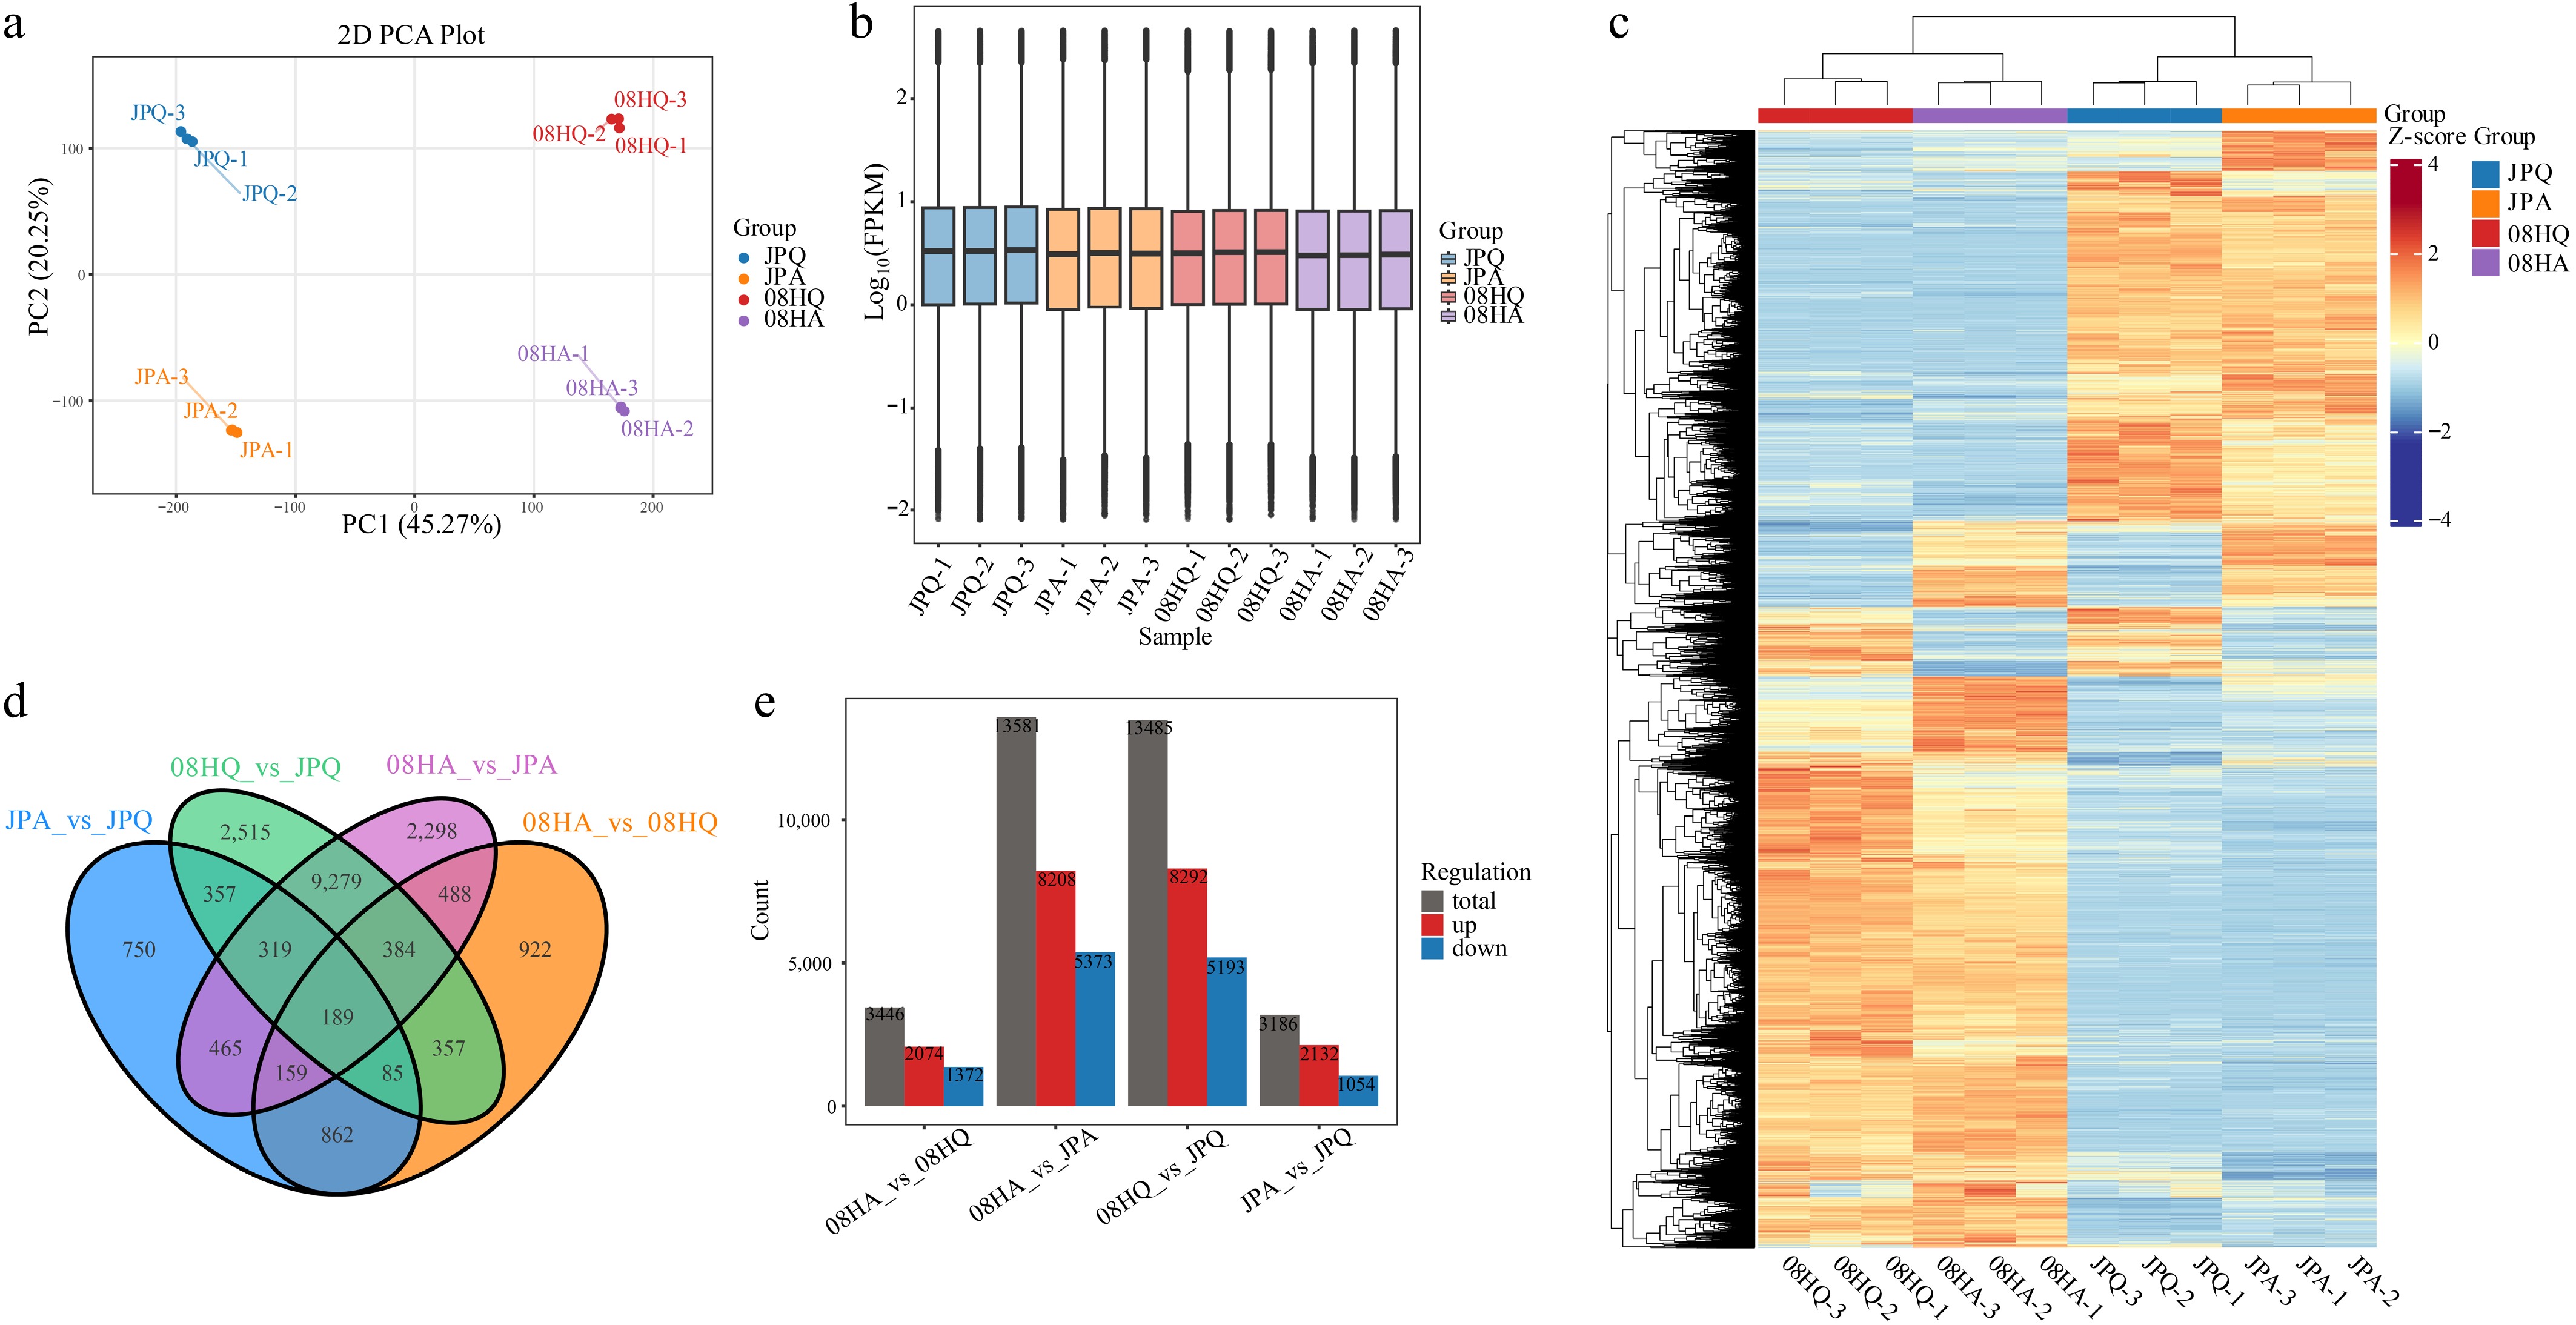
Figure 2.
Transcriptome sequencing and DEGs in V. tricolor inbred lines. (a) PCA of transcriptome sequencing data. (b) Gene expression of all samples, the boxplots with different colors indicate different samples analyzed. (c) Cluster analysis of DEGs based on gene expression of all samples. (d) Venn diagrams showing the number of DEGs among four comparisons. (e) DEGs of different components.
-
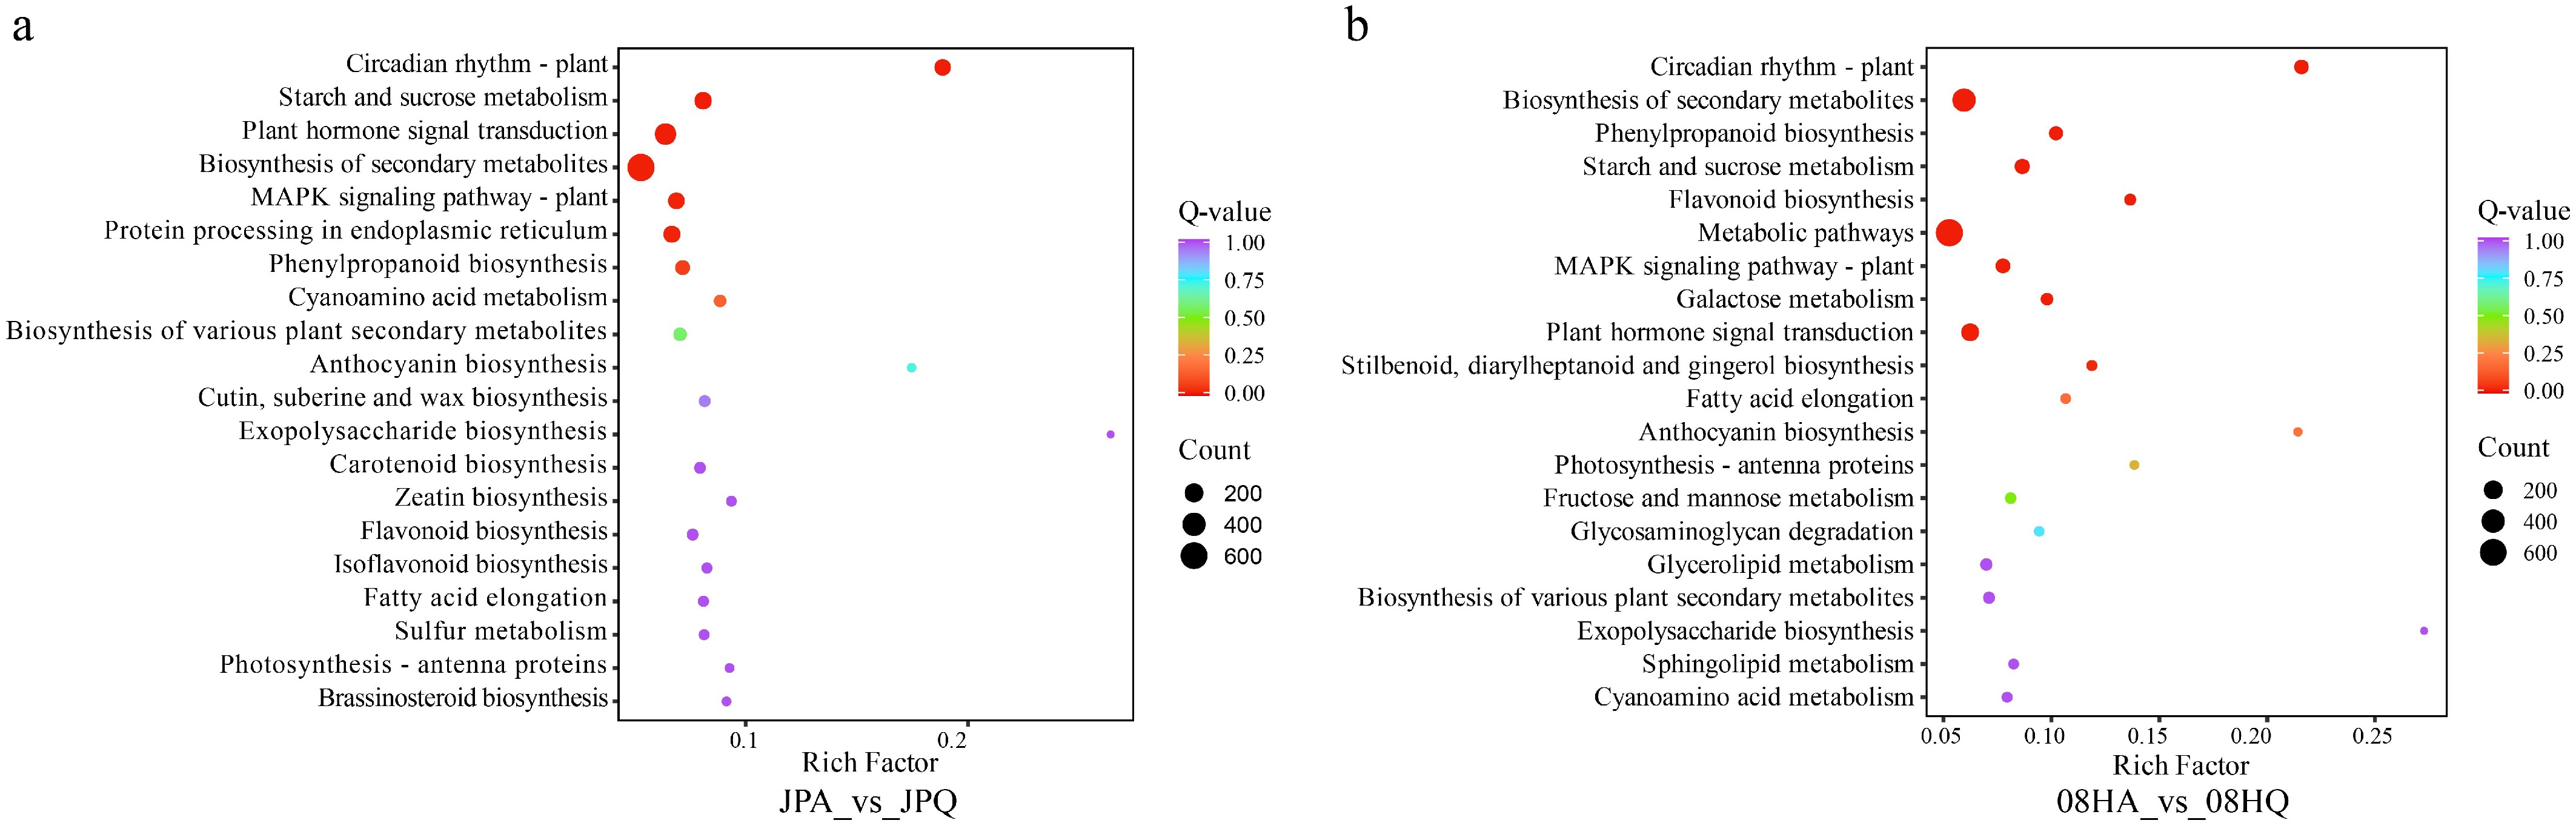
Figure 3.
KEGG analysis of DEGs identified in two different V. tricolor inbred lines. (a) KEGG enriched pathways for DEGs of 08H inbred line. (b) KEGG enriched pathways for DEGs of the JP inbred line.
-
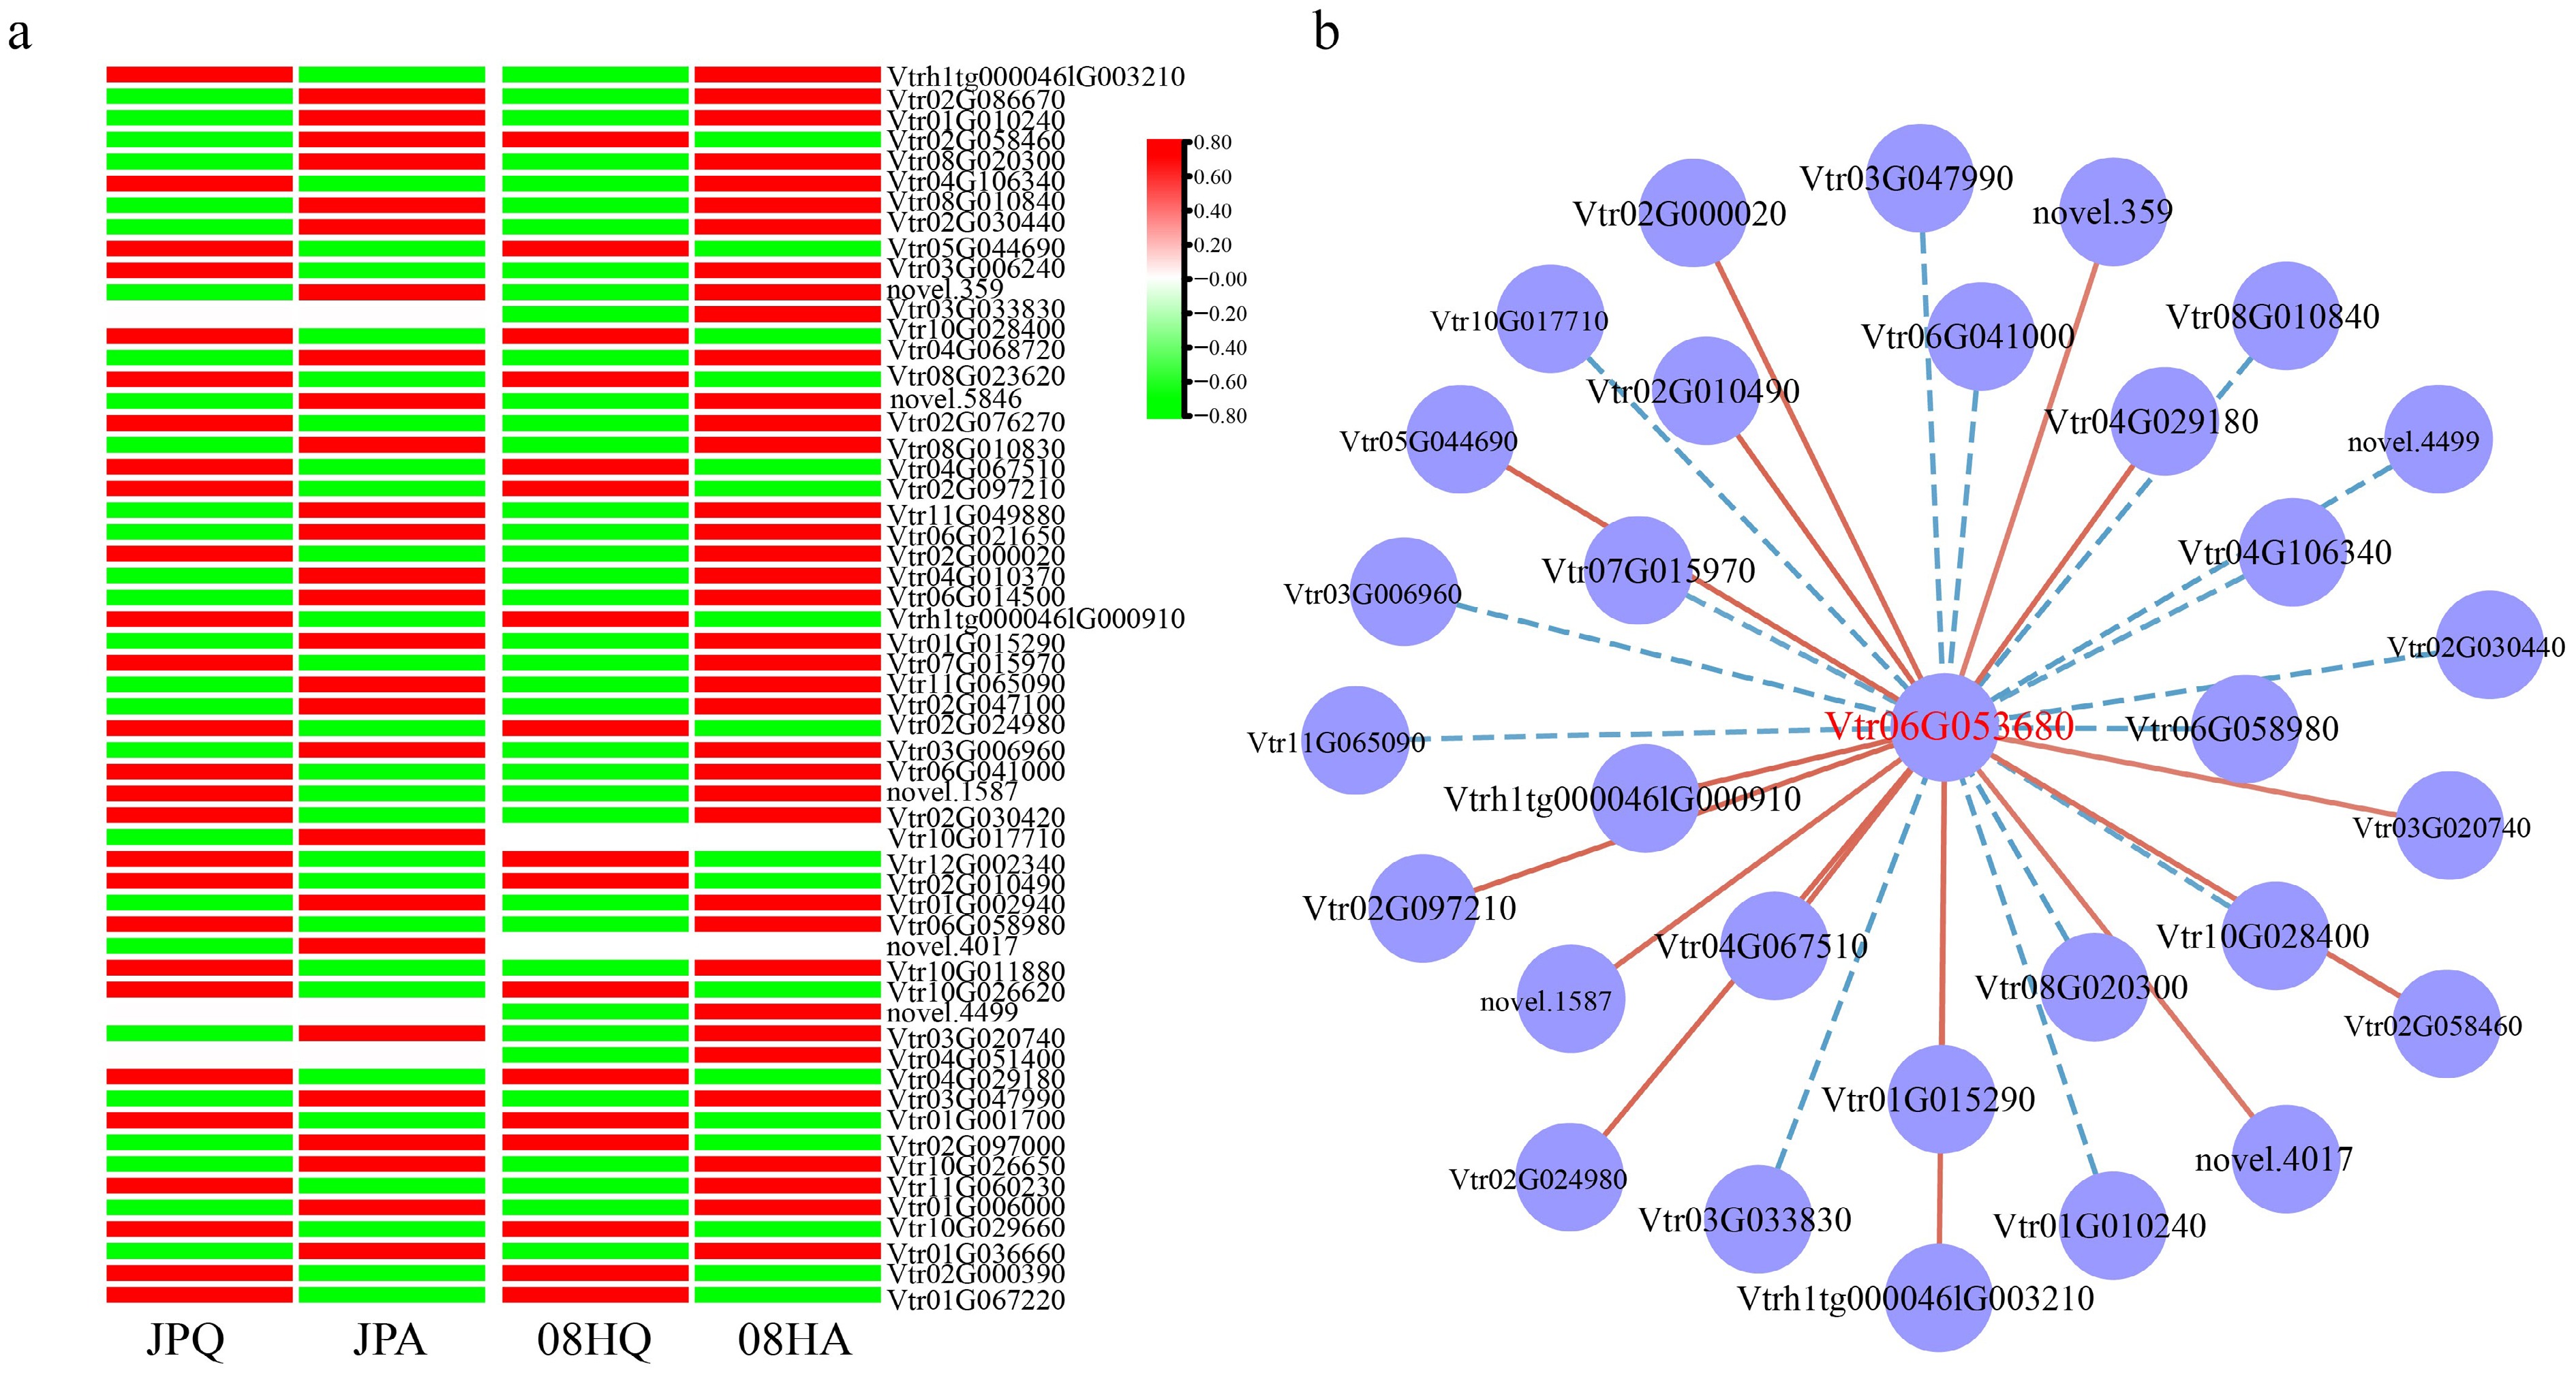
Figure 4.
The expression pattern of GA-related DEGs. (a) Cluster heat map of GA-related DEGs. (b) Co-expression network related to GAs. The red line represents positive correlation, and the blue line represents negative correlation.
-
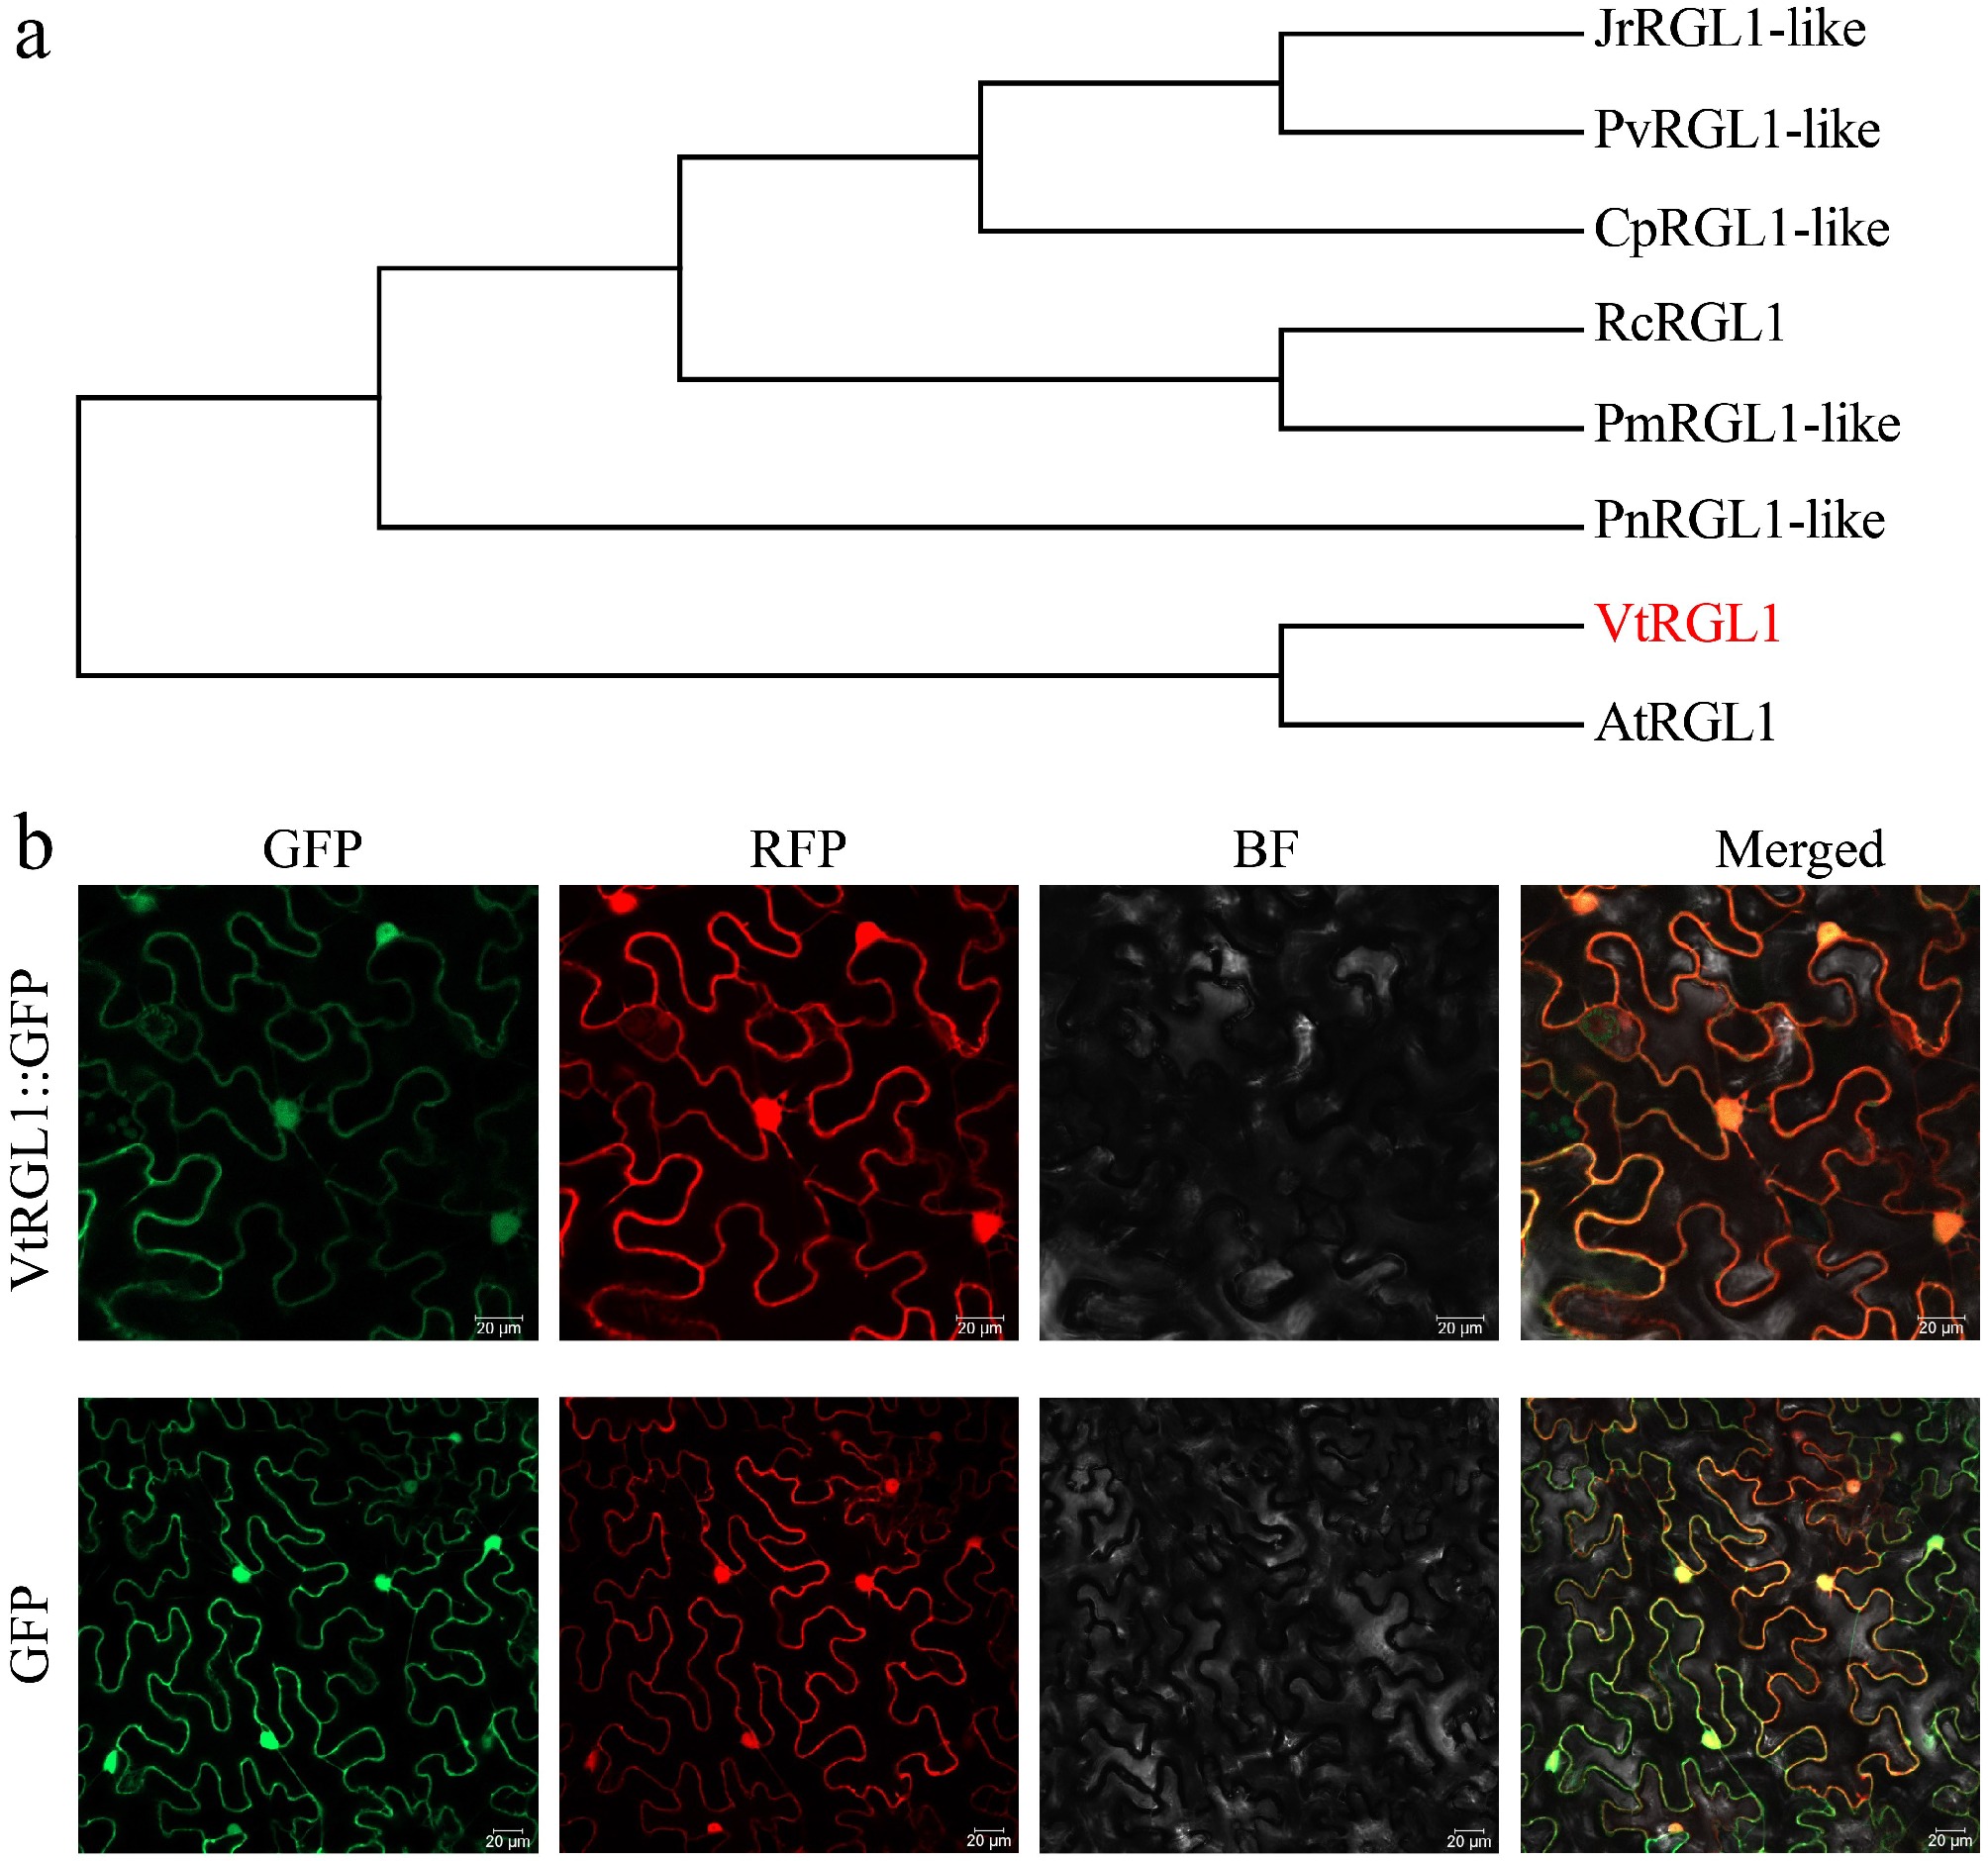
Figure 5.
Sequence analysis and subcellular localization of VtRGL1. (a) Phylogenetic tree analysis of VtRGL1. (b) Subcellular localization of VtRGL1. RFP, nuclear and cytoplasmic marker. Scale bar = 20 µm.
-
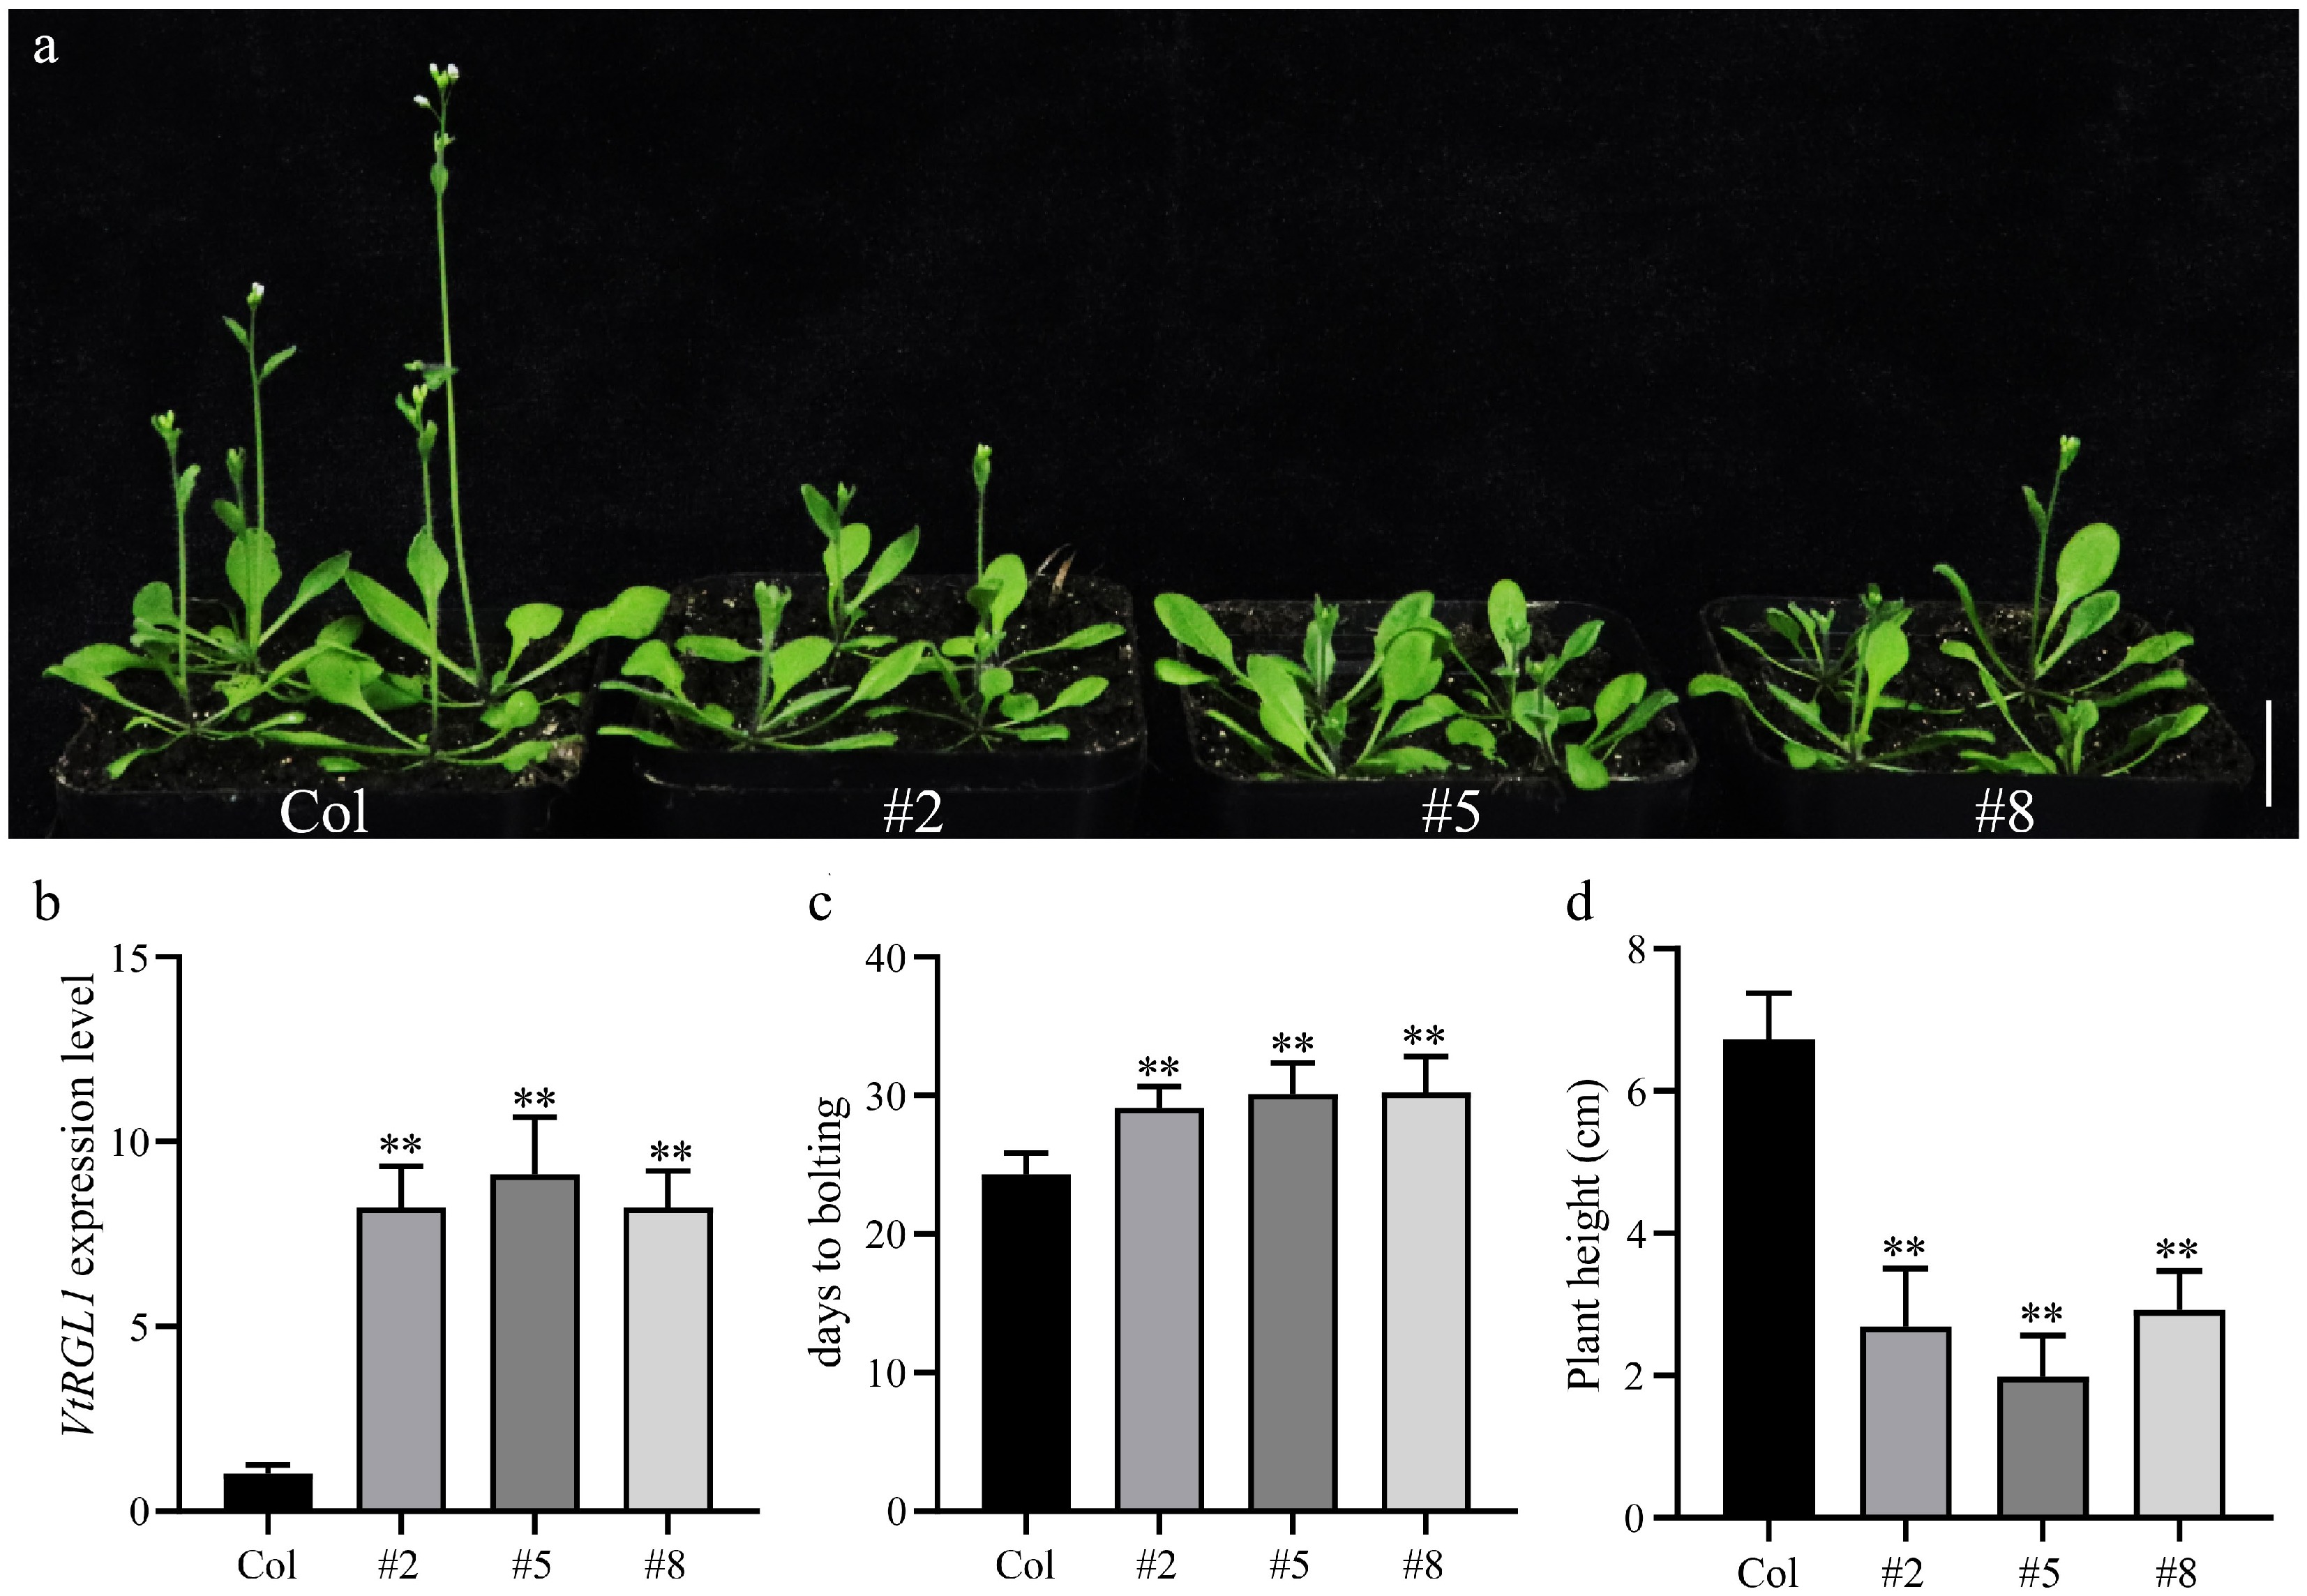
Figure 6.
Overexpression of VtRGL1 inhibited Arabidopsis bolting. (a) Plants of WT and VtRGL1 lines. Scale bar = 2 cm. (b) Expression of VtRGL1 in WT and VtRGL1 lines. (c) Statistics of the bolting times of WT and VtRGL1 lines. (d) Statistics of the plant height of WT and VtRGL1 lines.
Figures
(6)
Tables
(0)