-
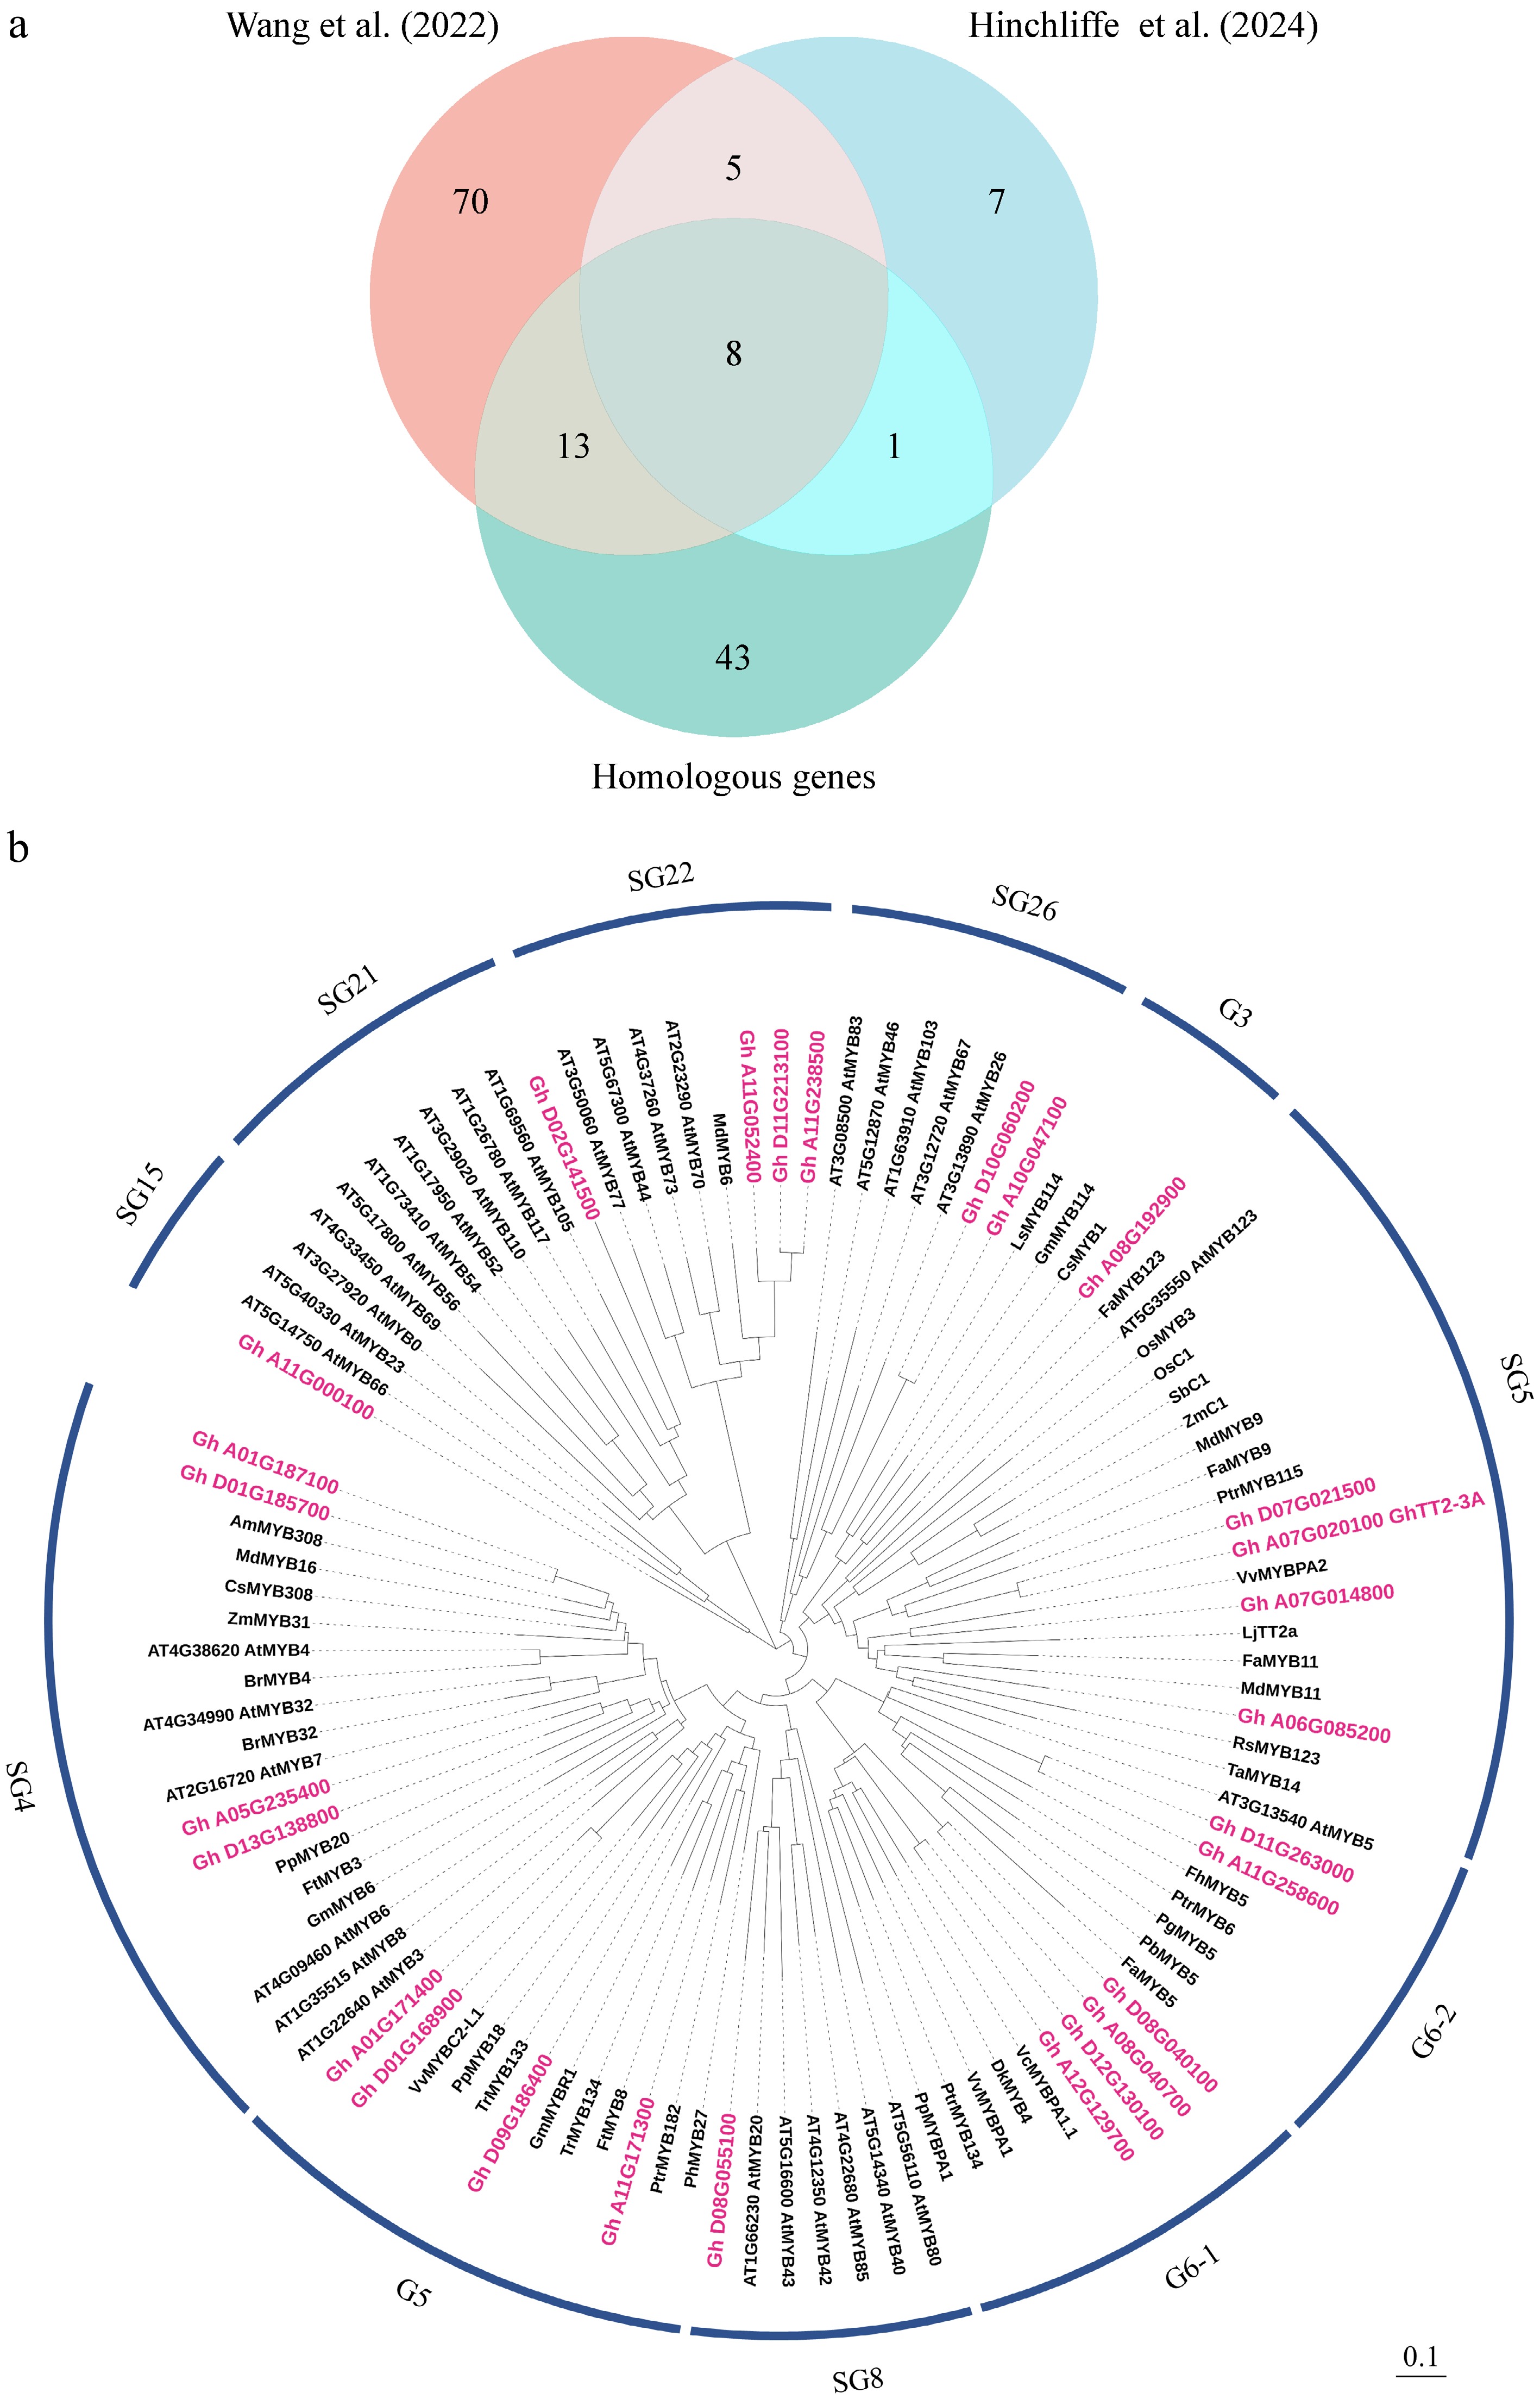
Figure 1.
Identification and phylogenetic relationship analysis of MYB genes related to anthocyanin/proanthocyanidin (PA) biosynthesis. (a) Venn diagram showing intersecting and overlapping candidate MYB transcription factors regulating anthocyanin/PA biosynthesis. MYB genes are derived from Wang et al.[26], and Hinchliffe et al.[31]. Homologous genes represent cotton homologs showing over 50% amino acid identity with known MYBs involved in the regulation of anthocyanin/PA biosynthesis from 34 other plants (Supplementary Dataset S3). (b) Phylogenetic analysis of 27 candidate cotton MYB proteins and reported anthocyanin/PA-related proteins from other plants. Candidate cotton MYB proteins are marked in red. Different clades are labeled based on homology with Arabidopsis proteins (SG1–26). G1 to G6 represent new subgroups. GenBank accessions of protein sequences are provided in Supplemental Dataset S2, S3. Scale bar indicates branch length.
-
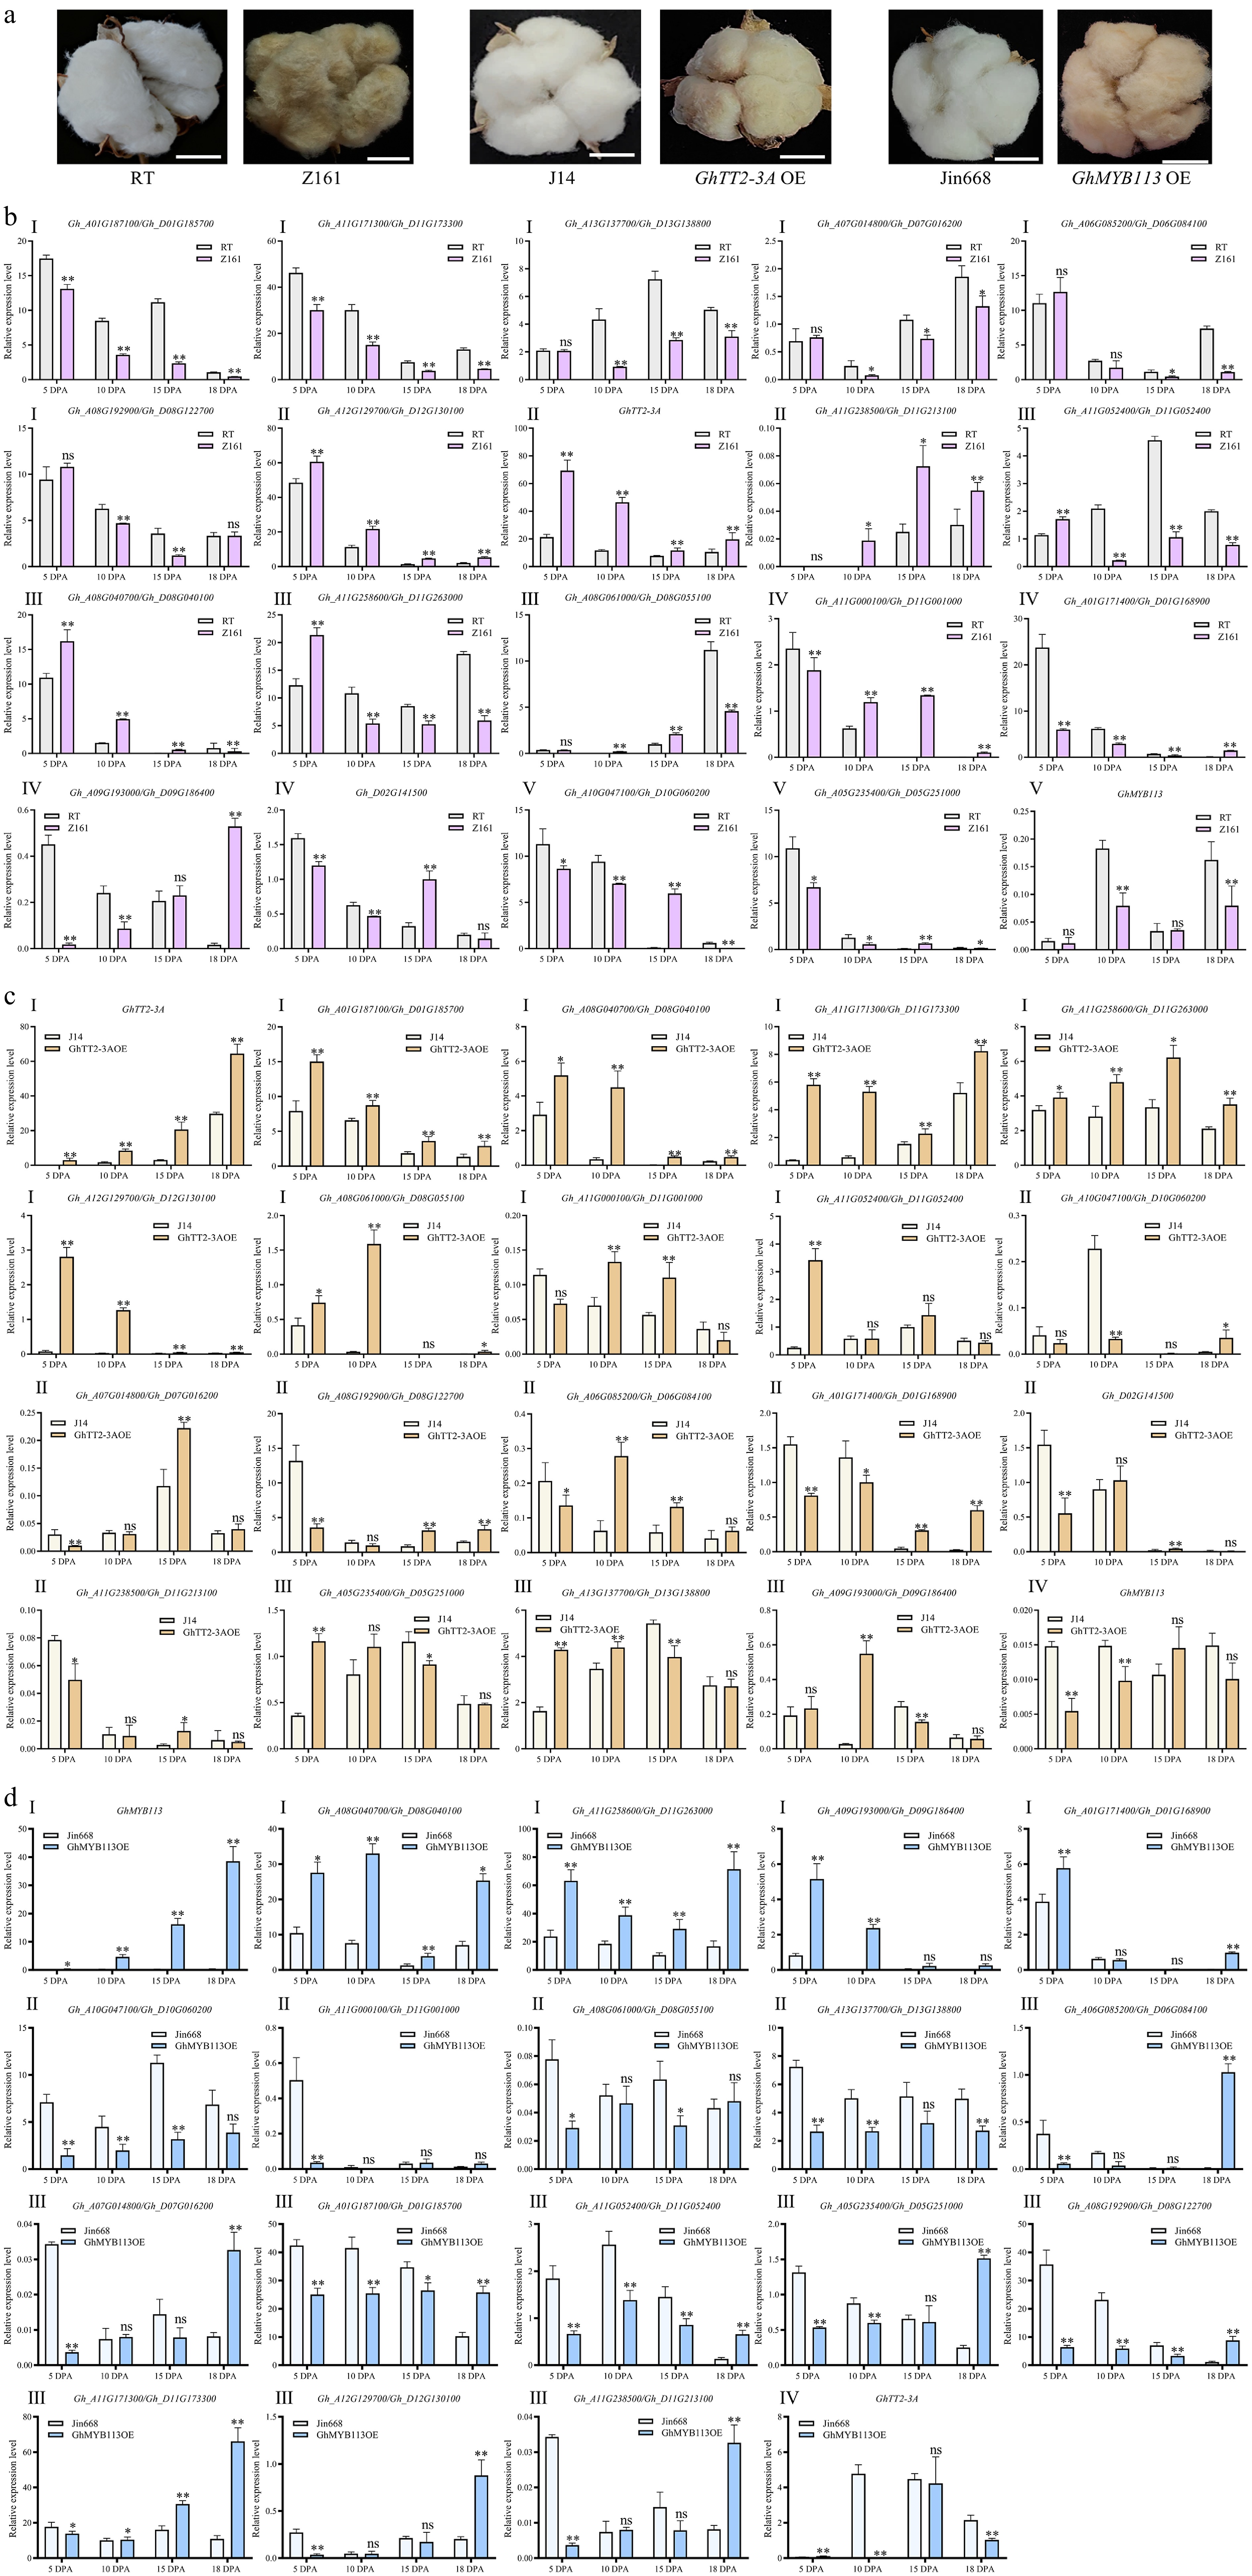
Figure 2.
Twenty-seven GhMYB genes exhibited differential expression in fibers of white vs brown cotton across four developmental stages (5–18 DPA). (a) Mature fibers of RT and its near-isogenic line Z161, J14, and GhTT2-3A- overexpressing line (GhTT2-3A OE), and Jin668 and GhMYB113- overexpressing line (GhMYB113 OE). Scale bar = 20 mm. (b) Expression analysis of 27 GhMYBs in RT (white cotton) and its near-isogenic lines Z161 (brown cotton) across the four fiber stages. The expression profiles displayed five patterns (I−V). (c) Expression analysis of 27 GhMYBs in J14 (white cotton) and GhTT2-3A overexpression line (brown cotton). The expression profiles were grouped into four types (I−IV). (d) Expression analysis of 27 GhMYBs in Jin668 (white cotton) and GhMYB113 overexpression line (brown cotton). The expression profiles were categorized into four types (I−IV). The cotton ubiquitin gene GhUBI1 was used as a reference gene for normalization. Data are presented as mean ± standard deviation (n = 3). Different letters above the bar graphs indicate significant differences determined by independent two-tailed t-test (GraphPad Prism 10). Independent two-tailed t-test was used for statistical analysis, where p < 0.05 is denoted by *, p < 0.01 is denoted by **, and no significant difference (p ≥ 0.05) is denoted by ns.
-
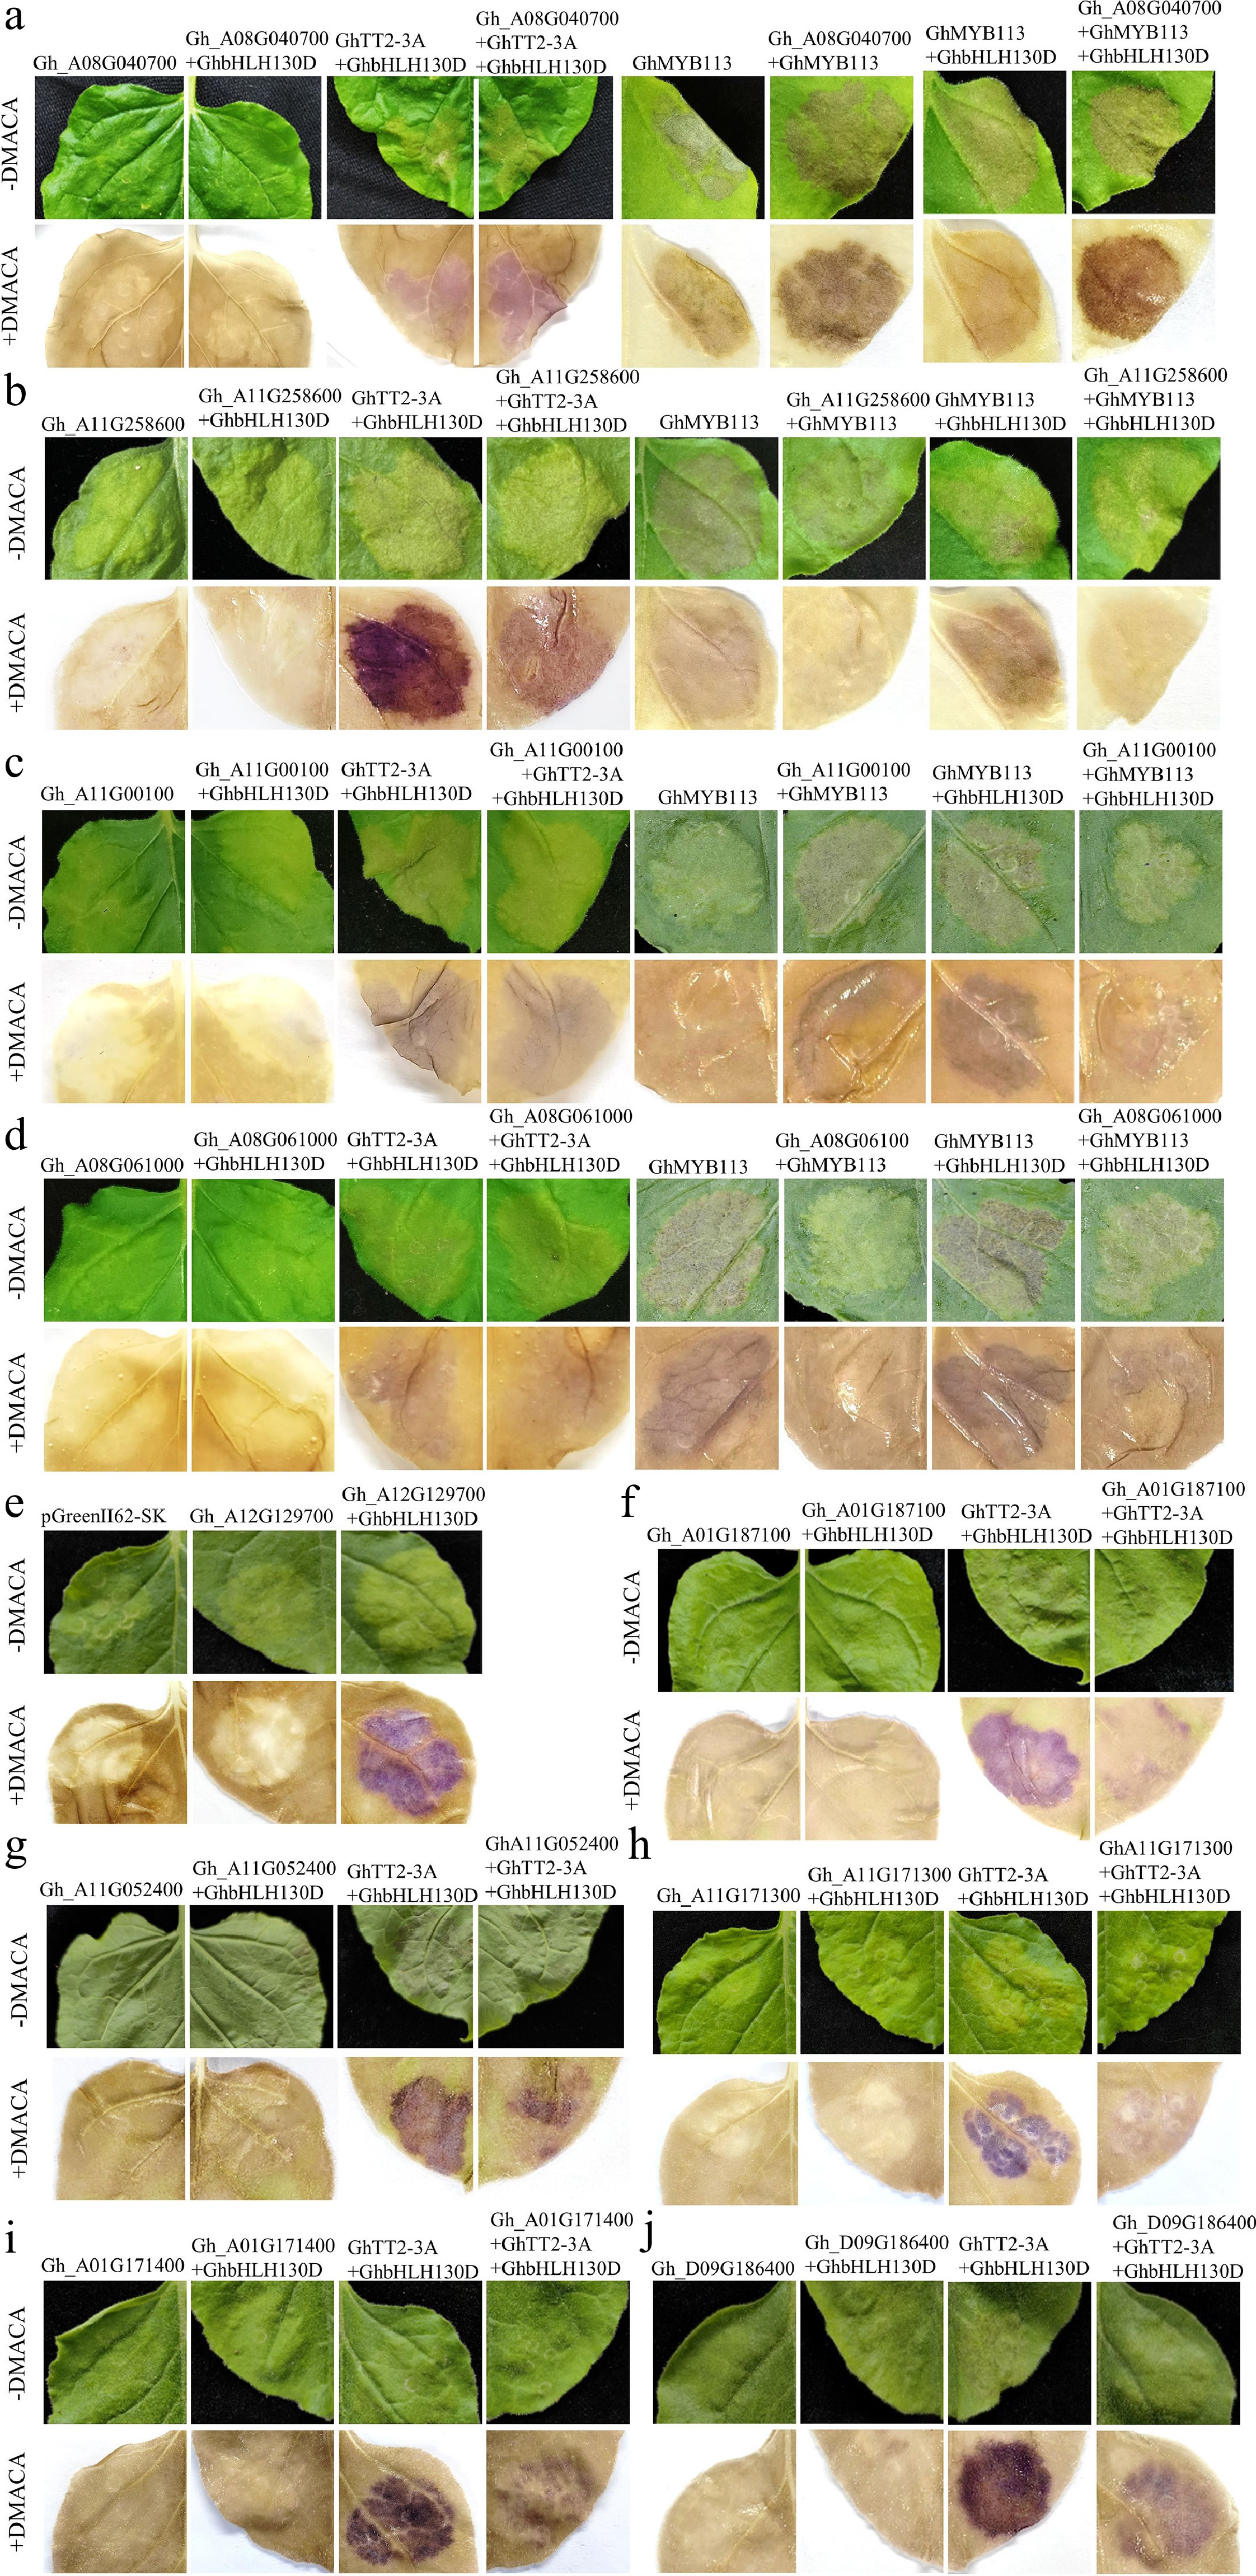
Figure 3.
Transient expression of GhMYB in tobacco leaves. (a) Co-expression of Gh_A08G040700 with GhTT2-3A and GhbHLH130D significantly enhanced pigment deposition. Gh_A08G040700 also augmented pigment accumulation induced by GhMYB113 alone or in combination with GhbHLH130D. Transient expression of GhTT2-3A alone or together with GhbHLH130D in tobacco leaves resulted in brown pigmentation following DMACA staining. Similarly, expression of GhMYB113 alone or in conjunction with GhbHLH130D leads to the production of light red anthocyanins, with brown substances becoming visible upon DMACA staining. The empty vector pGreenII 62-SK was used as the negative control. (b) Gh_A11G258600 significantly suppressed pigment accumulation induced by the co-expression of GhTT2-3A and GhbHLH130D. Co-expression of Gh_A11G258600 with either GhMYB113 alone, or in combination with GhbHLH130D also reduced pigment deposition. (c) Gh_A11G00100 reduced pigment accumulation resulting from the co-expression of GhTT2-3A and GhbHLH130D, and also suppressed pigment deposition induced by either GhMYB113 alone, or in combination with GhbHLH130D. (d) Gh_A08G061000 also significantly inhibited pigment deposition. (e) Co-transformation of Gh_A12G129700 with GhbHLH130D could induce pigment deposition. (f) Gh_A01G187100 significantly inhibited PA formed by GhTT2-3A and GhbHLH130D. (g) Gh_A11G052400 inhibited the deposition of PAs. (h) Gh_A11G171300 inhibited the deposition of PAs. (i) Gh_A01G171400 inhibited the pigment formed by GhTT2-3A and GhbHLH130D. (j) Gh_D09G186400 inhibited the pigment formed by GhTT2-3A and GhbHLH130D. Each experiment was repeated 3–5 times. The photographs were taken 7 d after infiltration. Original images are presented as Supplementary Fig. S3.
-
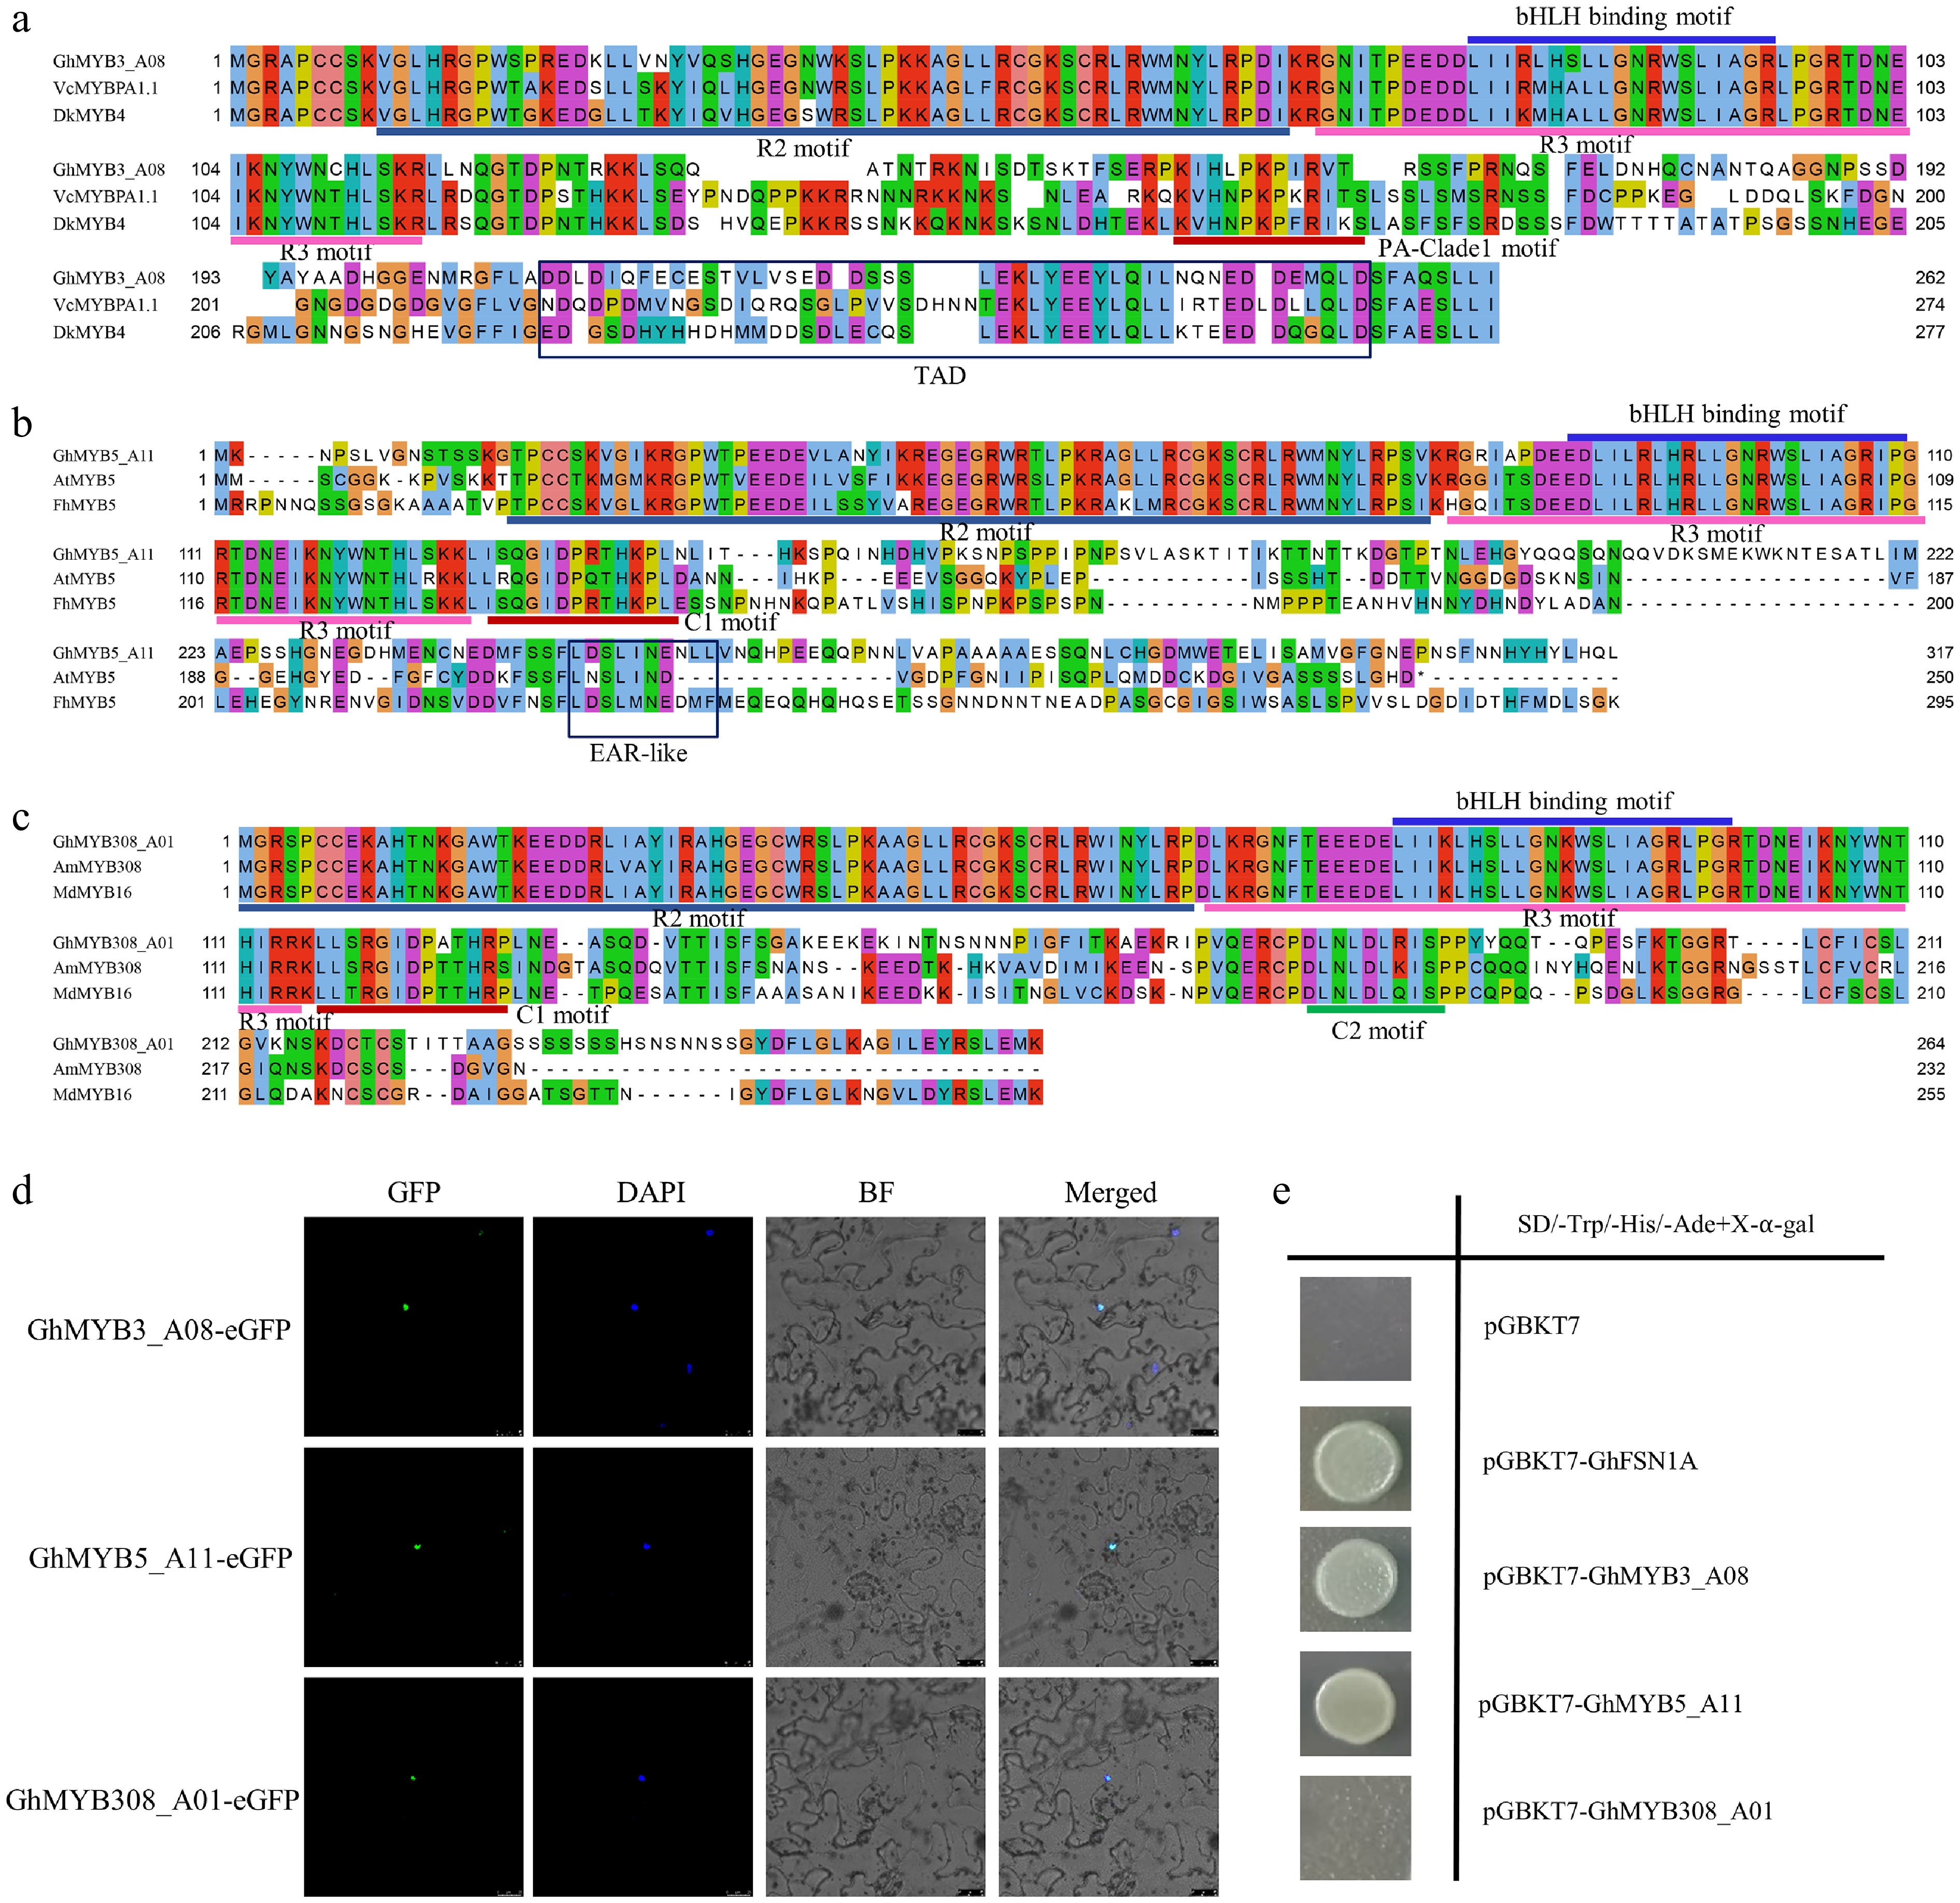
Figure 4.
Subcellular localization and transcriptional activation assays of GhMYB proteins. (a)–(c) Multiple sequence alignment analysis of GhMYB3_A08, GhMYB5_A11, and GhMYB308_A01 with other known plant MYB regulators related to anthocyanin/PA biosynthesis. Conserved residues and partial conservation are shown in different colors. The N-terminal R2 and R3 motifs, bHLH binding motif, and C-terminal C1 and C2 motifs are indicated with lines in different colors. TAD and EAR-like domains are indicated with black boxes. Protein sequences of VcMYBPA1, DkMYB4, AtMYB5, FhMYB5, AmMYB308, and MdMYB16 are listed in Supplementary Dataset S3. (d) Subcellular localization of GhMYB3_A08, GhMYB5_A11, and GhMYB308_A01 in tobacco leaves. GFP: green fluorescent protein. DAPI: nuclear dye. BF: bright field. Merged indicates overlaid image of GFP, DAPI, and bright field. Scale bar = 25 μm. (e) Transcriptional activation analysis of GhMYB3_A08, GhMYB5_A11, and GhMYB308_A01 in yeast. pGBKT7 serves as the negative control, and pGBKT7-GhFSN1A as the positive control.
-
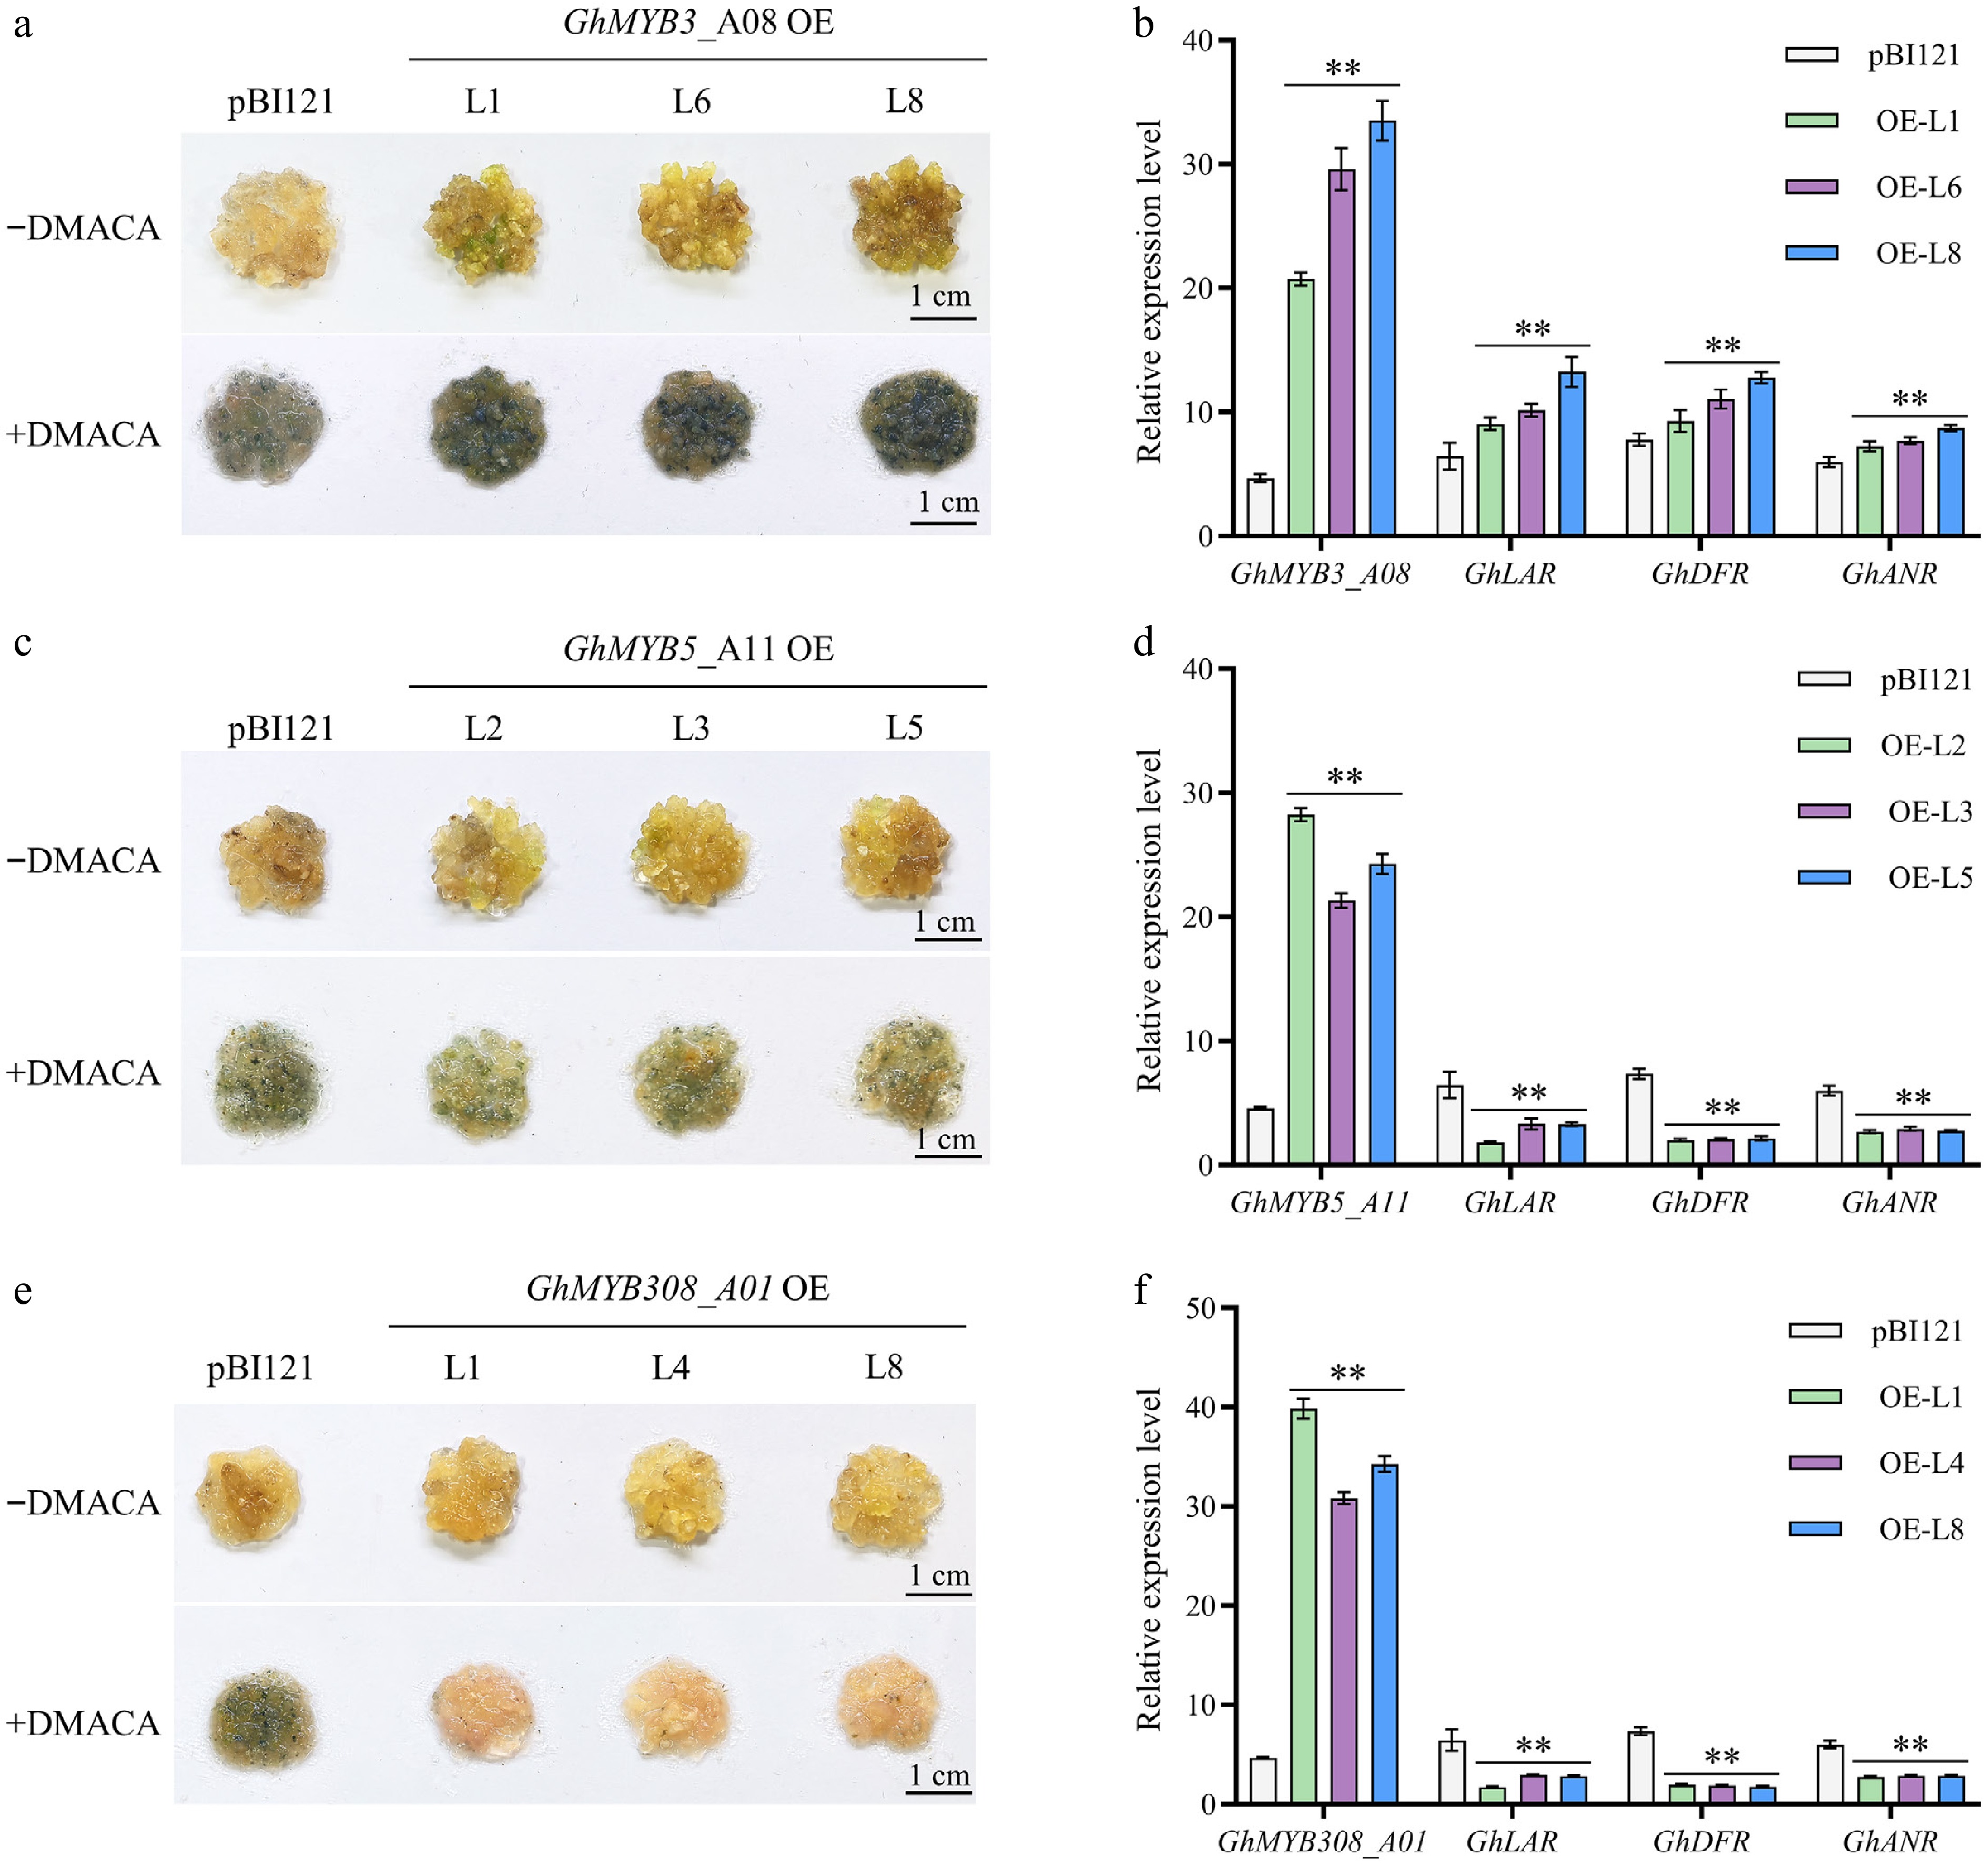
Figure 5.
Functional analysis of GhMYB3_A08, GhMYB5_A11, and GhMYB308_A01. (a) Expression of GhMYB3_A08 in cotton calli led to enhanced PA accumulation compared to the control. −DMACA: callus before staining; +DMACA: callus after staining with 0.1% DMACA for 5 min. OE L1/L6/L8 represent three independent GhMYB3_A08 overexpression transgenic lines. pBI121 represents the empty vector control. (b) GhMYB3_A08 overexpression upregulated the expression of PA pathway genes GhLAR, GhANR, and GhDFR. (c) Overexpression of GhMYB5_A11 in cotton callus reduced PA accumulation. OE L2/L3/L5 represent three independent transgenic lines. (d) GhMYB5_A11 overexpression downregulated the expression levels of PA synthesis genes. (e) Overexpression of GhMYB308_A01 in cotton callus significantly reduced PA accumulation compared with the control. OE L1/L4/L8 represent three independent transgenic lines. (f) Expression of GhLAR, GhANR, and GhDFR were significantly decreased compared with the control. Values are presented as mean ± standard deviation, n = 3. Statistical analysis was performed using univariate t-test, and different letters indicate statistically significant differences (p < 0.05). Scale bar = 1 cm.
-
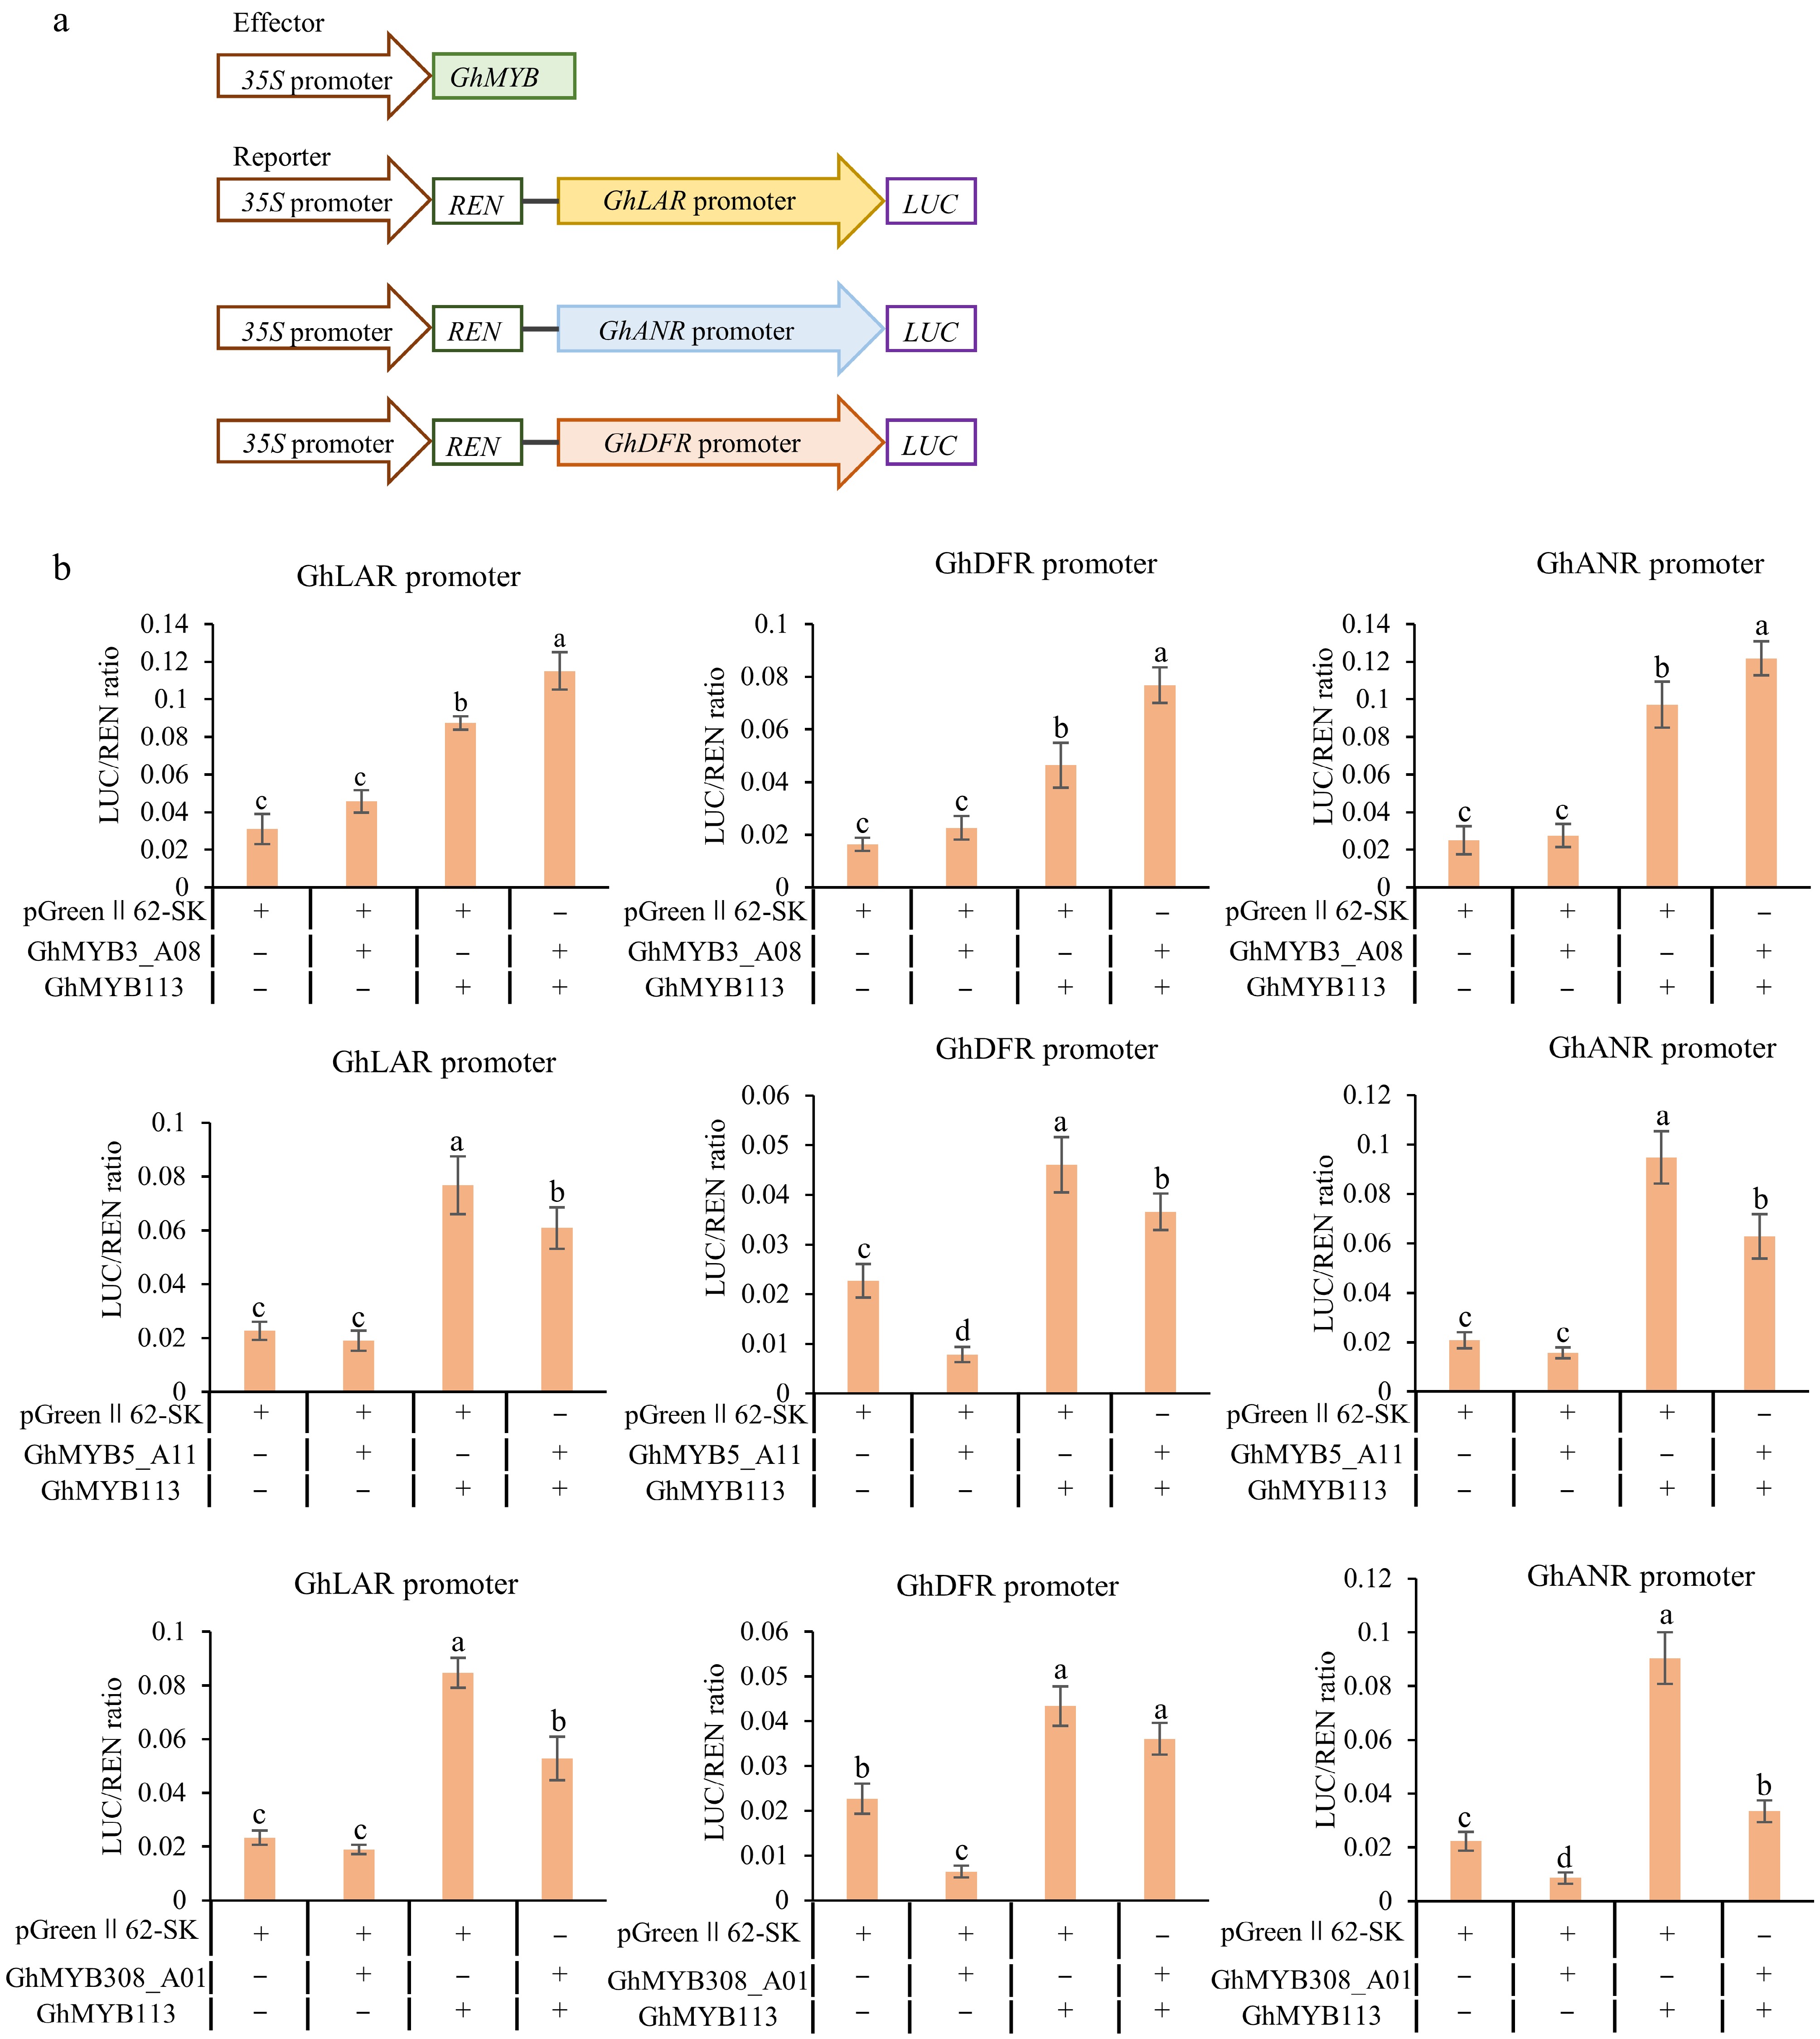
Figure 6.
Transcriptional activation analysis of GhMYB3_A08, GhMYB5_A11, and GhMYB308_A01on promoters of GhLAR, GhANR, and GhDFR. (a) Schematic diagram of effector and reporter vectors used in transactivation assays. (b) Activation/repression effect of GhMYB3_A08, GhMYB5_A11, and GhMYB308_A01 on the promoters of three PA genes GhLAR, GhANR, and GhDFR. Values are presented as the mean ± standard deviation (SD) of three biological replicates. Statistical analysis was performed using one-way ANOVA combined with Tukey's HSD multiple comparison test, and different lowercase letters indicate significant differences between groups (p < 0.05).
-
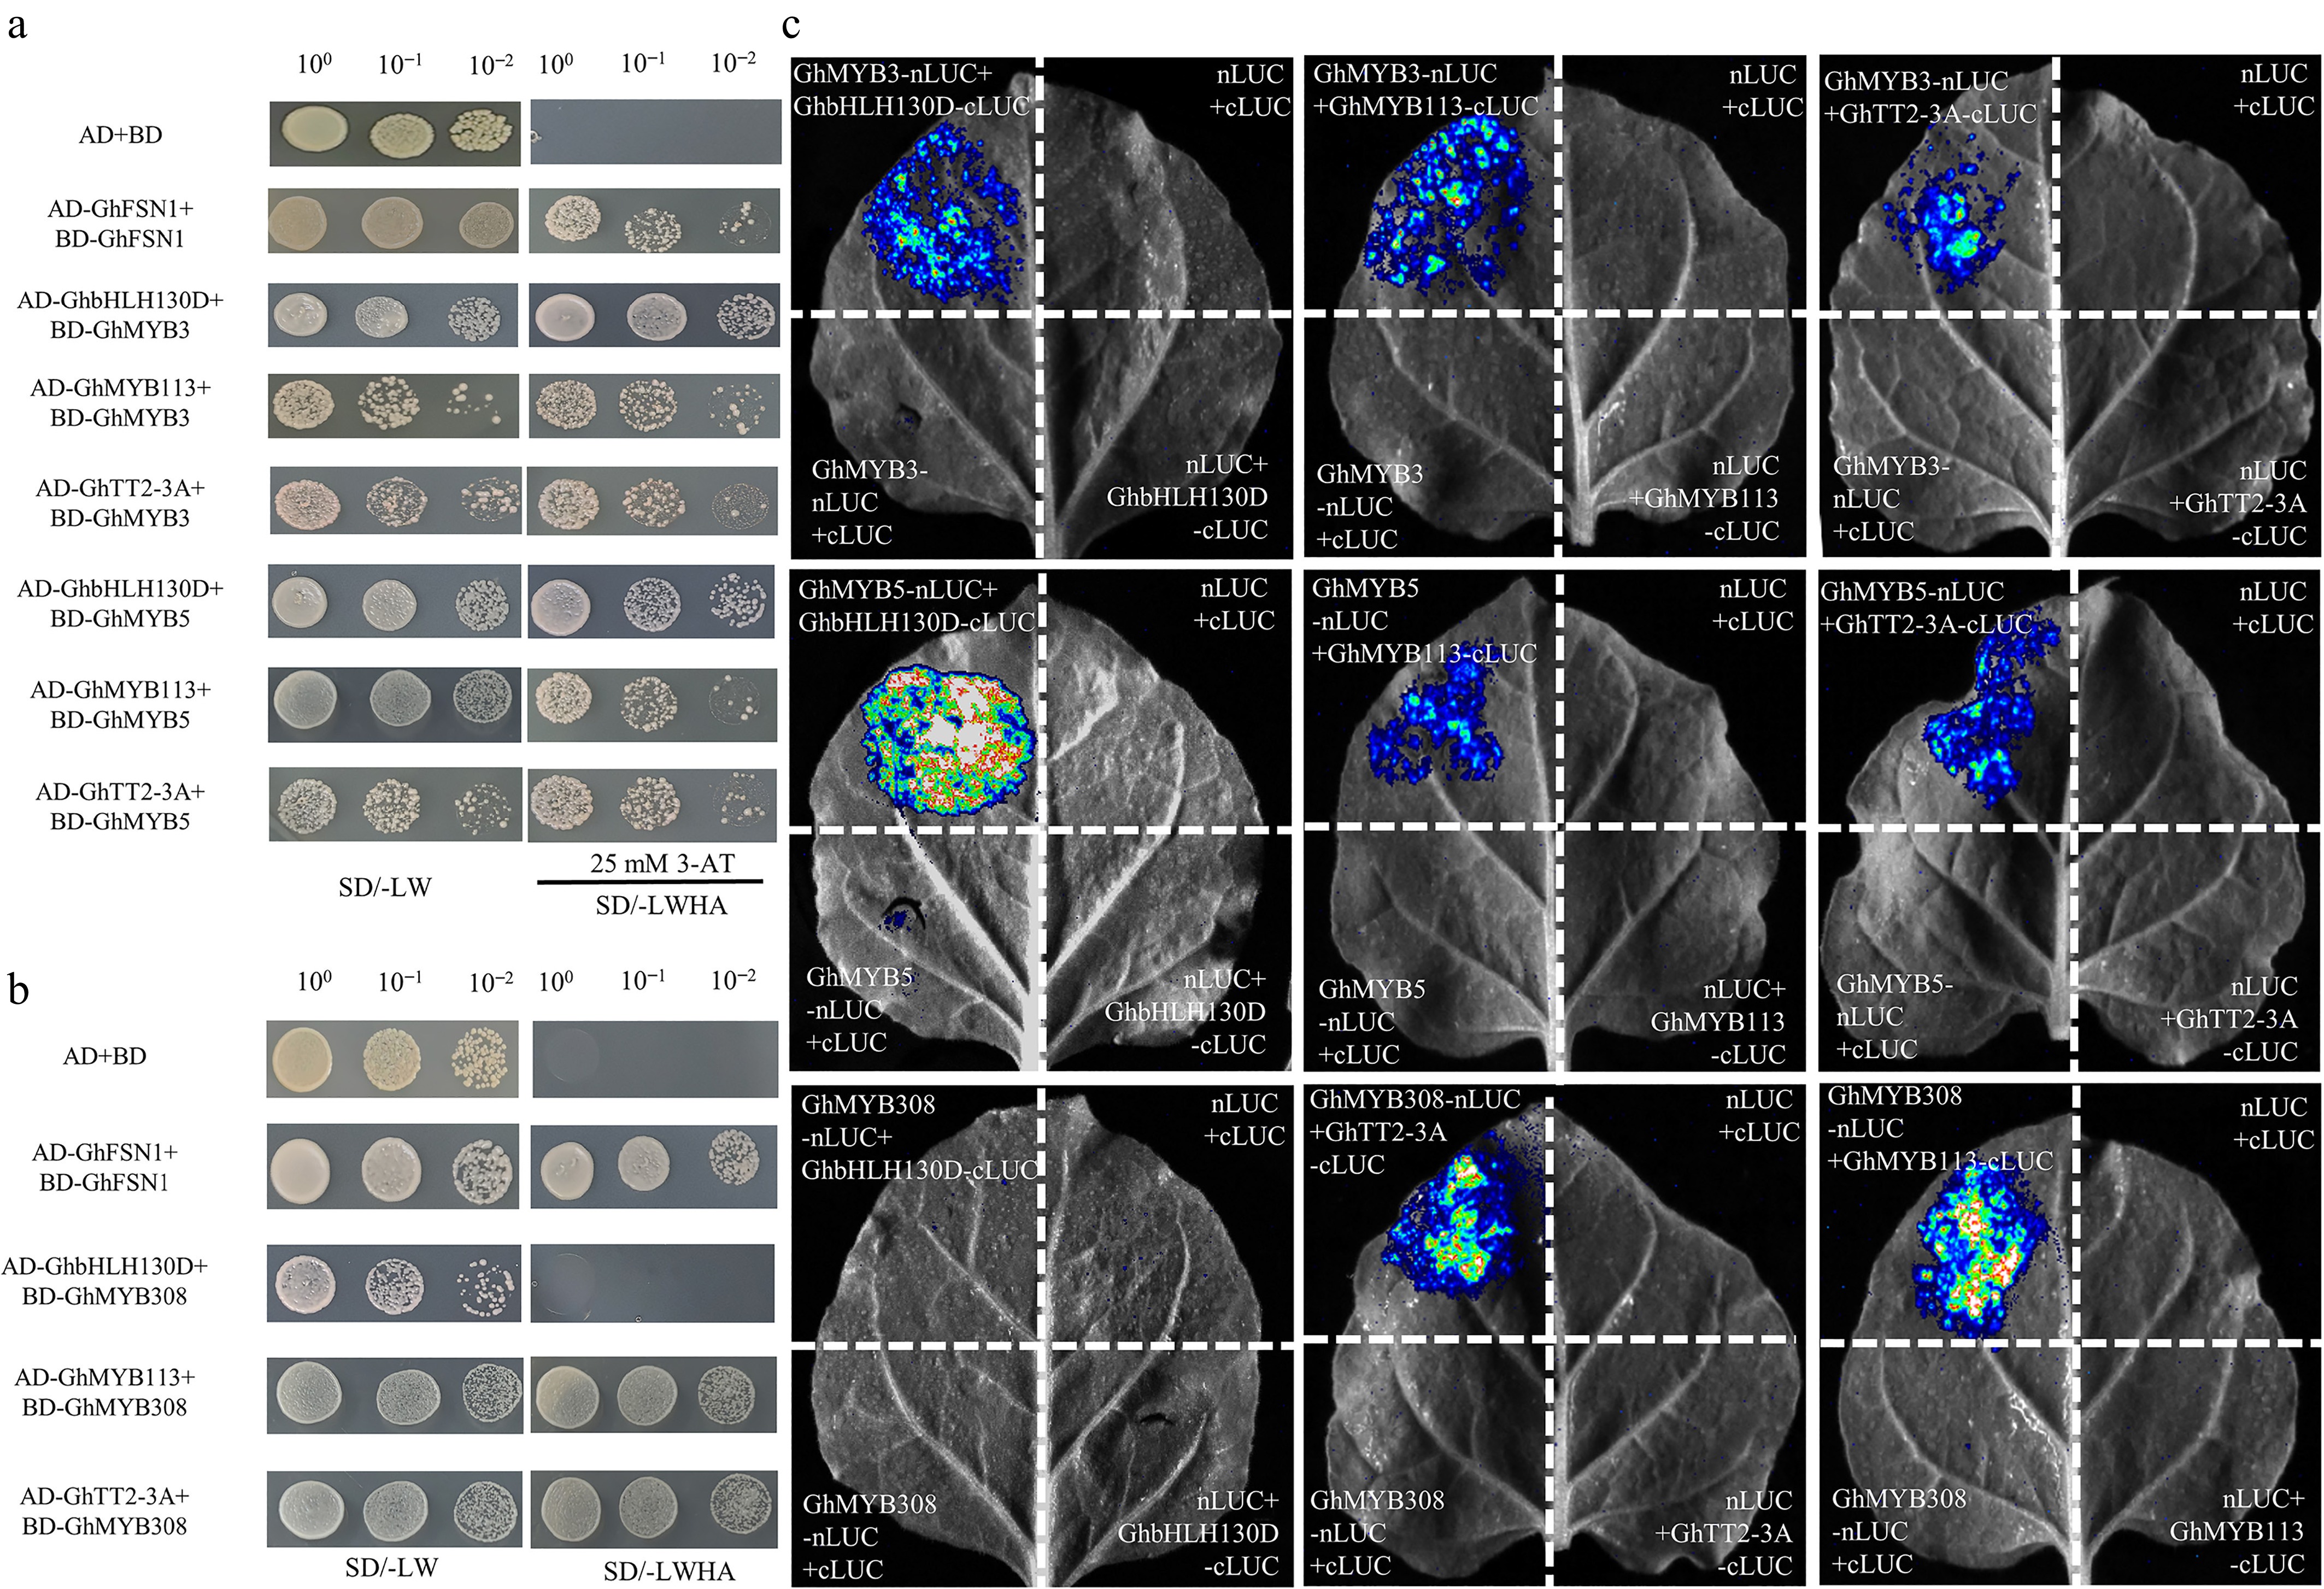
Figure 7.
Protein-protein interactions among GhMYB3, GhMYB5, GhMYB308, GhbHLH130D, GhTT2-3A, and GhMYB113. (a) Yeast two-hybrid (Y2H) assay revealing interactions among GhMYB3, GhMYB5, GhTT2-3A, GhMYB113, and GhbHLH130D. The combination of pGBKT7 (BD) + pGADT7 (AD) served as the negative control. AD-GhFSN1 + BD-GhFSN1 was used as the positive control. (b) Y2H demonstrated GhMYB3 and GhMYB5 interacted with GhbHLH130D, whereas no interaction was detected between GhMYB308 and GhbHLH130D. (c) Verification of in vivo protein-protein interactions by Luciferase Complementation Imaging (LCI) assay. Negative controls include nLUC + cLUC, GhMYB-cLUC + nLUC, and GhMYB-nLUC + cLUC. GhMYB3_A08, GhMYB5_A11, and GhMYB308_A01 are abbreviated as GhMYB3, GhMYB5, and GhMYB308, respectively.
Figures
(7)
Tables
(0)