-
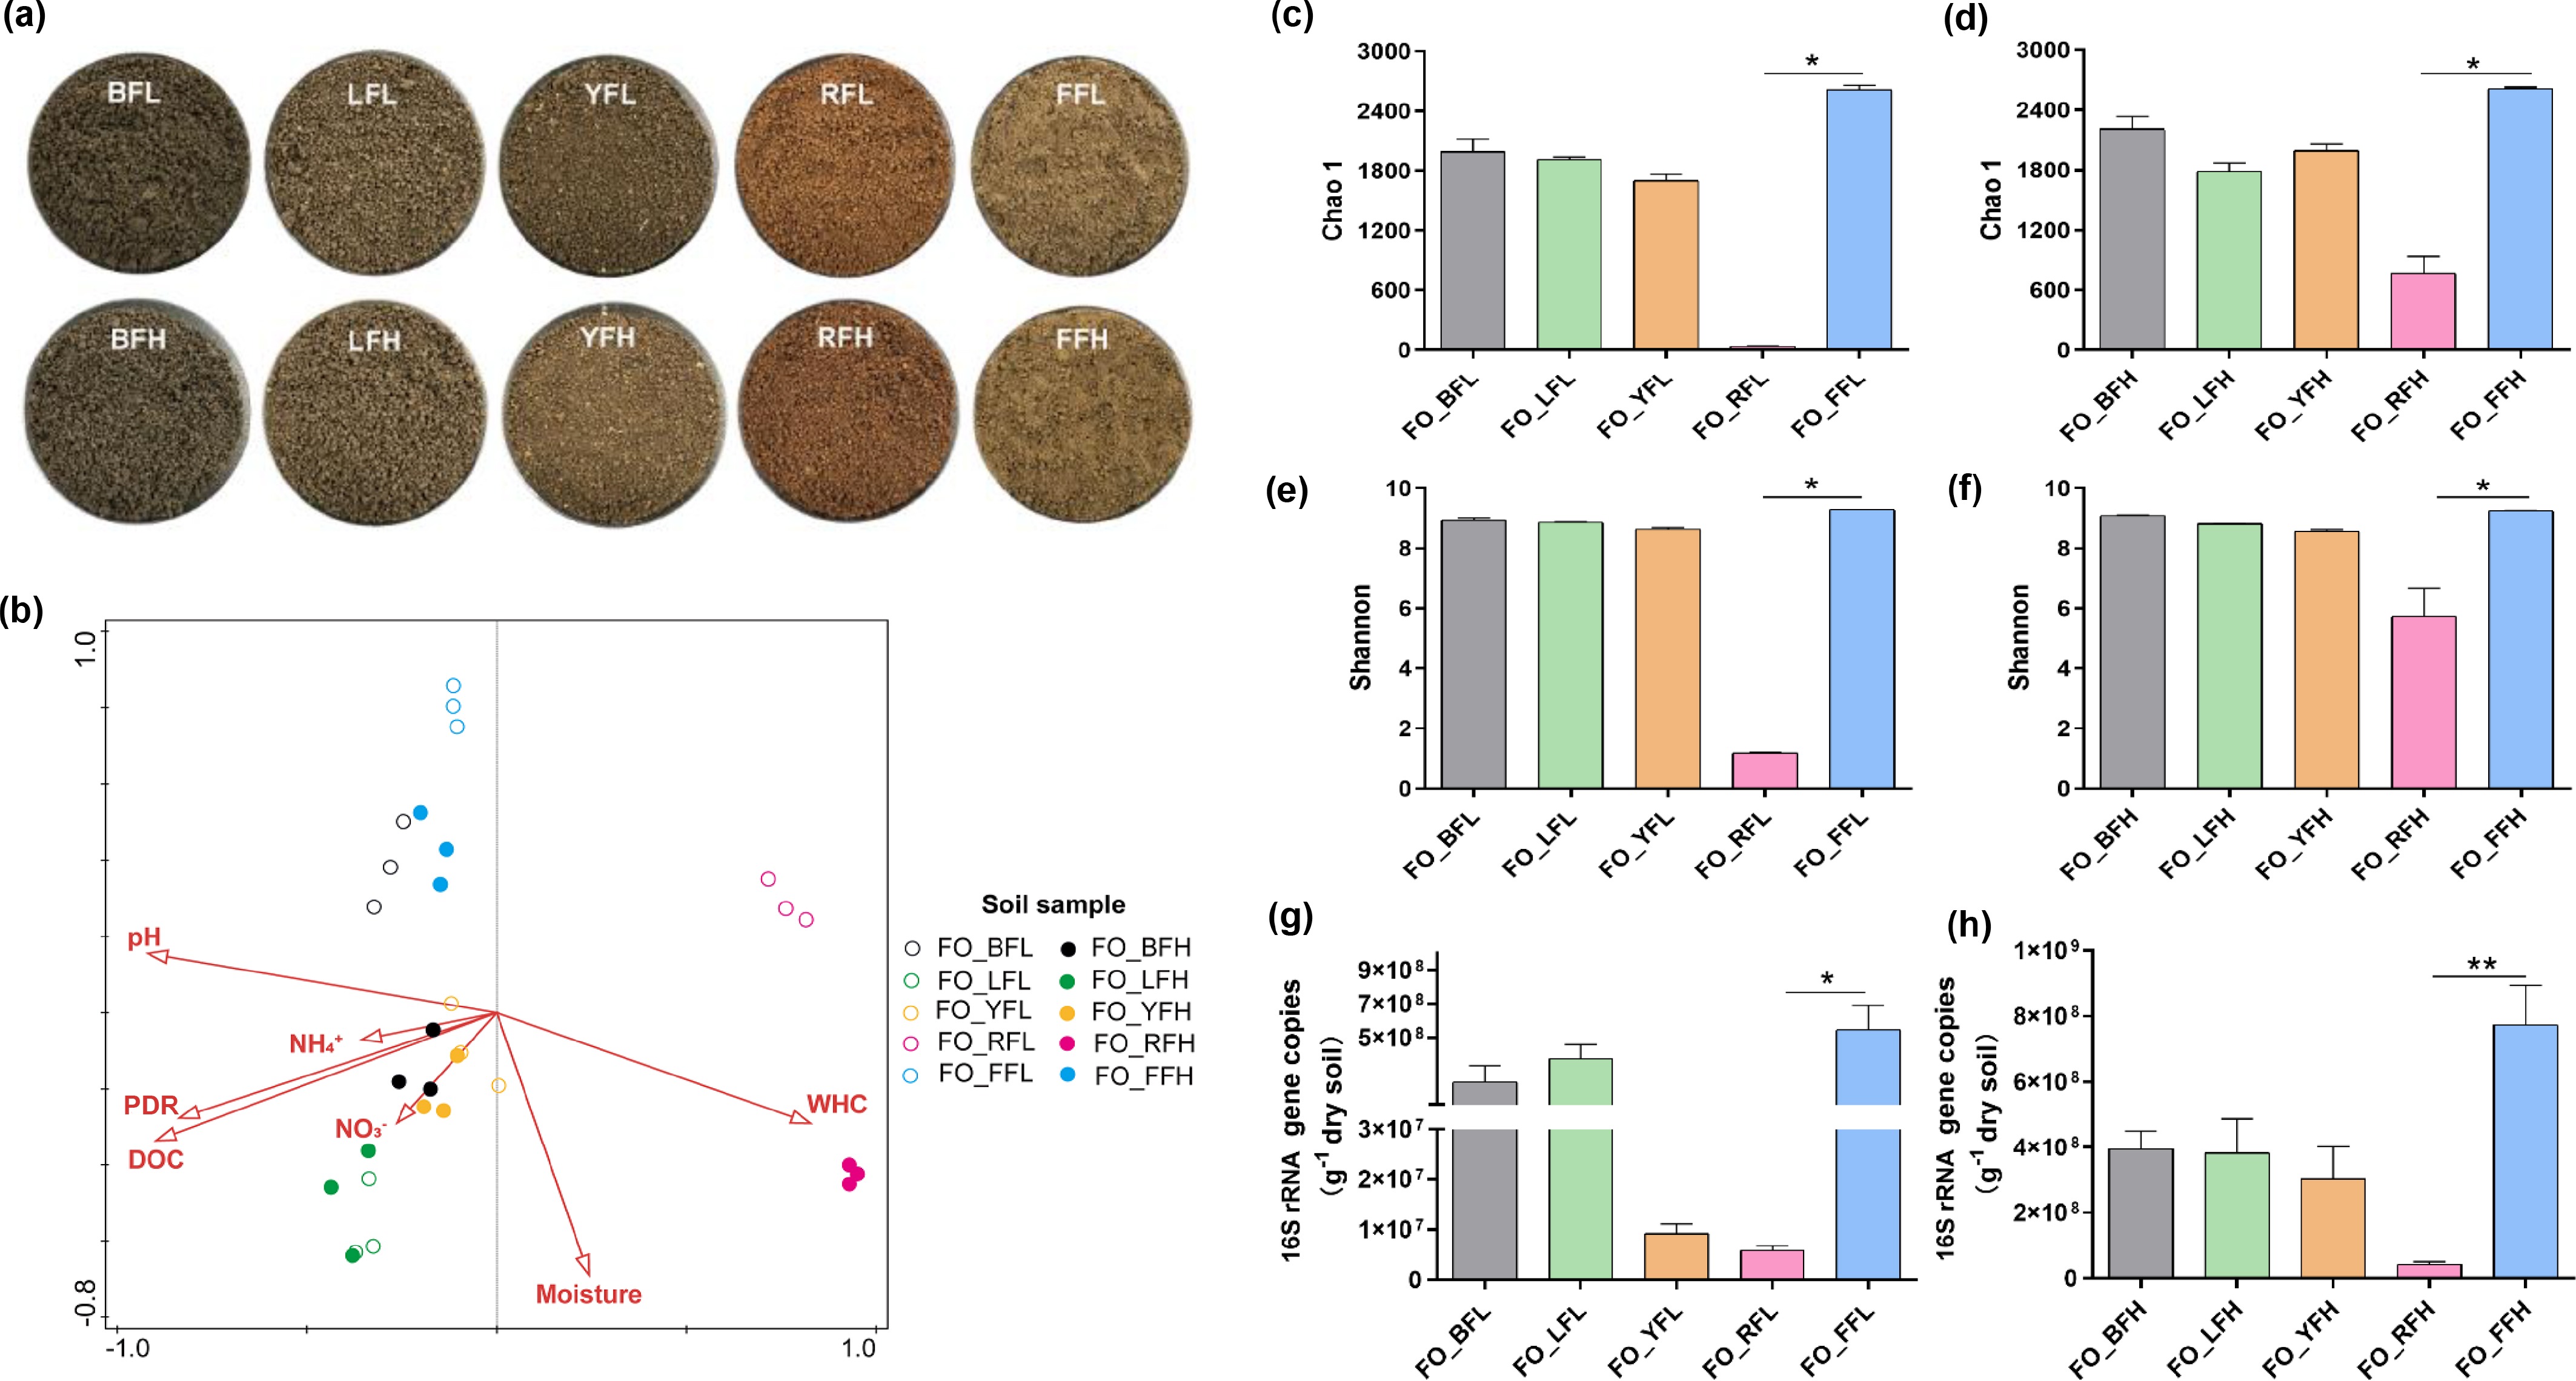
Figure 1.
Characterization of bacterial communities in five soils. (a) Physical appearance of the five soils after air-drying and sieving to 2 mm. (b) Relationships between environmental factors and bacterial community in the five soils of the FO group. (c)–(f) Alpha diversity indices of bacterial communities in the five soils of the FO group. (g), (h) qPCR quantification of total bacteria in the five soils of the FO group. * p < 0.05, ** p < 0.01.
-
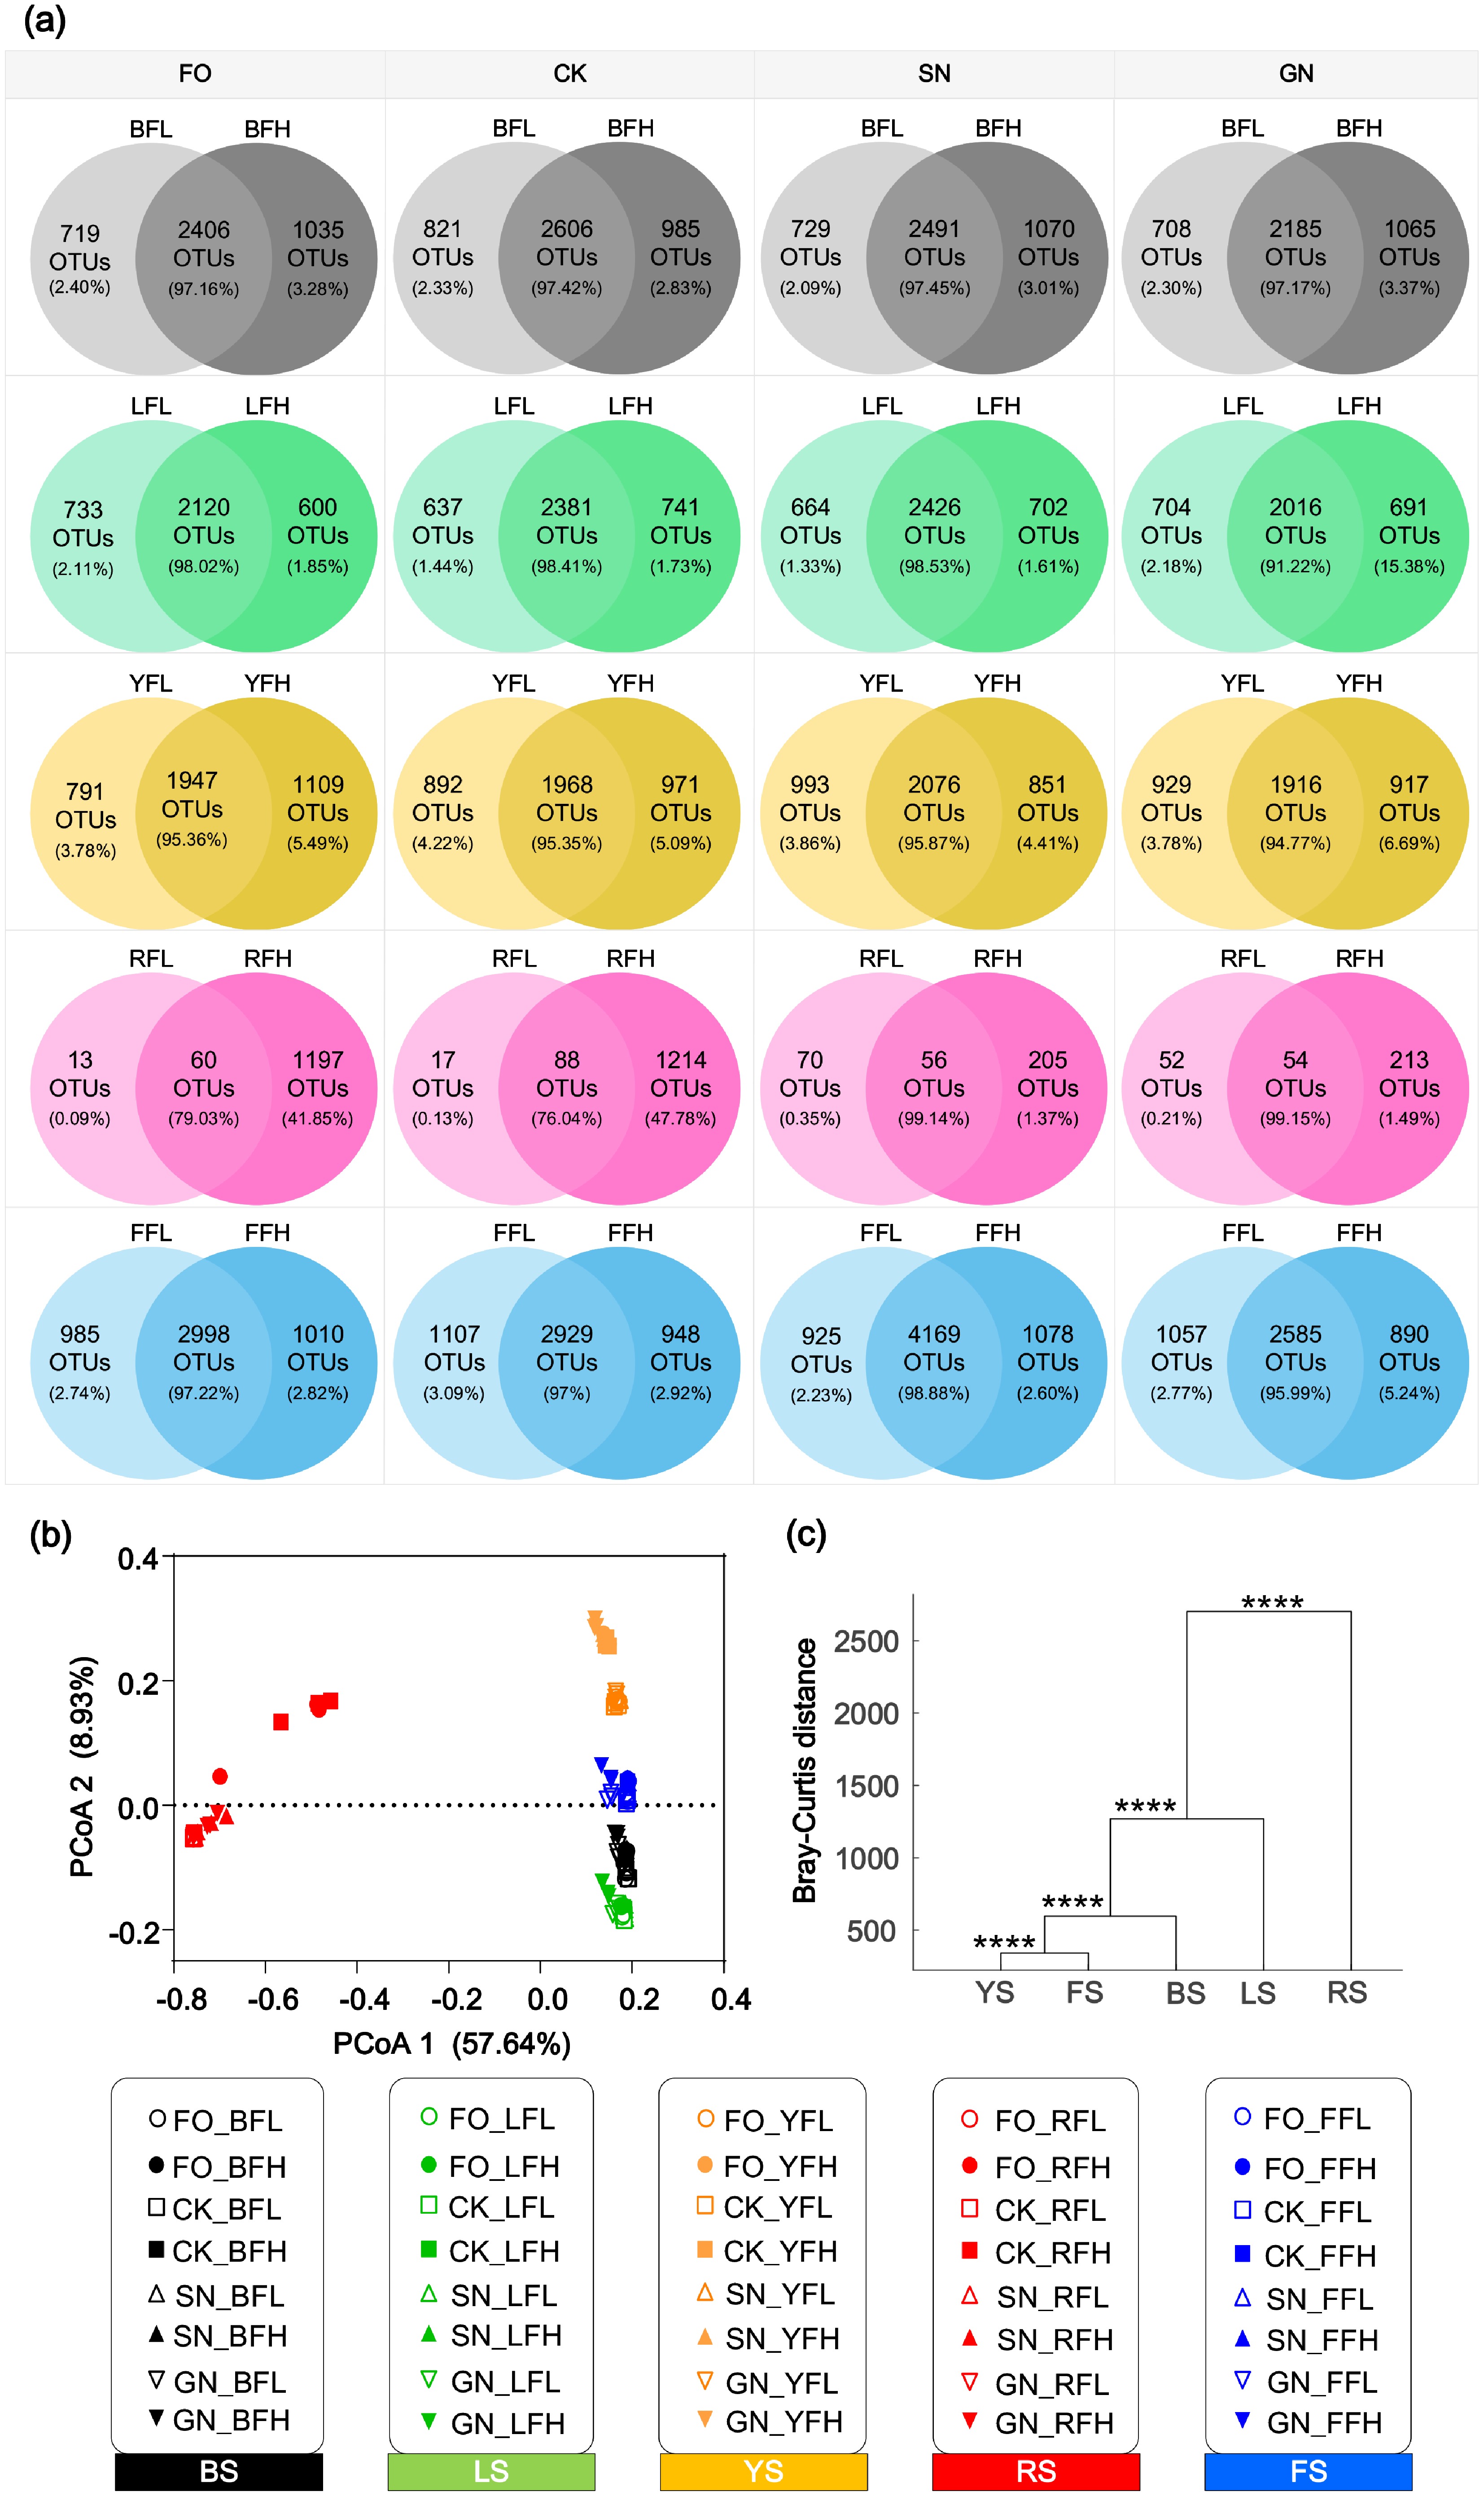
Figure 2.
Comparison of OTU composition and community structure of bacterial communities under different carbon and nitrogen addition treatments. (a) Venn diagram showing the number and relative abundance of shared and unique OTUs in each soil type under low- and high-fertilization treatments. (b) Bacterial community structure in five farmland soils under different carbon and nitrogen additions. (c) PCoA of bacterial communities in the five farmland soils based on Bray-Curtis distance. **** p < 0.0001 (MANOVA test).
-
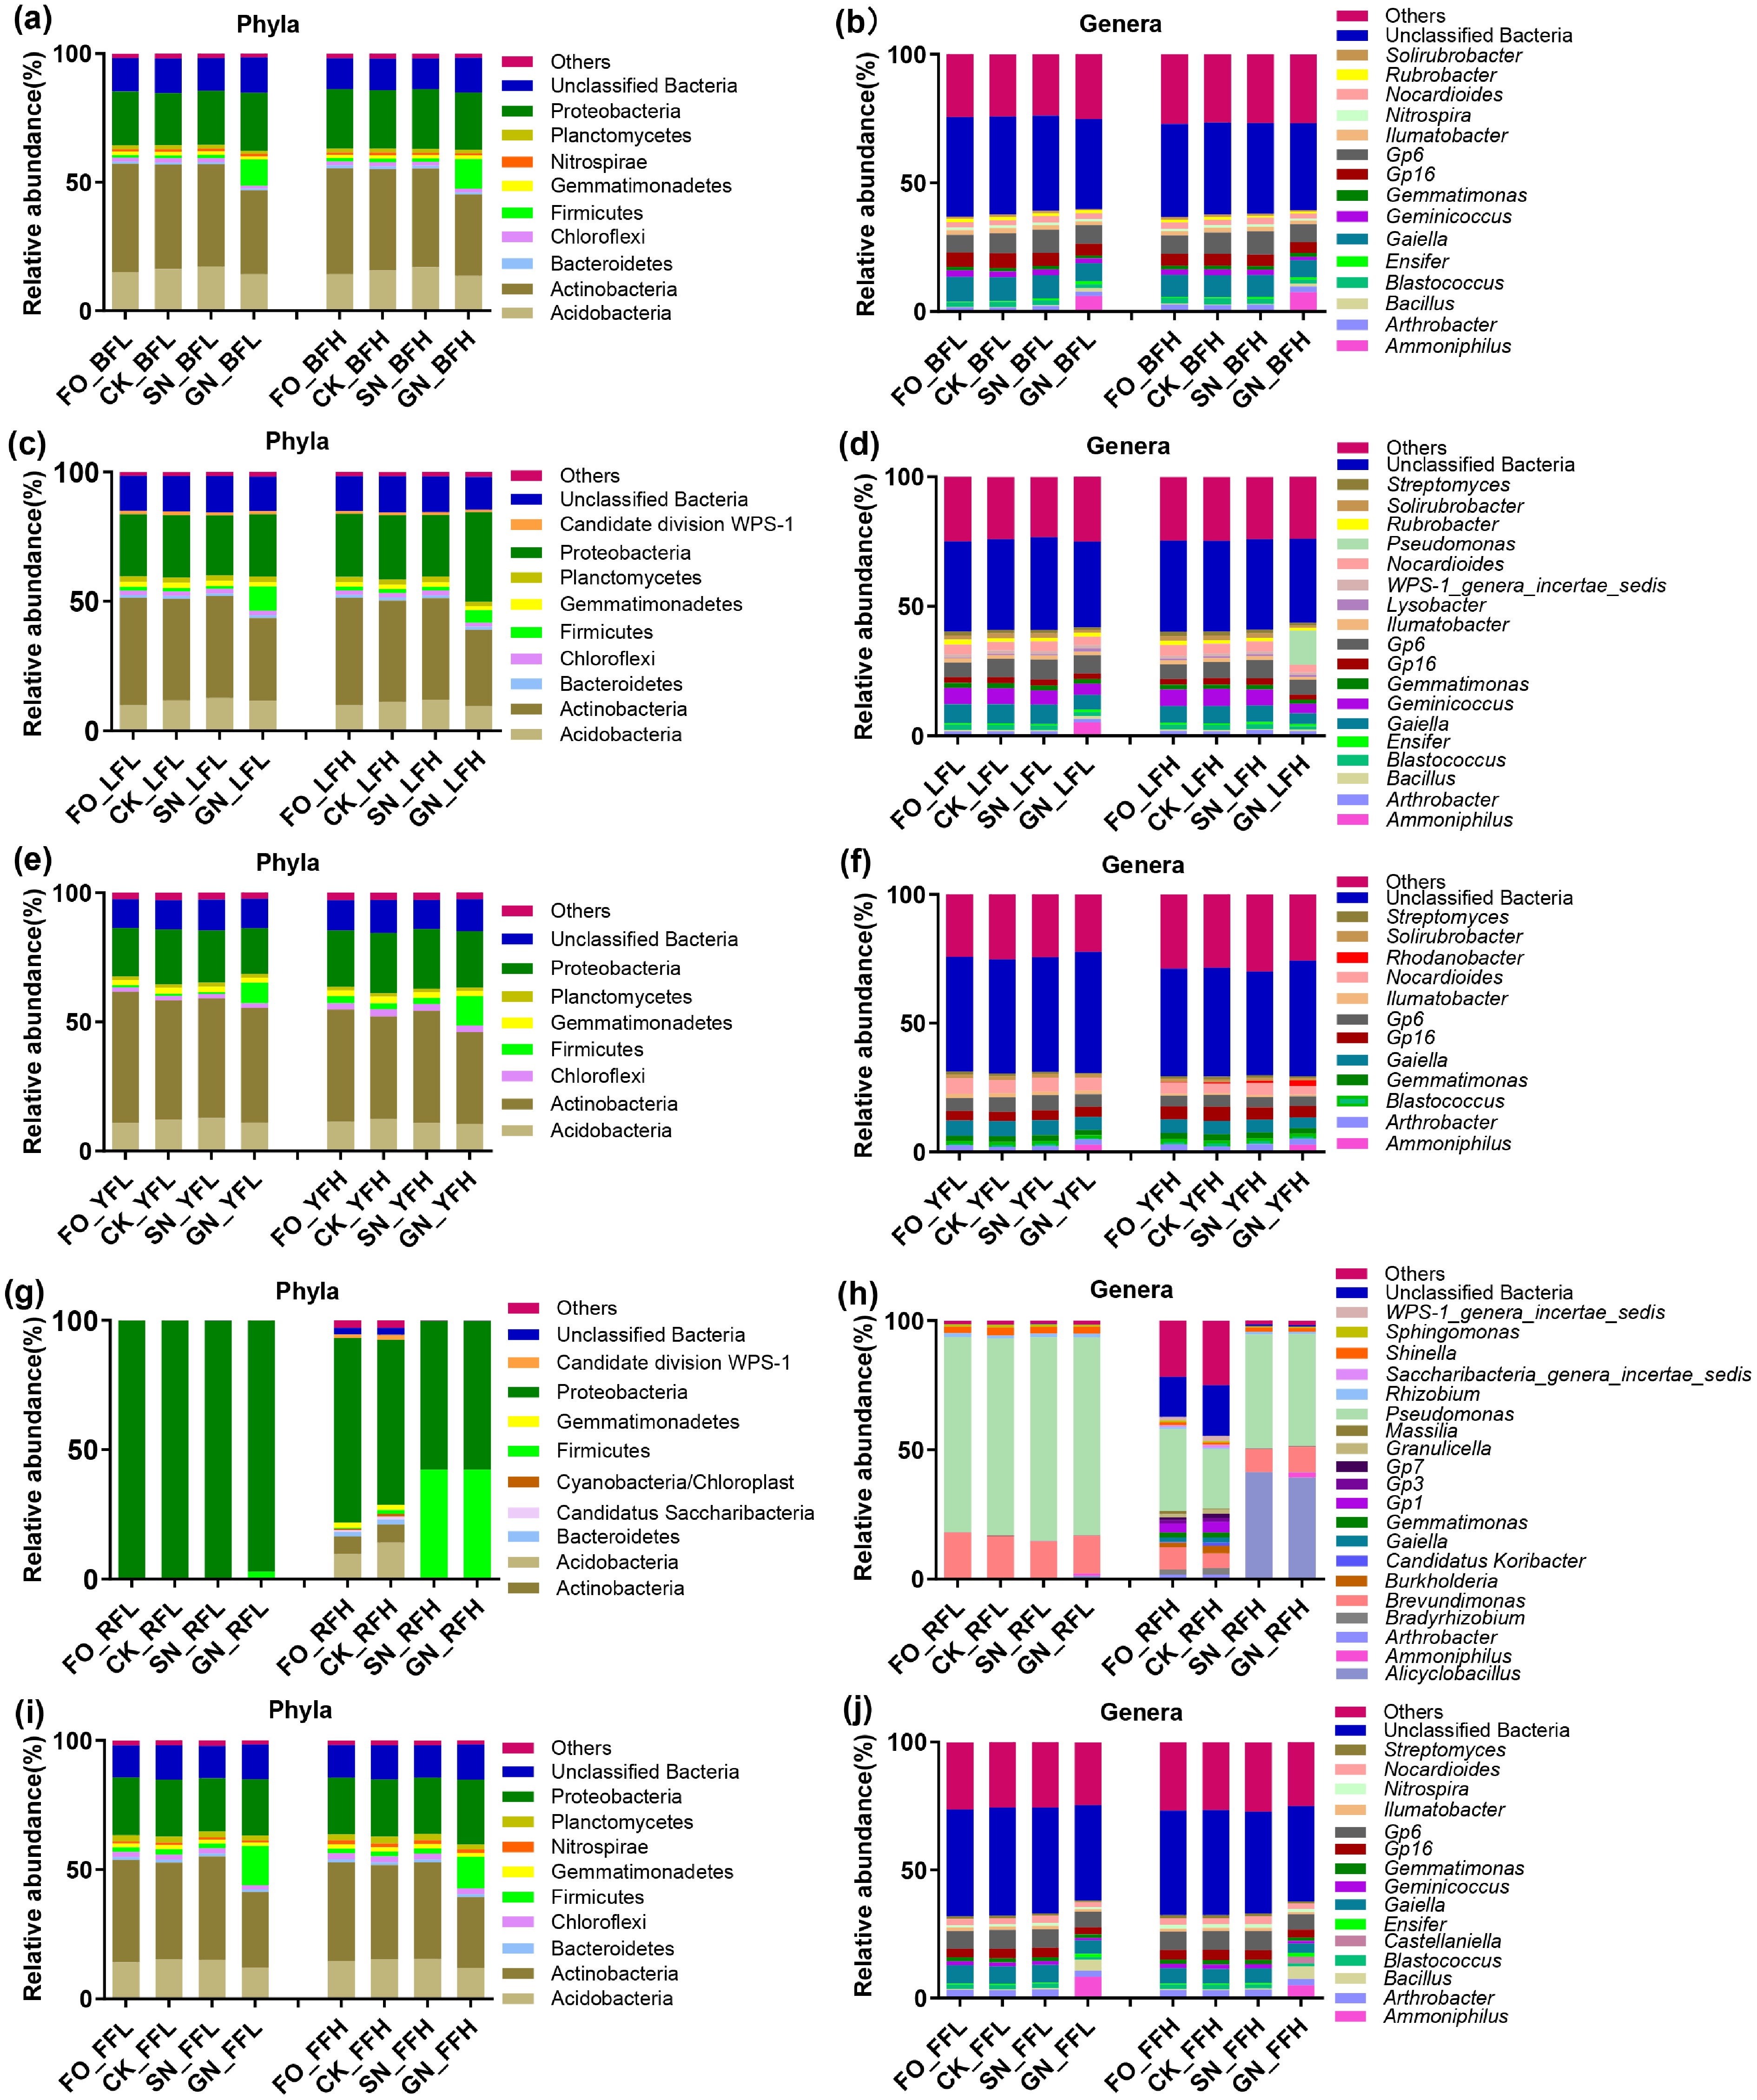
Figure 3.
Taxonomic profiles of the dominant microbial communities in five Chinese farmland soils. (a), (b) Black soil. (c), (d) Lime concretion black soil. (e), (f) Yellow-cinnamon soil. (g), (h) Red soil. (i), (j) Fluvo-aquic soil. Panels (a), (c), (e), (g), and (i) show phylum-level composition; panels (b), (d), (f), (h), and (j) show genus-level composition.
-
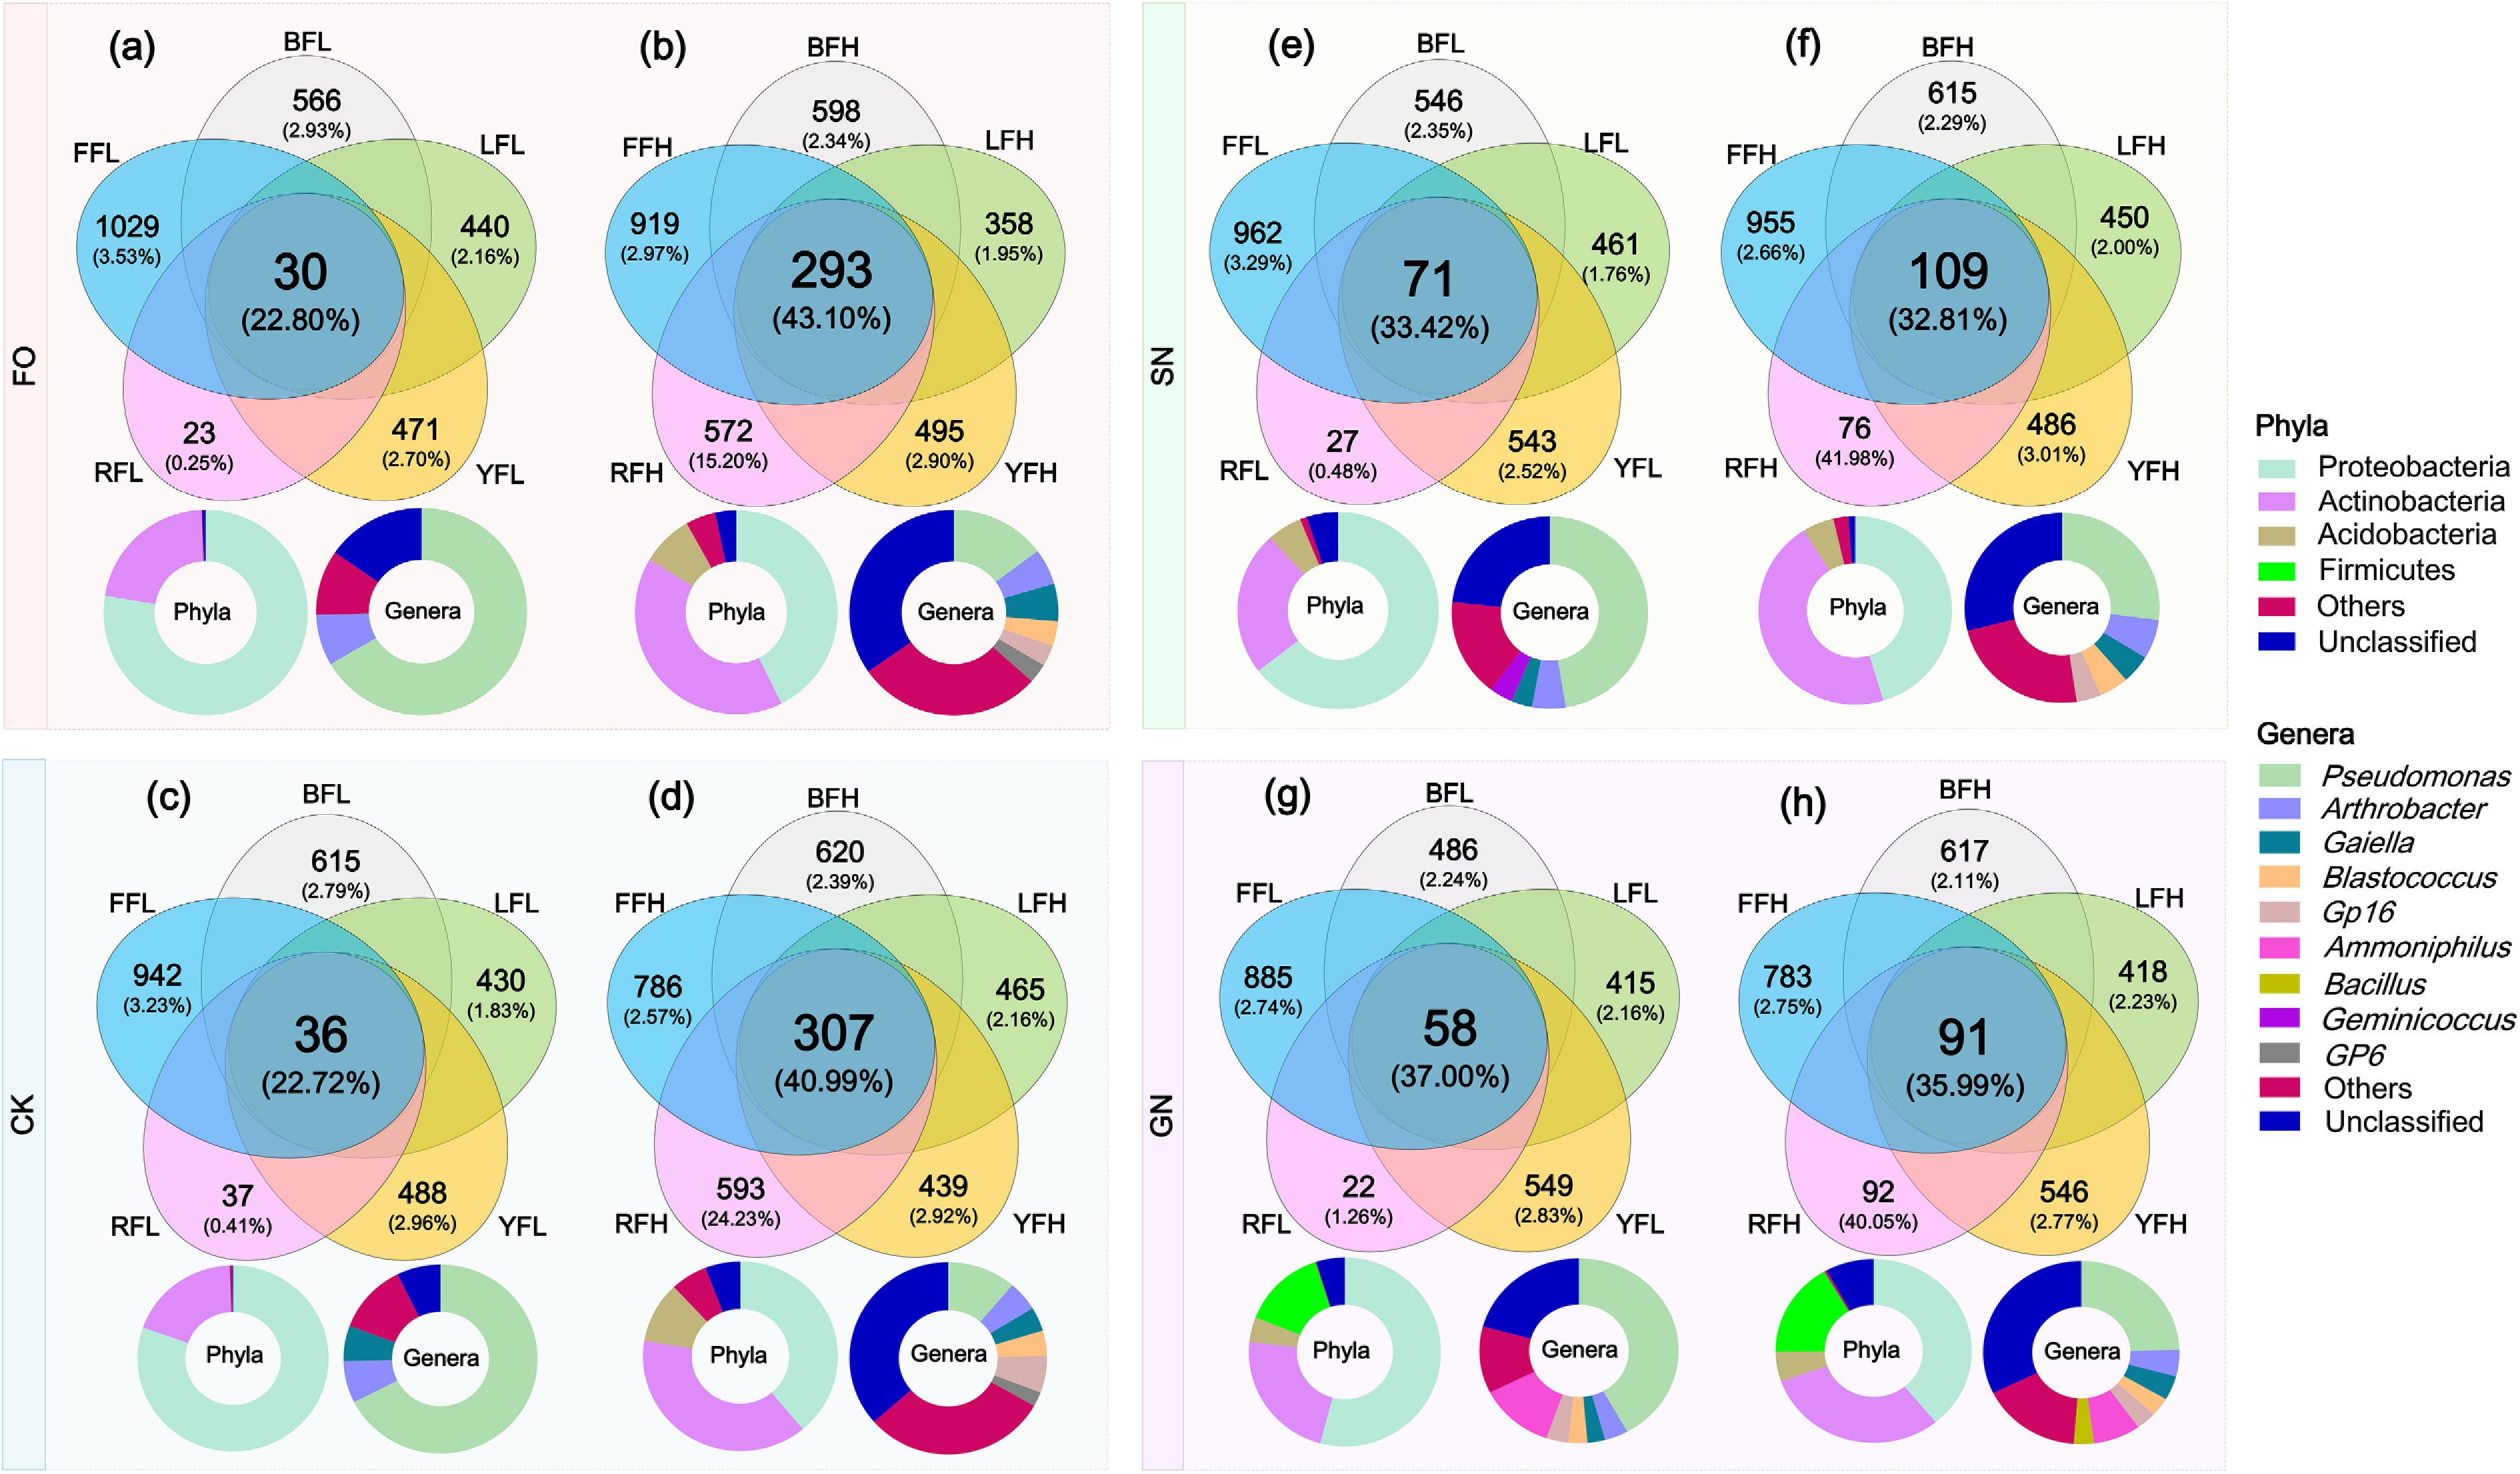
Figure 4.
Shared and unique OTUs in five farmland soils under different fertilization histories and treatments. Venn diagrams illustrating the counts and relative abundances of shared OTUs (common to all five soils) and unique OTUs (specific to each soil), along with the taxonomic classification of dominant taxa among the shared OTUs. (a), (b) FO treatment. (c), (d) CK treatment. (e), (f) SN treatment. (g), (h) GN treatment. Within each pair of panels, the left panels (a), (c), (e), (g) represent soils with low fertilization history, and the right panels (b), (d), (f), (h) represent soils with high fertilization history.
-
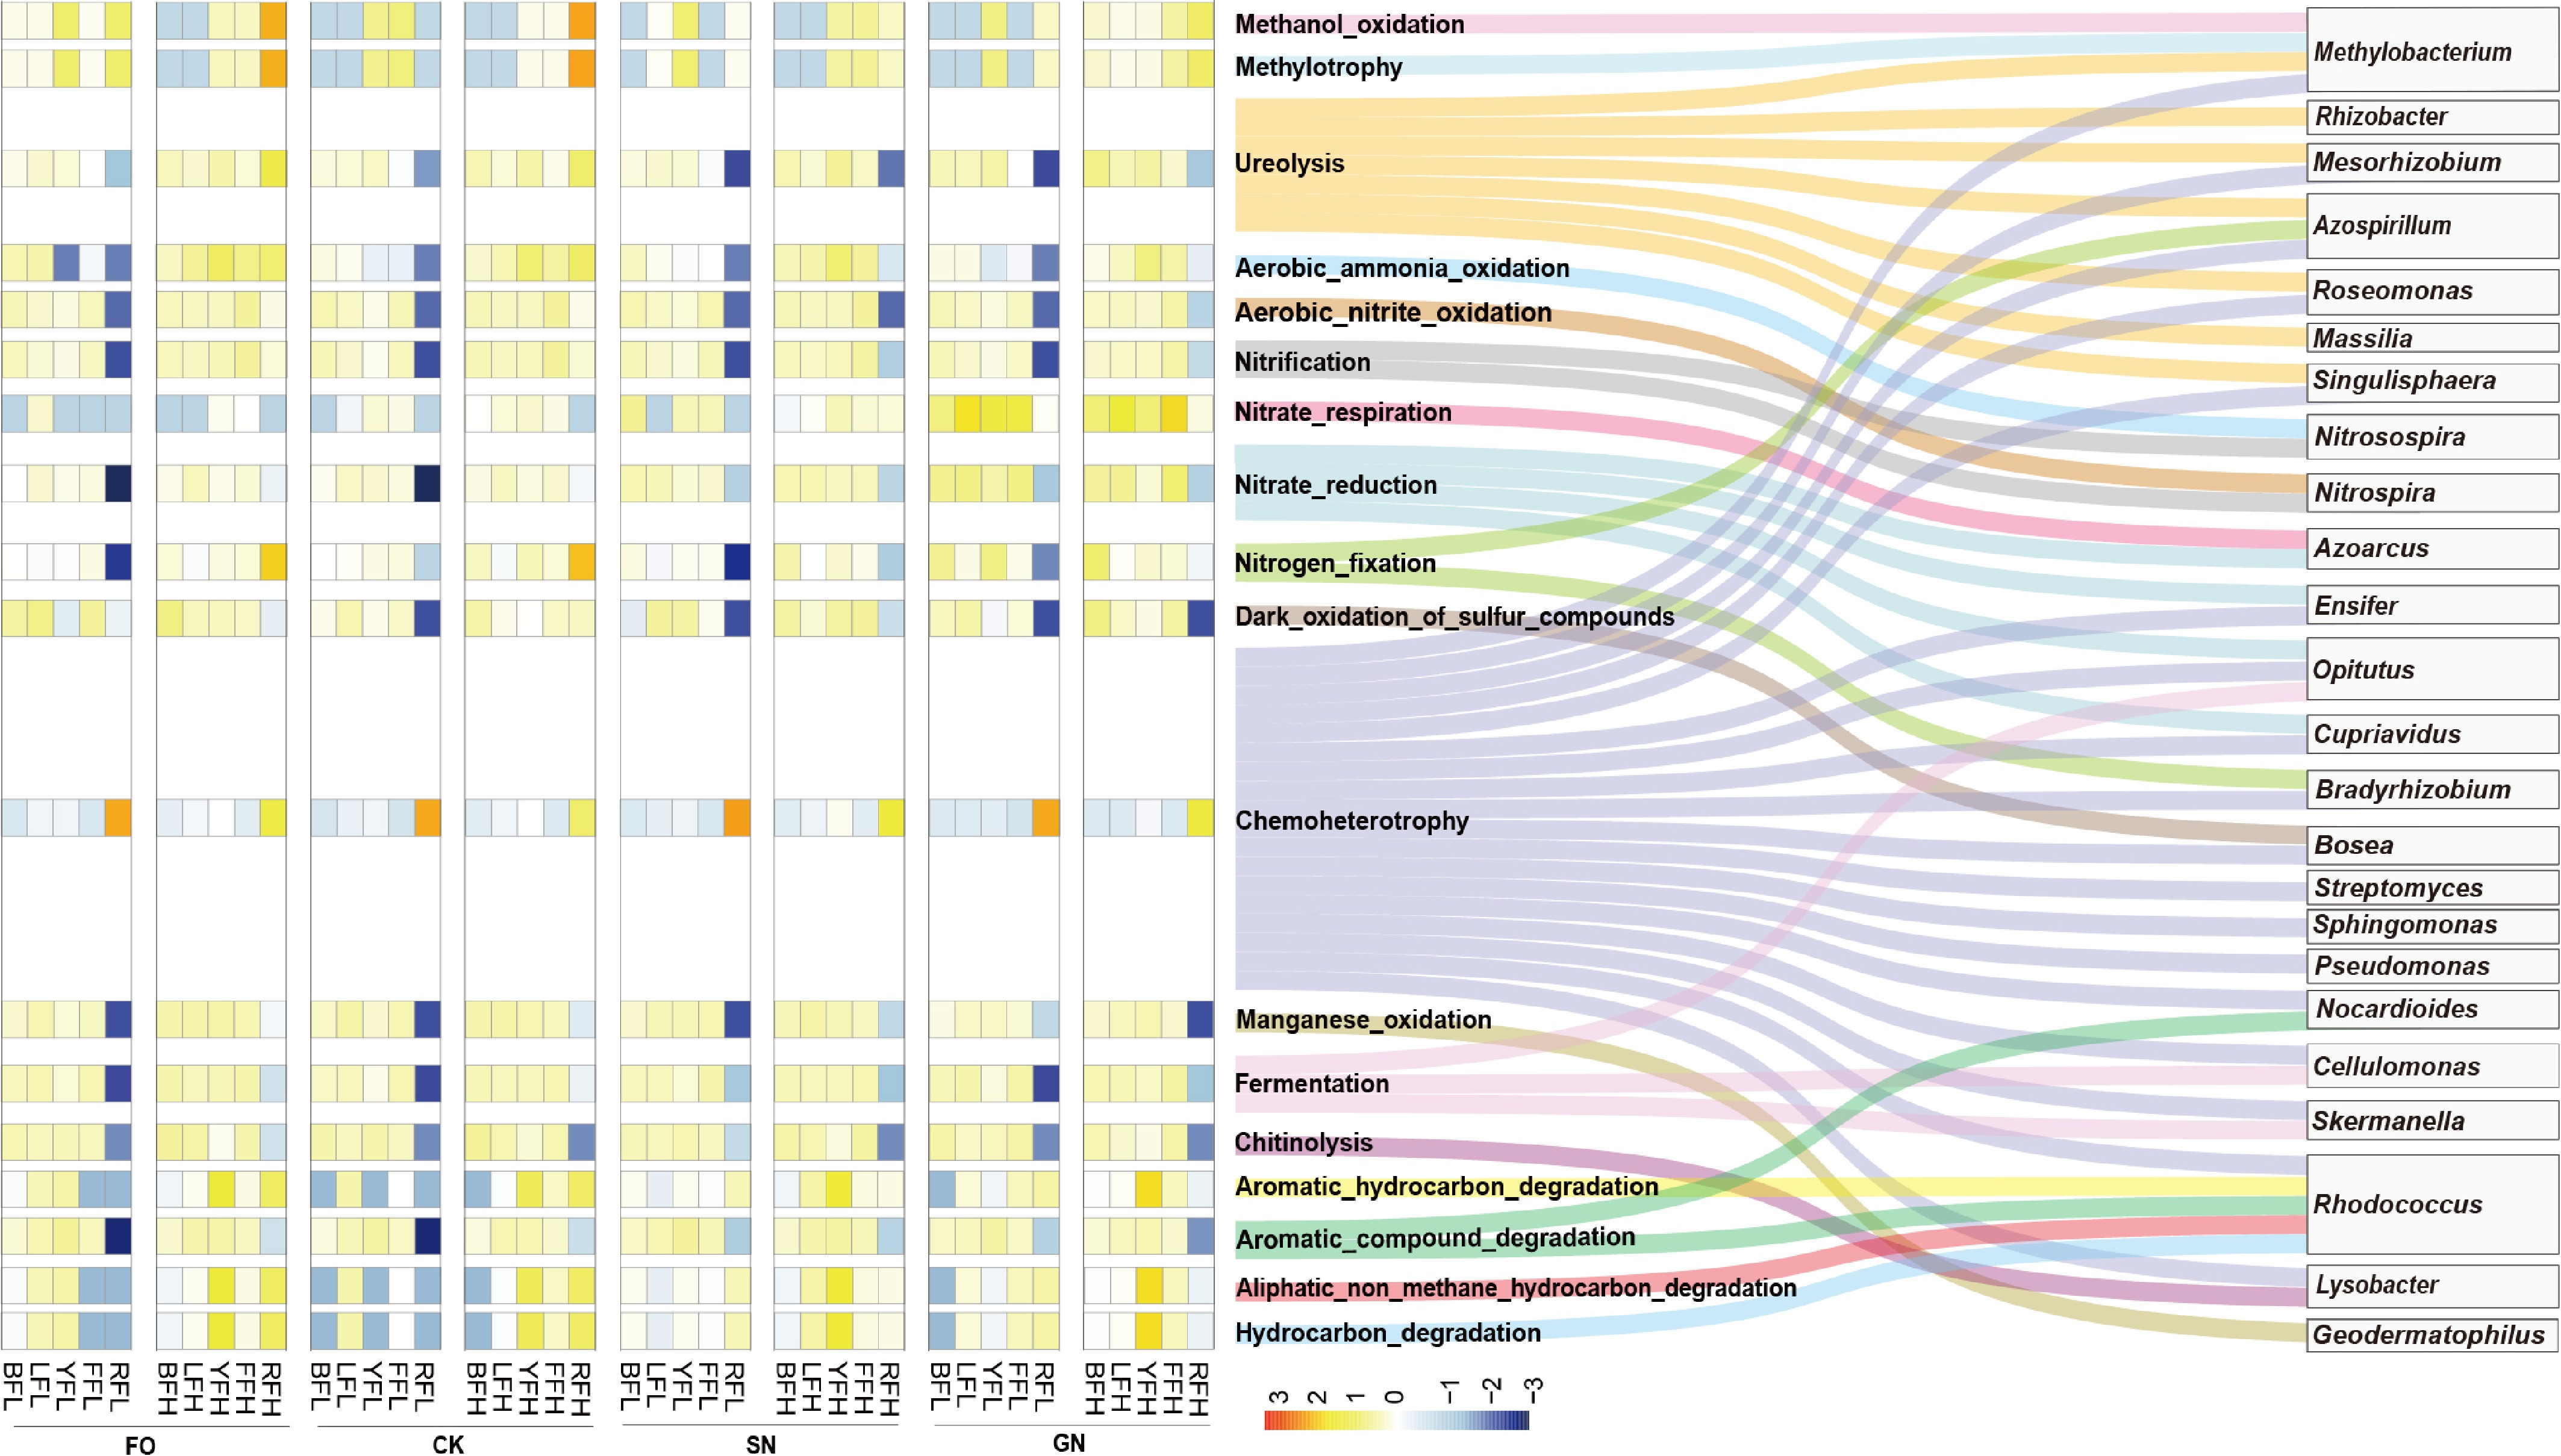
Figure 5.
Functional potential of the core microbial community in five farmland soils under different treatments.
-
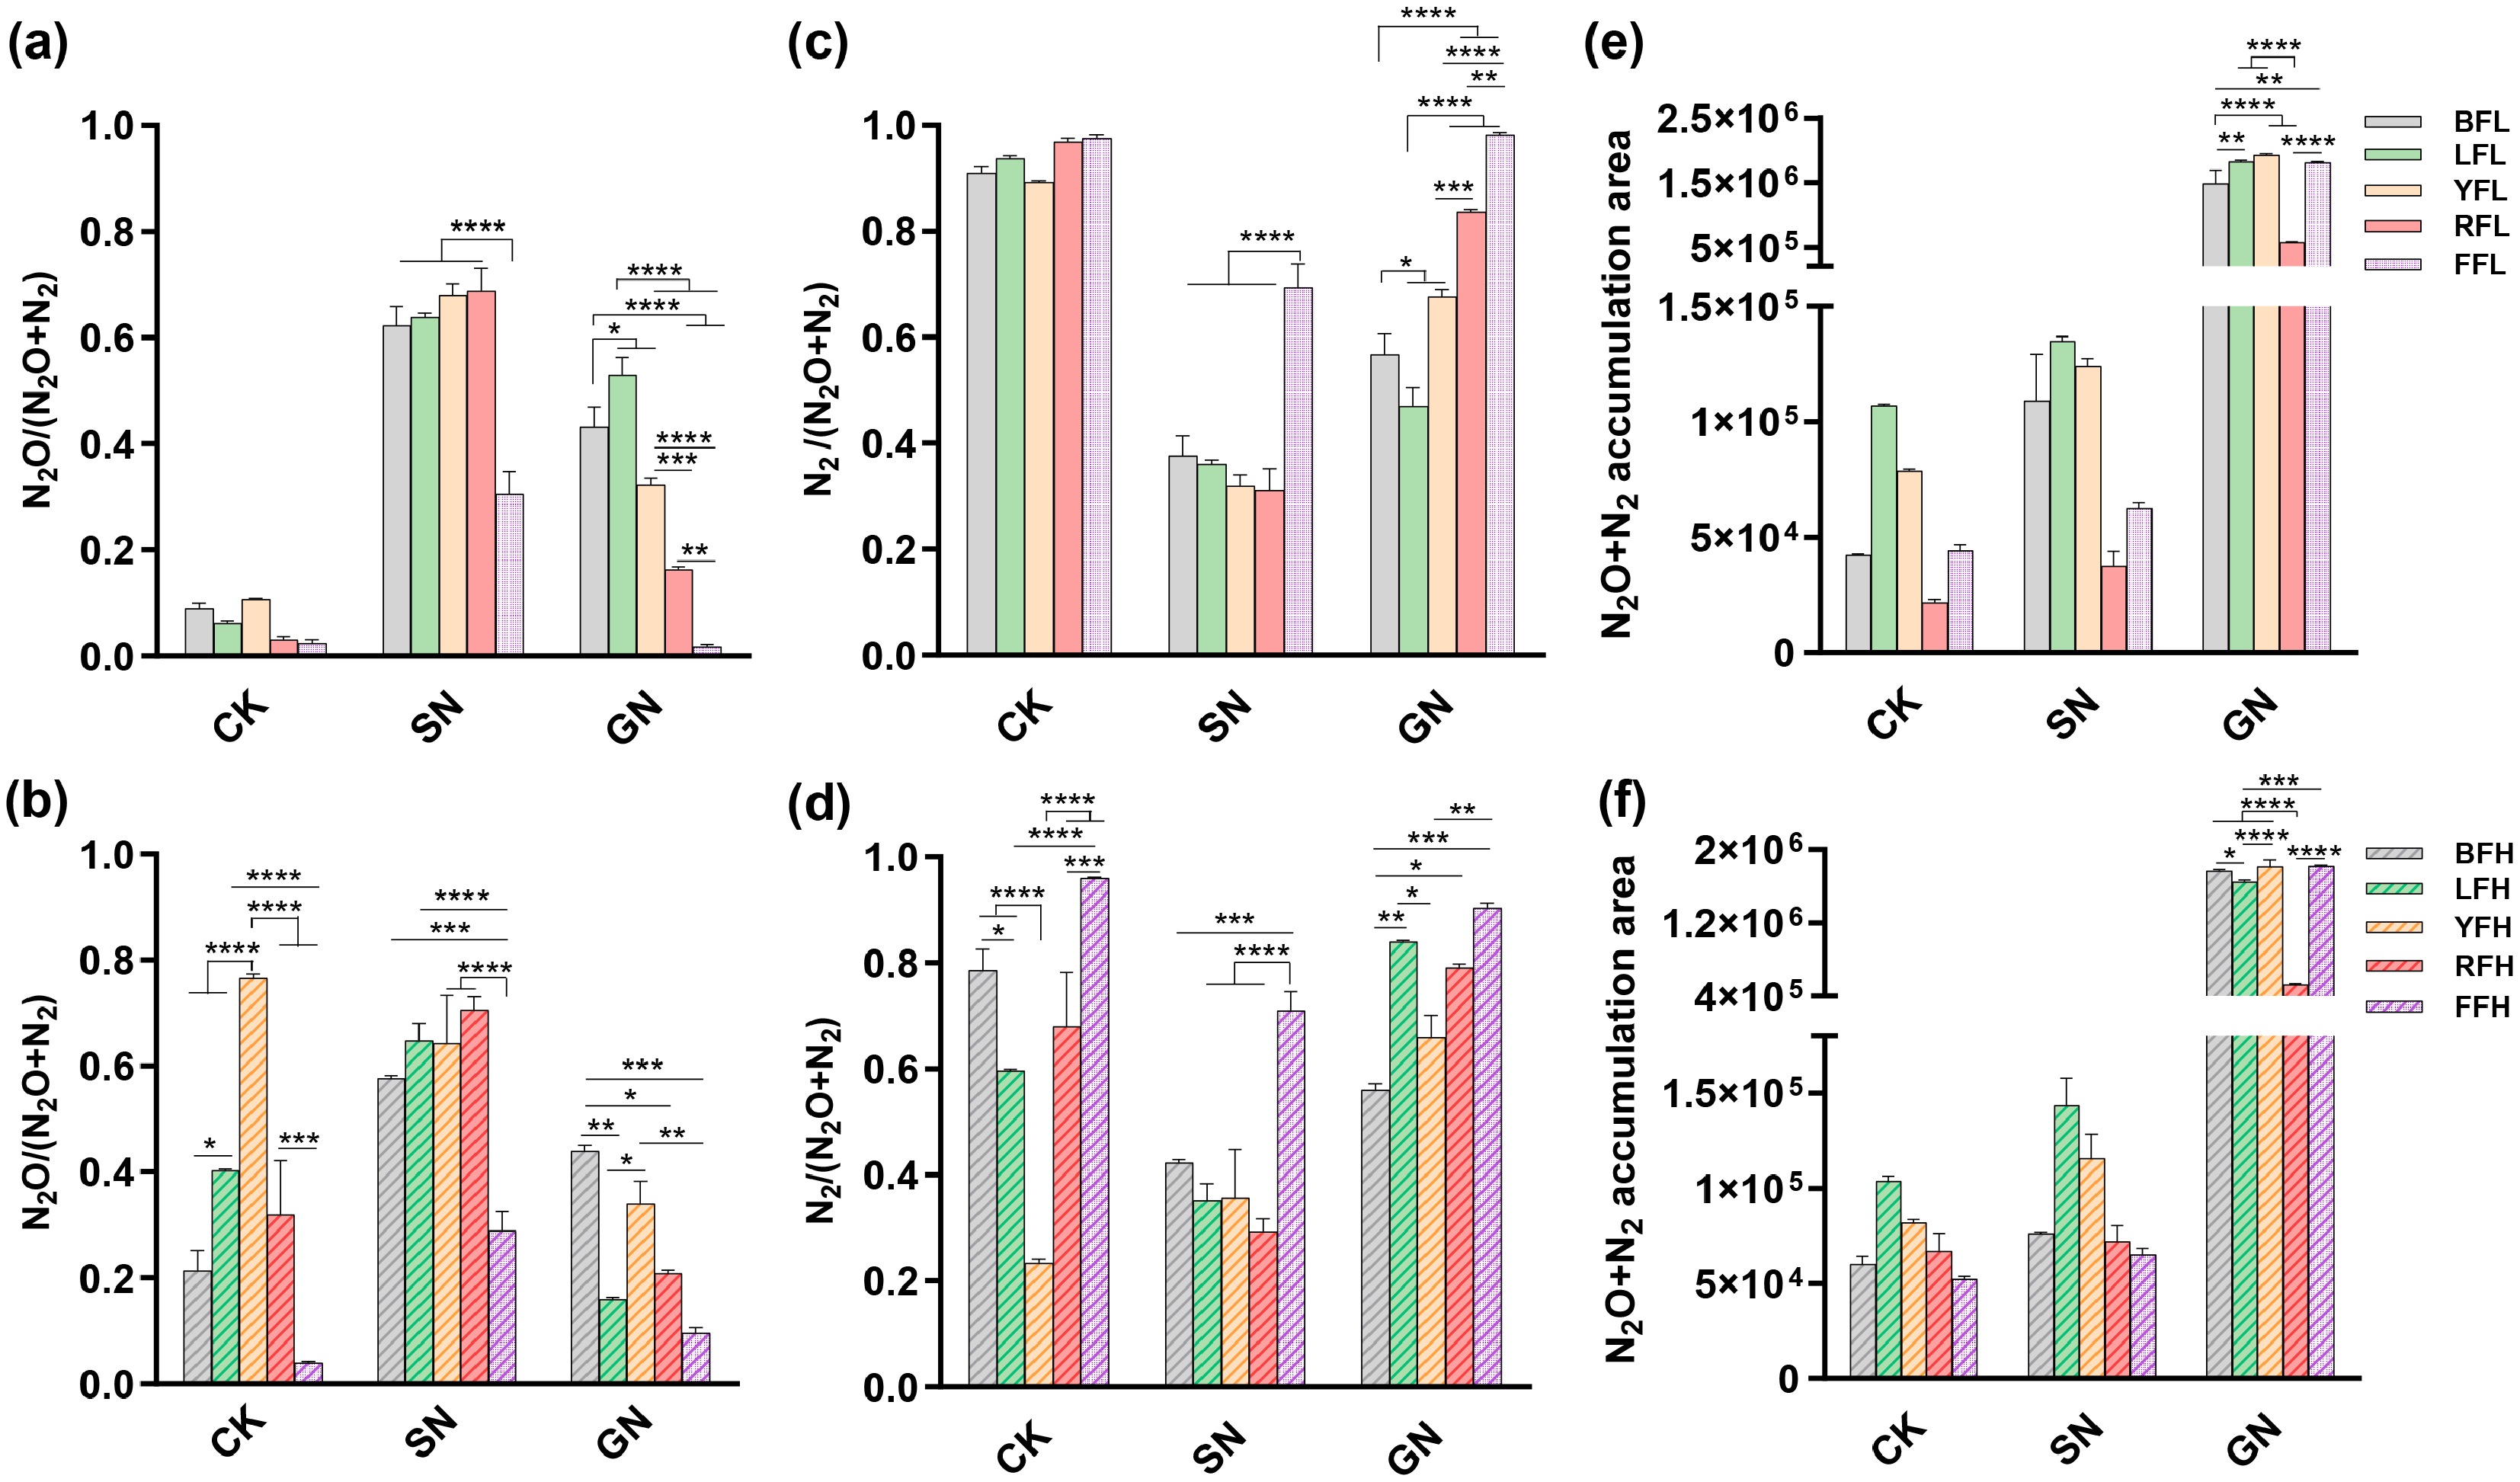
Figure 6.
Effects of carbon and nitrogen additions on denitrifying nitrogen metabolism in five farmland soils. (a), (b) N2O index, (c), (d) N2 index, and (e), (f) cumulative N2O and N2 fluxes in five farmland soils under (a), (c), (e) low, and (b), (d), (f) high fertilization levels across different treatments. * p < 0.05, ** p < 0.01, *** p < 0.001, **** p < 0.0001.
-
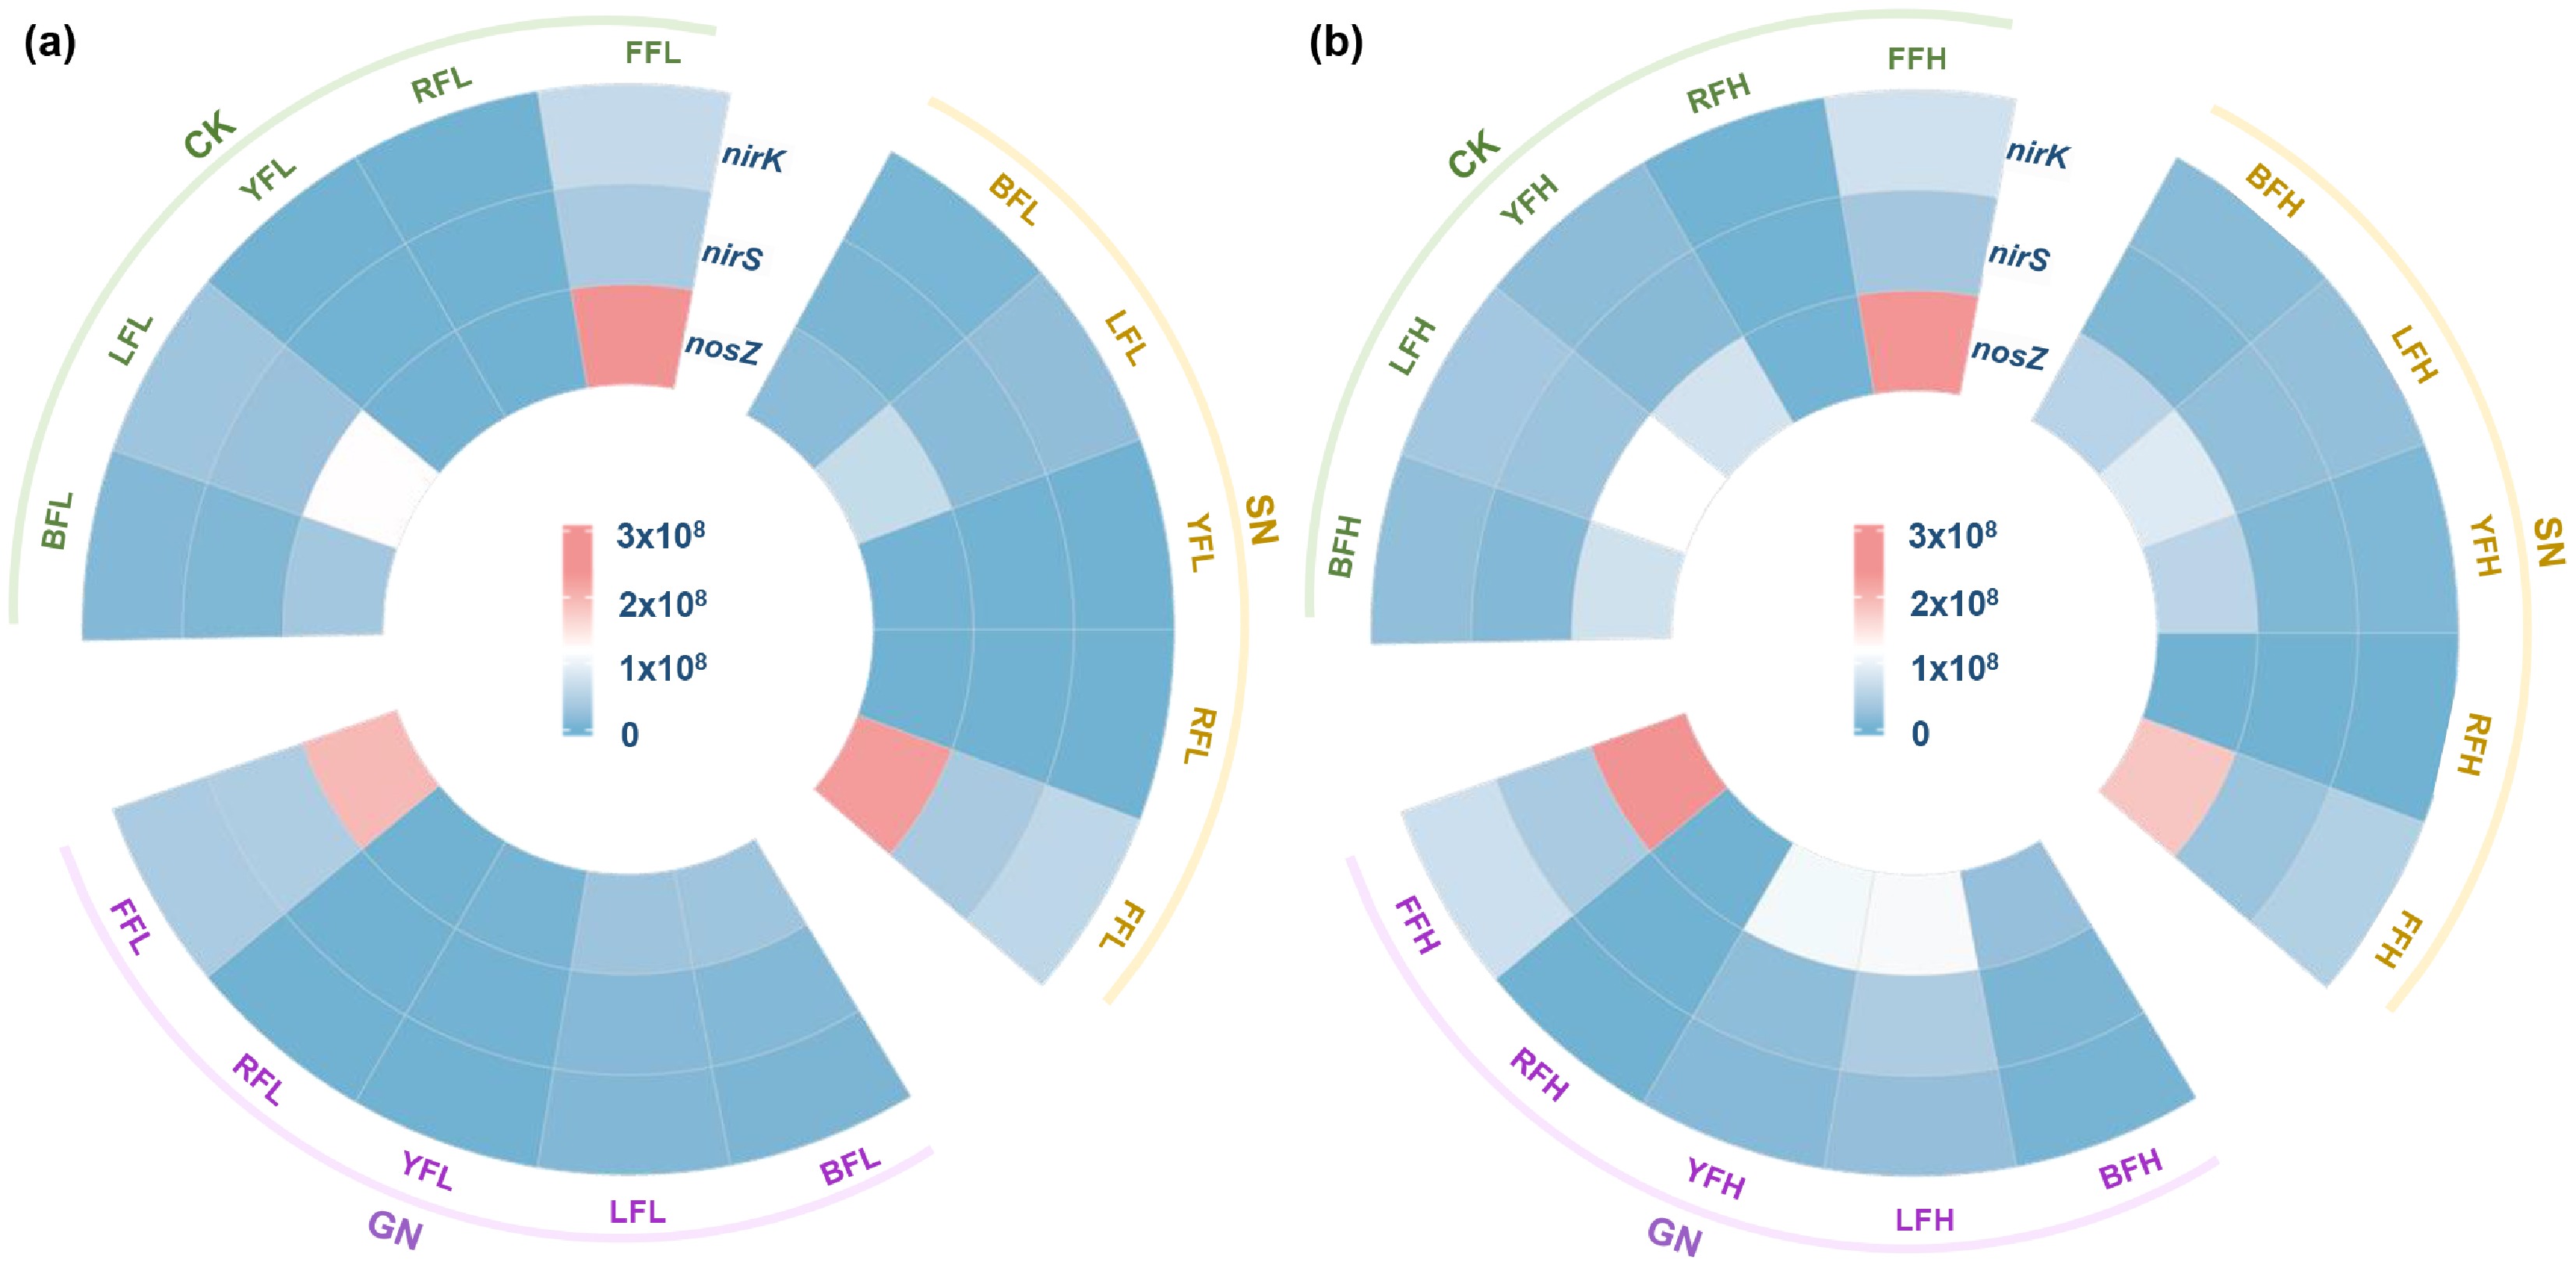
Figure 7.
Abundance of denitrifying genes in five farmland soils under different carbon and nitrogen additions. Gene copy numbers of nirK, nirS, and nosZ under (a) low, and (b) high fertilization levels across treatments.
Figures
(7)
Tables
(0)