-
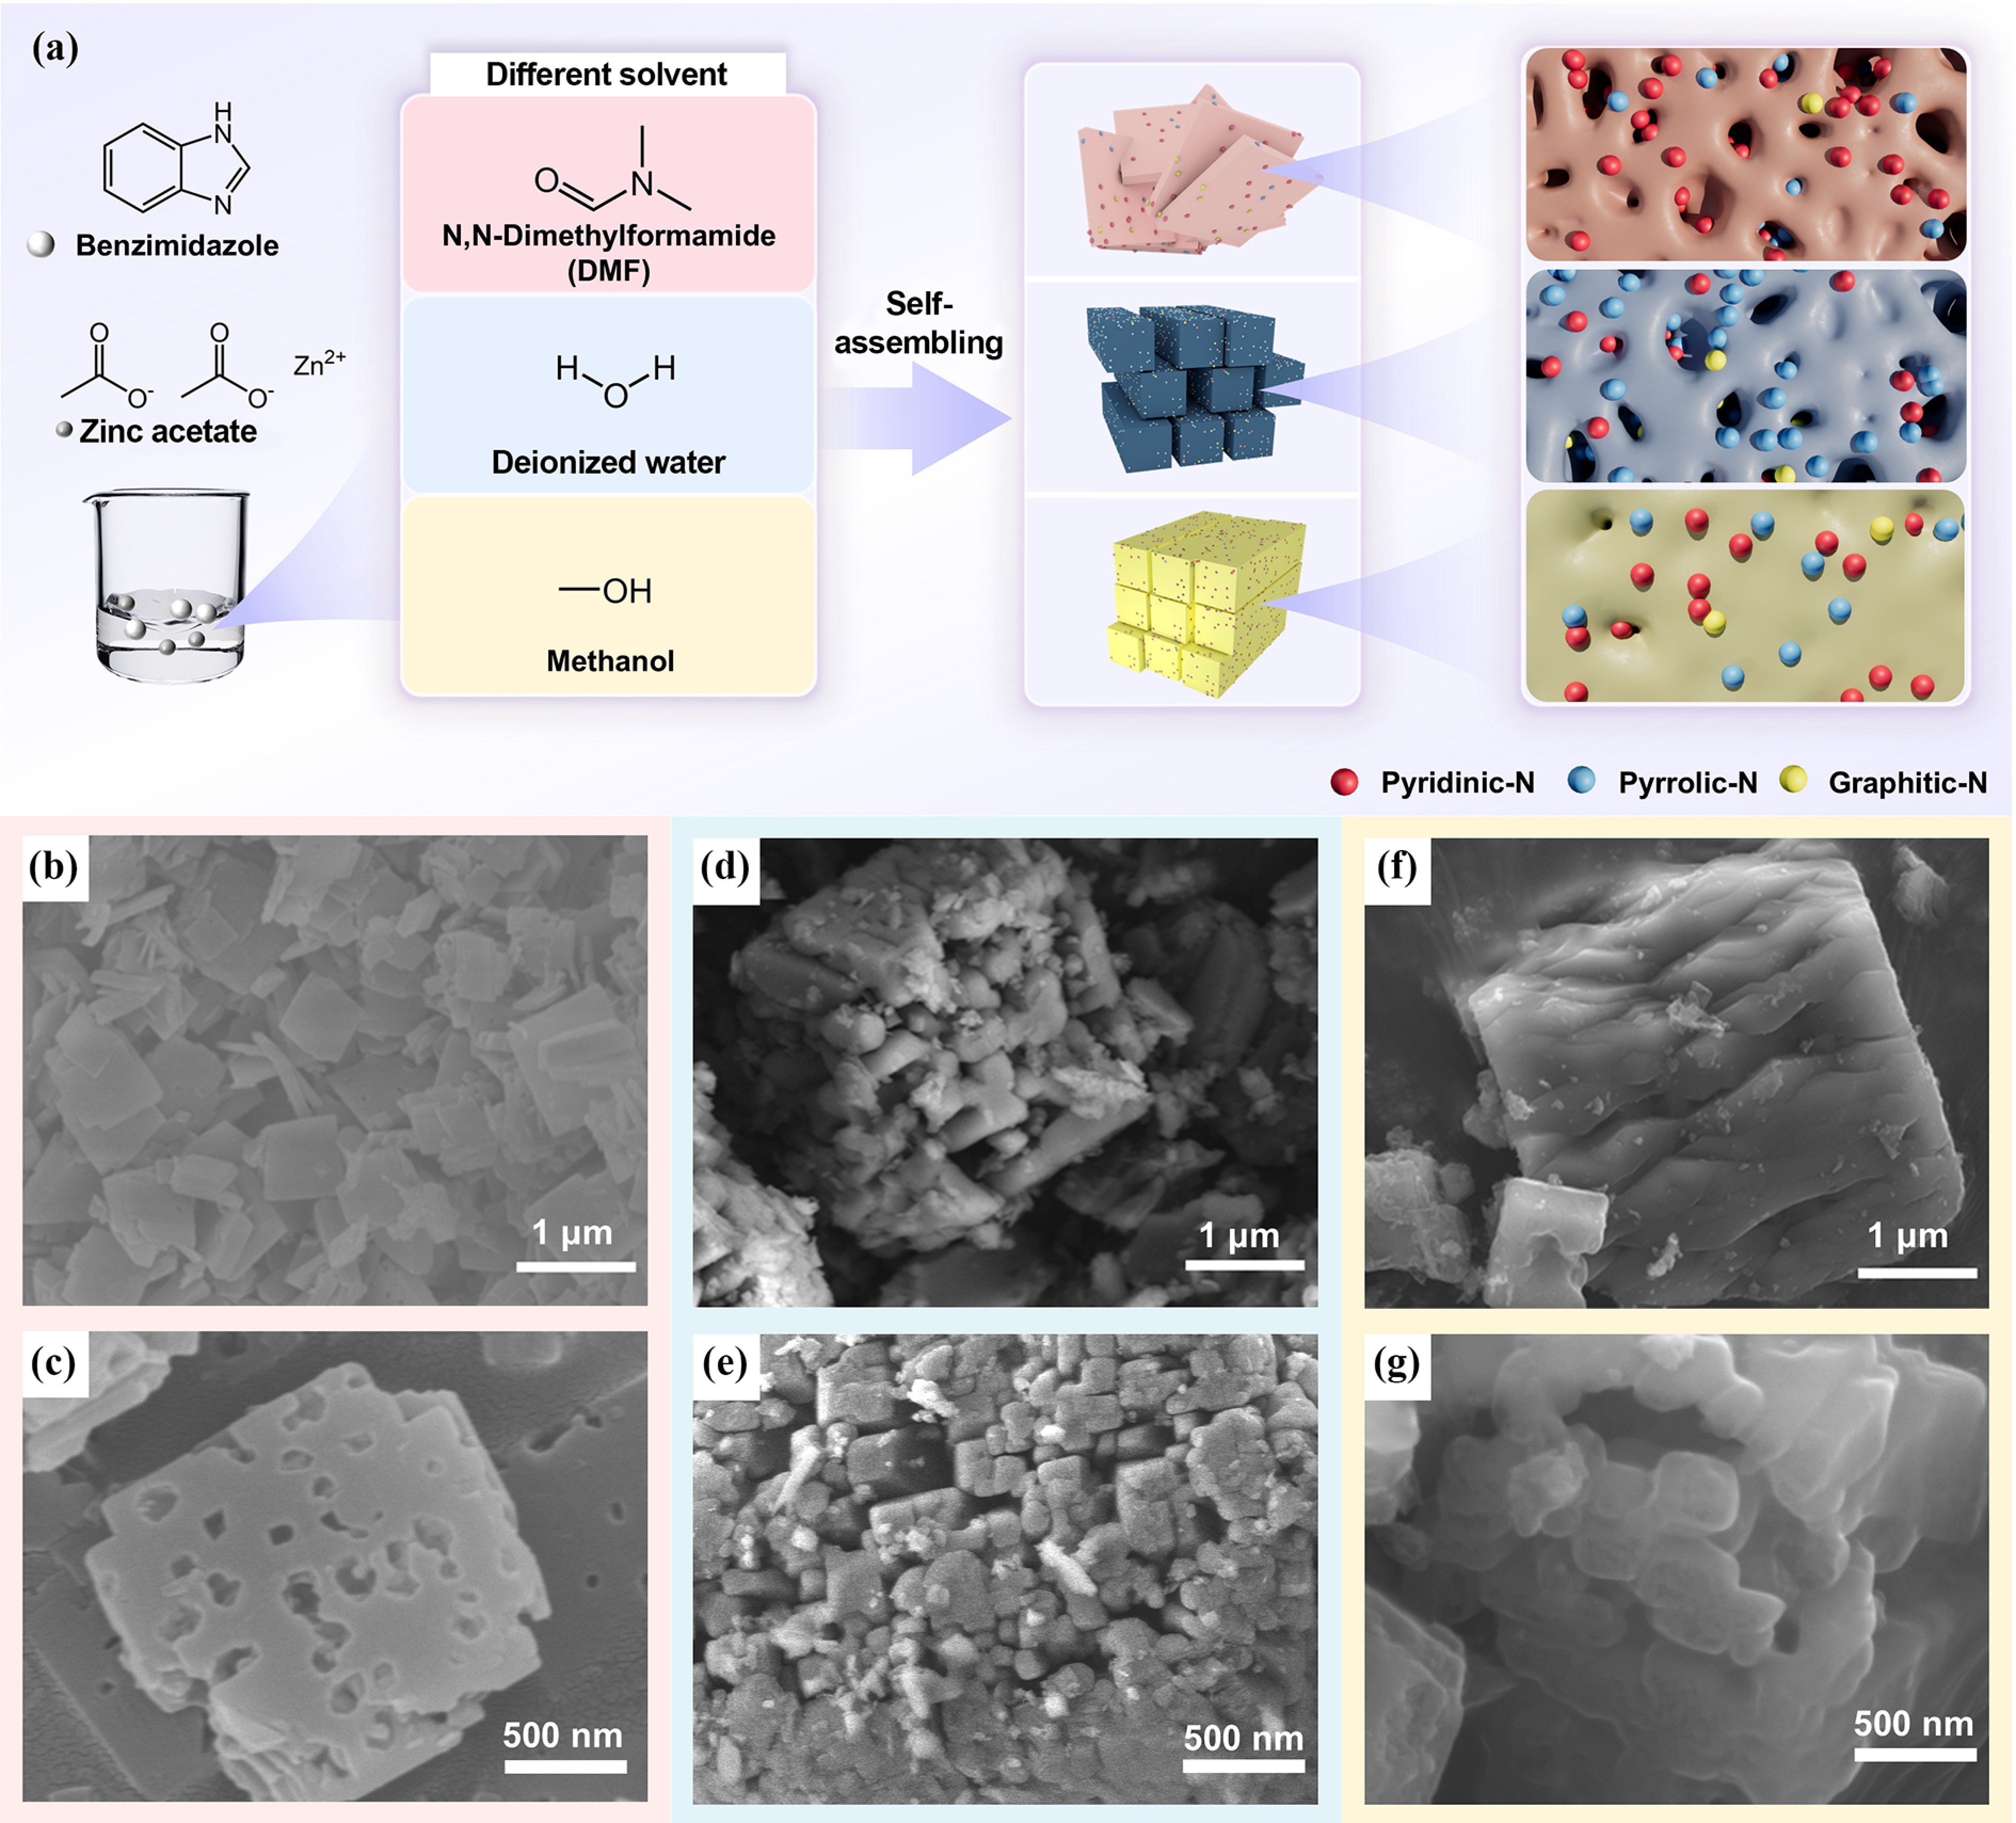
Figure 1.
(a) Schematic diagram of the preparation process for ZDC, ZWC, and ZMC, in which the corresponding precursors were synthesized using N,N-Dimethylformamide (DMF), deionized water, and methanol as solvents, respectively. SEM images of (b), (c) ZDC, (d), (e) ZWC, and (f), (g) ZMC at different magnifications.
-
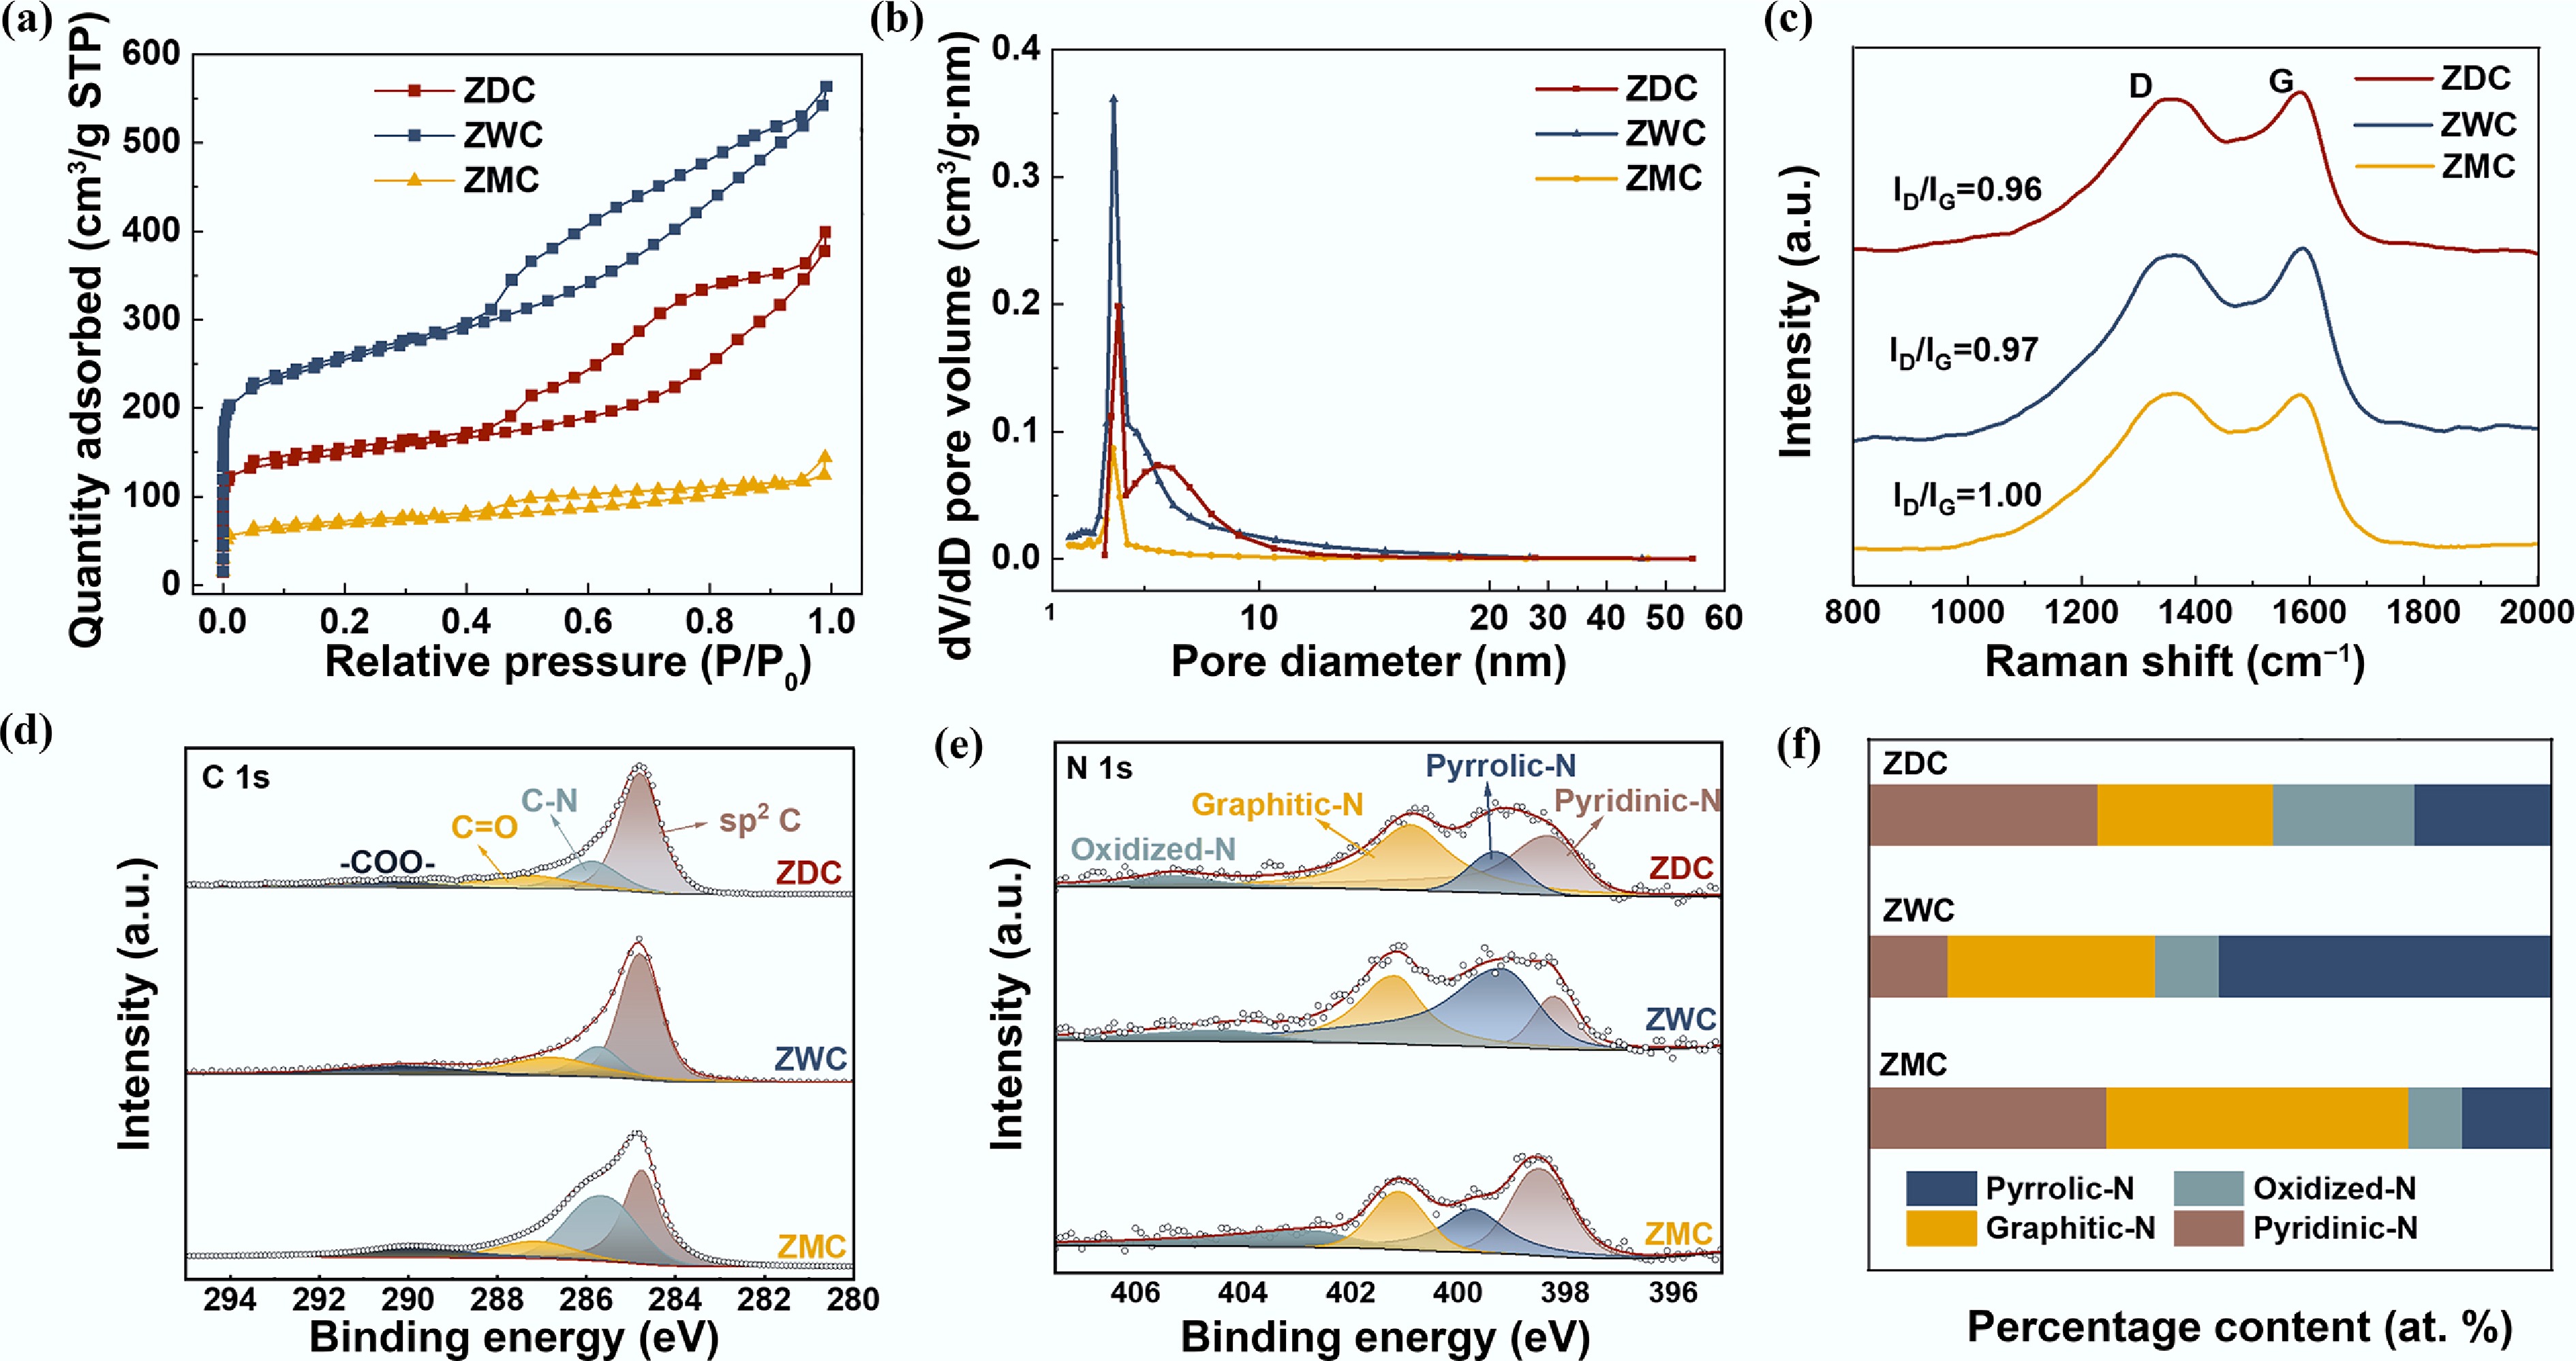
Figure 2.
Characterization of ZDC, ZWC, and ZMC. (a) N2 adsorption–desorption isotherms. (b) Pore size distributions. (c) Raman spectra, high-resolution XPS spectra of (d) C 1s, (e) N 1s, and (f) corresponding N species content.
-
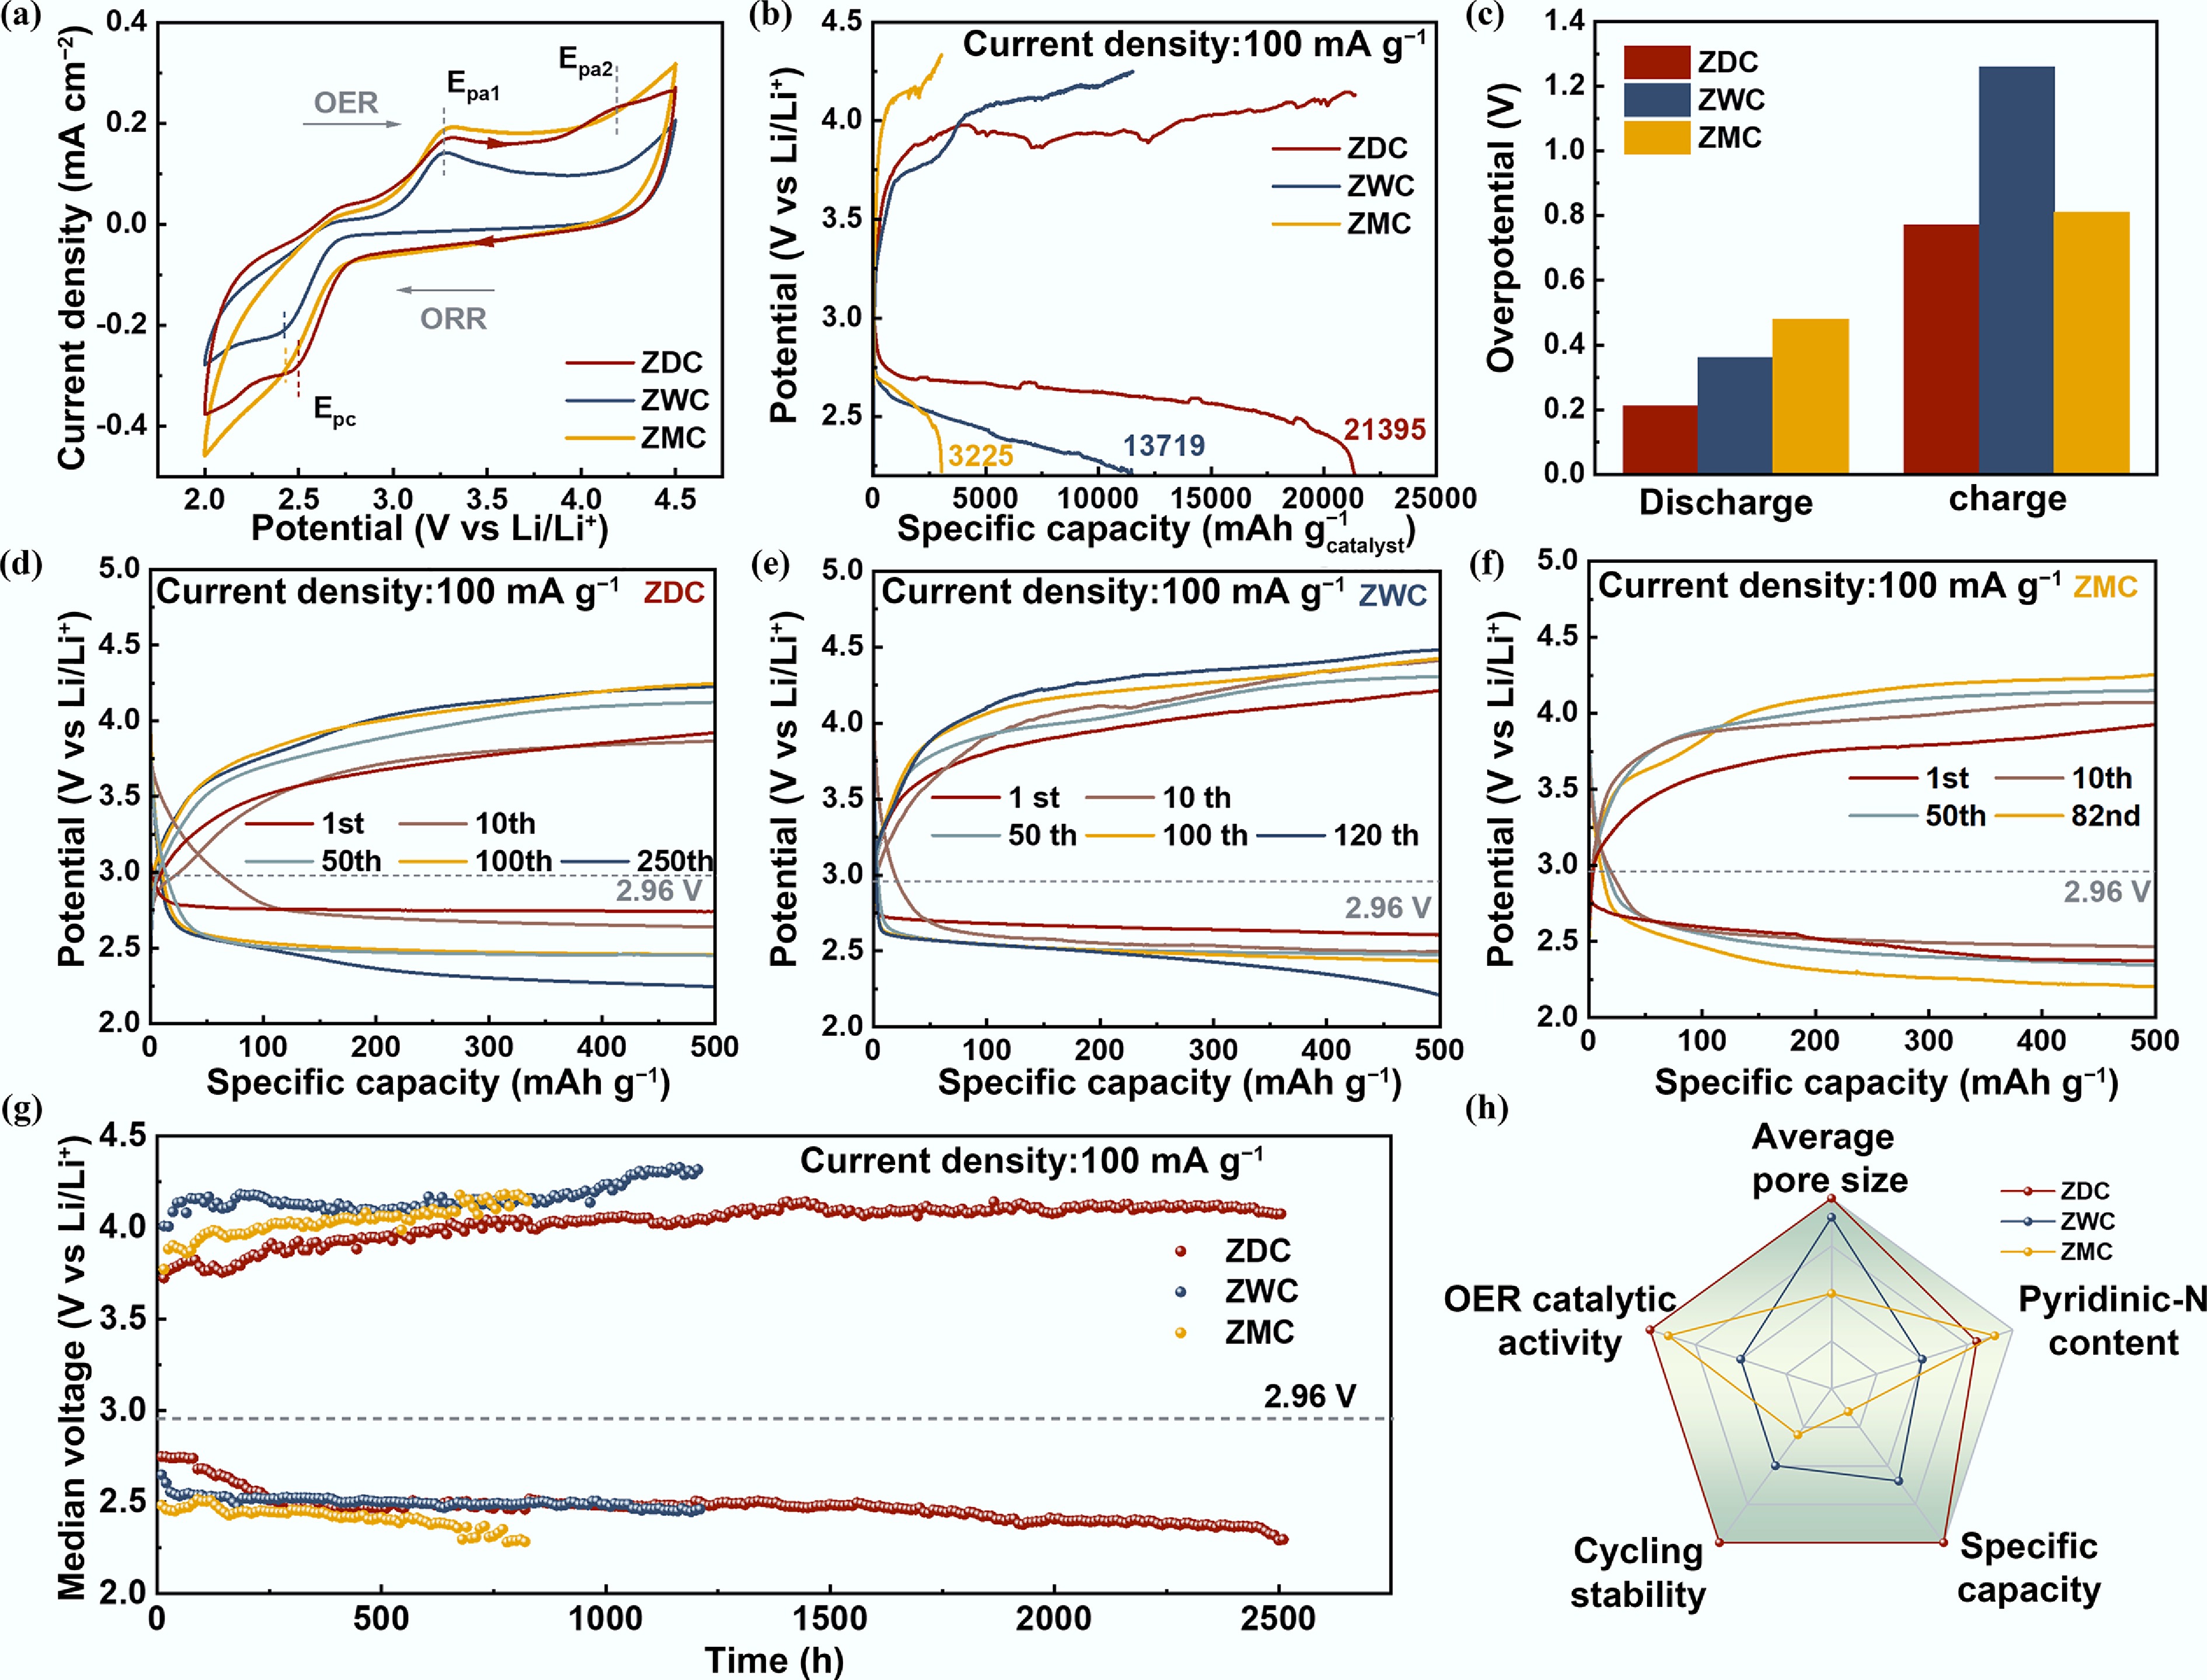
Figure 3.
Electrochemical performance of Li–O2 batteries with ZDC, ZWC, and ZMC cathodes. (a) Cyclic voltammetry curves. (b) Galvanostatic discharge-charge curves (at 100 mA g−1). (c) Comparison of discharge and charge overpotentials at the fifth cycle of LOBs with ZDC, ZWC, and ZMC cathodes. The selected cycling curves of LOBs with cathode (d) ZDC, (e) ZWC, and (f) ZMC. (g) The Medium voltage-time curves of LOBs with ZDC, ZWC, and ZMC cathodes. (h) A radar map comparing the materials properties and electrochemical performances of LOBs with ZDC, ZWC, and ZMC cathodes.
-
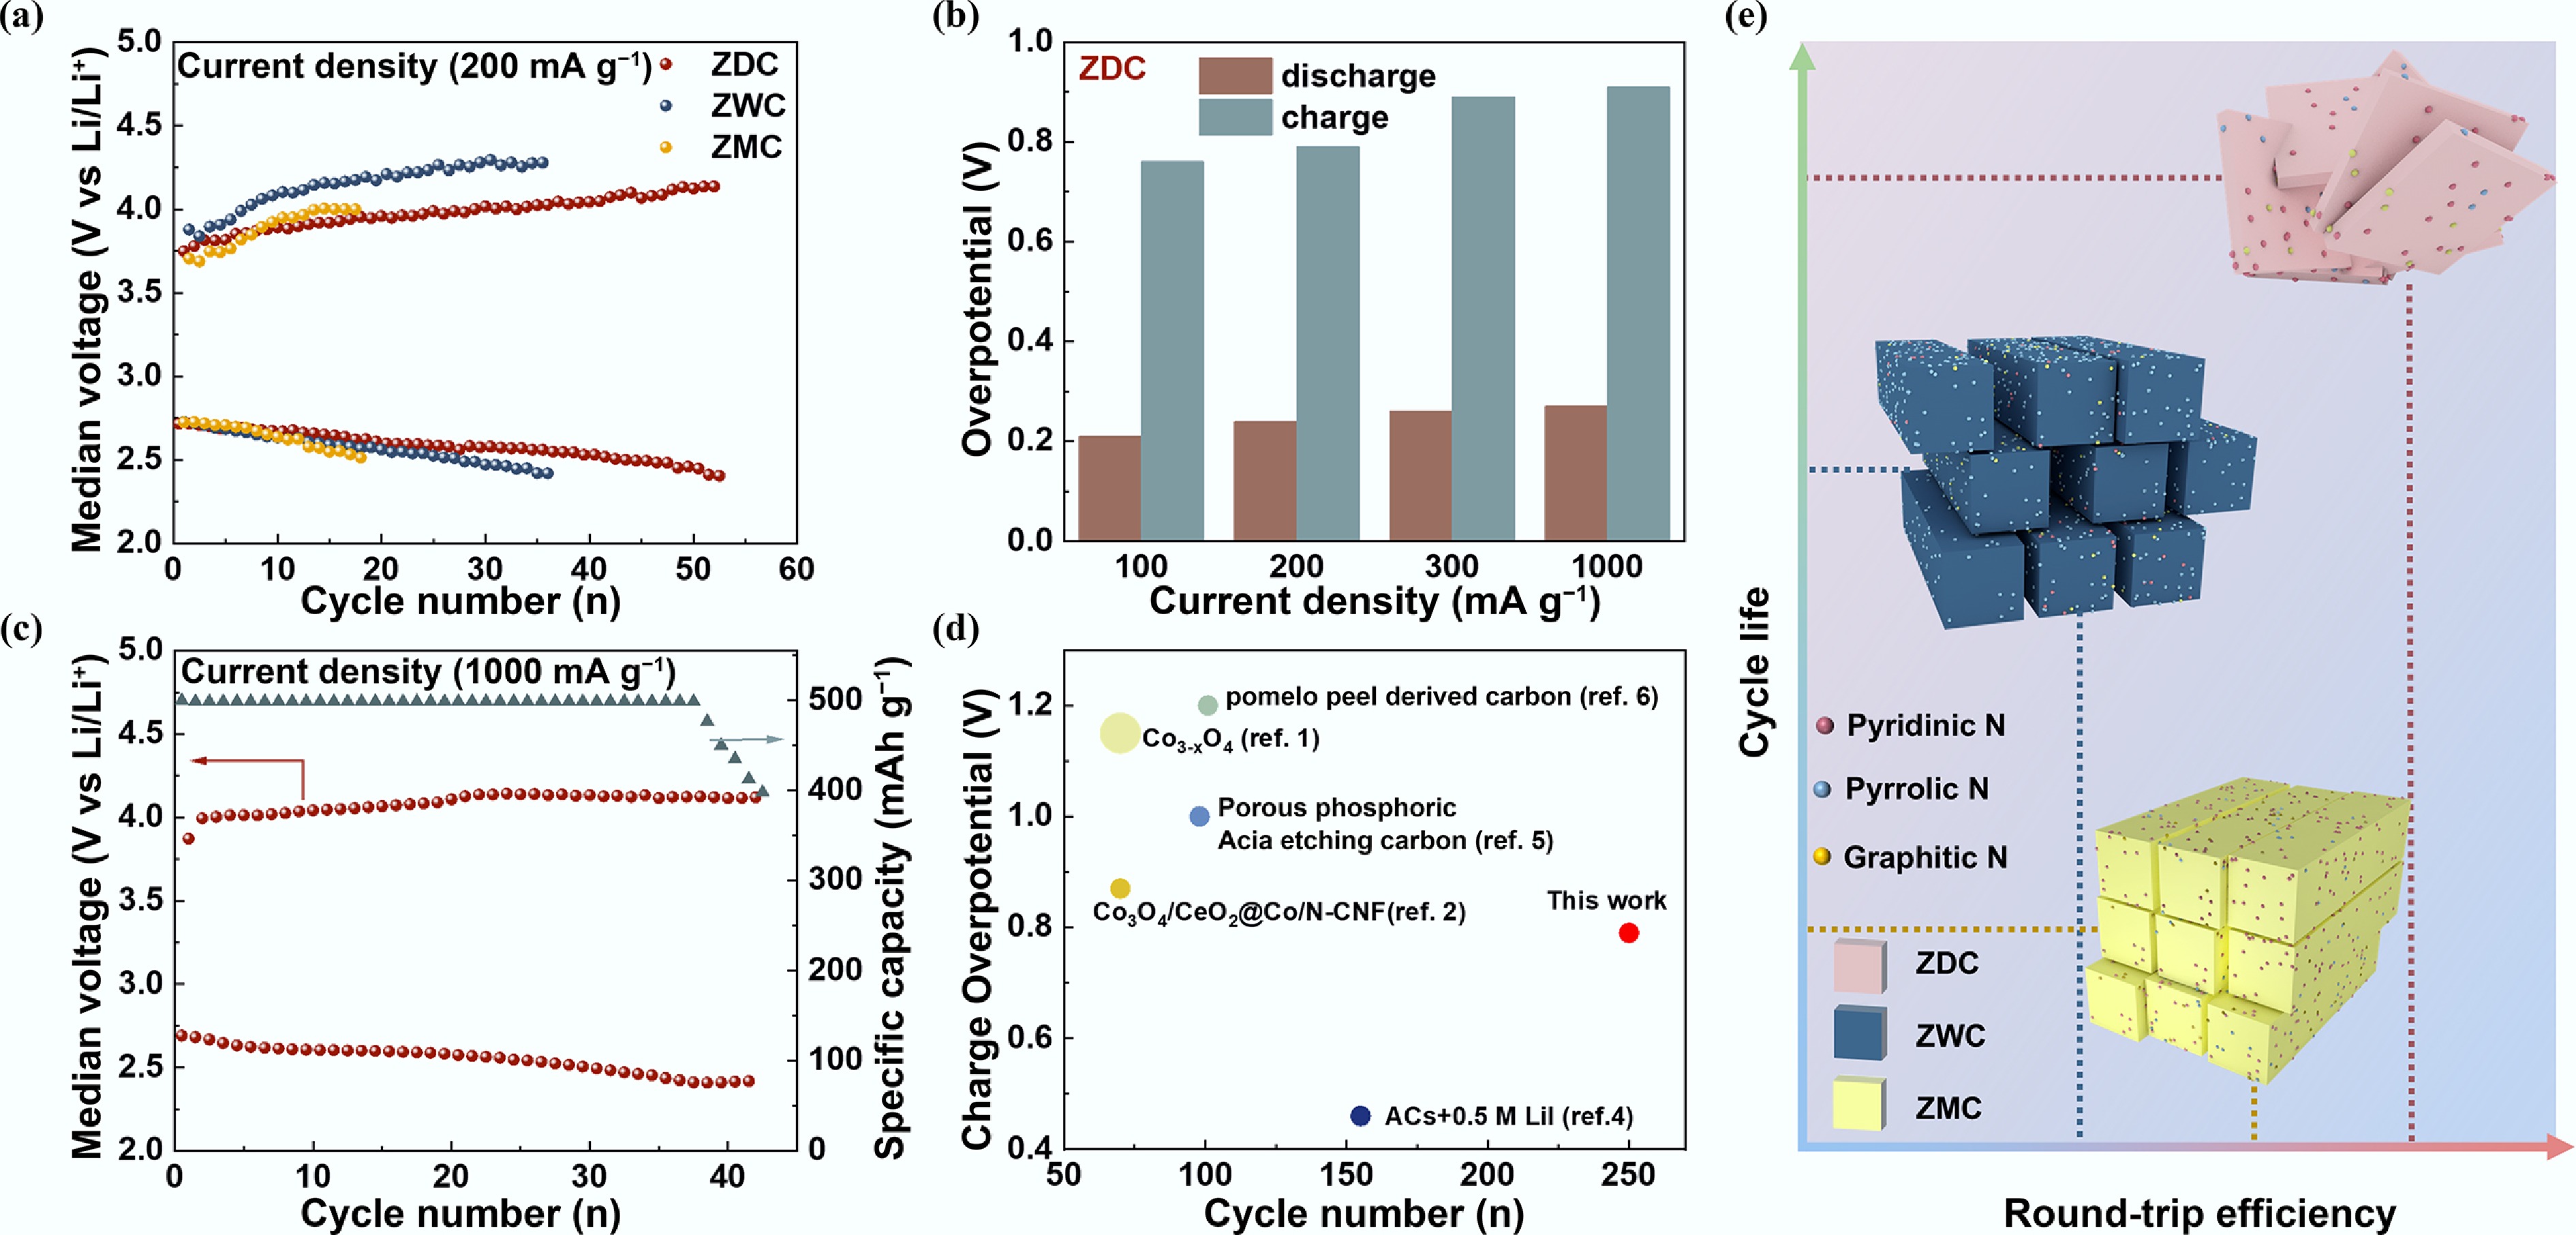
Figure 4.
Overpotentials and cycling performance of ZDC, ZWC, and ZMC cathodes under different current densities. (a) Median voltage–cycling number curves of LOBs with ZDC, ZWC, and ZMC cathodes at 200 mA g−1 and a limited capacity of 500 mA h g−1. (b) Median voltage–cycling number curve at 1,000 mA g−1 and a discharge depth of 500 mA h g−1 of LOB with ZDC cathode. (c) Discharge/charge overpotentials of LOB with ZDC cathode at 100, 200, 300, and 1,000 mA g−1 and a limited capacity of 500 mA h g−1. (d) Comparison of charge overpotentials and cycle number of this work with recent literature reported. (e) Schematic diagram illustrating the relative relationship between the round-trip efficiency and cycling life of LOBs with ZDC, ZWC, and ZMC cathodes.
-
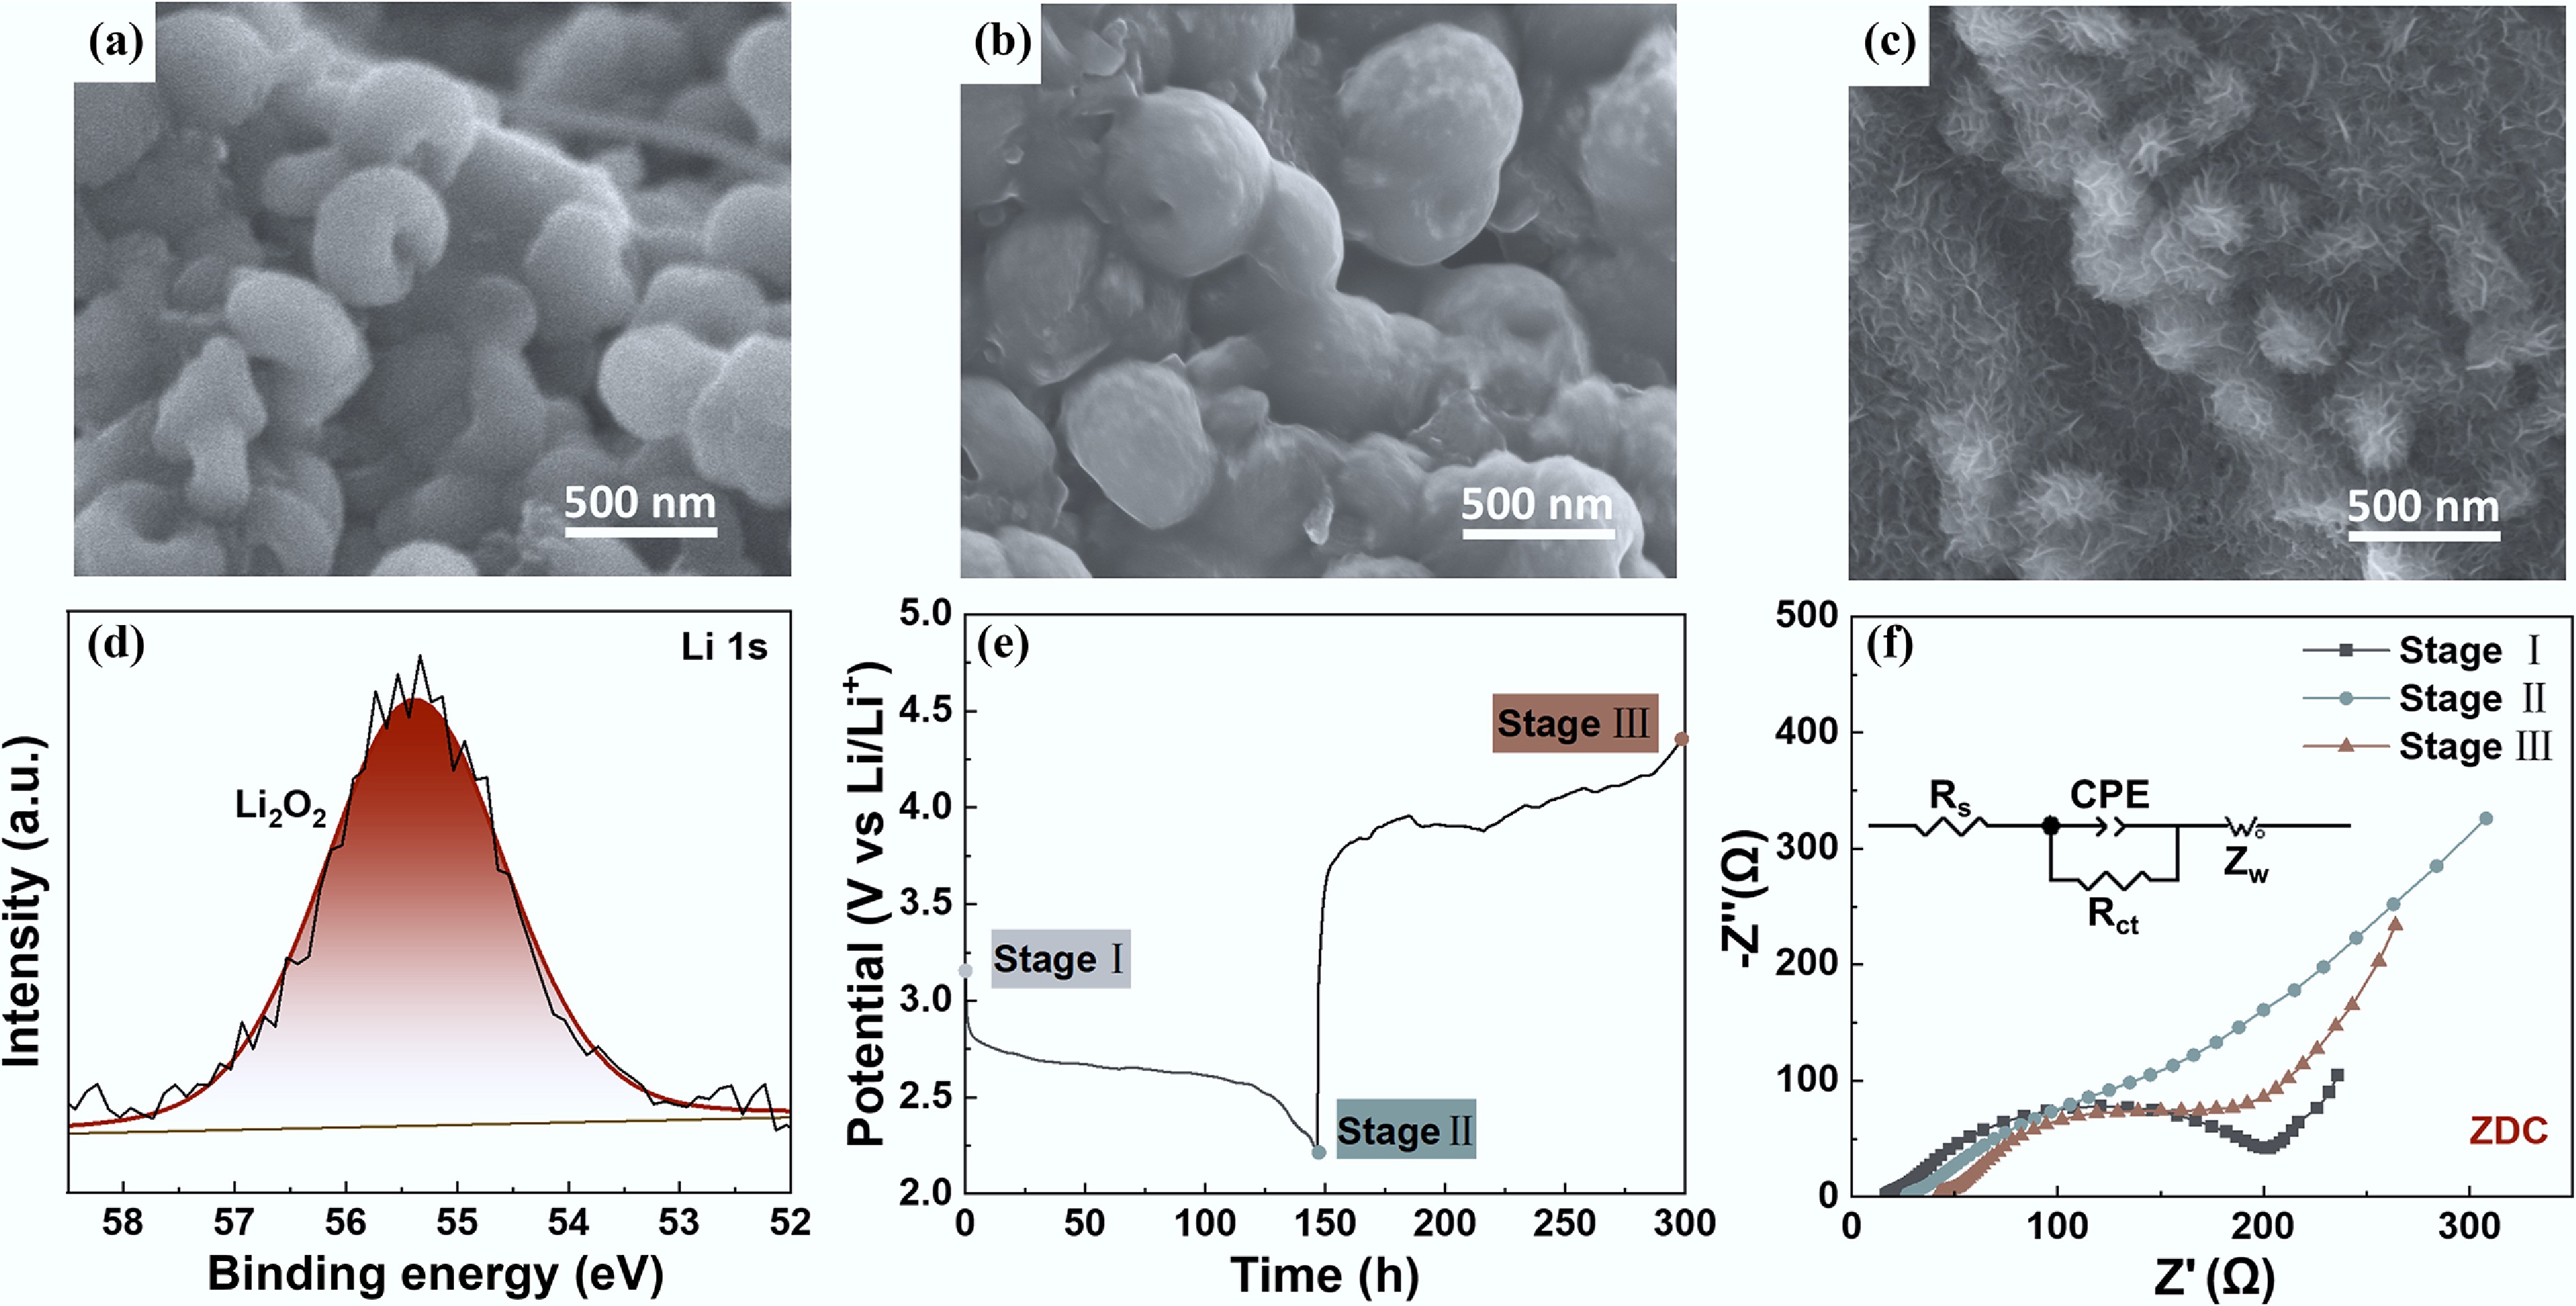
Figure 5.
SEM images of (a) ZDC, (b) ZWC, and (c) ZMC after first discharge. (d) High-resolution XPS spectrum of Li 1s of the ZDC cathode after first discharge. (e) The galvanostatic discharge-charge curve and corresponding Nyquist plots before discharge (stage I), after discharge (stage II), and after charge (stage III) (inset: the equivalent circuit model of stage II).
-
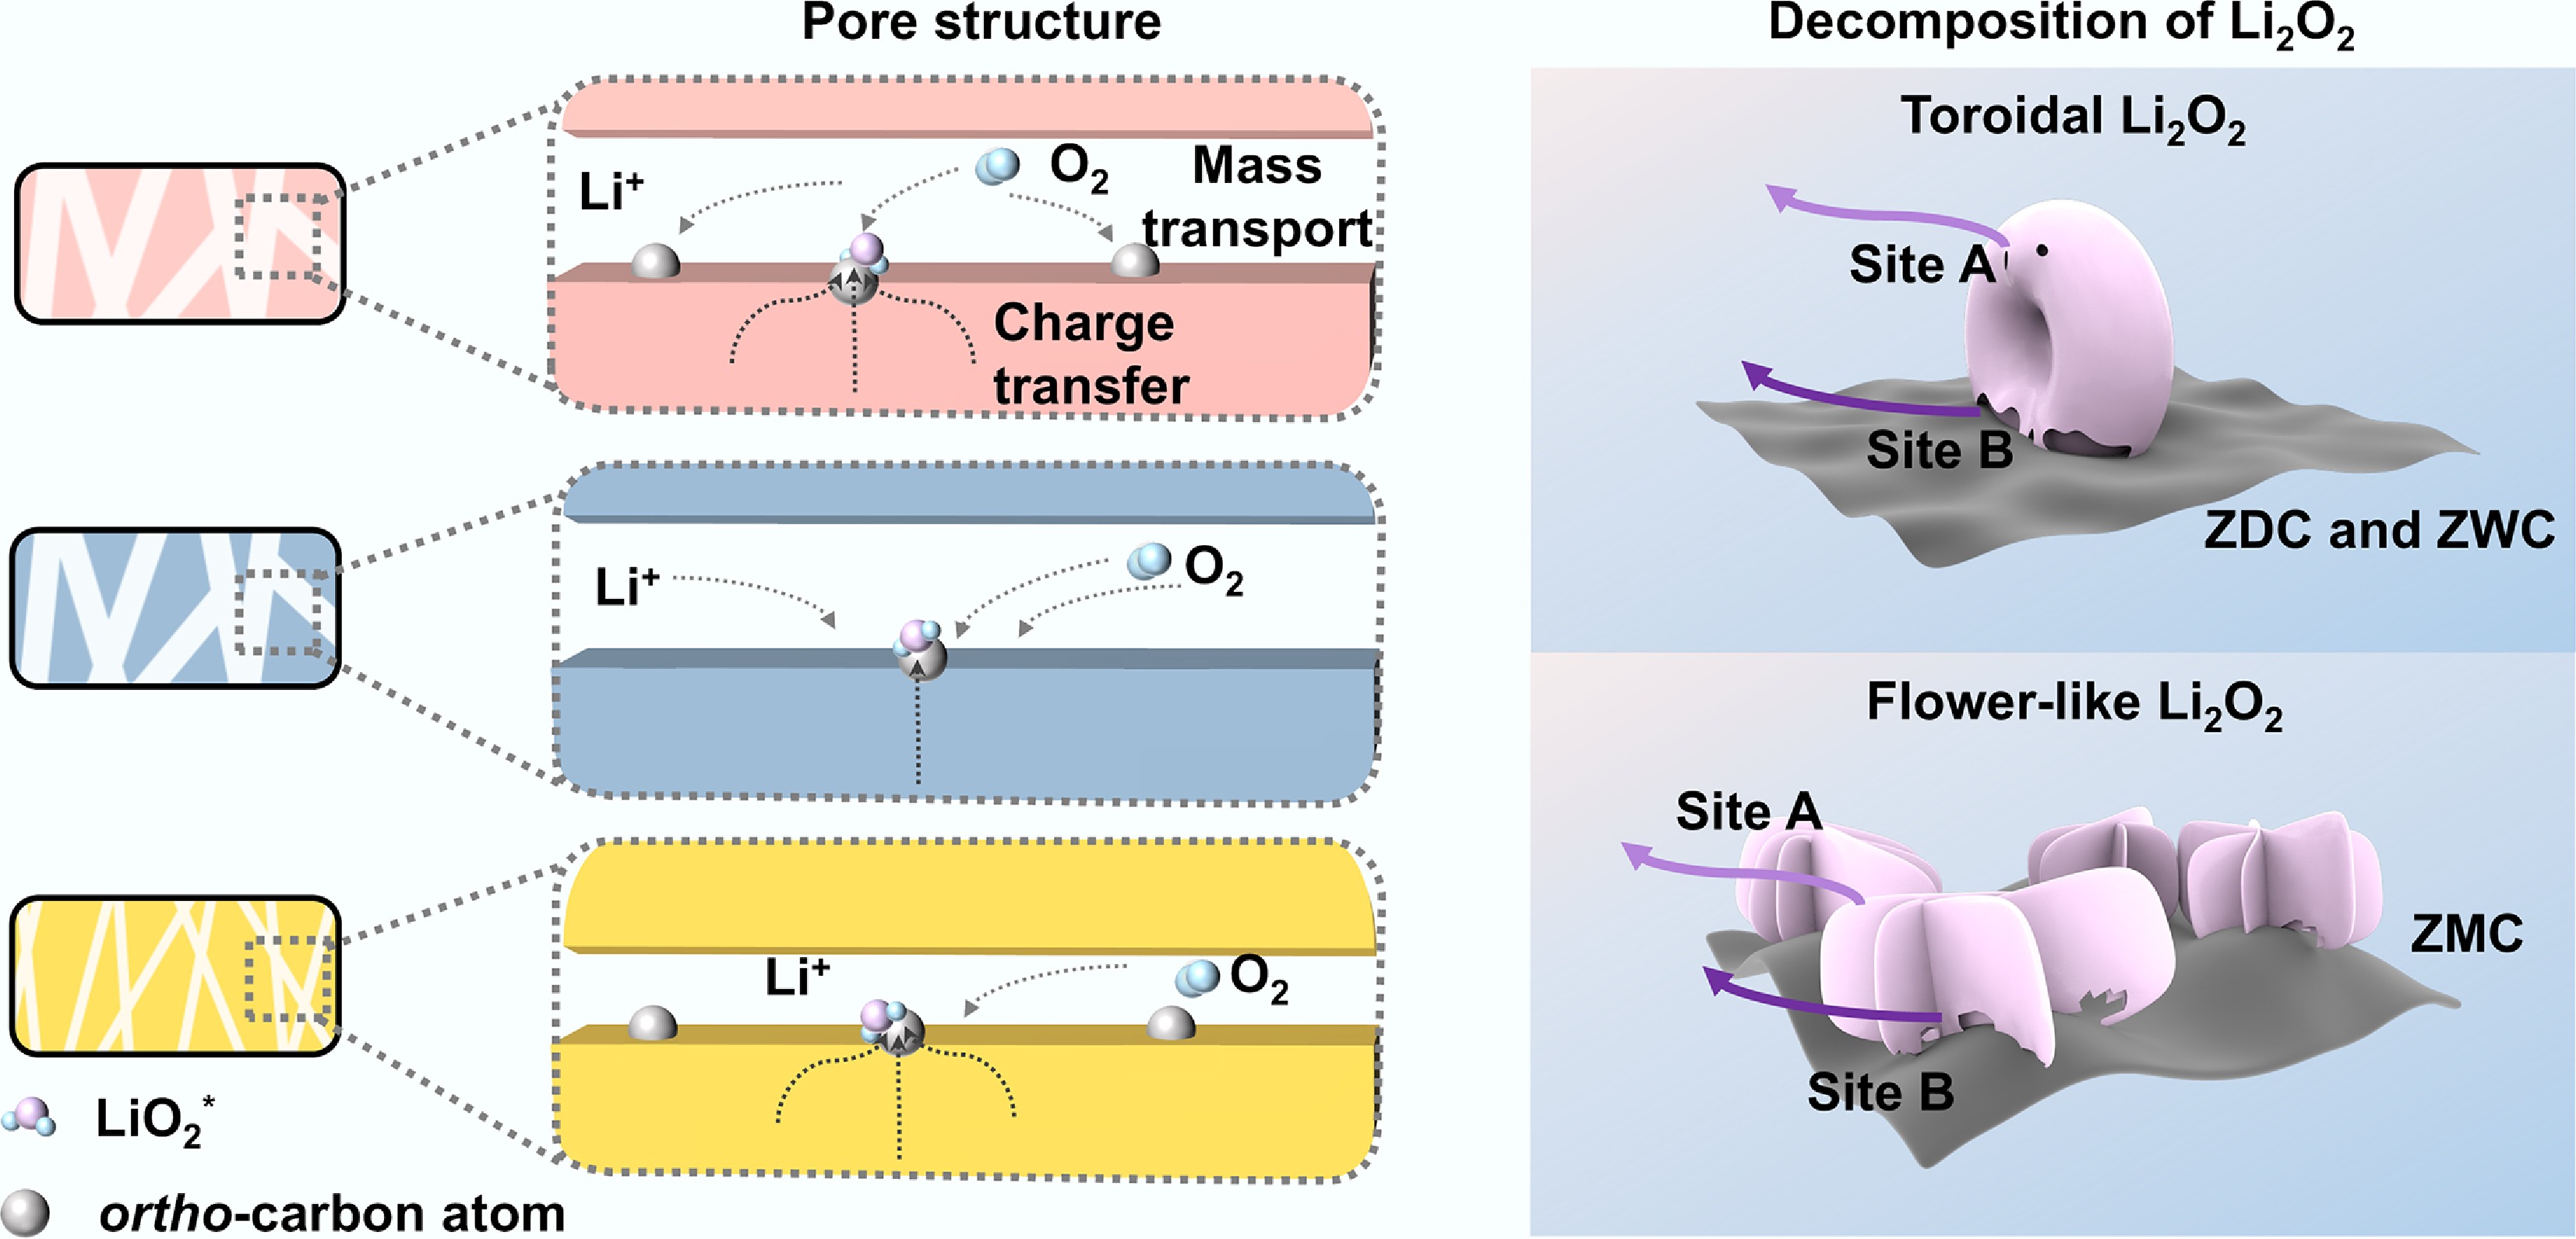
Figure 6.
Coupled effects of mass transport and charge transfer on discharge product morphologies and subsequent decomposition processes. (a) Schematic illustration of the differences in the electrochemical process on the cathode surface of ZDC, ZWC, and ZMC. (b) Different decomposition mechanisms of discharge products Li2O2 with toroidal and flower-like morphologies.
Figures
(6)
Tables
(0)