-
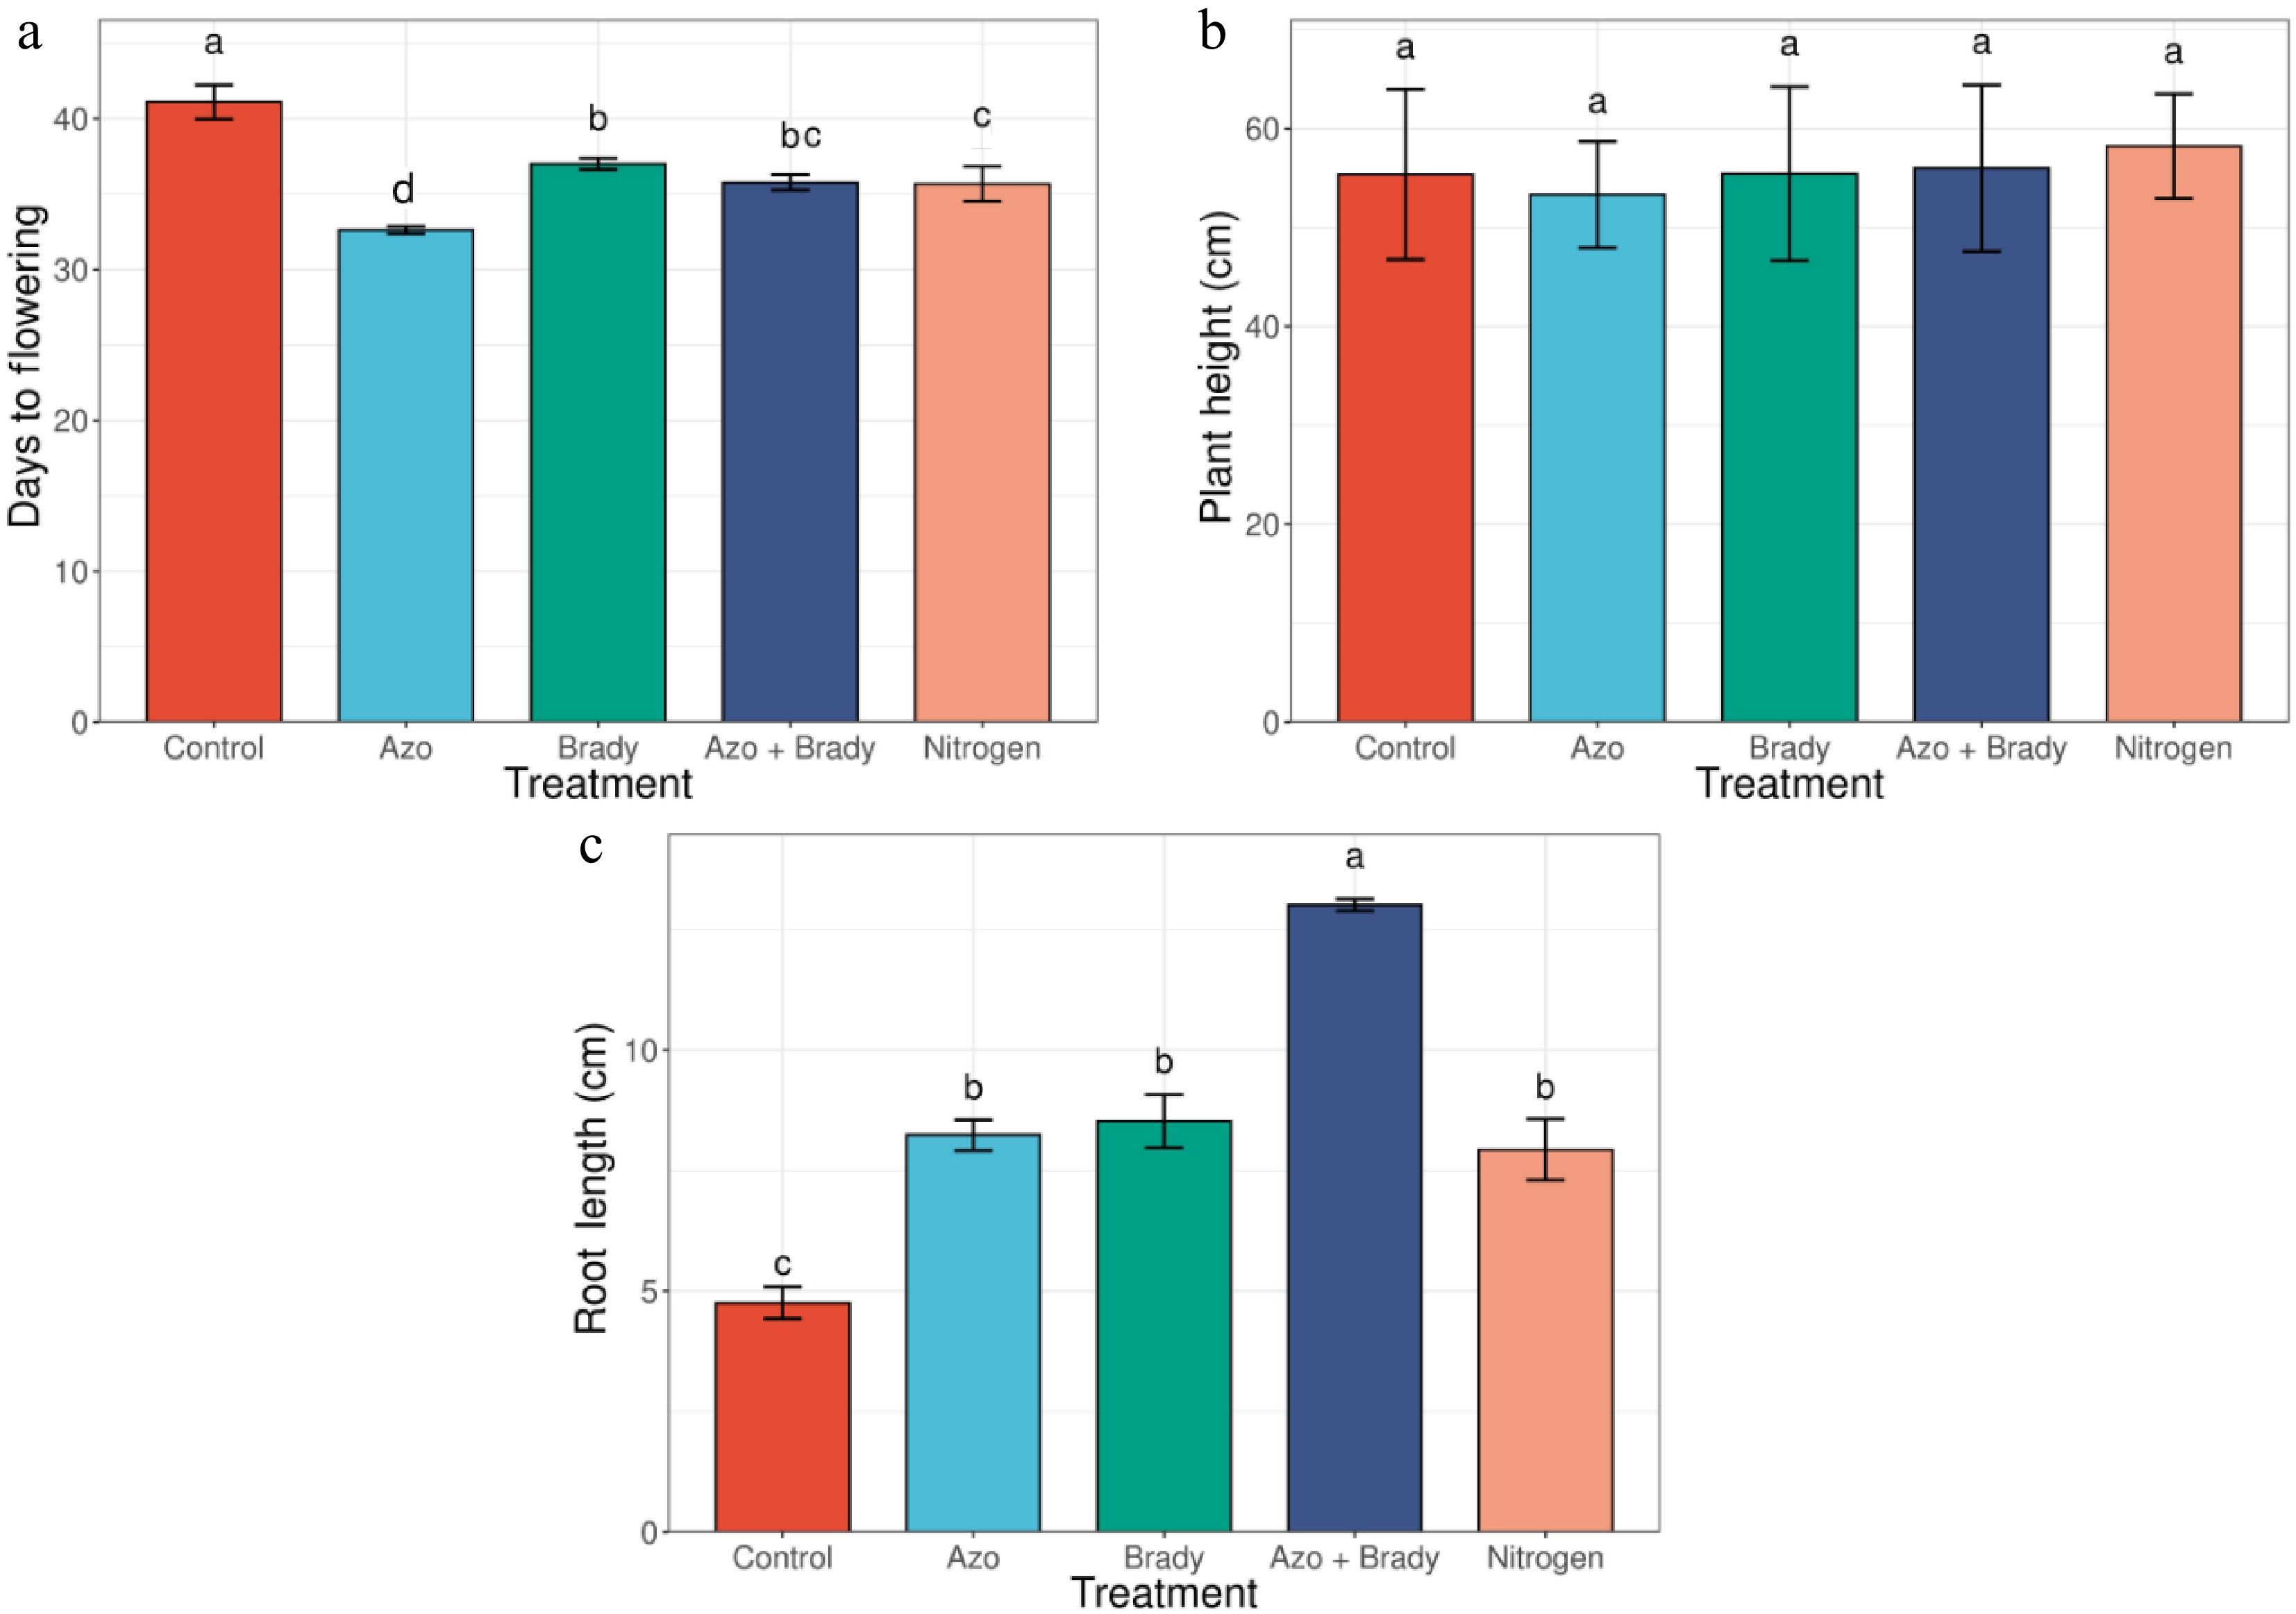
Figure 1.
Phenology and vegetative growth traits of soybean control (no inoculation). Azo, Azospirillium spp.; Brady, Bradyrhizobium spp.; Azo + Brady, Azospirillium spp. + Bradyrhizobium spp.
-
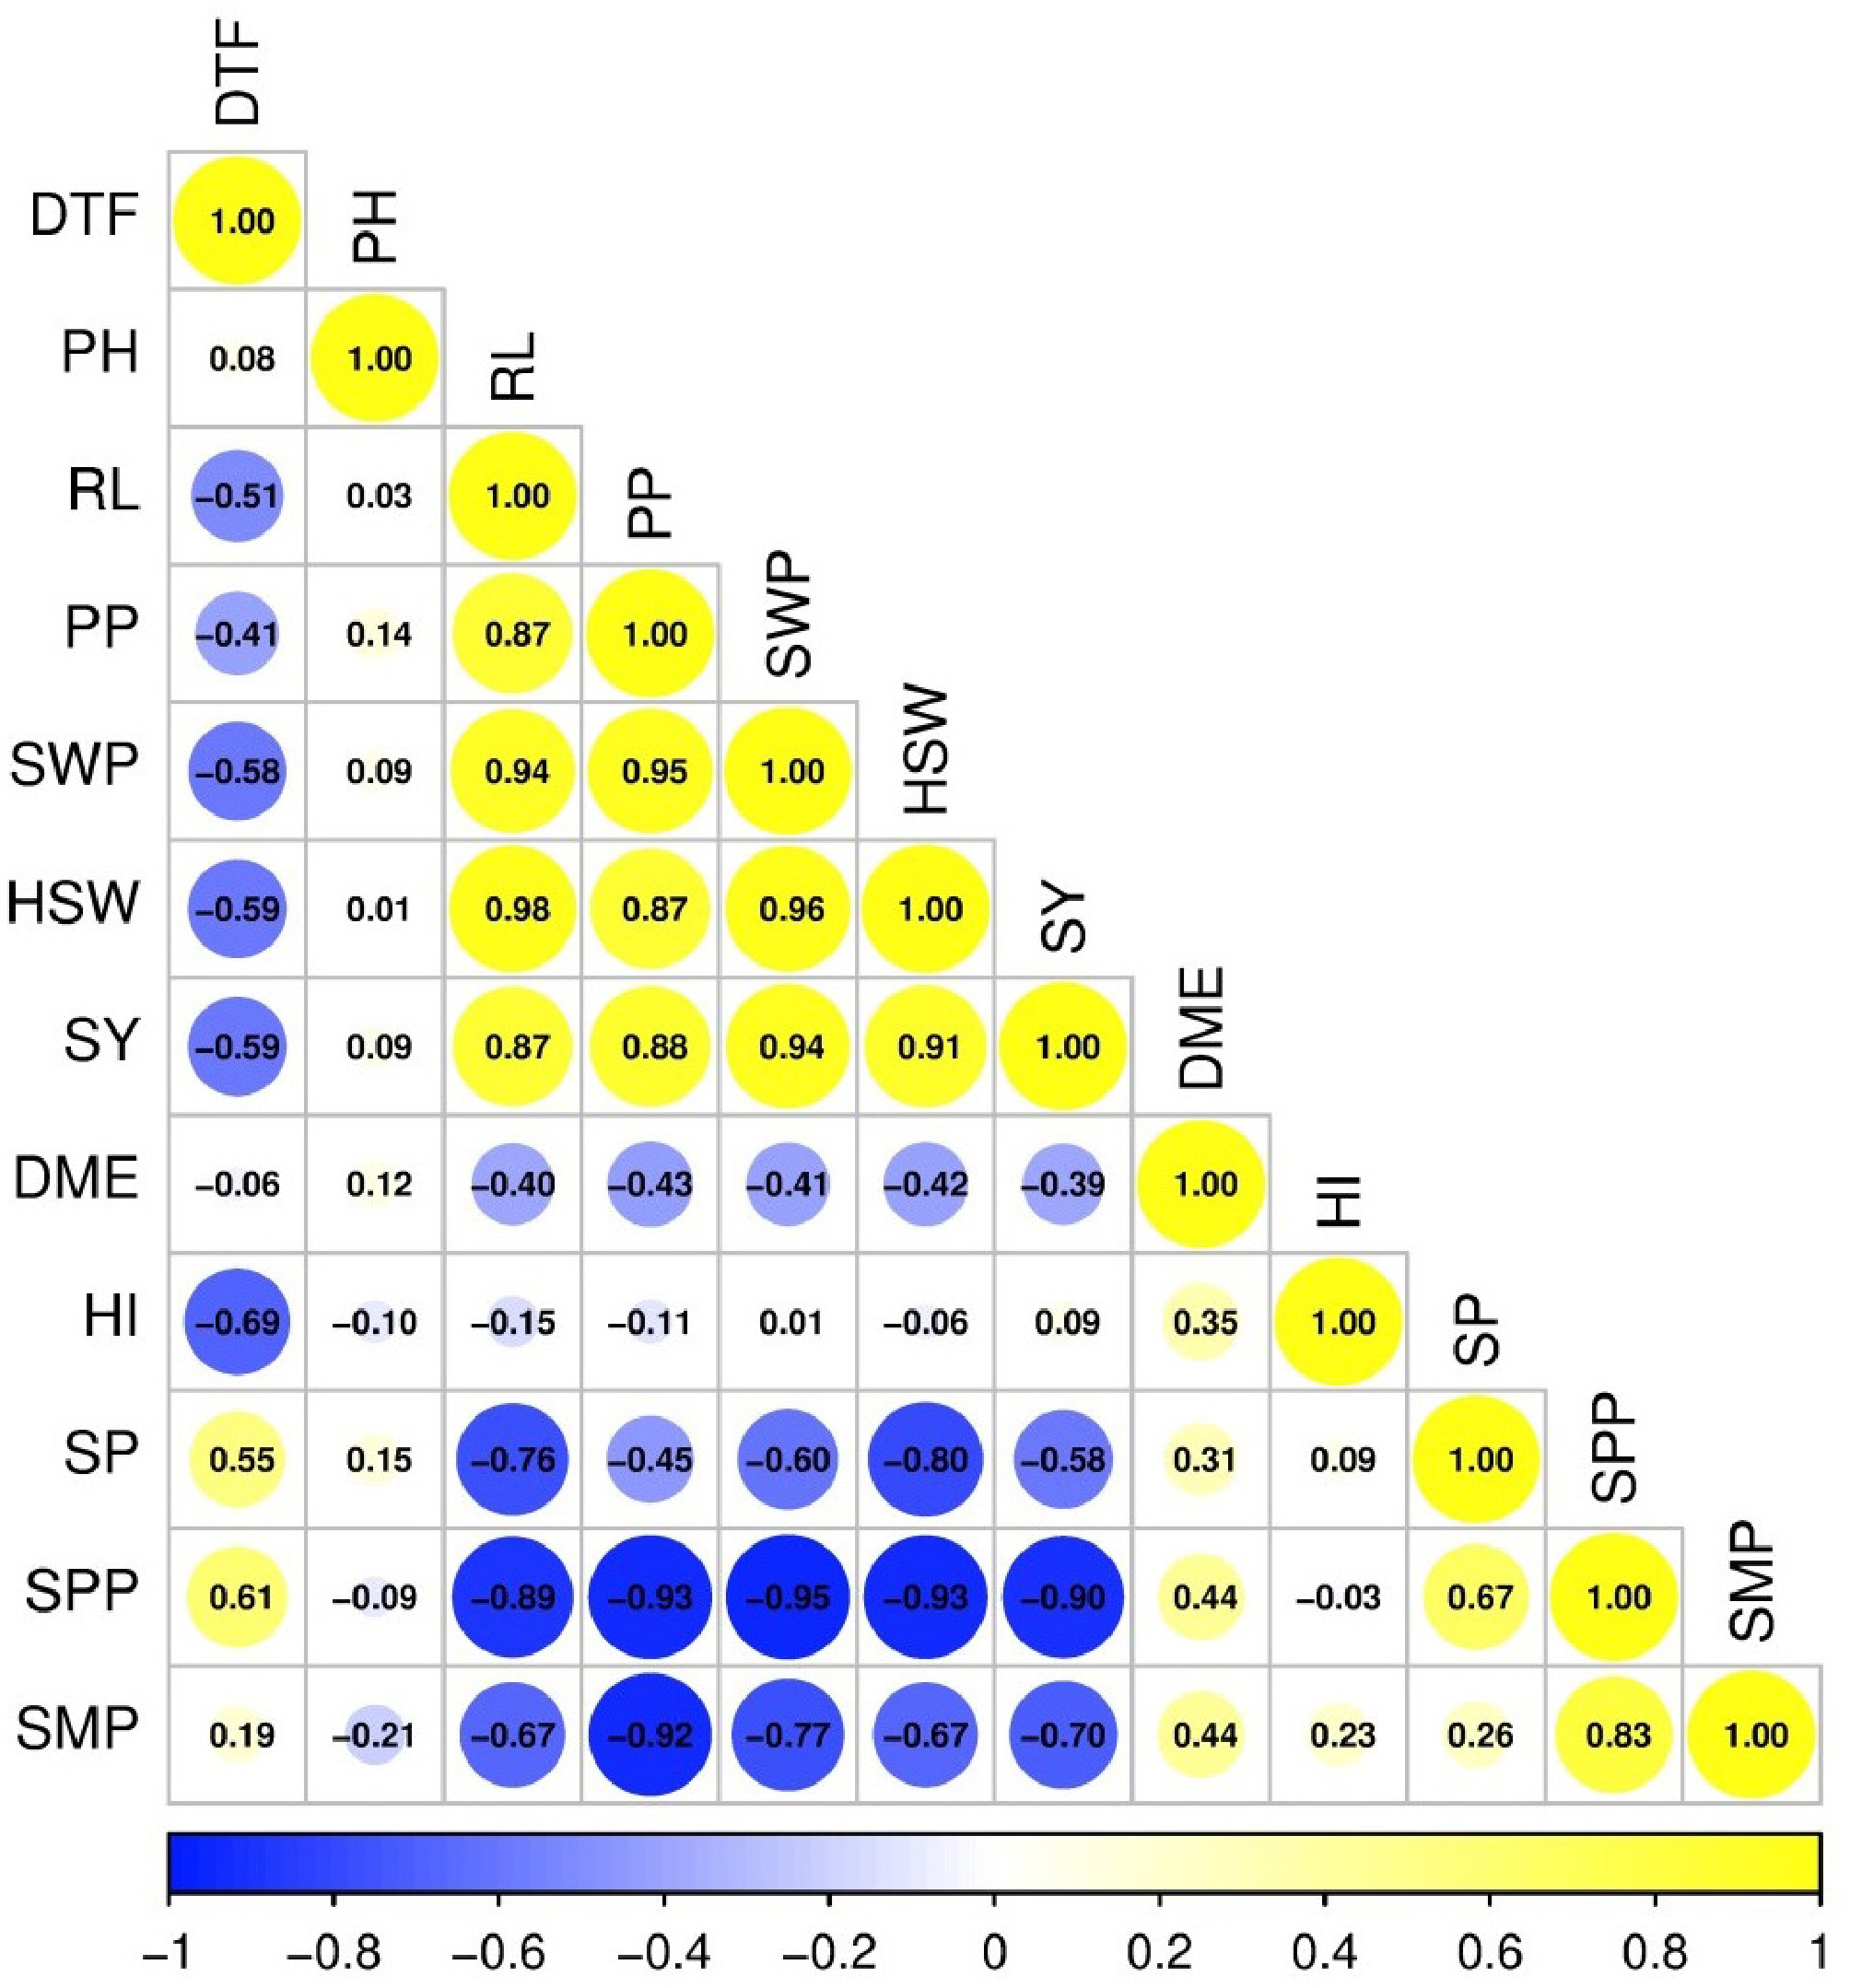
Figure 2.
Correlation matrix of phenological, growth, and yield-related traits in soybean. DTF, days to flowering; PH, plant height; RL, root length; PP, pods per plant; SWP, seed weight per plant; HSW, 100-seed weight; SY, seed yield; DME, dry matter efficiency; HI, harvest index; SP, seeds per plant; SPD, seeds per pod; SMP, seed mass per pod.
-
Soil parameter Value and interpretation pH (H2O, 1:1) 5.57 (moderately acidic) Total nitrogen (%) 0.12 (low) Available phosphorus (ppm) 20.1 (moderate) Exchangeable potassium (cmol·kg−1) 0.18 (low) Organic matter (%) 1.43 (low) Texture Sandy loam Table 1.
Initial soil properties of the experimental field (0–30 cm depth).
-
Treatment Pod number·plant−1 Seeds·plant−1 Seeds·pod−1 Harvest index (%) Dry matter efficiency No inoculation 144.38 e 236.20 a 1.64 a 26.73 c 0.86 Azospirillum spp. 188.72 d 206.06 b 1.09 b 31.30 a 0.88 Bradyrhizobium spp. 226.38 c 202.85 bc 0.90 c 26.93 c 0.81 Azospirillum spp. + Bradyrhizobium spp. 315.62 a 197.59 c 0.62 d 26.40 c 0.80 Mineral nitrogen 269.12 b 230.36 a 0.86 c 29.73 b 0.83 Means within a column followed by the same letter are not significantly different at p ≤ 0.05 (LSD). Table 2.
Effects of microbial inoculation and N application on soybean seed set parameters and biomass allocation.
-
Treatment 100-seed weight (g) Seed weight·plant−1 (g) Seed mass·pod−1 (g) Seed yield (t·ha−1) No inoculation 8.03 d 18.96 d 0.131 a 1.57 c Azospirillum spp. 12.05 bc 24.82 c 0.132 a 2.06 b Bradyrhizobium spp. 12.21 b 24.75 c 0.109 b 2.06 b Azospirillum spp. + Bradyrhizobium spp. 16.04 a 31.70 a 0.101 c 2.52 a Mineral nitrogen 11.85 c 27.29 b 0.103 bc 2.23 b Means within a column followed by the same letter are not significantly different at p ≤ 0.05 (LSD). Table 3.
Effects of microbial inoculation and N application on soybean yield components and seed yield.
Figures
(2)
Tables
(3)