-
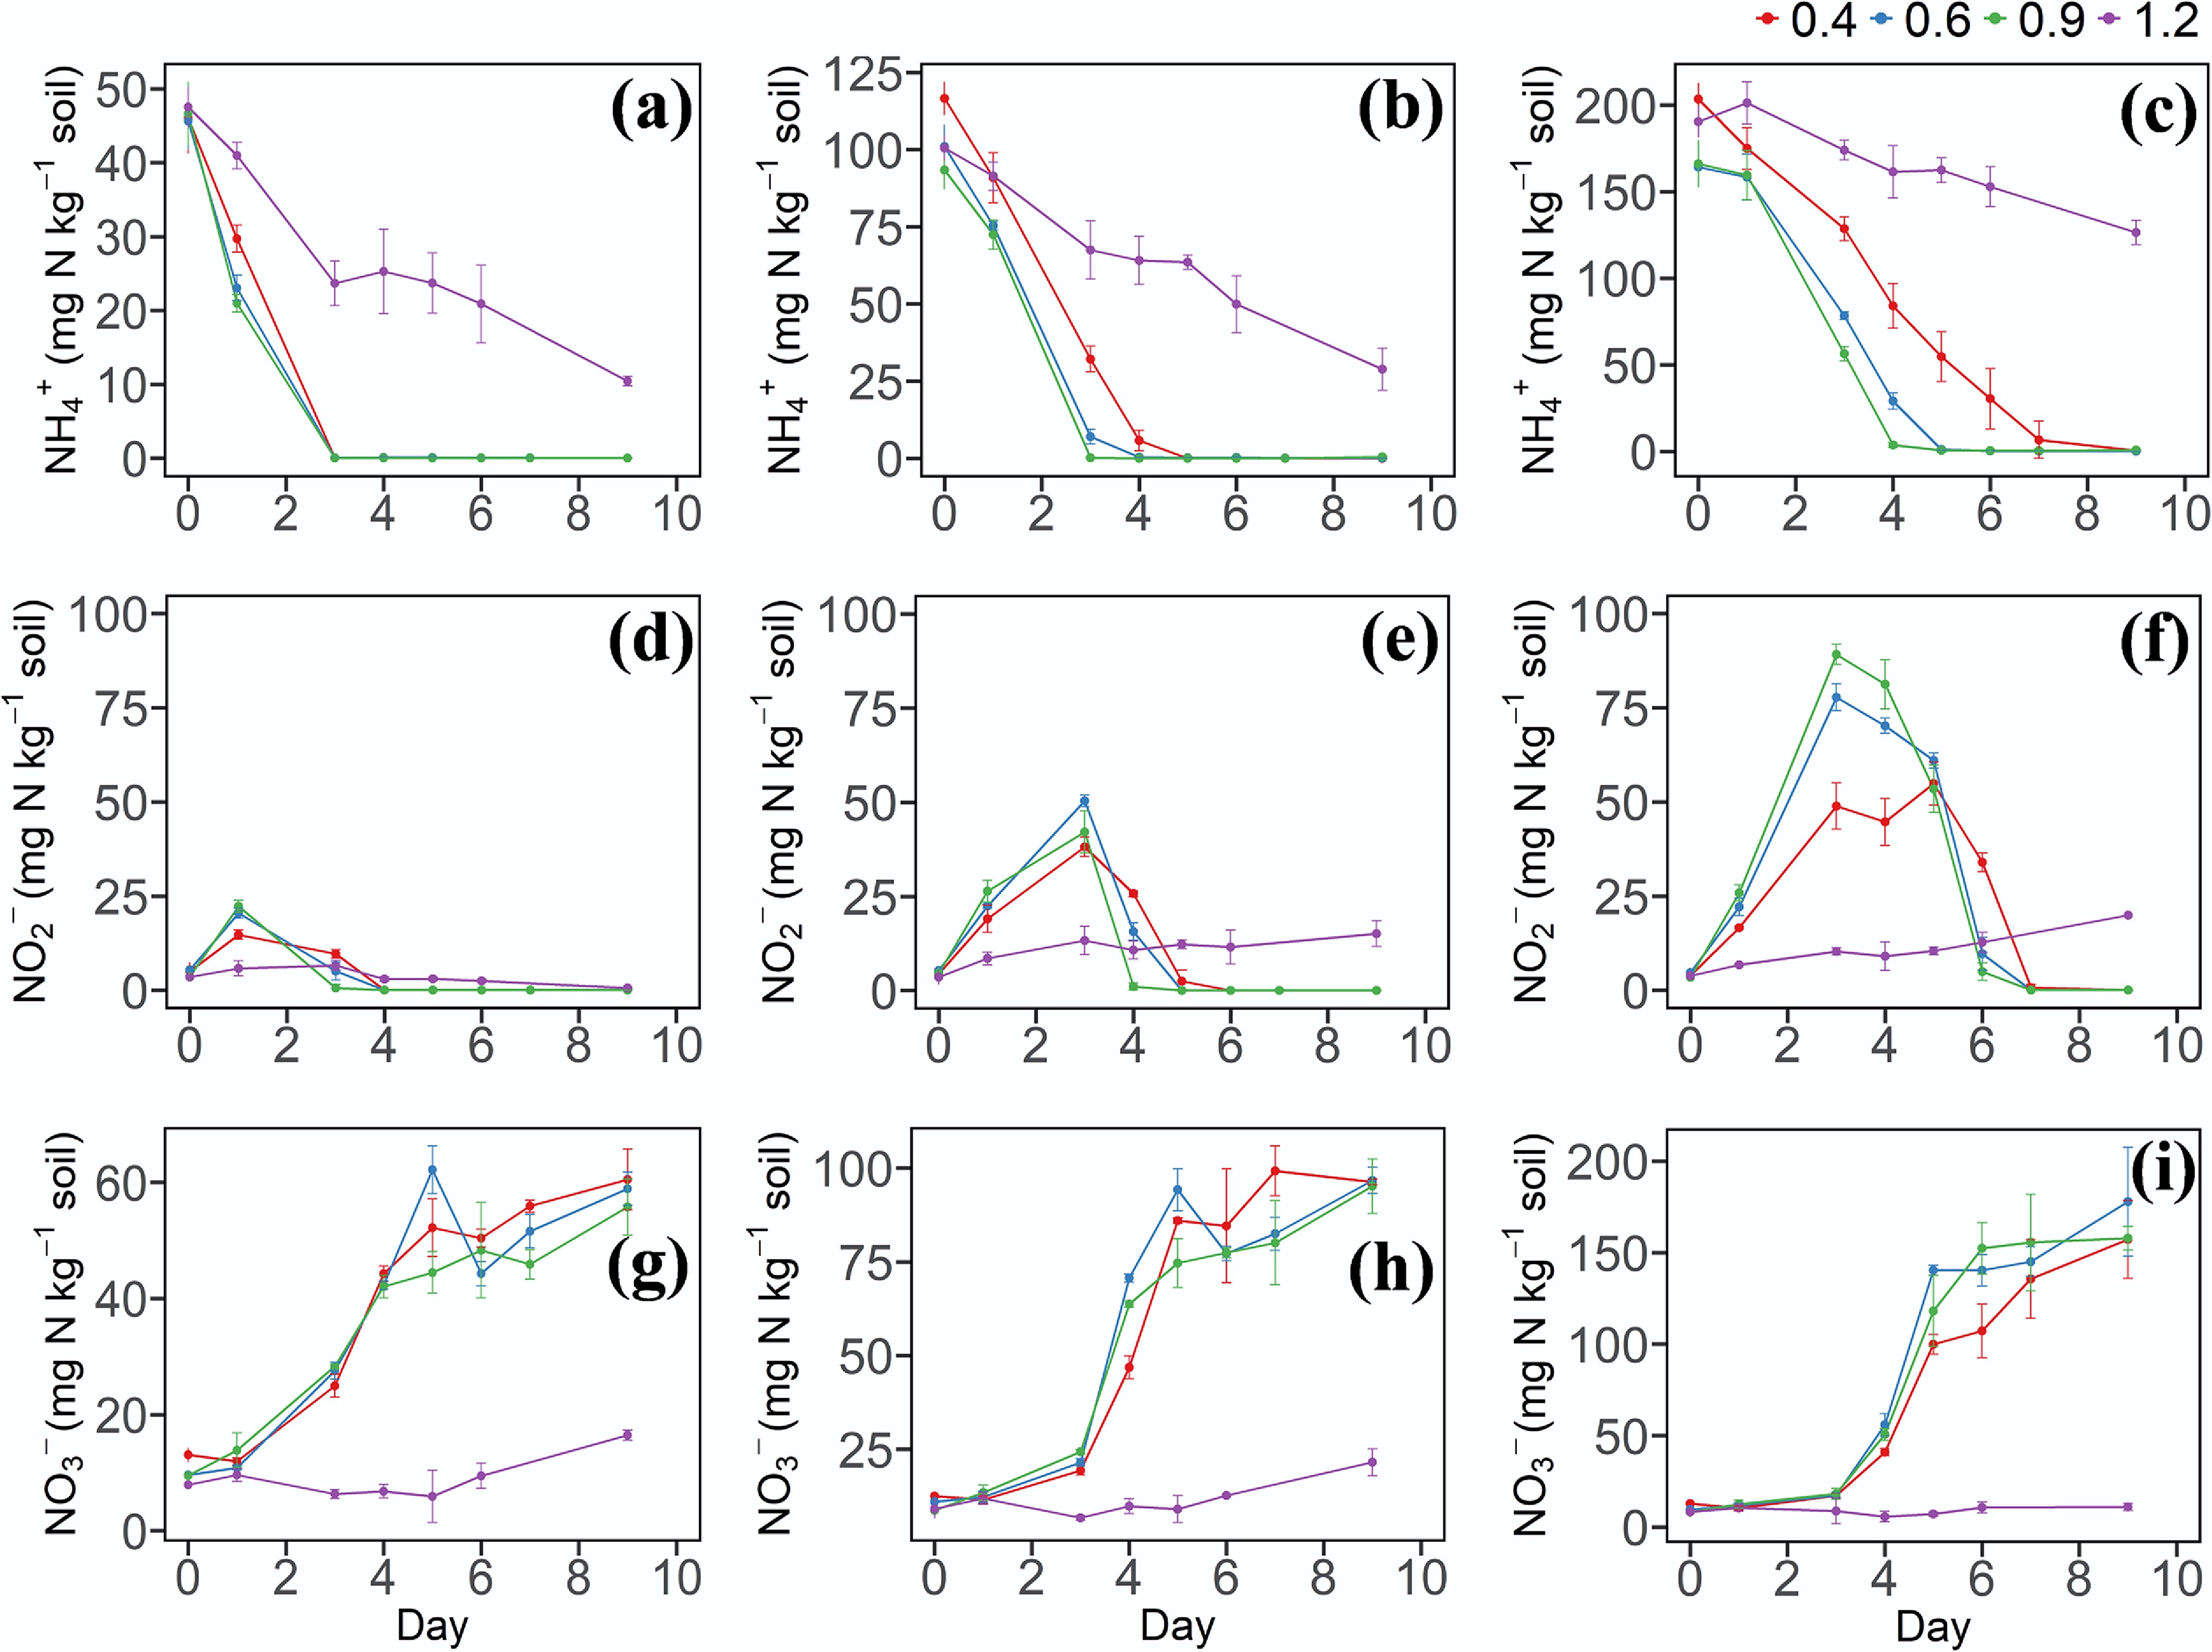
Figure 1.
(a)–(c) Dynamic changes of NH4+–N, (d)–(f) NO2−–N, and (g)–(i) NO3−–N in soil under different soil water contents and N levels. 0.4, 0.6, 0.9, and 1.2 represent W1, W2, W3, and W4 WHC, respectively. (a), (d), and (g) represent soil with a N content of 50 mg N kg−1. (b), (e), and (h) represent soil with a N content of 100 mg N kg−1. (c), (f), and (i) represent soil with a N content of 200 mg N kg−1. Error bars indicate standard deviations (n = 3). Abbreviations: NH4+: ammonium, NO2−: nitrite, NO3−: nitrate, WHC: water holding capacity.
-
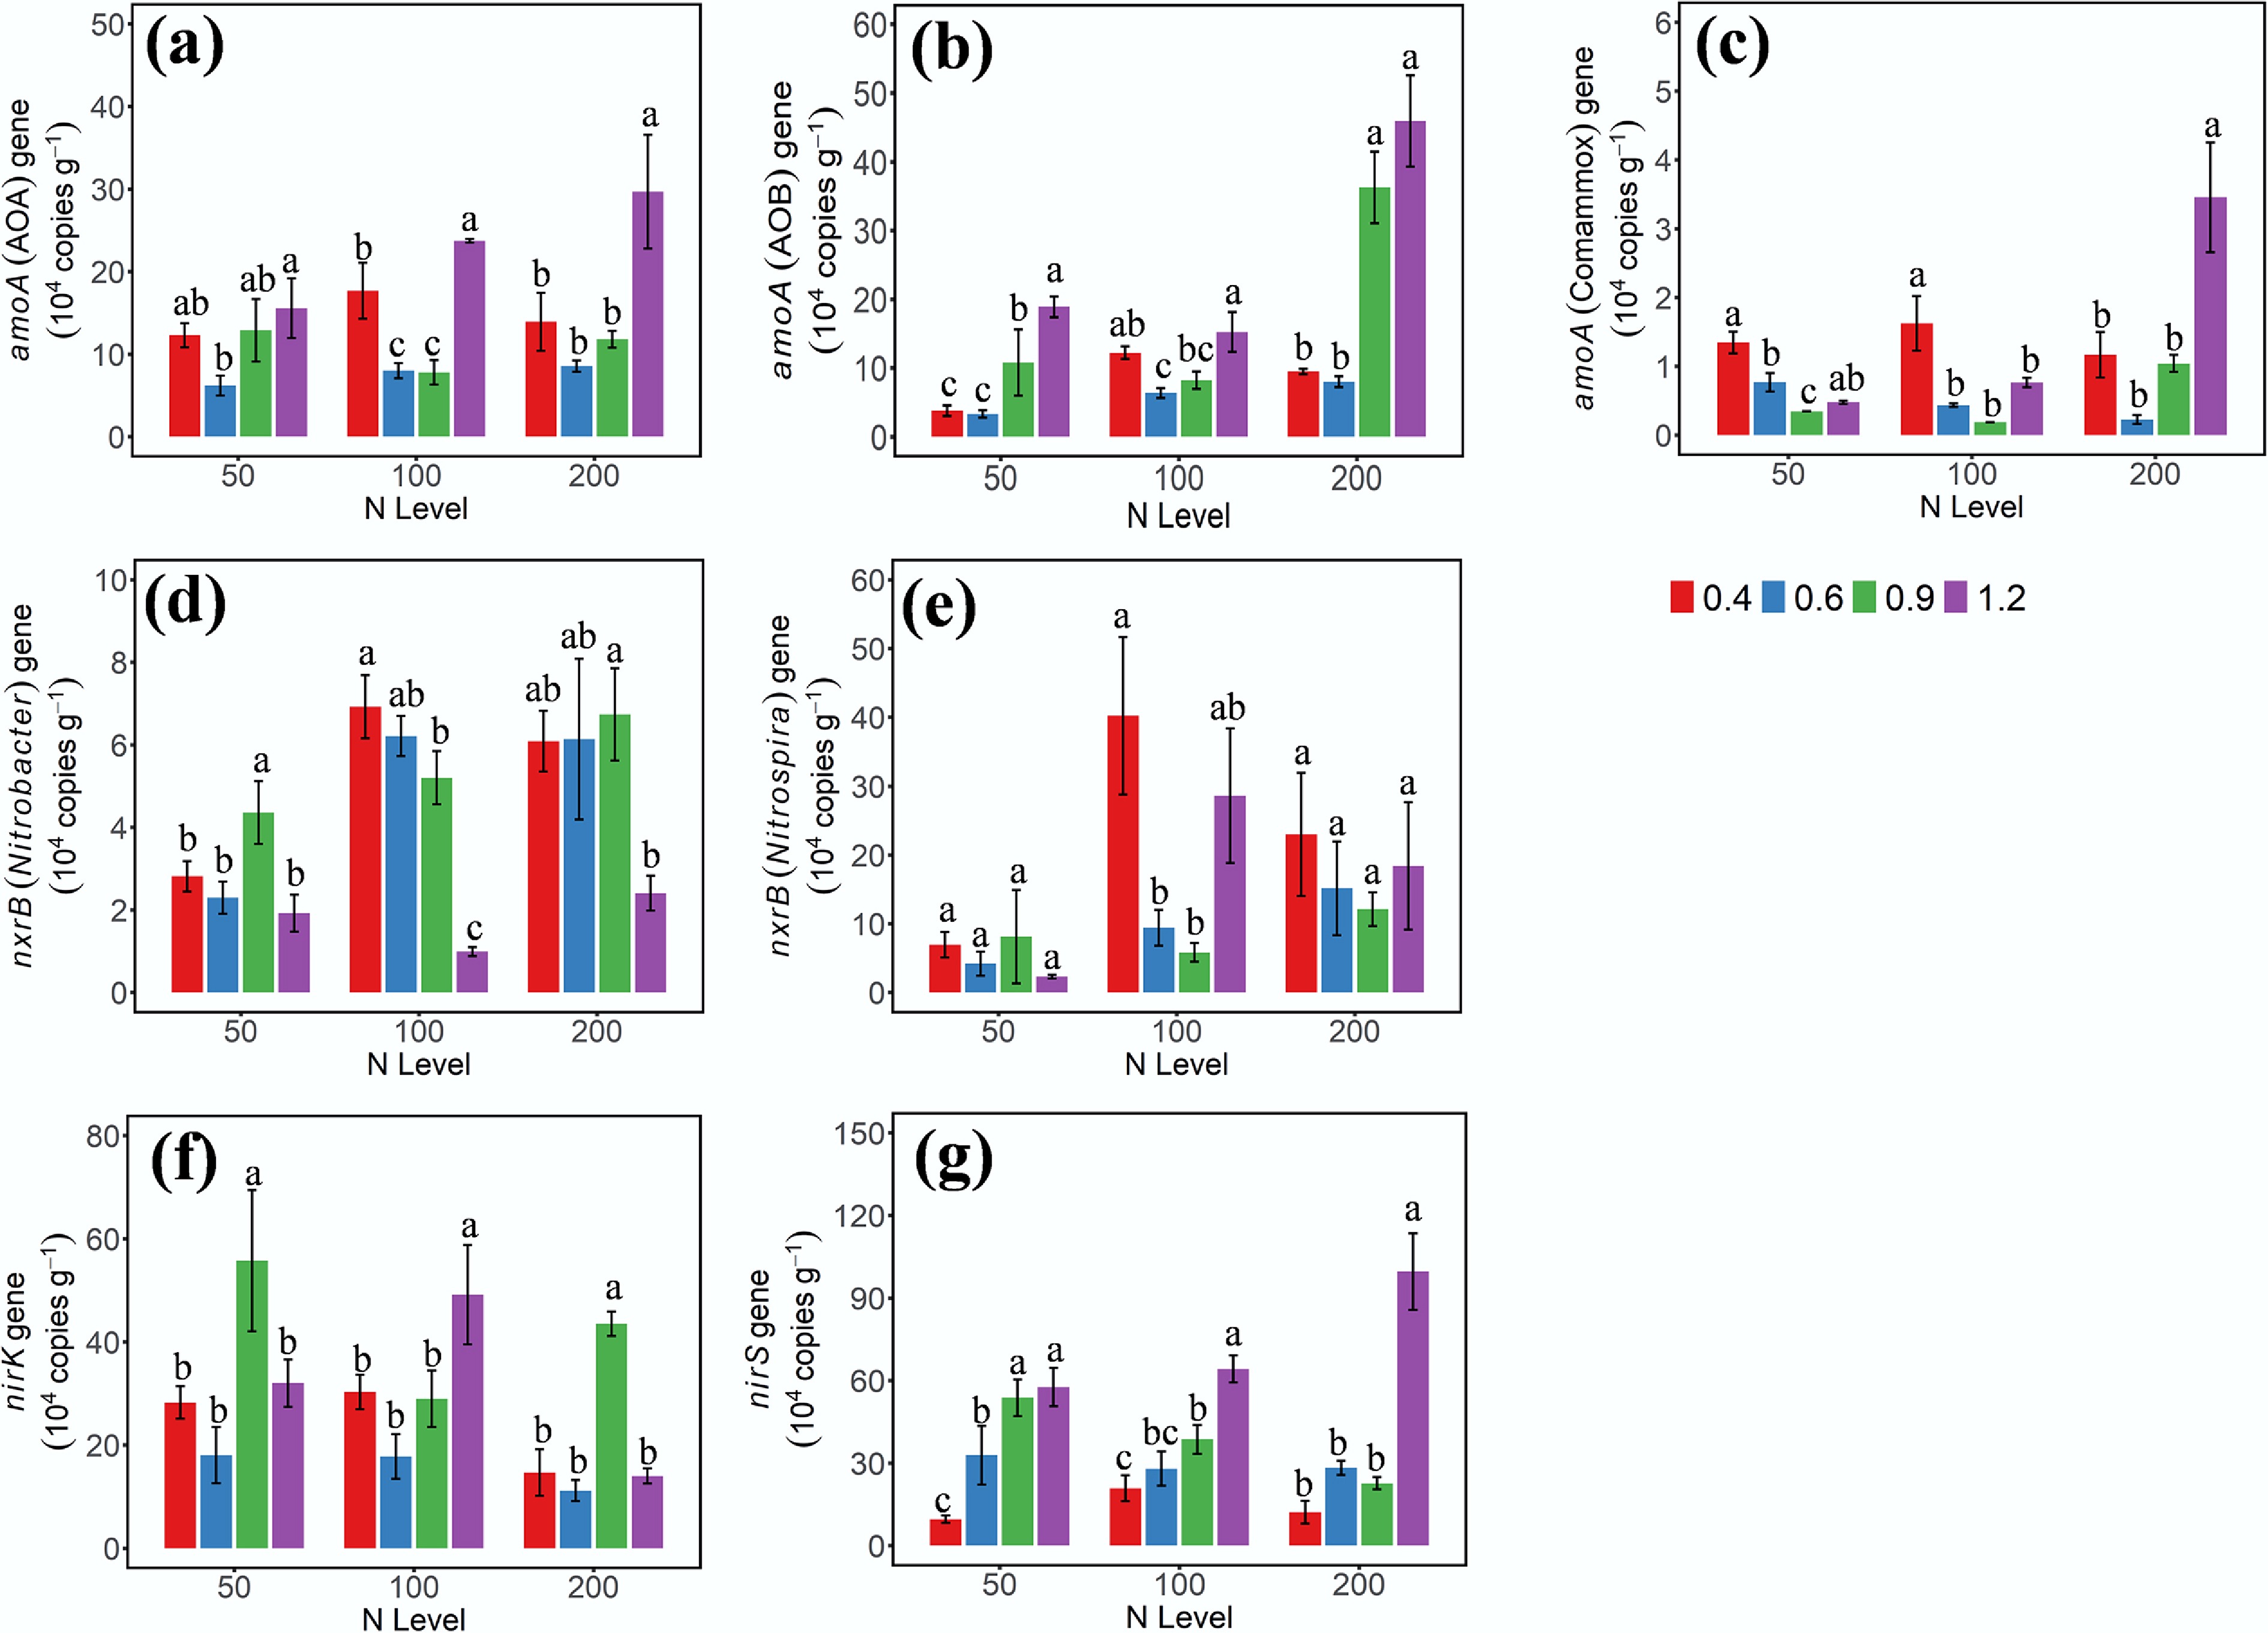
Figure 2.
Gene abundances of (a) AOA-amoA, (b) AOB-amoA, (c) amoA-comammox, (d) nxrB-Nitrobacter, (e) nxrB-Nitrospira, (f) nirK, and (g) nirS on day 3 under different soil moisture and N treatments. 0.4, 0.6, 0.9, and 1.2 represent W1, W2, W3, and W4 WHC, respectively. Error bars indicate standard deviations (n = 3). Different lowercase letters indicate significant differences (p < 0.05) between moisture content treatments within the same N application level.
-
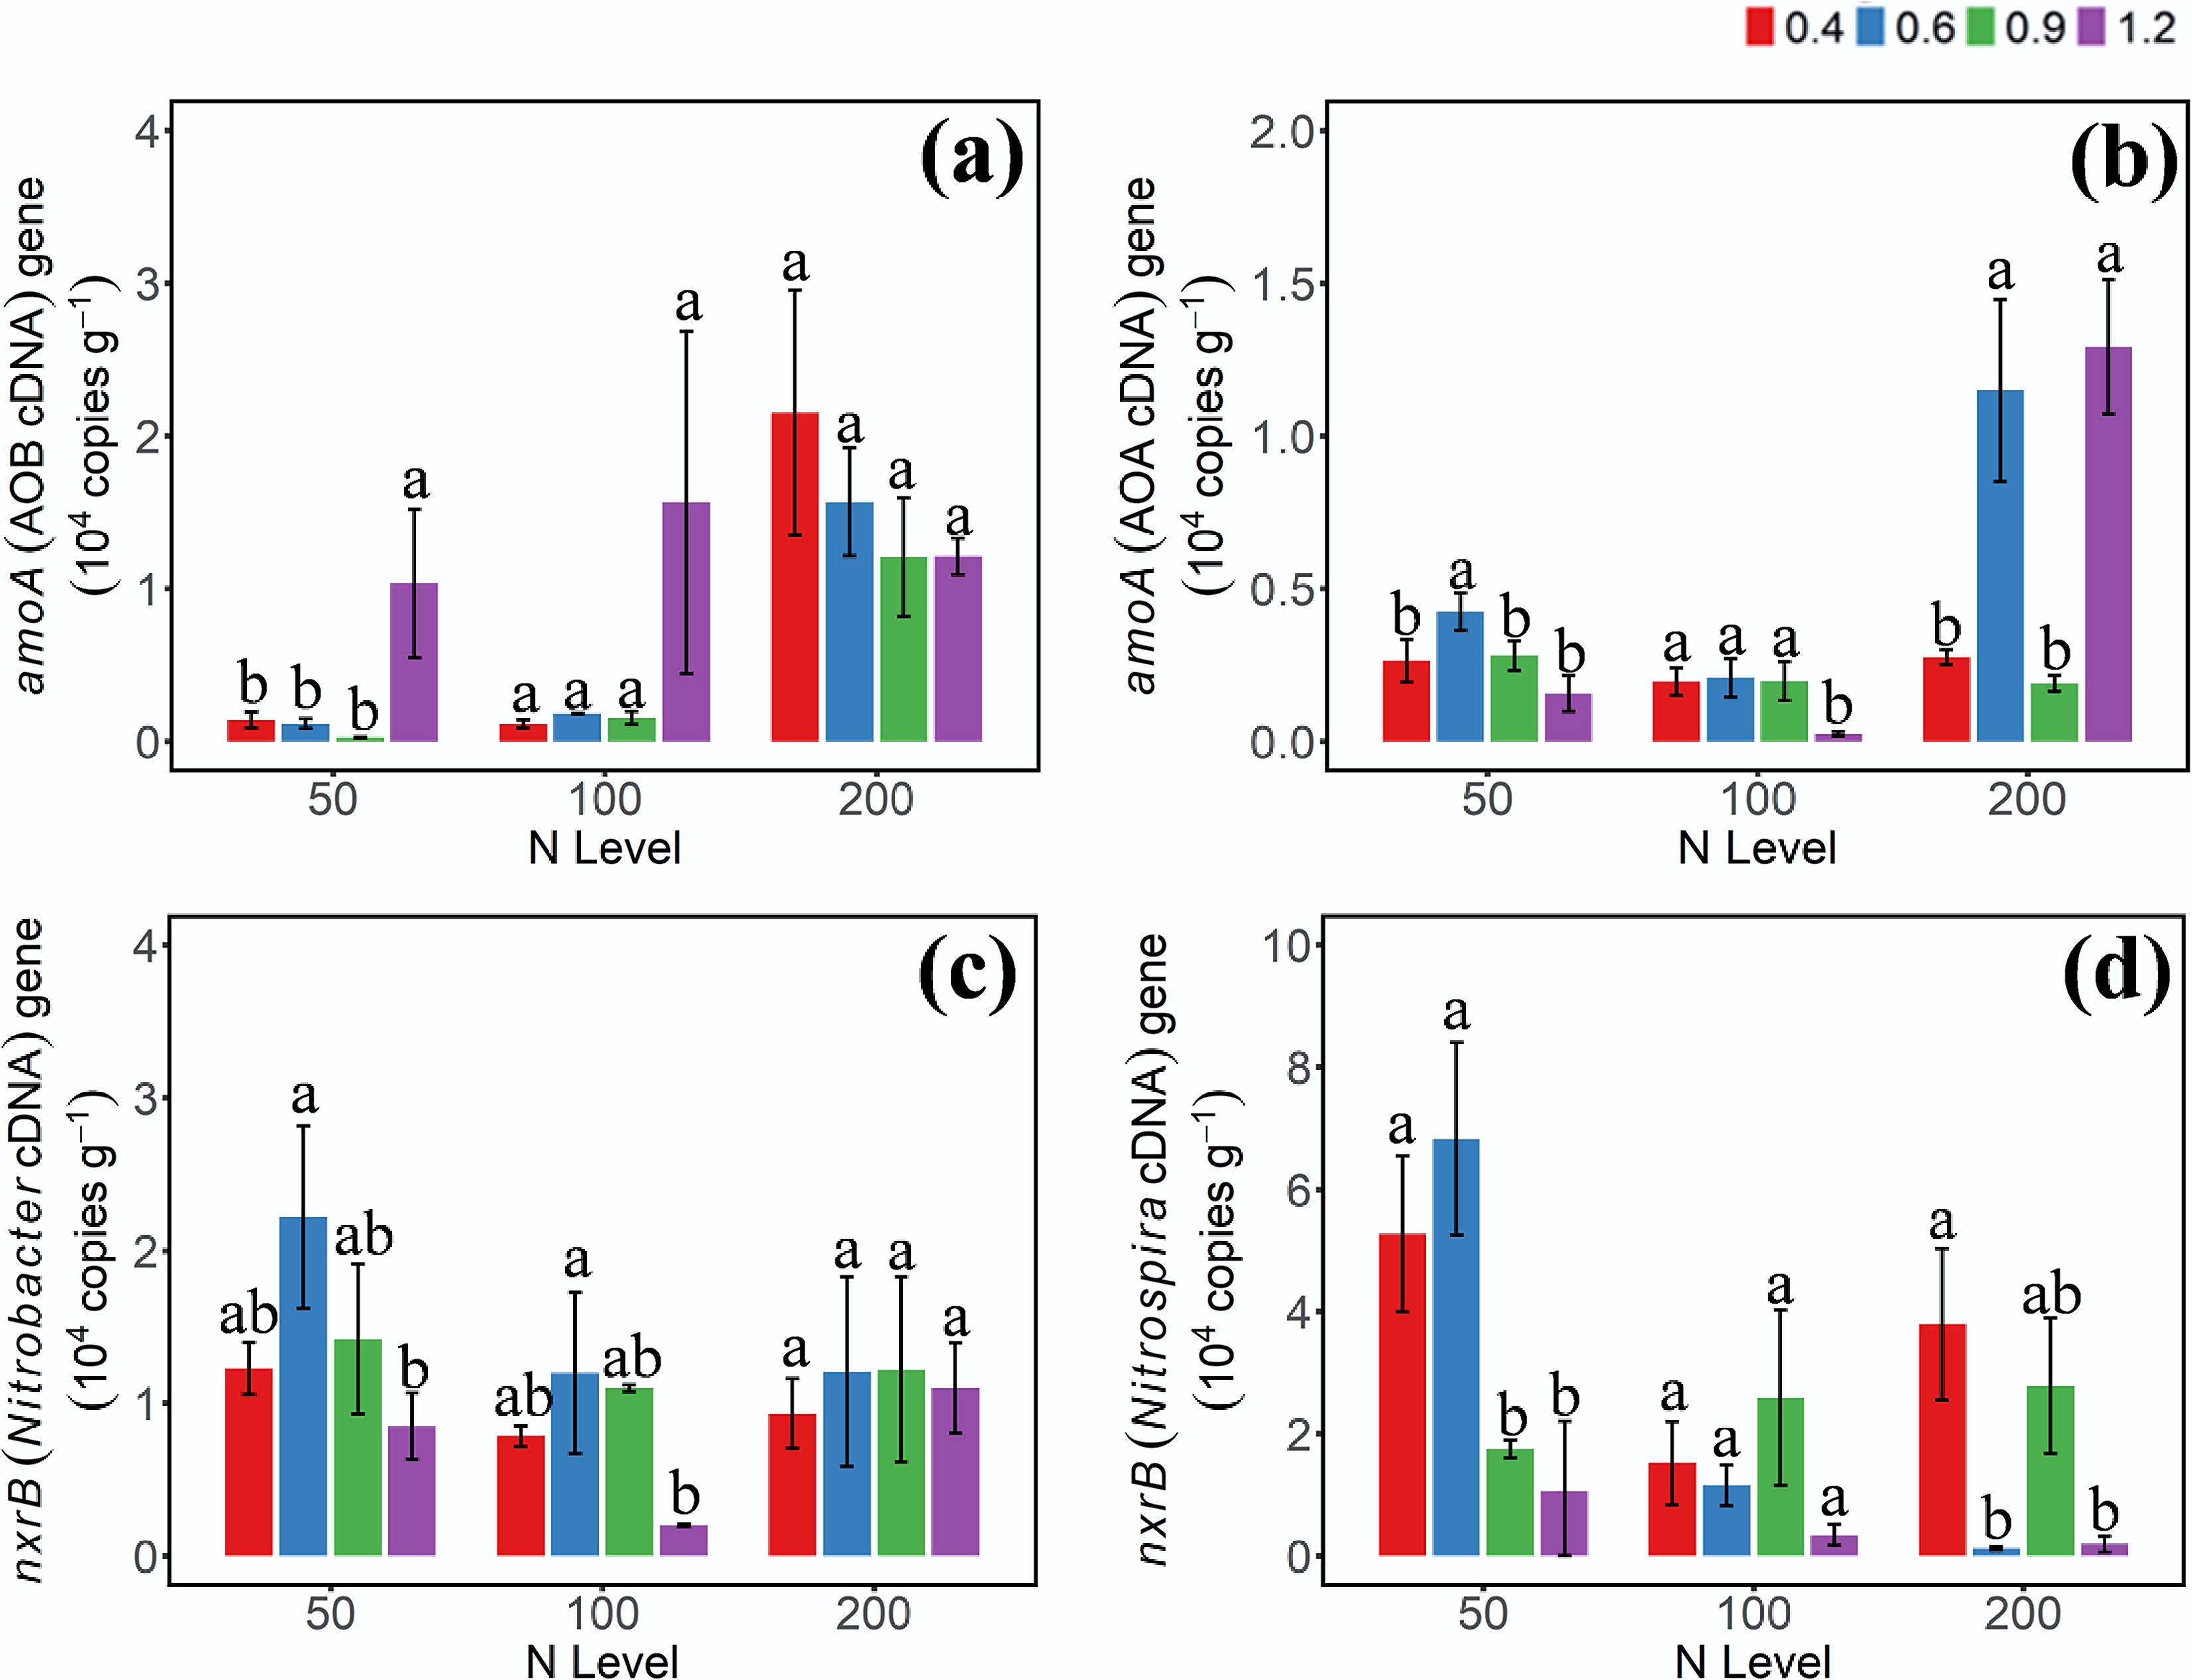
Figure 3.
Gene abundances of (a) AOB-amoA, (b) AOA-amoA, (c) Nitrobacter-nxrB, and (d) Nitrospira-nxrB cDNA on day 3 under different moisture and N addition treatments. 0.4, 0.6, 0.9, 1.2 represent W1, W2, W3, and W4 WHC, respectively. Error bars indicate standard deviations (n = 3). Different lowercase letters indicate significant differences (p < 0.05) between moisture content treatments within the same N application level.
-
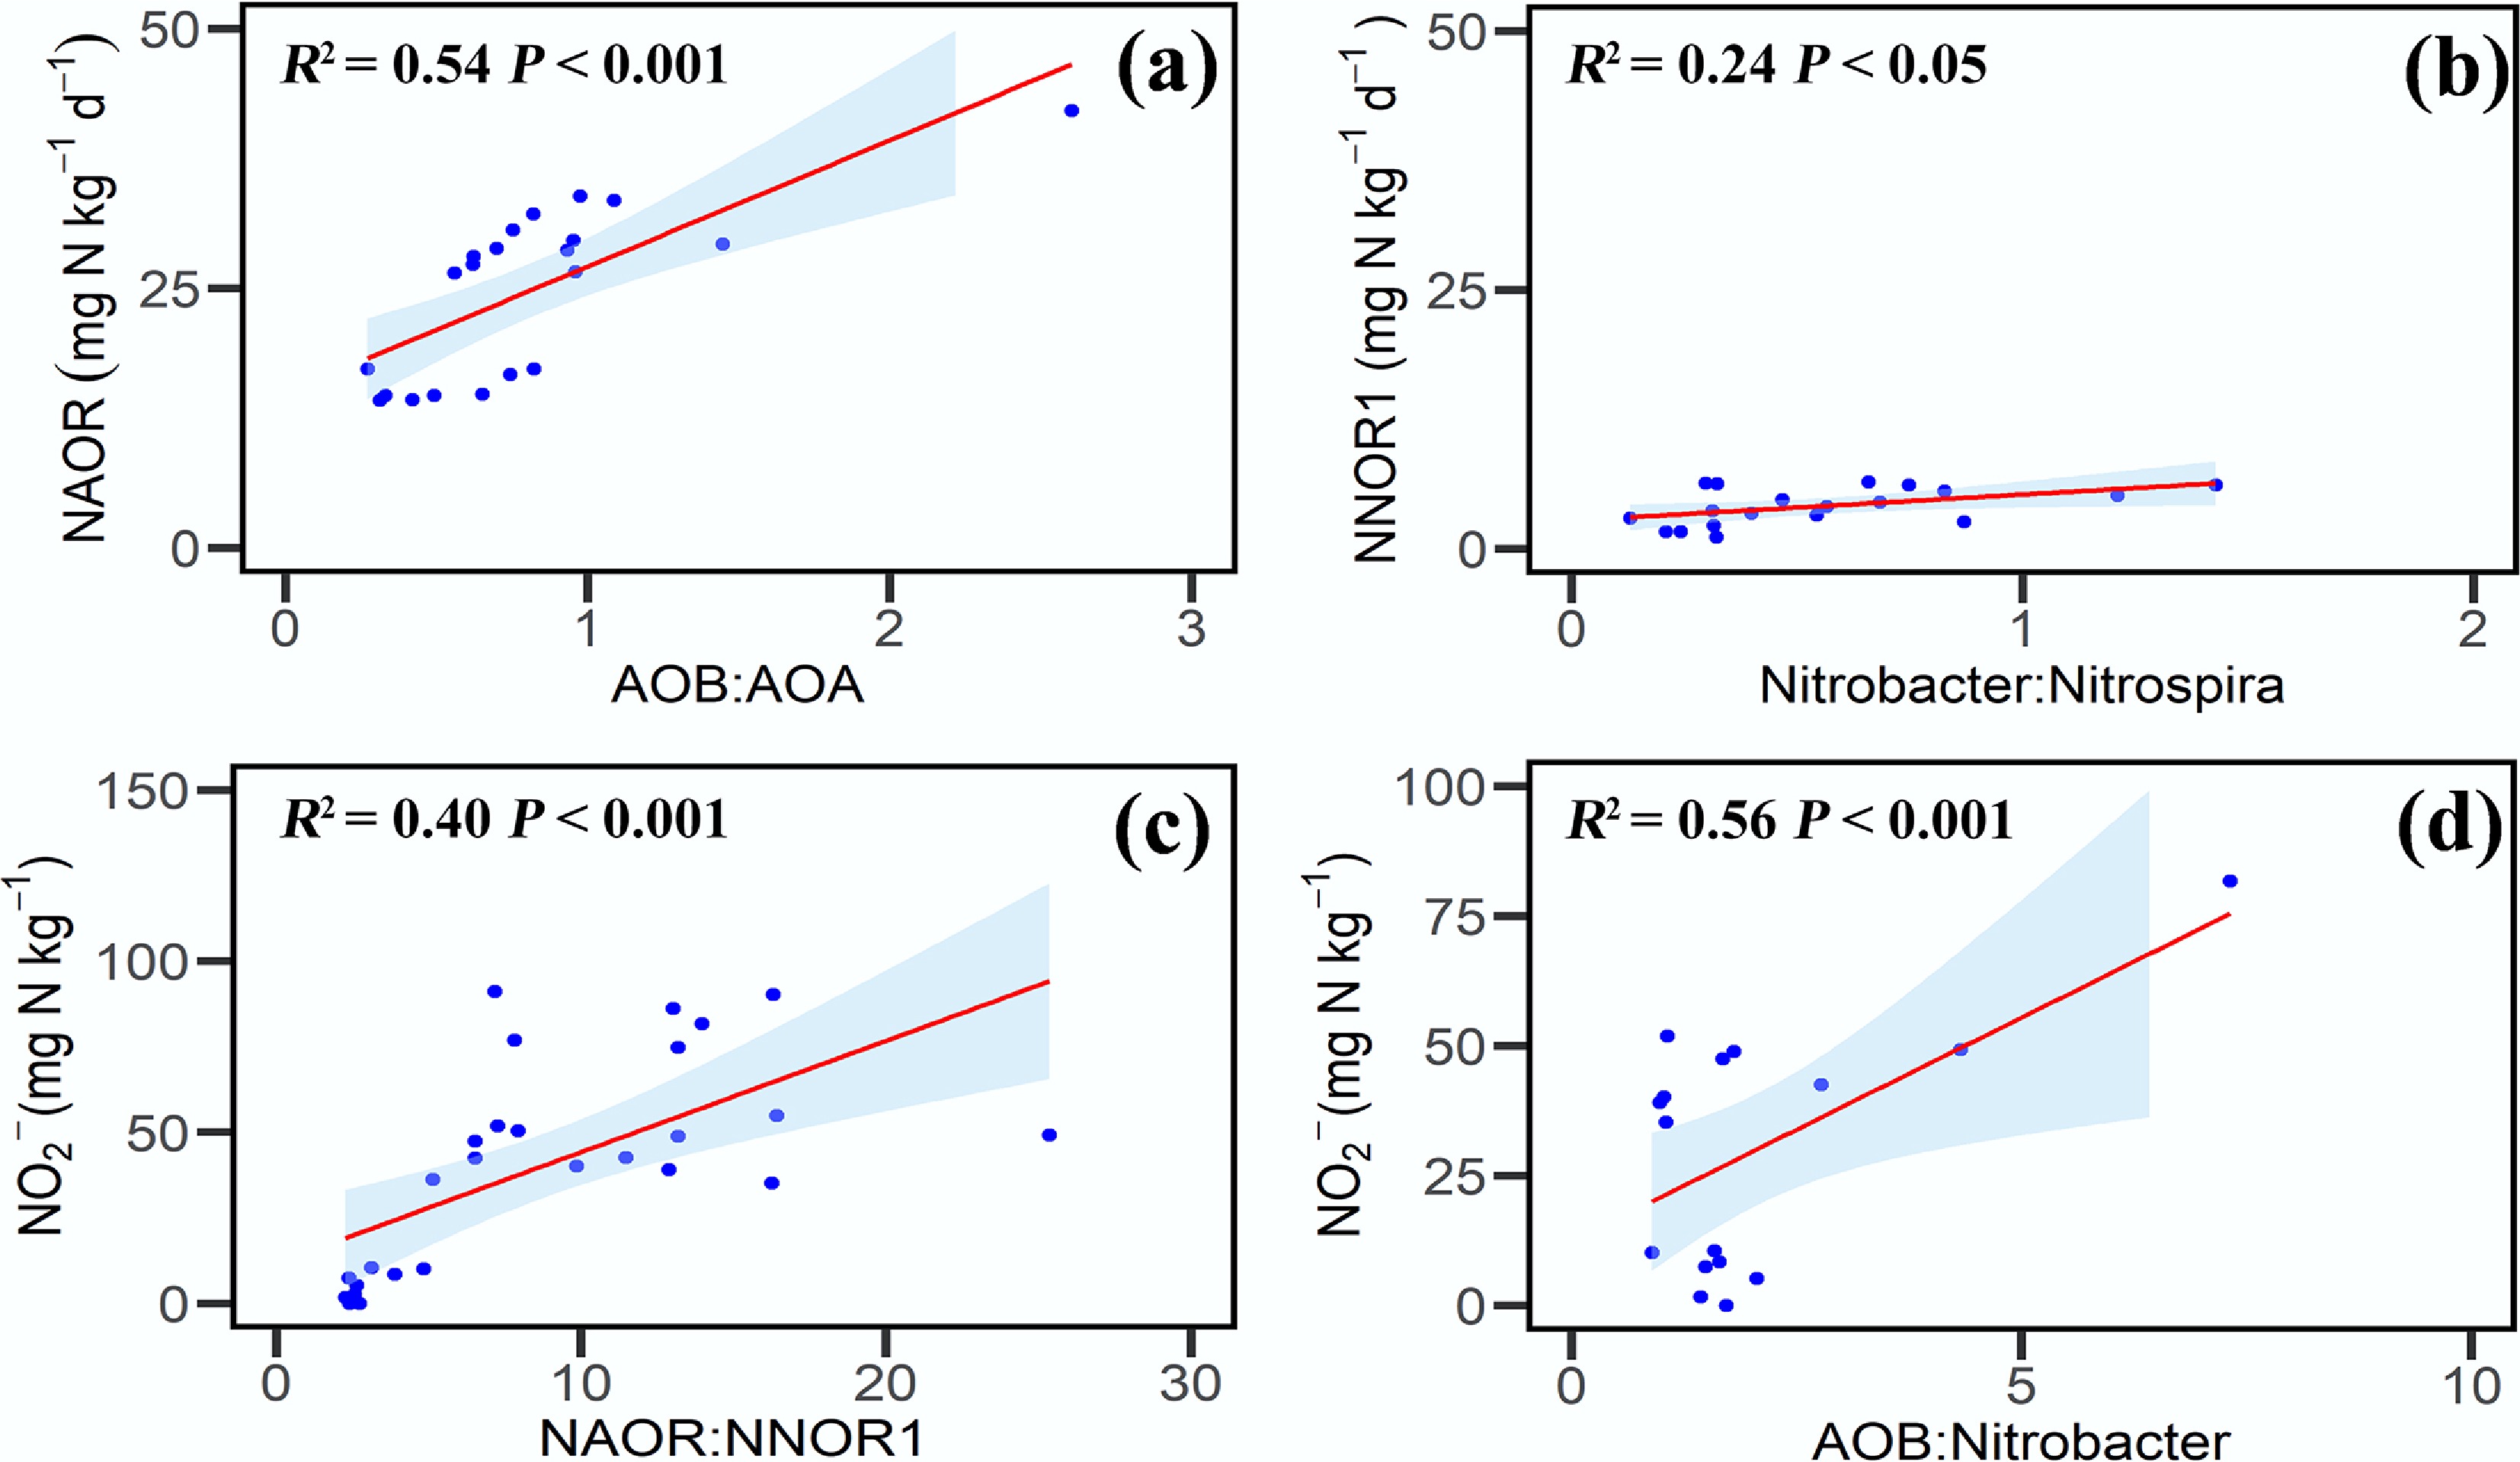
Figure 4.
Relationships between net nitrification rate, nitrite concentration, and gene abundance. (a) NAOR and the AOB : AOA gene abundance ratio. (b) NNOR1 and the Nitrobacter : Nitrospira ratio. (c) NO2− concentration and the NAOR:NNOR1 ratio. (d) NO2− concentration and the AOB : Nitrobacter ratio. Symbols represent individual soil samples; lines denote significant correlations; and asterisks indicate statistically significant correlations (p < 0.05). Abbreviations: NAOR is the net ammonia oxidation rate from day 0 to 3; NNOR1 is the NO2− oxidation rate from day 0 to 3.
-
Gene Primer Sequence (5'-3') Amplicon size [bp] Ref. Archaeal amoA Amo19F STAATGGTCTGGCTTAGACG 635 Leininger et al. [45]; Schauss et al.[46] CrenamoA6 GCGGCCATCTGTATGT Bacterial amoA amo41F GGGGTTTCTACTGGTGGT 491 Rotthauwe et al.[47] amoA2R CCCCTCGGGAAGGCTTTTC Nitrobacter-like nxrB nxrB-1F ACGTGGAGACCAAGCCGGG 411 Vanparys et al.[48] nxrB-1R CCGTGCTGTTGAYCTGTTGA Nitrospira-like nxrB nxrB169f TACATGGTGTGGAACA 485 Pester et al.[49] nxrB638r CGGTTCTTGGTCRATCA Comammox amoA ComamoAF AGGNGAYTGGGAYYTTCGG 436 Wang et al.[50] ComamoAR CGGACAWABRTGAABCCCAT nirK copper583F TCATGGTGCTGCGCGKGACGG 326 Yan et al.[51] copper909R GAACTTGCCGGTKGCCCAGAC nirS heme832F TCACACCCCGAGCCGCGCGT 774 Yan et al.[51] heme1606R AGKCGTTGAACTTKCCGGTCGG Table 1.
Primers used for quantitative real-time PCR (qPCR) analysis
Figures
(4)
Tables
(1)