-
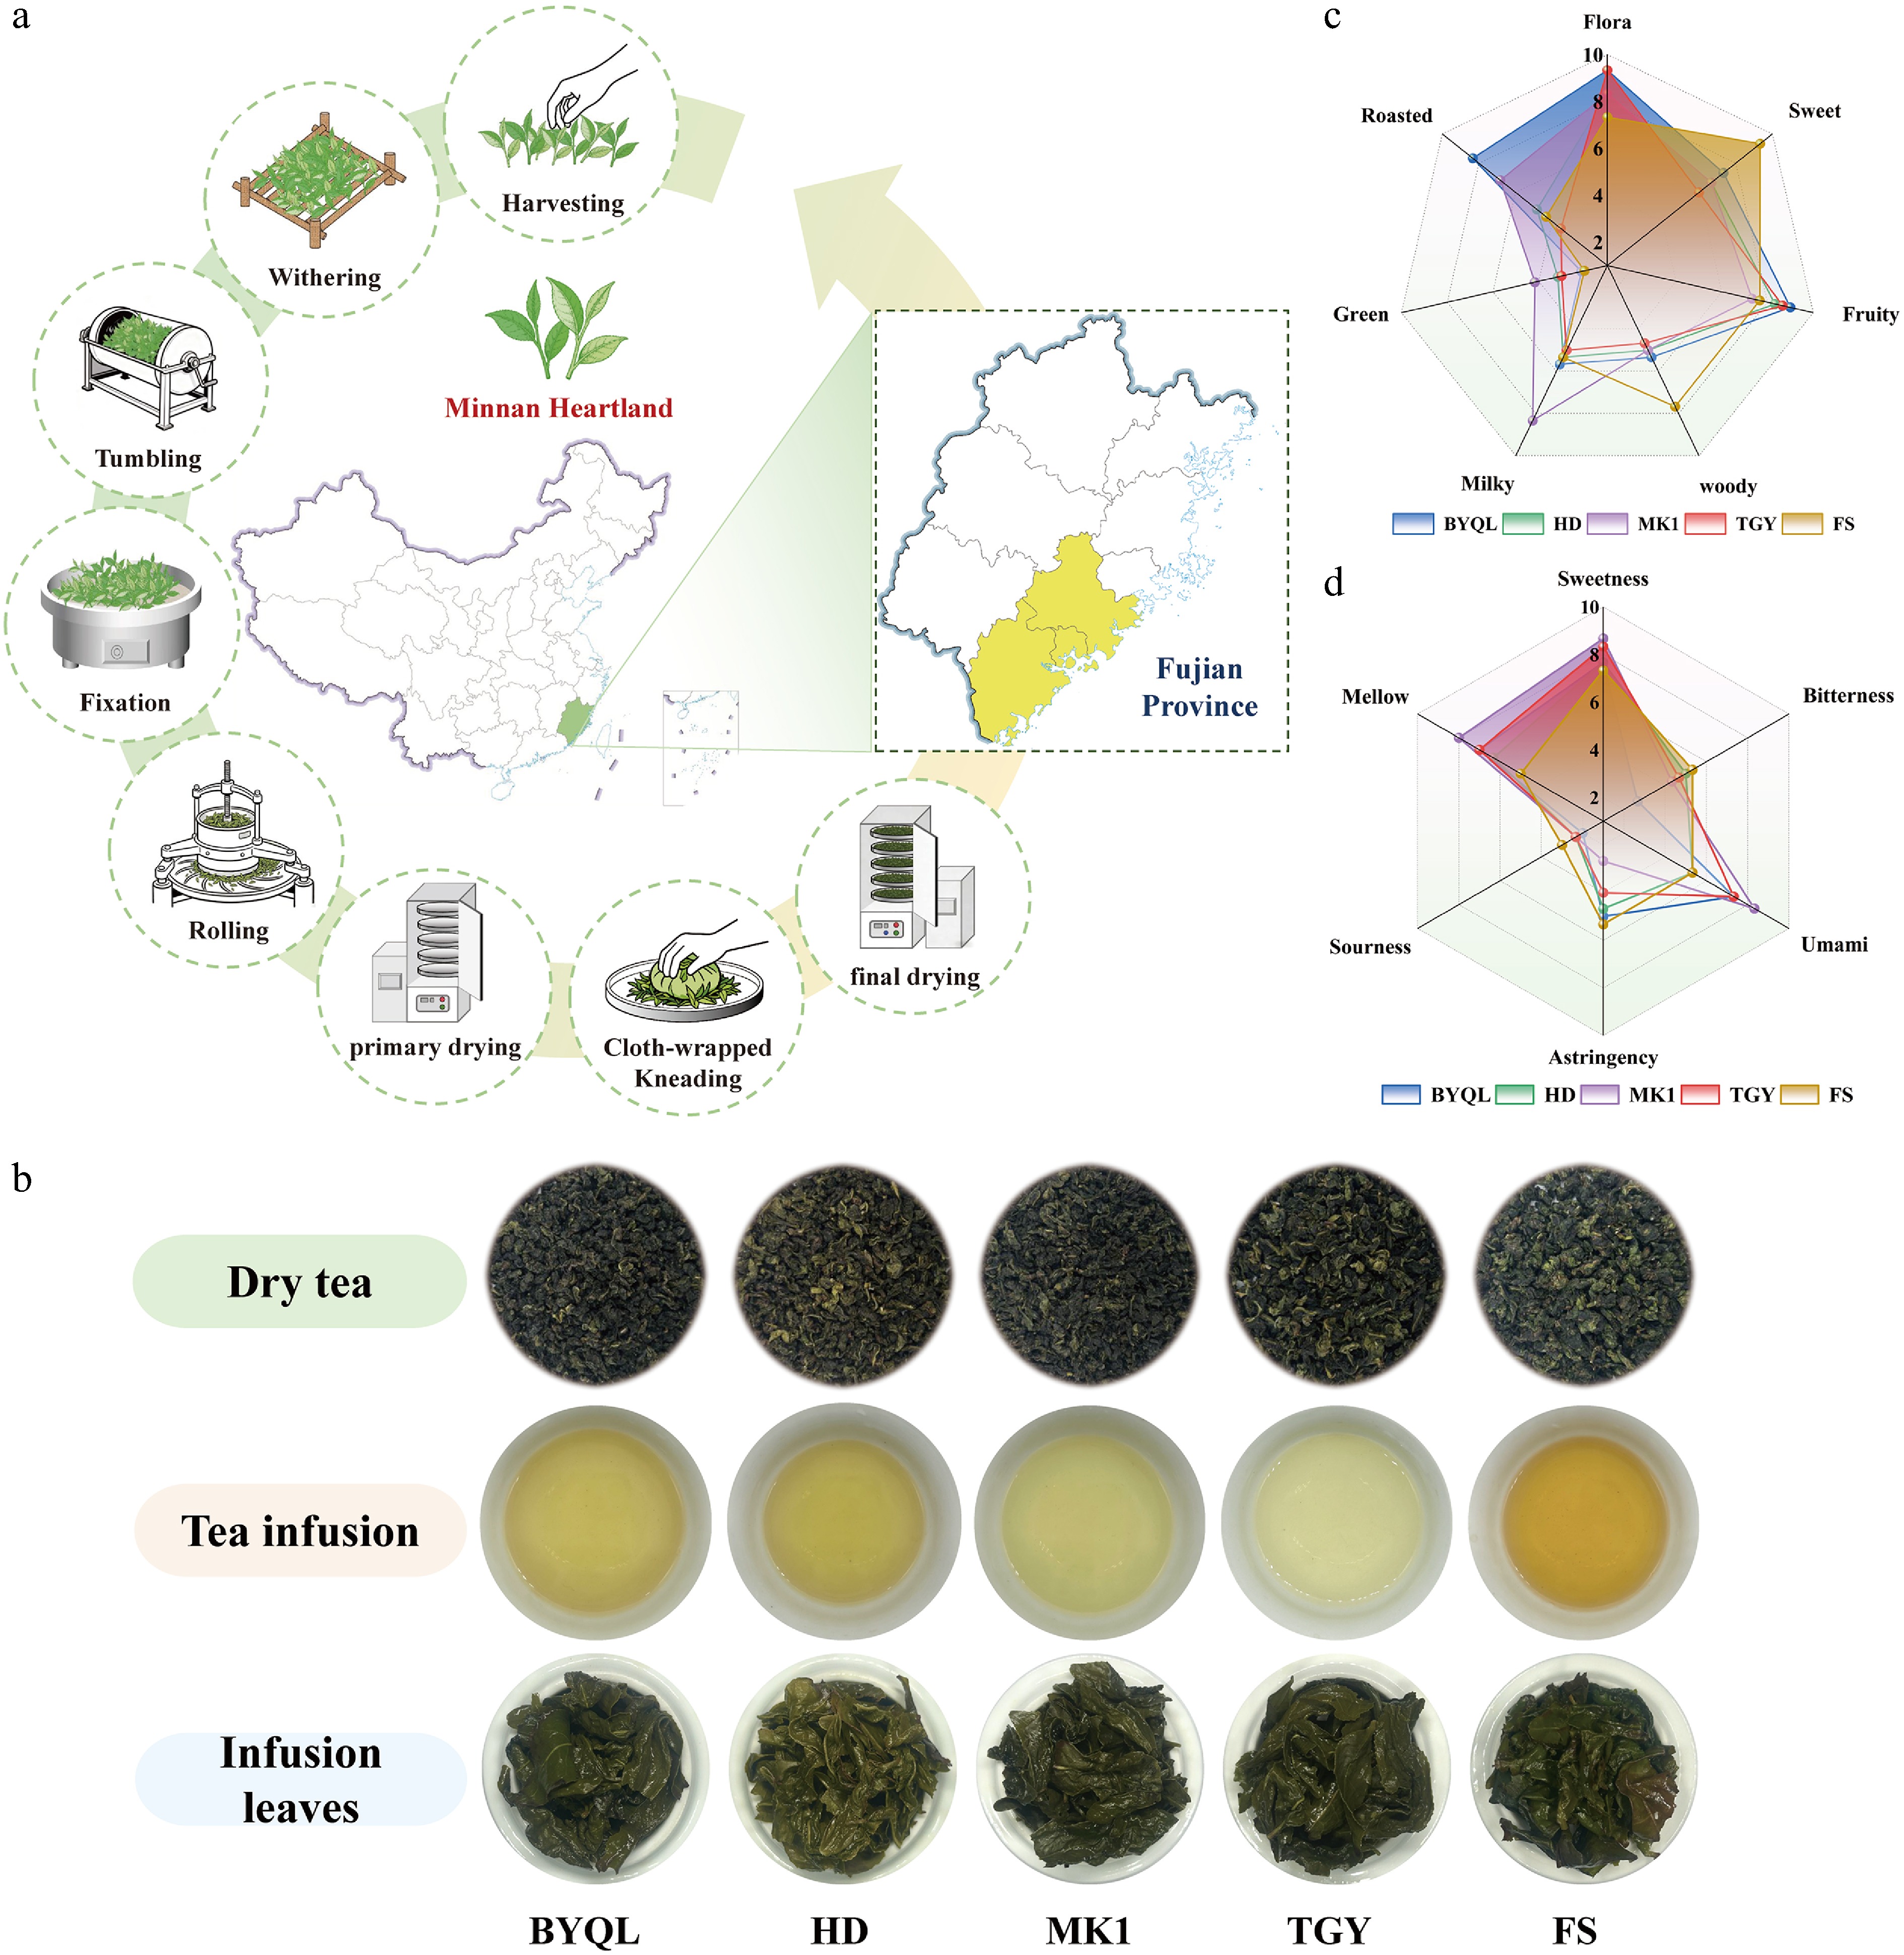
Figure 1.
Origin, processing, appearance, and sensory fingerprints of five Minnan oolong tea cultivars. (a) Geographical origins of fresh tea leaves and the streamlined manufacturing process for the five Minnan oolong tea samples. The base maps were downloaded from the Standard Map Service system under review numbers GS(2019)1837, and Min S(2025)166; no modifications have been made to either map. (b) Visual characteristics of dry tea leaves, liquor color, and infused leaves of the five Minnan oolong tea samples. (c), (d) Quantitative descriptive analysis of taste and aroma, respectively. Data points represent the mean ± standard error (mean ± SE, n = 7) from a seven-member sensory panel.
-
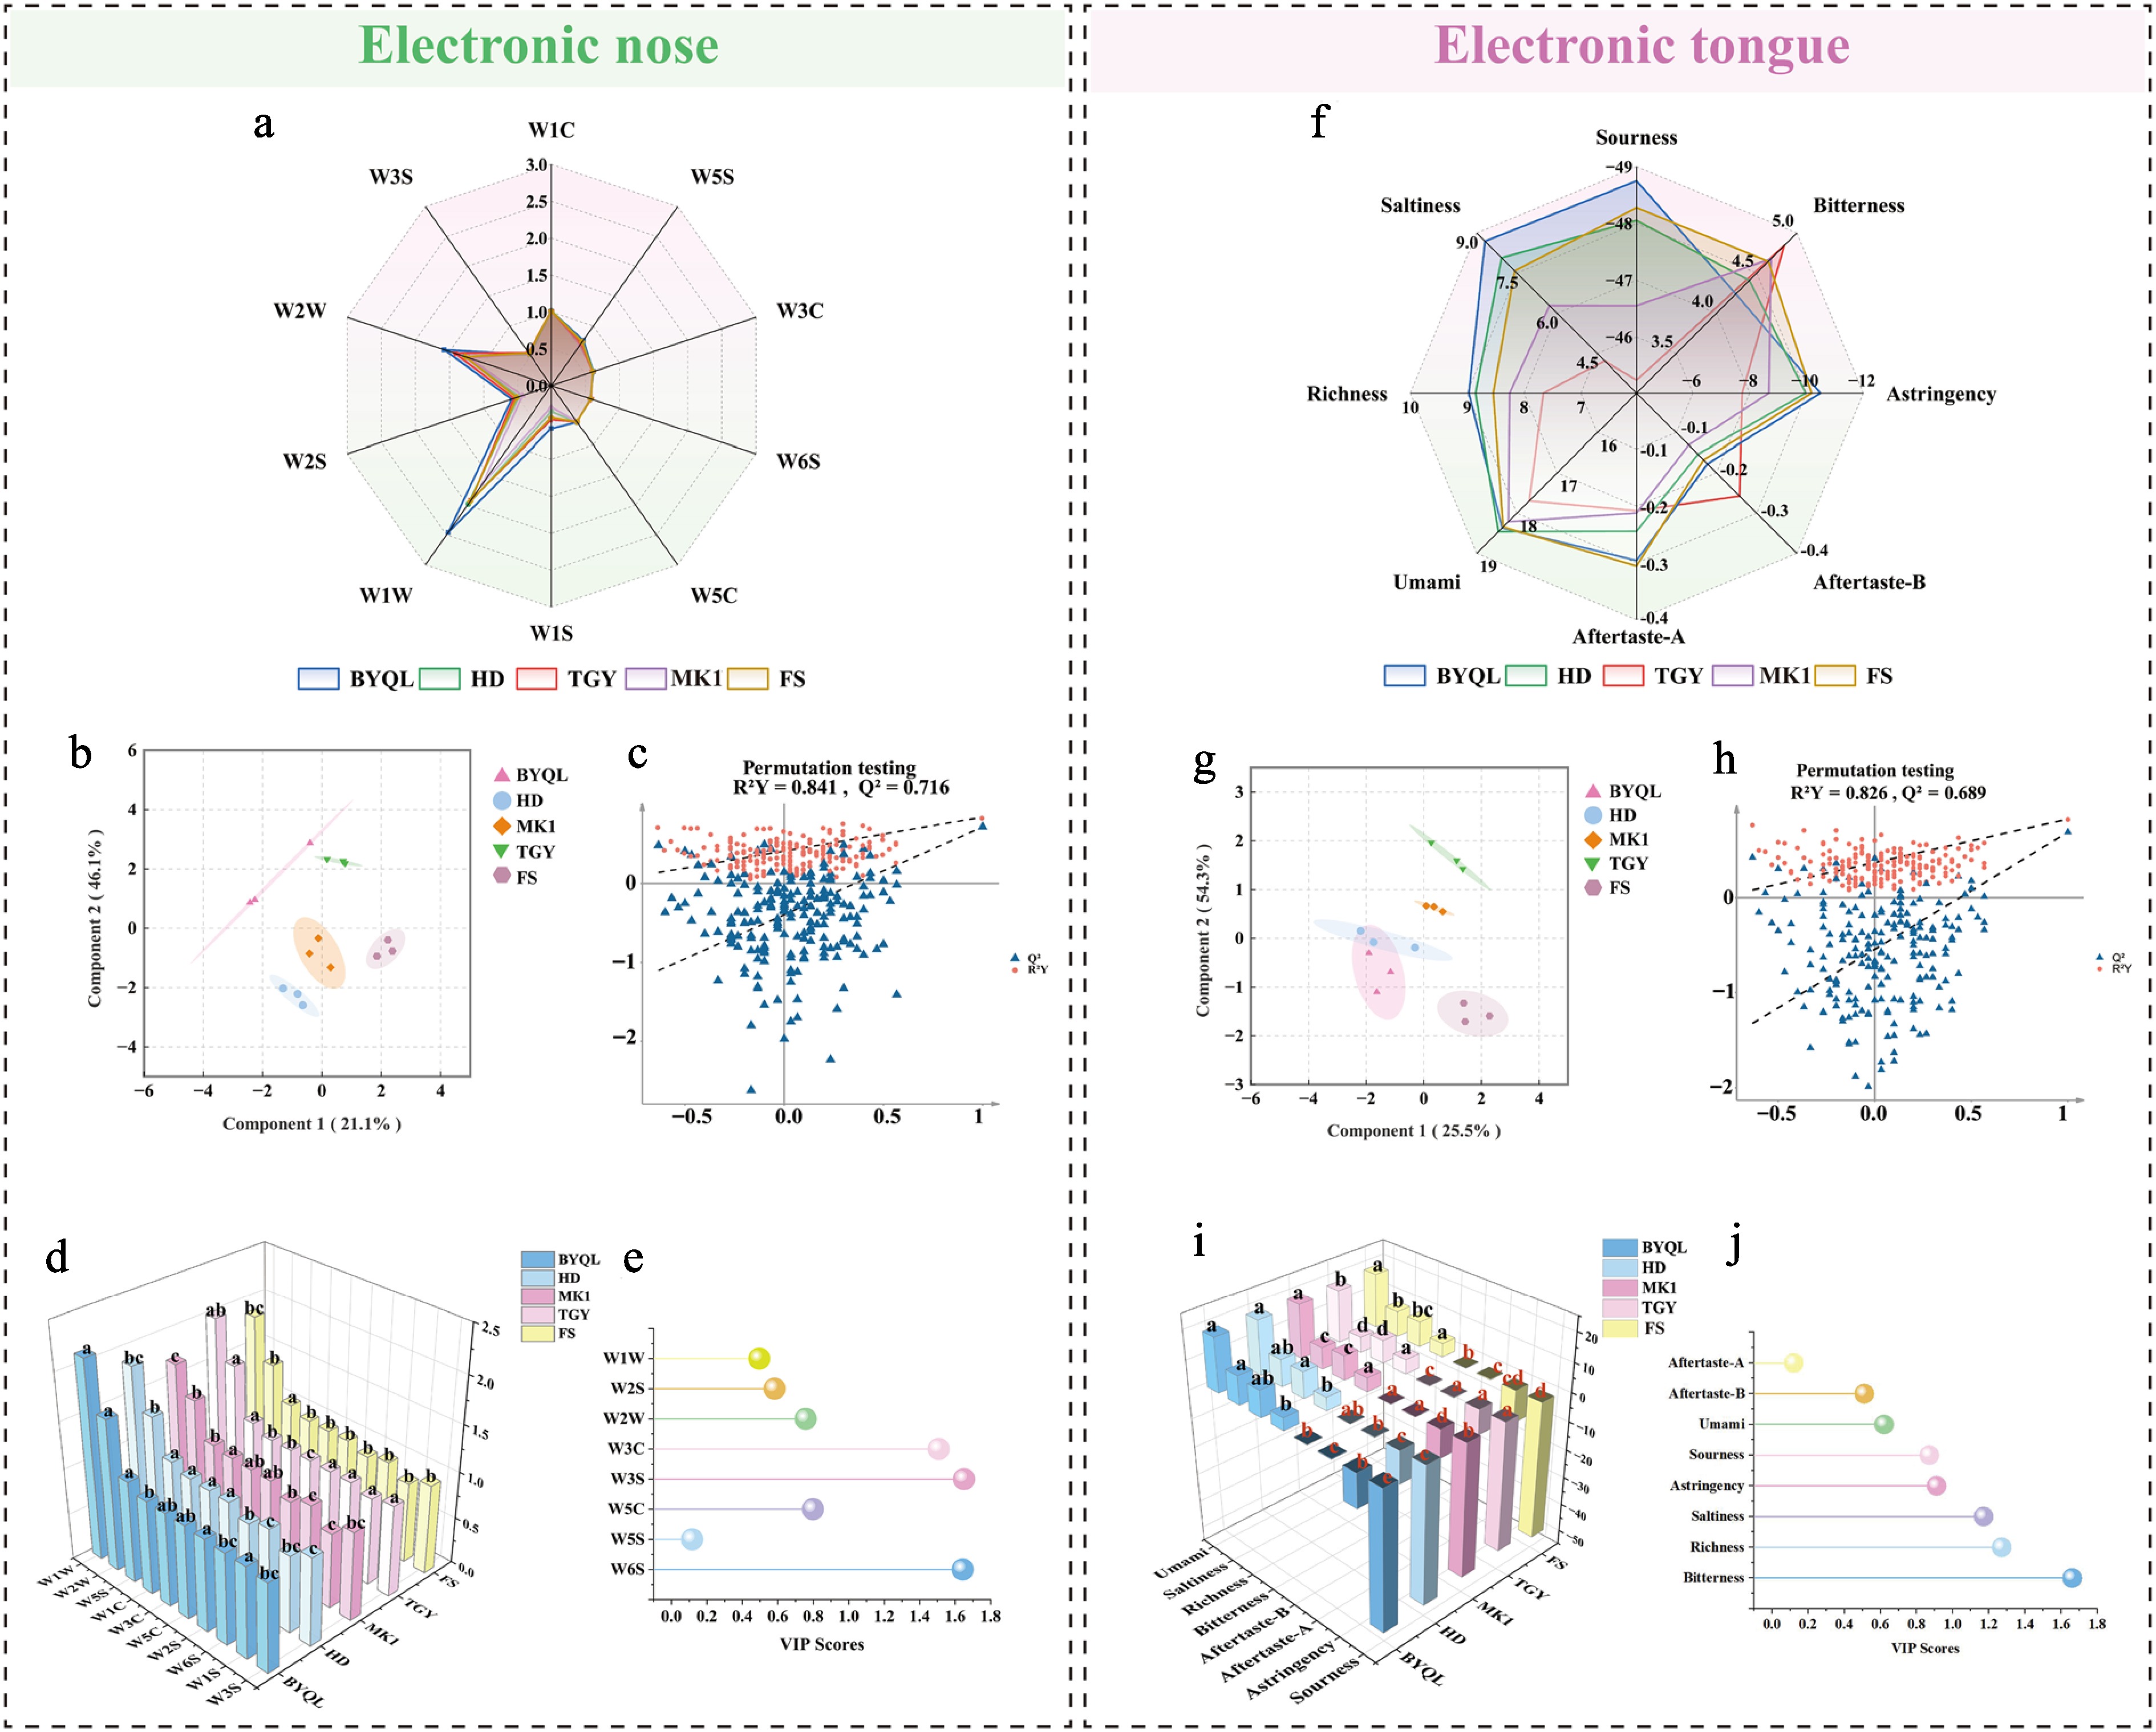
Figure 2.
Electronic sensory profiles and multivariate analysis of Minnan oolong tea varieties. (a) Radar chart of E-nose sensor responses. (b) OPLS-DA score plot from e-nose data. (c) Permutation test plot of the E-nose OPLS-DA model (200 permutations, R2Y = 0.841, Q2 = 0.716). (d) E-nose sensor response values (different letters indicate significant differences at p < 0.05). (e) VIP scores from E-nose analysis. (f) Radar chart of E-tongue taste attributes. (g) OPLS-DA score plot from E-tongue data. (h) Permutation test plot of the E-tongue OPLS-DA model (200 permutations, R2Y = 0.826, Q2 = 0.689). (i) E-tongue sensor response values (different letters indicate significant differences at p < 0.05). (j) VIP scores from E-tongue analysis.
-
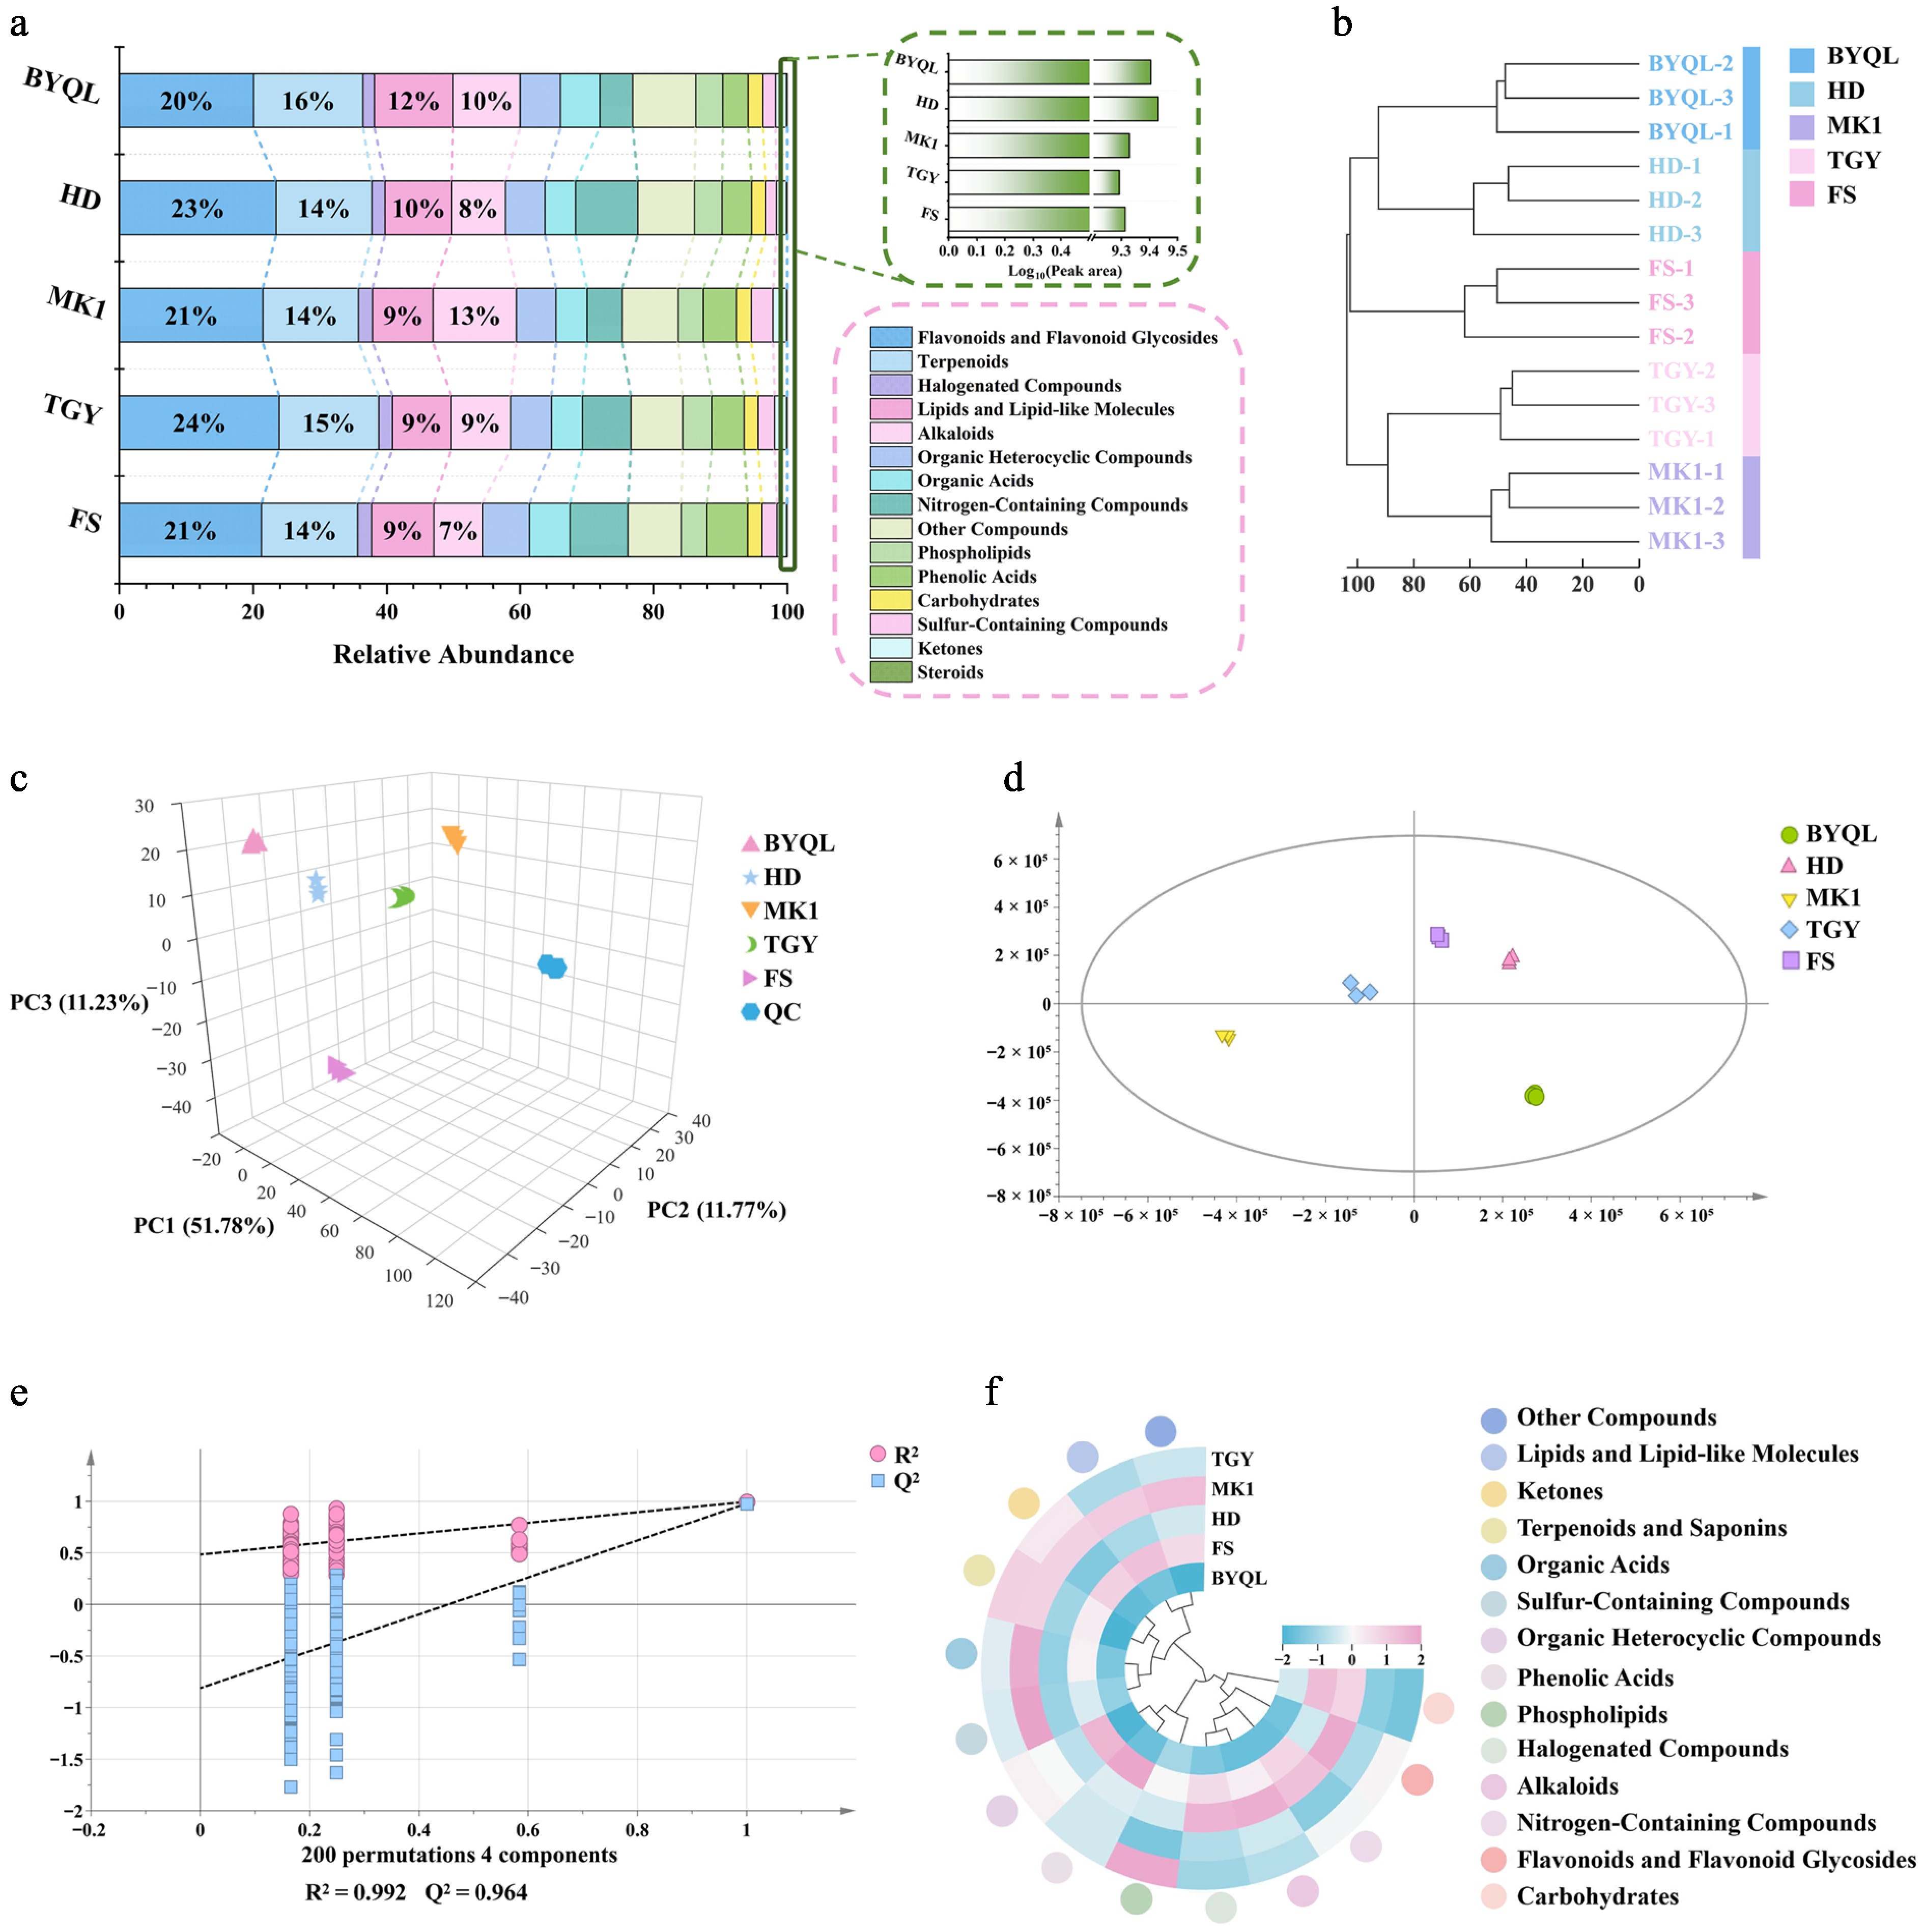
Figure 3.
Differential analysis of non-volatile compounds in tea samples based on non-targeted metabolomics. (a) Stacked bar plot showing the distribution of all identified non-volatile compounds across the five tea varieties. (b) Hierarchical clustering heatmap of samples based on metabolite profiles. (c) PCA score plot of non-volatile compounds from the five tea groups. (d) OPLS-DA score plot of non-volatile compounds from the five tea groups. (e) Permutation test plot (200 permutations, R2Y = 0.992, Q2 = 0.964). (f) Heatmap of differentially expressed non-volatile compounds (VIP > 1), with pink indicating high abundance and blue indicating low abundance.
-
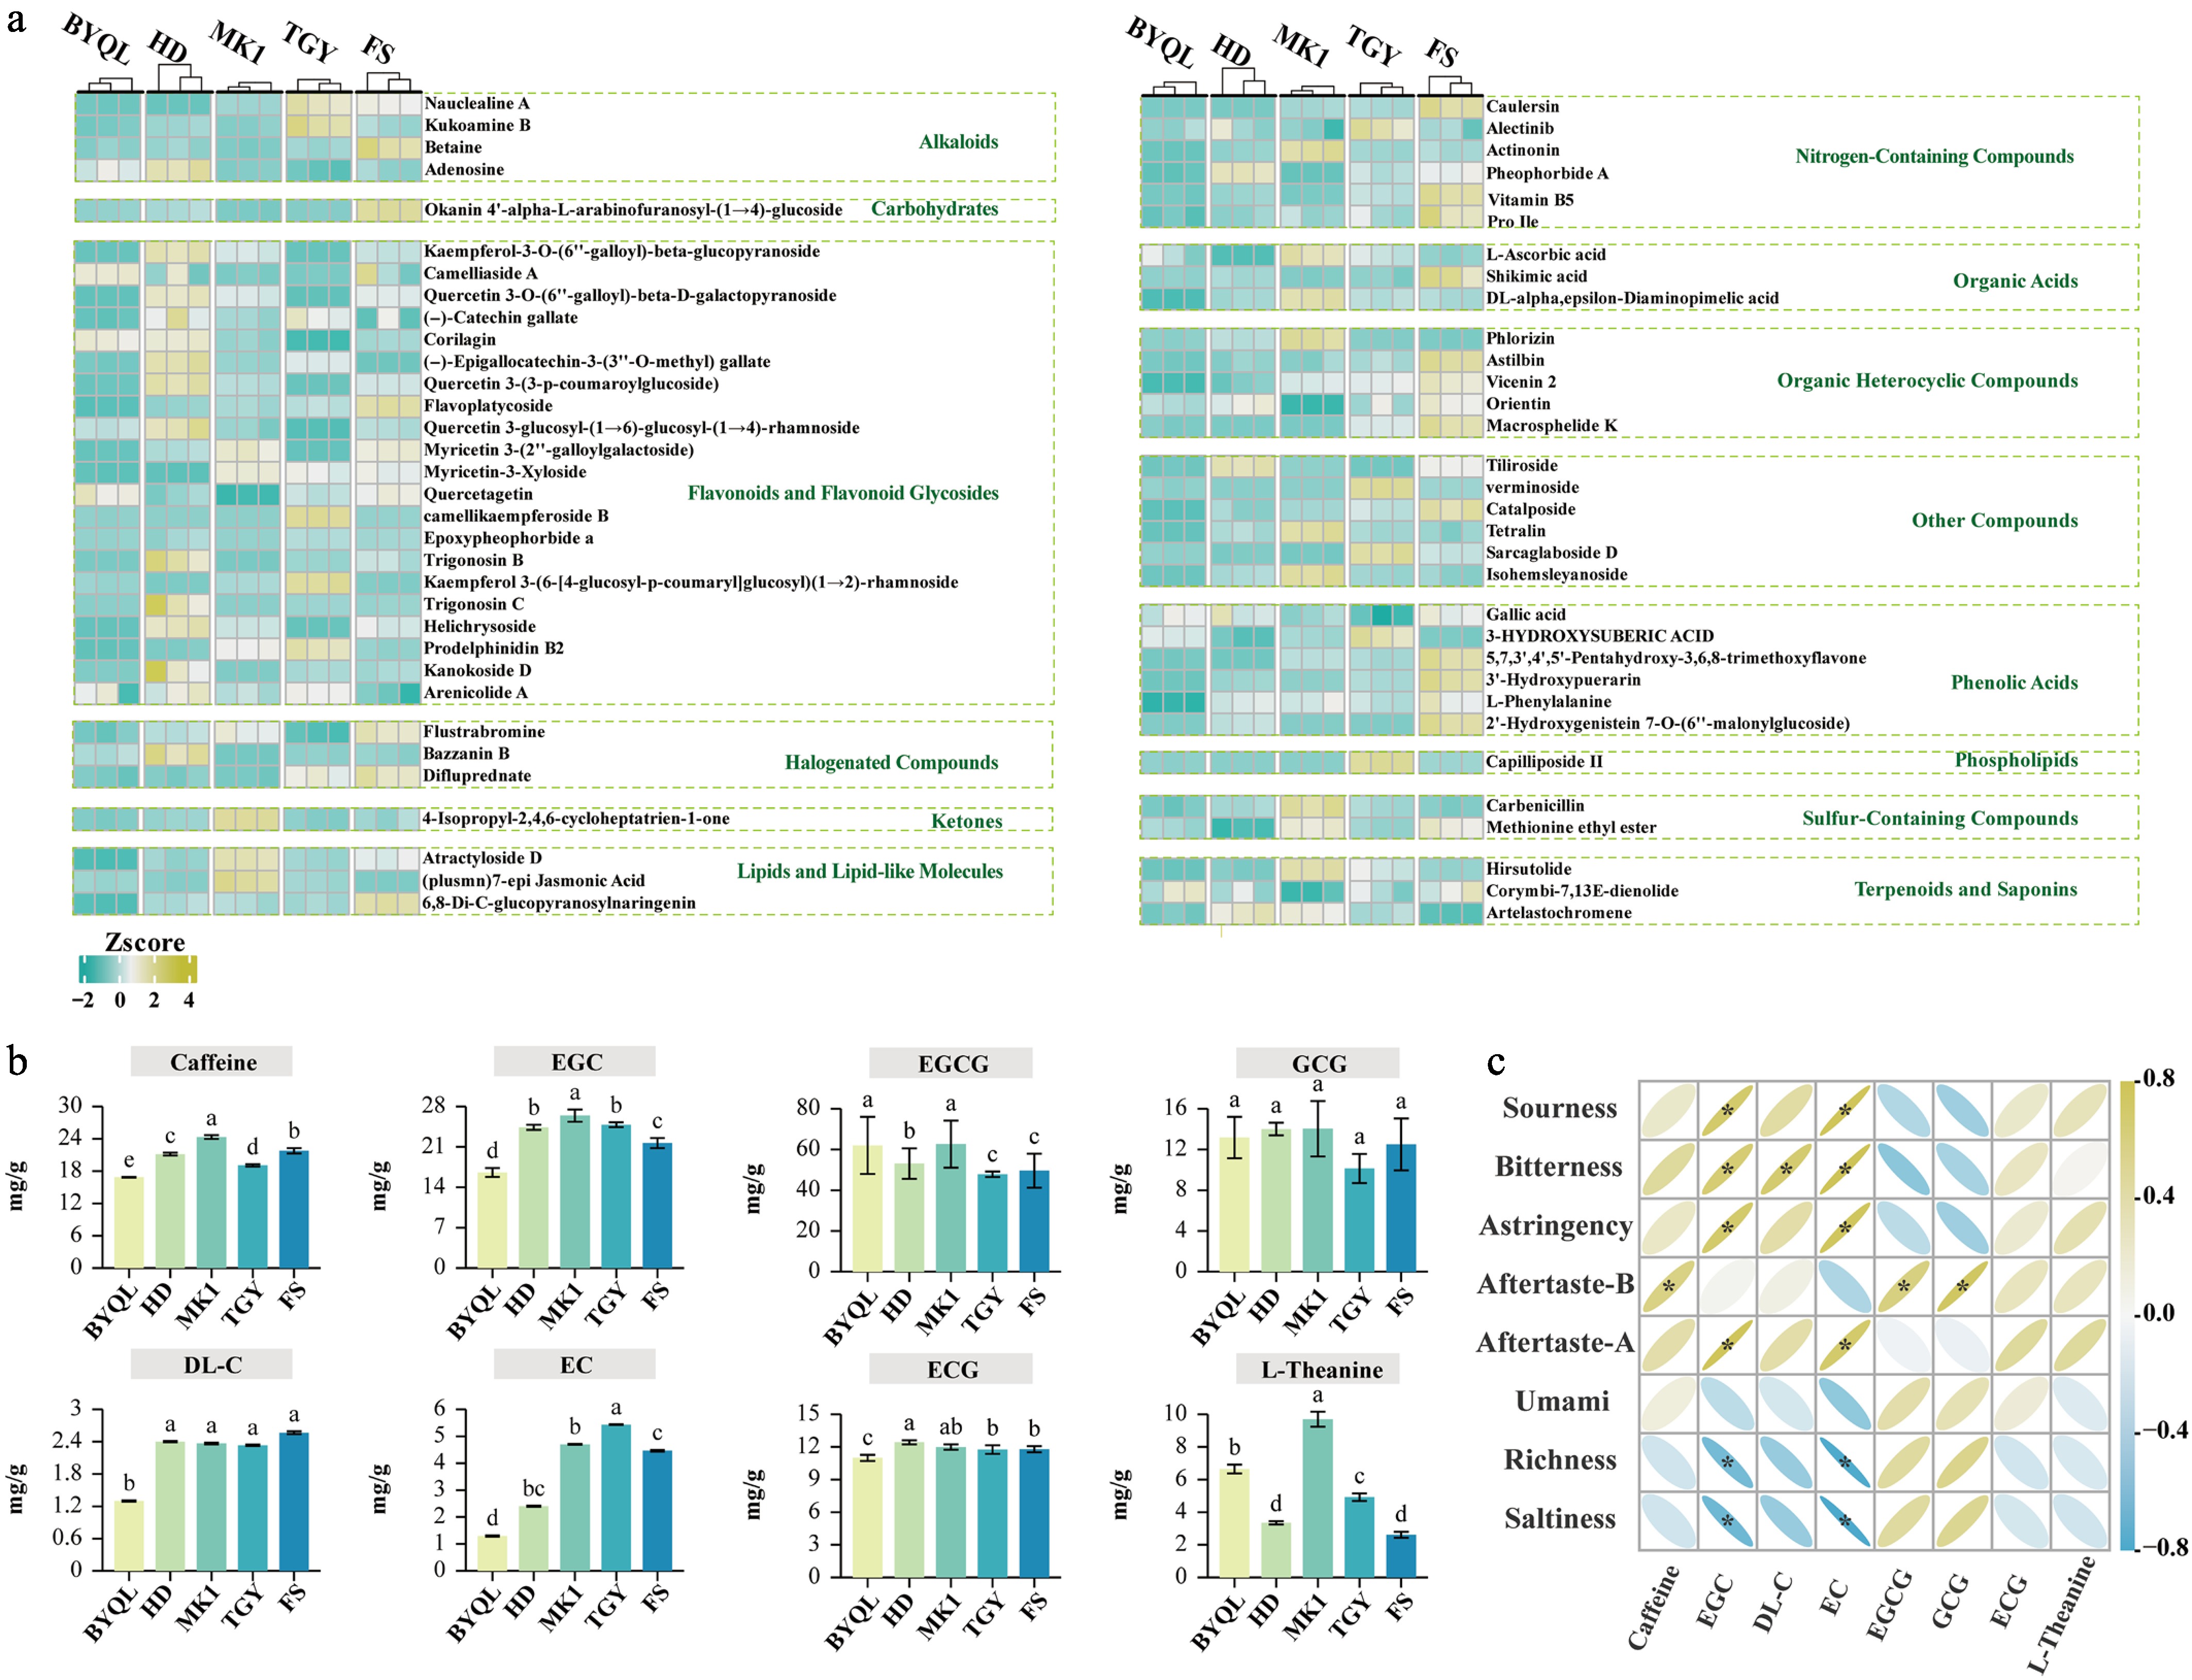
Figure 4.
Differential non-volatile compounds and their correlation with taste attributes in five oolong tea varieties. (a) Heatmap of key differential non-volatile compounds (screened with |p| > 0.05, |p(corr)| > 0.5, VIP > 1, ANOVA p < 0.05, and FC > 2; brown-yellow indicates high abundance, green indicates low abundance). (b) Comparison of caffeine, catechin, and L-theanine contents across the five tea groups (compound abbreviations correspond to: EGC: Epigallocatechin; EGCG: Epigallocatechin gallate; GCG: Gallocatechin gallate; DL-C: DL-catechin; EC: Epicatechin; ECG: Epicatechin gallate; different superscript letters indicate significant differences at p < 0.05). (c) Correlation analysis between taste attribute intensities and the contents of caffeine, catechins, and L-theanine (brown-yellow represents positive correlation, blue represents negative correlation. * Indicates p < 0.05).
-
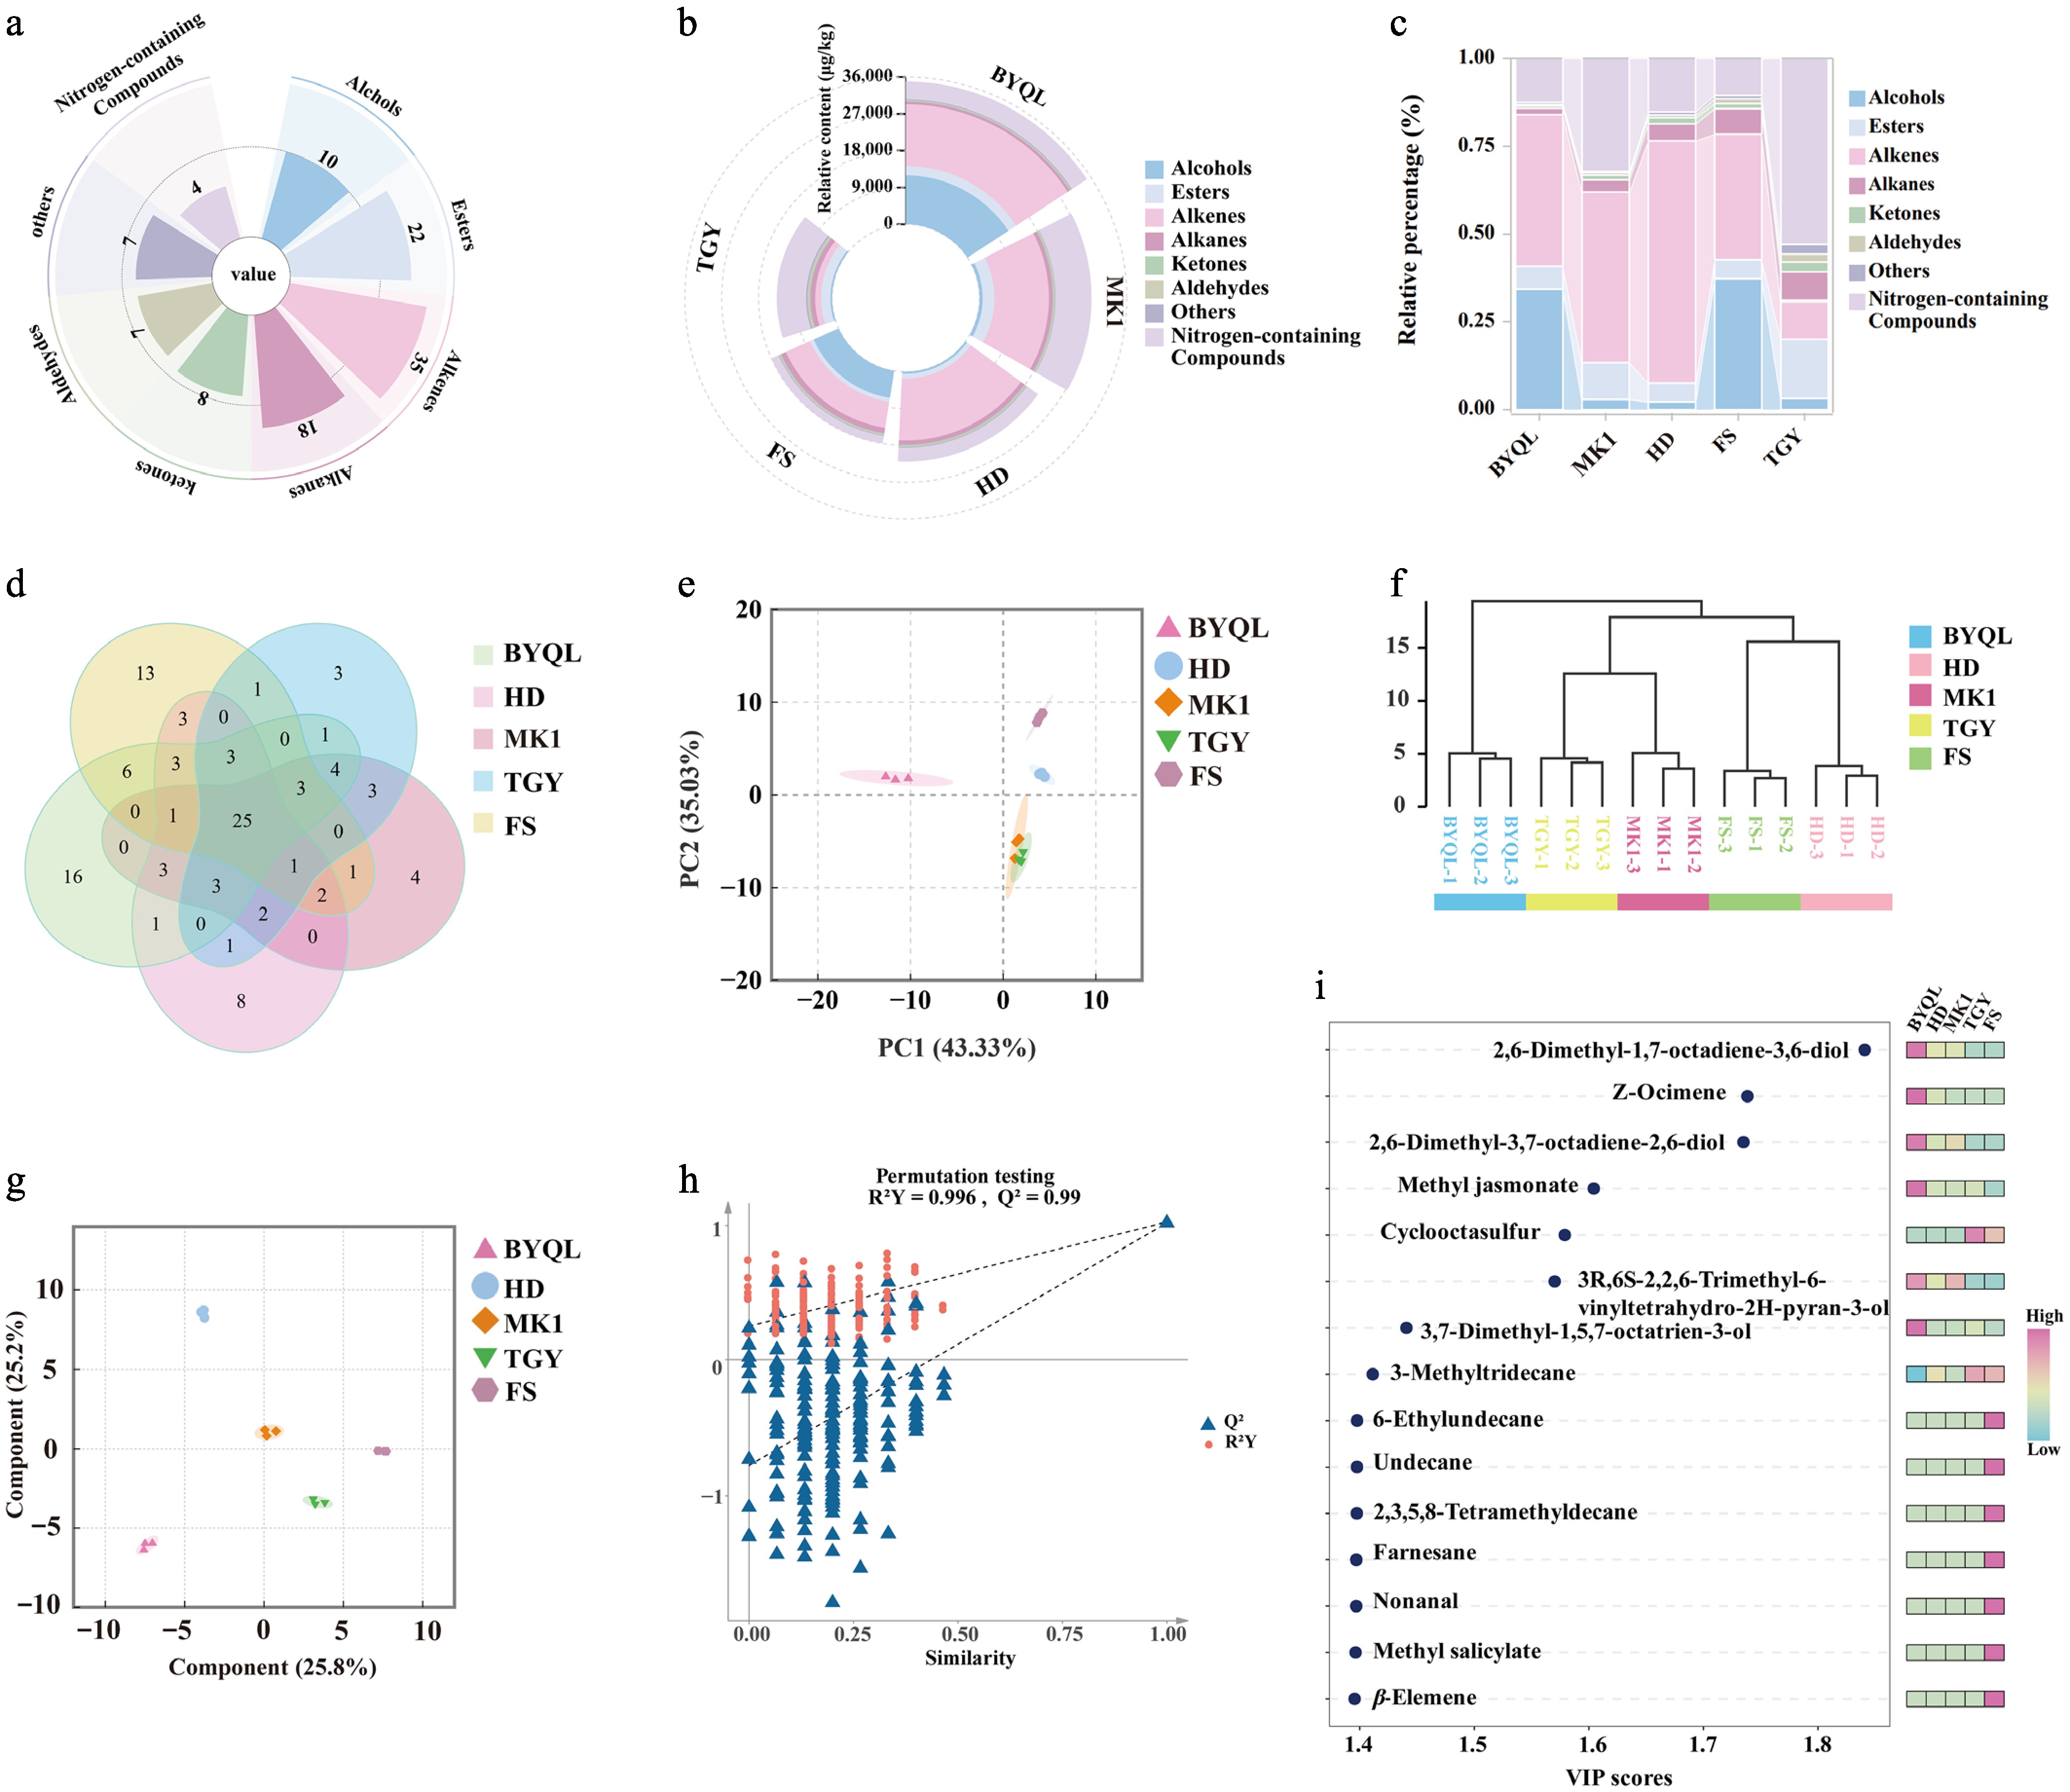
Figure 5.
Differential analysis of volatile compounds among five oolong tea varieties. (a) Proportion of volatile compound categories and quantities across the five tea groups. (b) Relative content (μg/kg) of volatile compounds in the five tea groups. (c) Stacked percentage plot of volatile compound distribution. (d) Venn diagram of volatile compounds across the five tea varieties. (e) Hierarchical clustering analysis of the five oolong tea samples. (f) PCA score plot of volatile compounds. (g) OPLS-DA score plot of volatile compounds. (h) Permutation test plot (200 permutations, R2Y = 0.996, Q2 = 0.99). (i) Heatmap of the top 15 volatile compounds ranked by VIP values (red indicates high abundance, blue indicates low abundance).
-
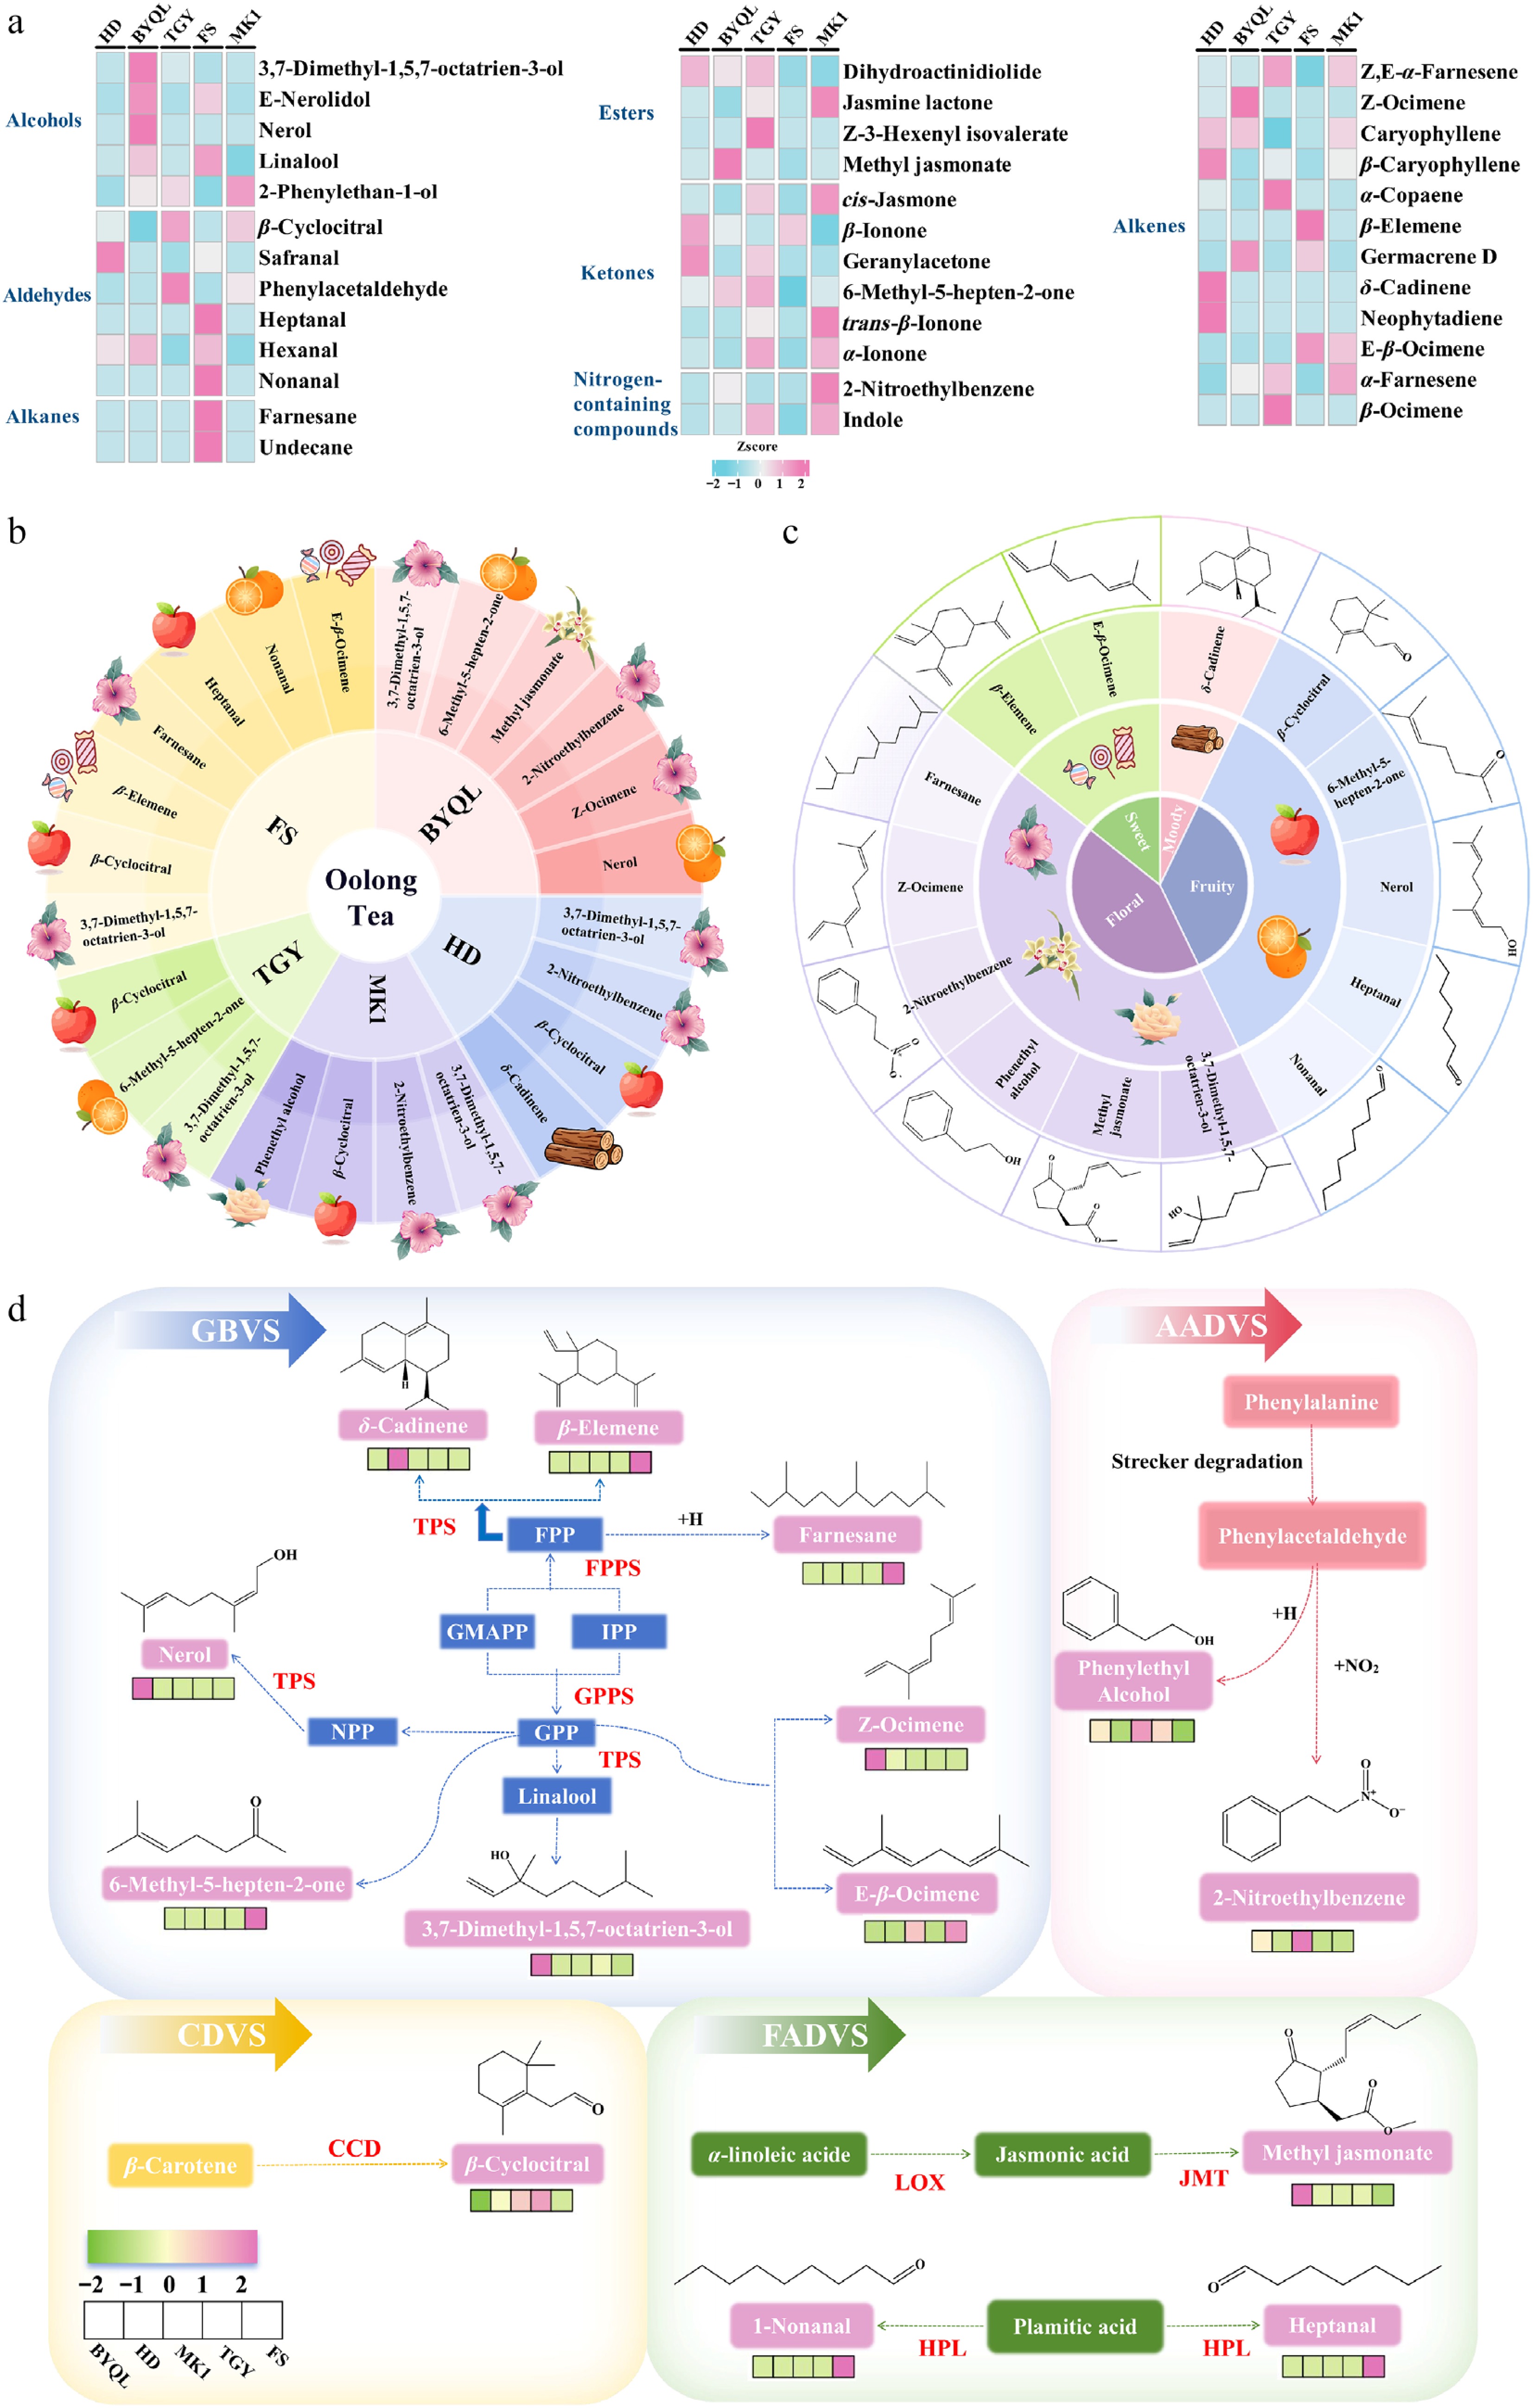
Figure 6.
(a) Heatmap showing the distribution of aroma-active compounds (ROAV > 1) across the five oolong tea varieties (pink indicates high abundance, blue indicates low abundance). (b) Distribution wheel of key aroma-active compounds in different oolong tea varieties. (c) Flavor wheel of key aroma compounds with four concentric layers representing: compound classification, aroma descriptors, compound names, and chemical structures. (d) Biosynthetic pathways of key aroma-active compounds in the five oolong tea varieties. Abbreviations: DMAPP, dimethylallyl diphosphate; IPP, isopentenyl diphosphate; GPPS, geranyl pyrophosphate synthase; FPPS, farnesyl diphosphate synthase; TPS, terpene synthase; LOX, lipoxygenase; CCD, carotenoid cleavage dioxygenase; JMT, jasmonic acid carboxyl methyltransferase; HPL, hydroperoxide lyase.
Figures
(6)
Tables
(0)