


-
Oolong tea, a semi-fermented tea unique to China, is widely acclaimed by global consumers for its distinctive flavor profile. According to the China Tea Industry Development Report, the production and sales of oolong tea in China reached 332.4 thousand tons and 25.077 billion CNY, respectively, in 2024, demonstrating a robust industrial development trend. Among the numerous varieties, Minnan oolong tea garners significant market attention owing to its rich germplasm resources and characteristic floral-fruity aroma. Research indicated that the quality of Minnan oolong tea is determined by the interplay of multiple factors, including variety, processing, origin, and cultivation practices. The tea plant variety is considered the fundamental internal determinant of its flavor profile[1]. During tea processing, the transformation of internal substances is driven by enzymatic and thermochemical reactions, leading to the formation of variety-specific aroma profiles. This process shapes diverse sensory experiences, such as the rich orchid fragrance of Zhangpingshuixian, and the delicate jasmine aroma of Chungui oolong[2]. Conversely, distinct varietal flavor profiles are attributed to unique taste-forming compounds. For instance, suitable cultivars exhibit significantly higher ratios of catechin gallate to free amino acids compared to unsuitable ones, which enables the tea infusion to maintain richness while revealing layered sensations of 'freshness, mellowness, and sweetness'[3]. It has been confirmed by functional studies that superior oolong tea germplasm possesses dual advantages, namely high aroma precursor content and high hydrolytic enzyme activity. These advantages collectively facilitate the efficient release of terpenoid aroma compounds, such as linalool and geraniol, during the shaking stage, while simultaneously hydrolyzing bitter ester-type catechins, thereby enhancing the freshness and crispness of the tea infusion[4]. The distinct floral profiles of 'Chungui' (jasmine), and 'Huangdan' (osmanthus) are attributed to variations in the content of indole, (E)-β-ocimene, (E)-β-terpineol, and phenylacetaldehyde[5]. 'Mingke 1' is characterized by enriched phenethyl alcohol and balanced amino acid ratios, resulting in a combination of rose-like sweetness with mellowness and freshness. This flavor profile contrasts sharply with that of 'Tieguanyin', which is distinguished by its delicate floral notes and characteristic 'Yin Rhyme'. Collectively, these varieties define the core quality characteristics and market distinctiveness of Minnan oolong teas.
The surge in demand for distinctive flavor ingredients in the new tea beverage market has posed severe challenges to accurate varietal identification and quality traceability. The long-standing phenomenon of 'variety-commodity' homonym persists. For instance, 'Tieguanyin' serves dually as both a specific tea cultivar, and a broad commercial product name. This issue is further compounded by the lack of standardized market naming conventions and commercial interests, which exacerbate labeling confusion and distort varietal information. Consequently, consumers are often confronted with a decision-making dilemma, struggling to distinguish between authentic varieties and consistent quality[6]. Therefore, the establishment of objective and accurate methods for varietal identification and quality evaluation is urgently required to overcome current bottlenecks in quality control and traceability.
Flavor is central to the sensory evaluation of tea, as its perception relies on the complex interplay between aroma and taste. Although traditional sensory assessment captures overall flavor characteristics, it is susceptible to subjective factors, which challenges objective and standardized evaluation[7]. To overcome these limitations, intelligent sensory technologies, including electronic noses and electronic tongues, have been rapidly developed. These technologies convert flavor and visual signals into digital features, demonstrating promising potential for food authenticity verification[8]. E-nose has been employed with multivariate statistical analysis to distinguish black tea varieties[9]. Similarly, the integration of electronic tongues with computer vision has enabled successful tracing of yellow tea varieties[10]. At the flavor chemistry level, metabolomics provides critical technical support for systematically revealing the chemical basis of tea flavor. Two-dimensional gas chromatography, coupled with quadrupole time-of-flight mass spectrometry (GC × GC-QTOFMS) enables comprehensive analysis of complex volatile compounds in tea, owing to its significantly enhanced peak capacity and resolution. Meanwhile, liquid chromatography coupled with high-resolution mass spectrometry (LC-HRMS) is widely applied for the precise identification of non-volatile taste components. In a relevant study, extensive targeted metabolomics was employed to decipher the chemical basis of the 'Yin Rhyme' aroma in Tieguanyin tea, establishing a new paradigm for semi-fermented tea flavor research[5]. Nevertheless, existing studies predominantly focus on single tea types or isolated flavor dimensions. Comprehensive flavor profiling and varietal identification across different oolong tea varieties from the same production region remains limited.
Minnan oolong tea is characterized by a rich diversity of cultivars. Alongside the globally renowned 'Tieguanyin', it also includes nationally recognized, highly aromatic elite varieties such as 'Baiya Qilan', 'Foshou', 'Huangdan', and 'Mingke 1'. When processed under identical oolong tea protocols, these accessions exhibit remarkably similar appearance of dry tea and tea infusion profile, thereby rendering traditional sensory assessment inadequate for accurate or rapid discrimination. Therefore, the five aforementioned Minnan oolong cultivars were targeted in this study. An integrated approach, combining intelligent sensing (E-nose and E-tongue) with high-resolution metabolomics (HS-SPME/GC × GC-QTOFMS, and UHPLC-MS/MS), was employed to systematically map their flavor compositions and screen for key discriminatory markers. This study aims to develop a methodological framework for authenticating and evaluating the quality of Minnan oolong tea varieties. The findings are expected to provide a data-driven reference for elucidating the tea's flavor formation mechanisms and advancing industry standardization.
-
Five tea varieties were utilized in this study: 'Tieguanyin' (TGY), 'Baiya Qilan' (BYQL), 'Huangdan' (HD), 'Mingke 1' (MK1), and 'Foshou' (FS). All tea samples were uniformly supplied by Wuyishan Kengjian Yougu Tea Co., Ltd. (Fujian Province, China). The fresh leaves were harvested from the core production areas of Southern Fujian (Minnan), with specific origins as follows: 'BYQL' from Pinghe County, Zhangzhou; 'MK1' from Hua'an County, Zhangzhou; 'TGY' and 'HD' from Anxi County, Quanzhou; and 'FS' from Yongchun County, Quanzhou, China. Leaf harvesting was performed using the open-leaf method, collecting tender buds with three to four leaves. All samples were processed following a standardized sequence: withering (30–50 min) → tumbling (at 22–25 °C, and 80%–85% relative humidity, with six turning cycles) → fixation (260 °C for 5 min) → rolling → primary drying (110 °C for 20 min) → cloth-wrapped kneading (at 60–65 °C leaf temperature, 3–5 batches) → final drying (at 60–80 °C for 2 h). All finished tea samples were individually sealed in aluminum-laminated bags, and stored at 4 °C until analysis. Prior to analysis, all samples were ground into a fine powder.
Sensory evaluation of tea
-
The sensory evaluation of tea samples was performed according to the Chinese National Standard Method (GB/T 23776-2018). Briefly, a 5 g tea sample was weighed and infused in a standard evaluation gaiwan. Three sequential infusions were carried out using boiling water, with steeping durations of 2, 3, and 5 min, respectively.
An expert panel from Hunan Agricultural University conducted the sensory evaluation. The panel consisted of seven trained members (three males, four females), aged between 25 and 50 years. Prior to the evaluation, informed consent was obtained from all panelists, who then voluntarily completed a training program. This program was designed to enable the identification, description, and quantification of specific aroma and taste attributes. All panelists underwent 50 d of training prior to the formal sessions. They were required to successfully pass blind tests, demonstrating the ability to accurately describe flavor attributes, and their intensities in written assessments. The sensory evaluation focused on 13 attributes: six taste attributes (bitterness, astringency, sourness, umami, sweetness, and mellowness), and seven aroma attributes (sweet, floral, fruity, woody, milky, roasted, and grassy). Each attribute was rated on a 0–10 scale, where 0–2 represented 'very weak/barely detectable', and 8–10 denoted 'very strong'[11].
Electronic nose (E-nose) analysis
-
The volatile profiles of Minnan oolong tea samples were analyzed using a PEN3 portable electronic nose system (Airsense Analytics GmbH, Germany). Accurately weighed tea powder (3.00 ± 0.001 g) was placed into a 50 mL centrifuge tube. The tube was sealed with sealing film and equilibrated at room temperature for 1 h to enable adequate headspace volatile enrichment. The measurement conditions were as follows: carrier gas flow rate, 0.60 L/min; sampling time, 90 s; pre-injection wait time, 5 s; sensor cleaning time, 200 s; and ambient temperature, 26 °C. The system was equipped with ten metal oxide semiconductor (MOS) sensors, each with specific sensitivities: W1C (aromatic compounds, e.g., benzene), W5S (nitrogen oxides), W3C (ammonia), W6S (hydrides), W5C (alkenes and short-chain aromatics), W1S (methane), W1W (sulfides and pyrazines), W2S (alcohols, aldehydes, and ketones), W2W (organic sulfides), and W3S (long-chain alkanes).
Electronic tongue (E-tongue) analysis
-
For analysis, 3 g of each tea sample was accurately weighed into a 250 mL beaker. Then, 150 mL of boiling water was added, and the mixture was steeped for 5 min. The infusion was rapidly filtered, and the filtrate was collected. After cooling to room temperature, the supernatant was taken for electronic tongue measurement. The taste characteristics were analyzed using an electronic tongue (TS-5000Z, Insent, Japan). The sensor probes used for taste measurement were AAE (umami), CAO (acid), CTO (salty), COO (bitter), AE1 (astringent), and GL1 (sweetness), as well as aftertaste-bitterness, aftertaste-astringency, and richness. Each measurement cycle consisted of a 30 s sample detection, a 30 s aftertaste evaluation, a 5.5 min sensor cleaning, and a 30 s self-check phase. For each sample, four replicate cycles were performed, with stable data from the last three cycles used for subsequent analysis.
The GC × GC-QTOFMS detection of volatiles
Headspace solid phase micro-extraction for volatile extraction
-
For the analysis of volatile compounds, 0.5 g of the oolong tea sample was accurately weighed into a 20 mL headspace vial. Then, 10 μL of an ethyl decanoate internal standard solution (8.63 mg/L, 99.9% purity; Shanghai Anpu Experimental Technology Co., Ltd., Shanghai, China) was added. The vial was equilibrated at 80 °C for 20 min. Subsequently, volatile compounds were extracted by exposing a solid-phase microextraction (SPME) fiber (50/30 μm DVB/CAR/PDMS; Agilent Technologies, USA) to the sample headspace for 20 min at 80 °C, followed by thermal desorption at 250 °C for 3 min in the GC injector.
Chromatographic and mass spectrometric conditions
-
Chromatographic separation was performed using a two-dimensional column system. The one-dimensional (1D) was an HP-5MS (30 m × 0.25 mm × 0.25 μm; Agilent Technologies, USA), and two-dimensional (2D) was a DB-17MS (2.32 m × 0.18 mm × 0.18 μm; Agilent Technologies, USA). The oven temperature program was set as follows: held at 40 °C for 1 min, increased to 180 °C at a rate of 2 °C/min, then raised to 250 °C at 5 °C/min, and held for 5 min. High-purity helium (99.999%) was used as the carrier gas at a constant flow rate of 0.9 mL/min. The injection was performed in split mode (100:1), with both the injector and MS transfer line temperatures maintained at 250 °C.
For mass spectrometric detection, electron impact (EI) ionization was applied at 70 eV. The ion source temperature was set to 230 °C, and the quadrupole temperature was maintained at 150 °C.
Qualitative and quantitative analysis
-
Data analysis was performed using the Canvas Panel comprehensive two-dimensional gas chromatography data processing workstation, with the minimum peak detection signal-to-noise ratio set to 10. The mass spectral data of each chromatographic peak were compared against the mainlib, replib, and nist-ri libraries within the NIST20 mass spectral database. Only compounds with both forward and reverse matching scores greater than 700 were retained for subsequent analysis. Under the same instrumental conditions, 1 μL of n-alkane standards (C7−C30, 99% purity, Macklin Biochemical Co, Ltd., Shanghai, China) was analyzed. The retention times of the corresponding n-alkanes were recorded to calculate the retention indices of volatile compounds, and those with a retention index deviation within ± 30 were selected. Ethyl decanoate was used as the internal standard, and the relative content of each volatile compound was calculated based on the ratio of its peak area to that of the internal standard. Further details can be found in our previous study[12].
Calculation and analysis of relative odor activity value (ROAV)
-
The relative odor activity value (ROAV) is defined as the ratio of the relative concentration of a volatile compound to its threshold value in water. ROAV is commonly used to evaluate the contribution of individual volatile compounds to the overall aroma of the sample. The threshold values were retrieved from existing literature[13], and the online database:
www.vcf-online.nl/Vcf-Home.cfm .UHPLC-MS/MS detection of non-volatiles
-
Non-targeted metabolomic profiling was conducted using a Vanquish UHPLC system (Thermo Fisher Scientific, Germany) coupled with a QExactive™ HF high-resolution mass spectrometer (Thermo Fisher Scientific, Germany). Separation was achieved on a Hypersil GOLD column (100 mm × 2.1 mm, 1.9 μm; Thermo Fisher Scientific, USA) maintained at 40 °C. The injection volume was 10 μL, and the mobile phase consisted of 0.1% formic acid in water (A) and methanol (B), delivered at a flow rate of 0.2 mL/min. The gradient program was optimized as follows: 98% A (2% B) from 0 to 1.5 min, held until 3 min; 15% A (85% B) at 10 min; 100% B at 10.1 min; and re-equilibrated at 98% A from 11 to 12 min.
Mass spectrometric analysis was performed using an electrospray ionization source operating in both positive and negative ionization modes with rapid polarity switching. Full-scan mass spectra were acquired over a range of m/z 100–1,500 at a resolution of 120,000 (FWHM), with mass accuracy maintained within 10 ppm. Key source parameters were set as follows: spray voltage, 3.5 kV; sheath gas flow rate, 35 arb; auxiliary gas flow rate, 10 L/min; capillary temperature, 320 °C. The S-lens RF level was set to 60, and the auxiliary gas heater temperature was maintained at 350 °C. Data-dependent acquisition (DDA) was employed to trigger MS/MS scans for precursor ion selection.
Qualitative and quantitative analysis of non-volatiles
-
Raw mass spectrometry data files were converted to mzXML format using ProteoWizard software. Peak detection, alignment, and relative quantification were performed using the XCMS package, with retention time (RT) and mass-to-charge ratio (m/z) as primary parameters. Metabolite identification was achieved through exact mass matching (mass error < 10 ppm) and MS/MS spectral comparison. For quality control, background signals were removed using blank samples, and the raw quantitative data were normalized. Additionally, metabolites showing a coefficient of variation (CV) greater than 30% in quality control (QC) samples were excluded from further analysis. The final dataset contained the identified metabolites and their relative quantitative values across all samples.
HPLC detection of catechins, caffeine, and L-theanine
-
The analysis of caffeine and L-theanine was conducted according to the respective Chinese National Standards (GB/T 8312-2013 and GB/T 23193-2017). Catechins were quantified using high-performance liquid chromatography (HPLC) on a Shimadzu system (Japan) equipped with an Ecosil C18 column (4.6 mm × 250 mm, 5 μm). The injection volume was 10 μL, and separation was achieved using a mobile phase consisting of water (A) and a solution of N,N-dimethylformamide-methanol-glacial acetic acid (40:2:1.5, v/v/v) (B). The following gradient program was applied: 84% A at 0.01 min; 76% A at 16 min; 64% A at 24−28 min; 62% A at 33 min; 84% A at 35−40 min. The column temperature was maintained at 35 °C with a flow rate of 1.0 mL/min. Quantification was performed using the external standard method based on peak areas.
Data processing
-
Radar charts, stacked charts, and flavor wheels were generated using Origin 2024 (OriginLab Corp., Northampton, MA, USA). Orthogonal Partial Least Squares-Discriminant Analysis (OPLS-DA) was conducted on samples via the free online data analysis platform MetwareCloud (
https://cloud.metware.cn ), where Variable Importance in Projection (VIP) values were calculated. Additionally, cluster analysis, multi-omics correlation analysis, and Venn diagrams were performed. Single-factor analysis of variance (ANOVA) was implemented using SPSS 19.0, while bar charts and clustering heatmaps were constructed with GraphPad Prism software (version 8.3.0, San Diego, CA, USA). -
Distinct sensory characteristics arise from variations in aroma and flavor intensity among tea leaves, which are discernible through olfactory and gustatory perception. As presented in Fig. 1b, the sensory evaluation revealed that 'TGY' dry tea exhibited a sandy green hue with substantial density, characterized by an elegant orchid fragrance. The infusion appeared light yellow with bright clarity, delivering a mellow, sweet, and refreshing taste accompanied by pronounced 'Yin rhyme'. 'BYQL' dry tea displayed a yellow-green coloration with a clear, persistent aroma dominated by distinct orchid notes, while its golden-yellow liquor offered a fresh, mellow, and umami taste. 'MK1' dry tea presented a greenish luster with tight rolling, emitting an intense aroma marked by floral-fruity sweetness, and produced a golden-yellow liquor with fresh, mellow, and rich taste properties. 'HD' dry tea showed yellowish-green coloring with tight rolling, featuring a sweet aroma carrying floral notes, and yielded a light yellow infusion with mellow, refreshing taste and lingering sweetness. 'FS' dry tea appeared dark brown with tight rolling, presenting sweet fruity notes complemented by woody undertones, and produced a bright orange-yellow liquor with rich, mellow taste. The infused leaves of all five tea samples were plump, soft, and bright green. Among them, 'BYQL', 'HD', 'MK1', and 'TGY' had well-arranged leaves with slight red edges, while 'FS' also showed orderly leaves but with more pronounced reddening. The difference in leaf red-edge formation is attributed to multiple factors, including mechanical force during processing, raw material characteristics, the microenvironment, and subsequent fixation. The notably stronger red edges in 'FS' may be due to its relatively thinner leaf cuticle and looser tissue structure, which allows the cell disruption threshold to be more readily reached under the same turning conditions. This facilitates the release of sufficient polyphenol substrates and triggers deeper enzymatic oxidation, leading to distinct red edges[14].
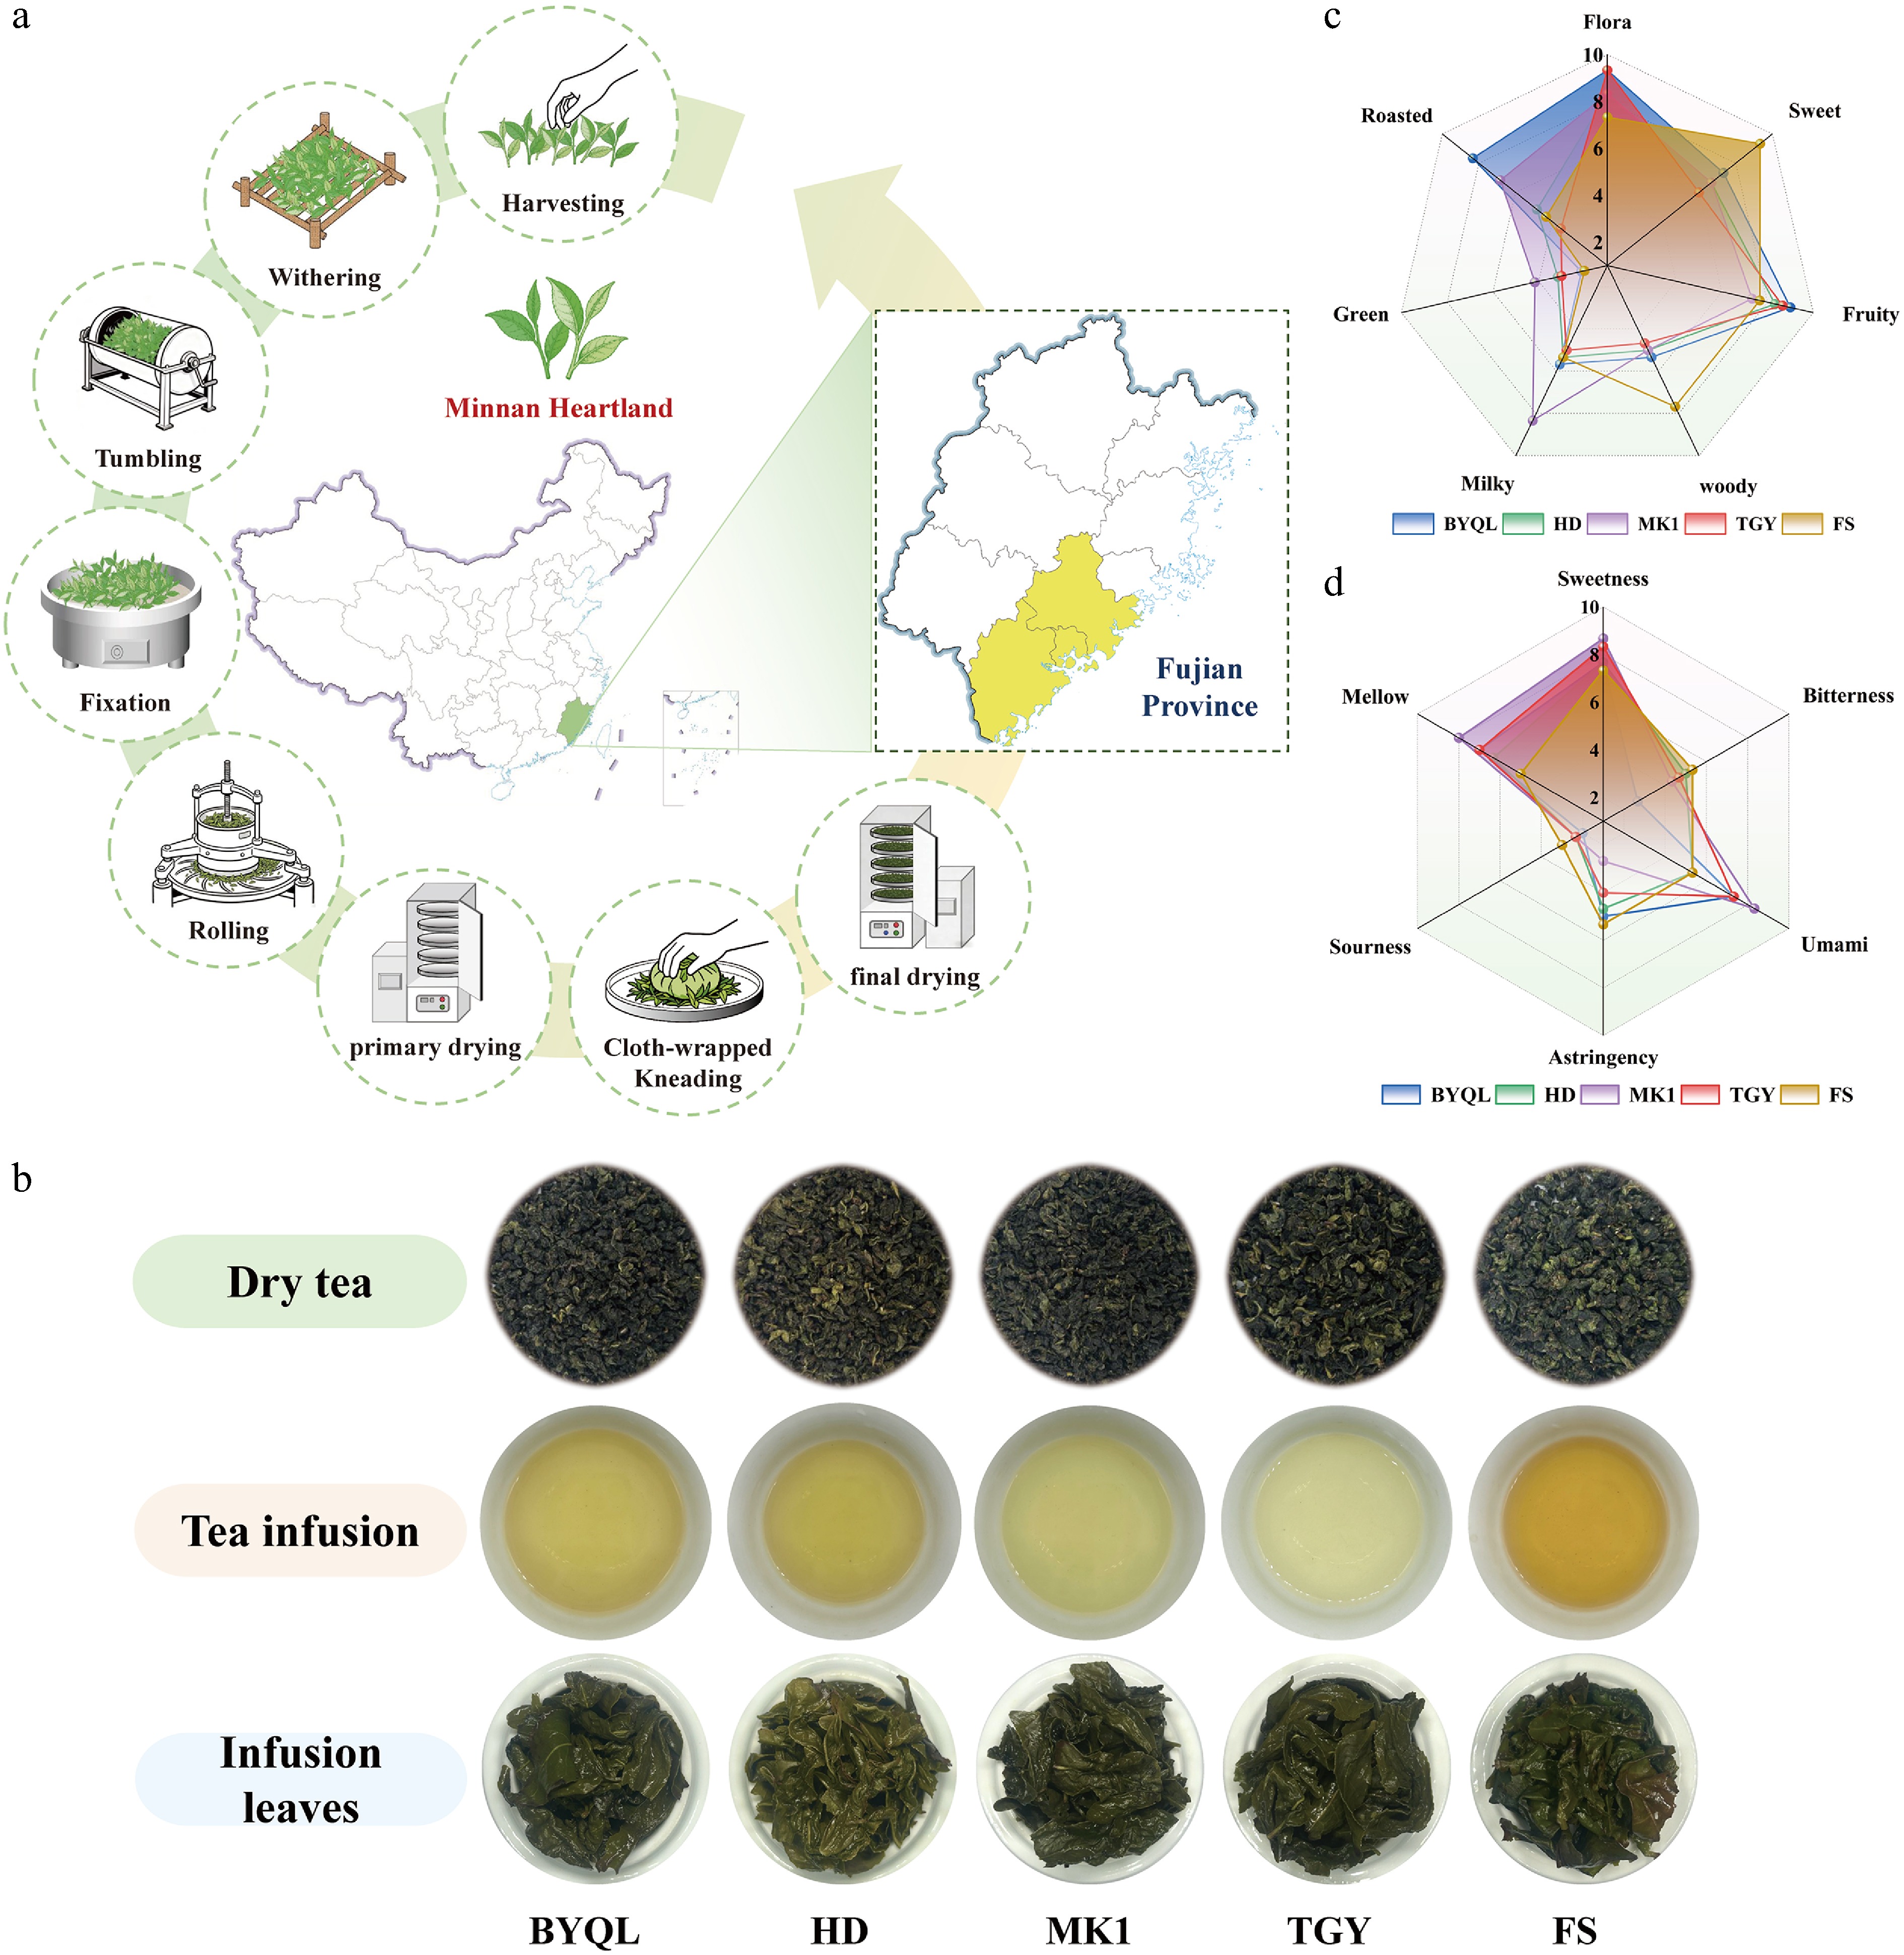
Figure 1.
Origin, processing, appearance, and sensory fingerprints of five Minnan oolong tea cultivars. (a) Geographical origins of fresh tea leaves and the streamlined manufacturing process for the five Minnan oolong tea samples. The base maps were downloaded from the Standard Map Service system under review numbers GS(2019)1837, and Min S(2025)166; no modifications have been made to either map. (b) Visual characteristics of dry tea leaves, liquor color, and infused leaves of the five Minnan oolong tea samples. (c), (d) Quantitative descriptive analysis of taste and aroma, respectively. Data points represent the mean ± standard error (mean ± SE, n = 7) from a seven-member sensory panel.
To further elucidate specific flavor distinctions among these Minnan oolong varieties, quantitative scoring was applied to aroma and taste attributes (Fig. 1c). While the five varieties shared similar distributions along floral and fruity dimensions, each demonstrated distinctive characteristics: 'BYQL' displayed the most prominent floral notes and highest roasted aroma scores; both 'TGY' and 'HD' exhibited strong floral-fruity aromas; 'FS' was dominated by sweet and woody aromas; 'MK1' primarily showed milky and fruity aromas accompanied by subtle floral notes. Significant inter-varietal differences were observed in taste attributes: 'MK1' exhibited the highest sweetness and umami intensity, while 'FS' showed the most pronounced bitterness and astringency; 'BYQL' and 'TGY' both presented a harmonious balance of sweetness and mellow flavor. Collectively, these results demonstrate that different Minnan oolong tea varieties possess significantly distinct flavor profiles, confirming their unique varietal characteristics.
Electronic sensory analysis
-
The E-nose system captured the aroma profiles of tea samples through responses from ten distinct sensors. As shown in Fig. 2a, the radar charts of the five Minnan oolong tea samples displayed broadly similar patterns. To further explore varietal differences in aroma, orthogonal projections to latent structures-discriminant analysis (OPLS-DA) was performed. The score plot (Fig. 2b) demonstrated clear separation among the five tea varieties within the 95% confidence interval, with good intra-group reproducibility. Specifically, 'BYQL' and 'HD' were clustered on the negative side of the X-axis, while 'TGY' and 'FS' were located on the positive side. After 200 permutation tests, the model validation parameters were R2Y = 0.841 and R2X = 0.858, with a negative intercept of the Q2 regression line (Fig. 2c), confirming the model's reliability without overfitting. The variation in e-nose signals likely reflected differences in volatile compound concentrations. Among the ten sensors, W1W (sensitive to sulfides and pyrazines), and W2W (sensitive to organic sulfides) showed the highest average response values across all tea samples (Fig. 2d), with 'BYQL' exhibiting the strongest response, followed by 'TGY', 'HD', 'FS', and 'MK1'. The variable importance in projection (VIP) analysis (Fig. 2e) further identified W3C (sensitive to amines), W6S (sensitive to hydrides), and W3S (sensitive to long-chain alkanes) as key sensors for discriminating oolong tea varieties (VIP > 1, p < 0.05), suggesting that aroma differences arise from complex interactions among multiple compound classes rather than single chemicals.
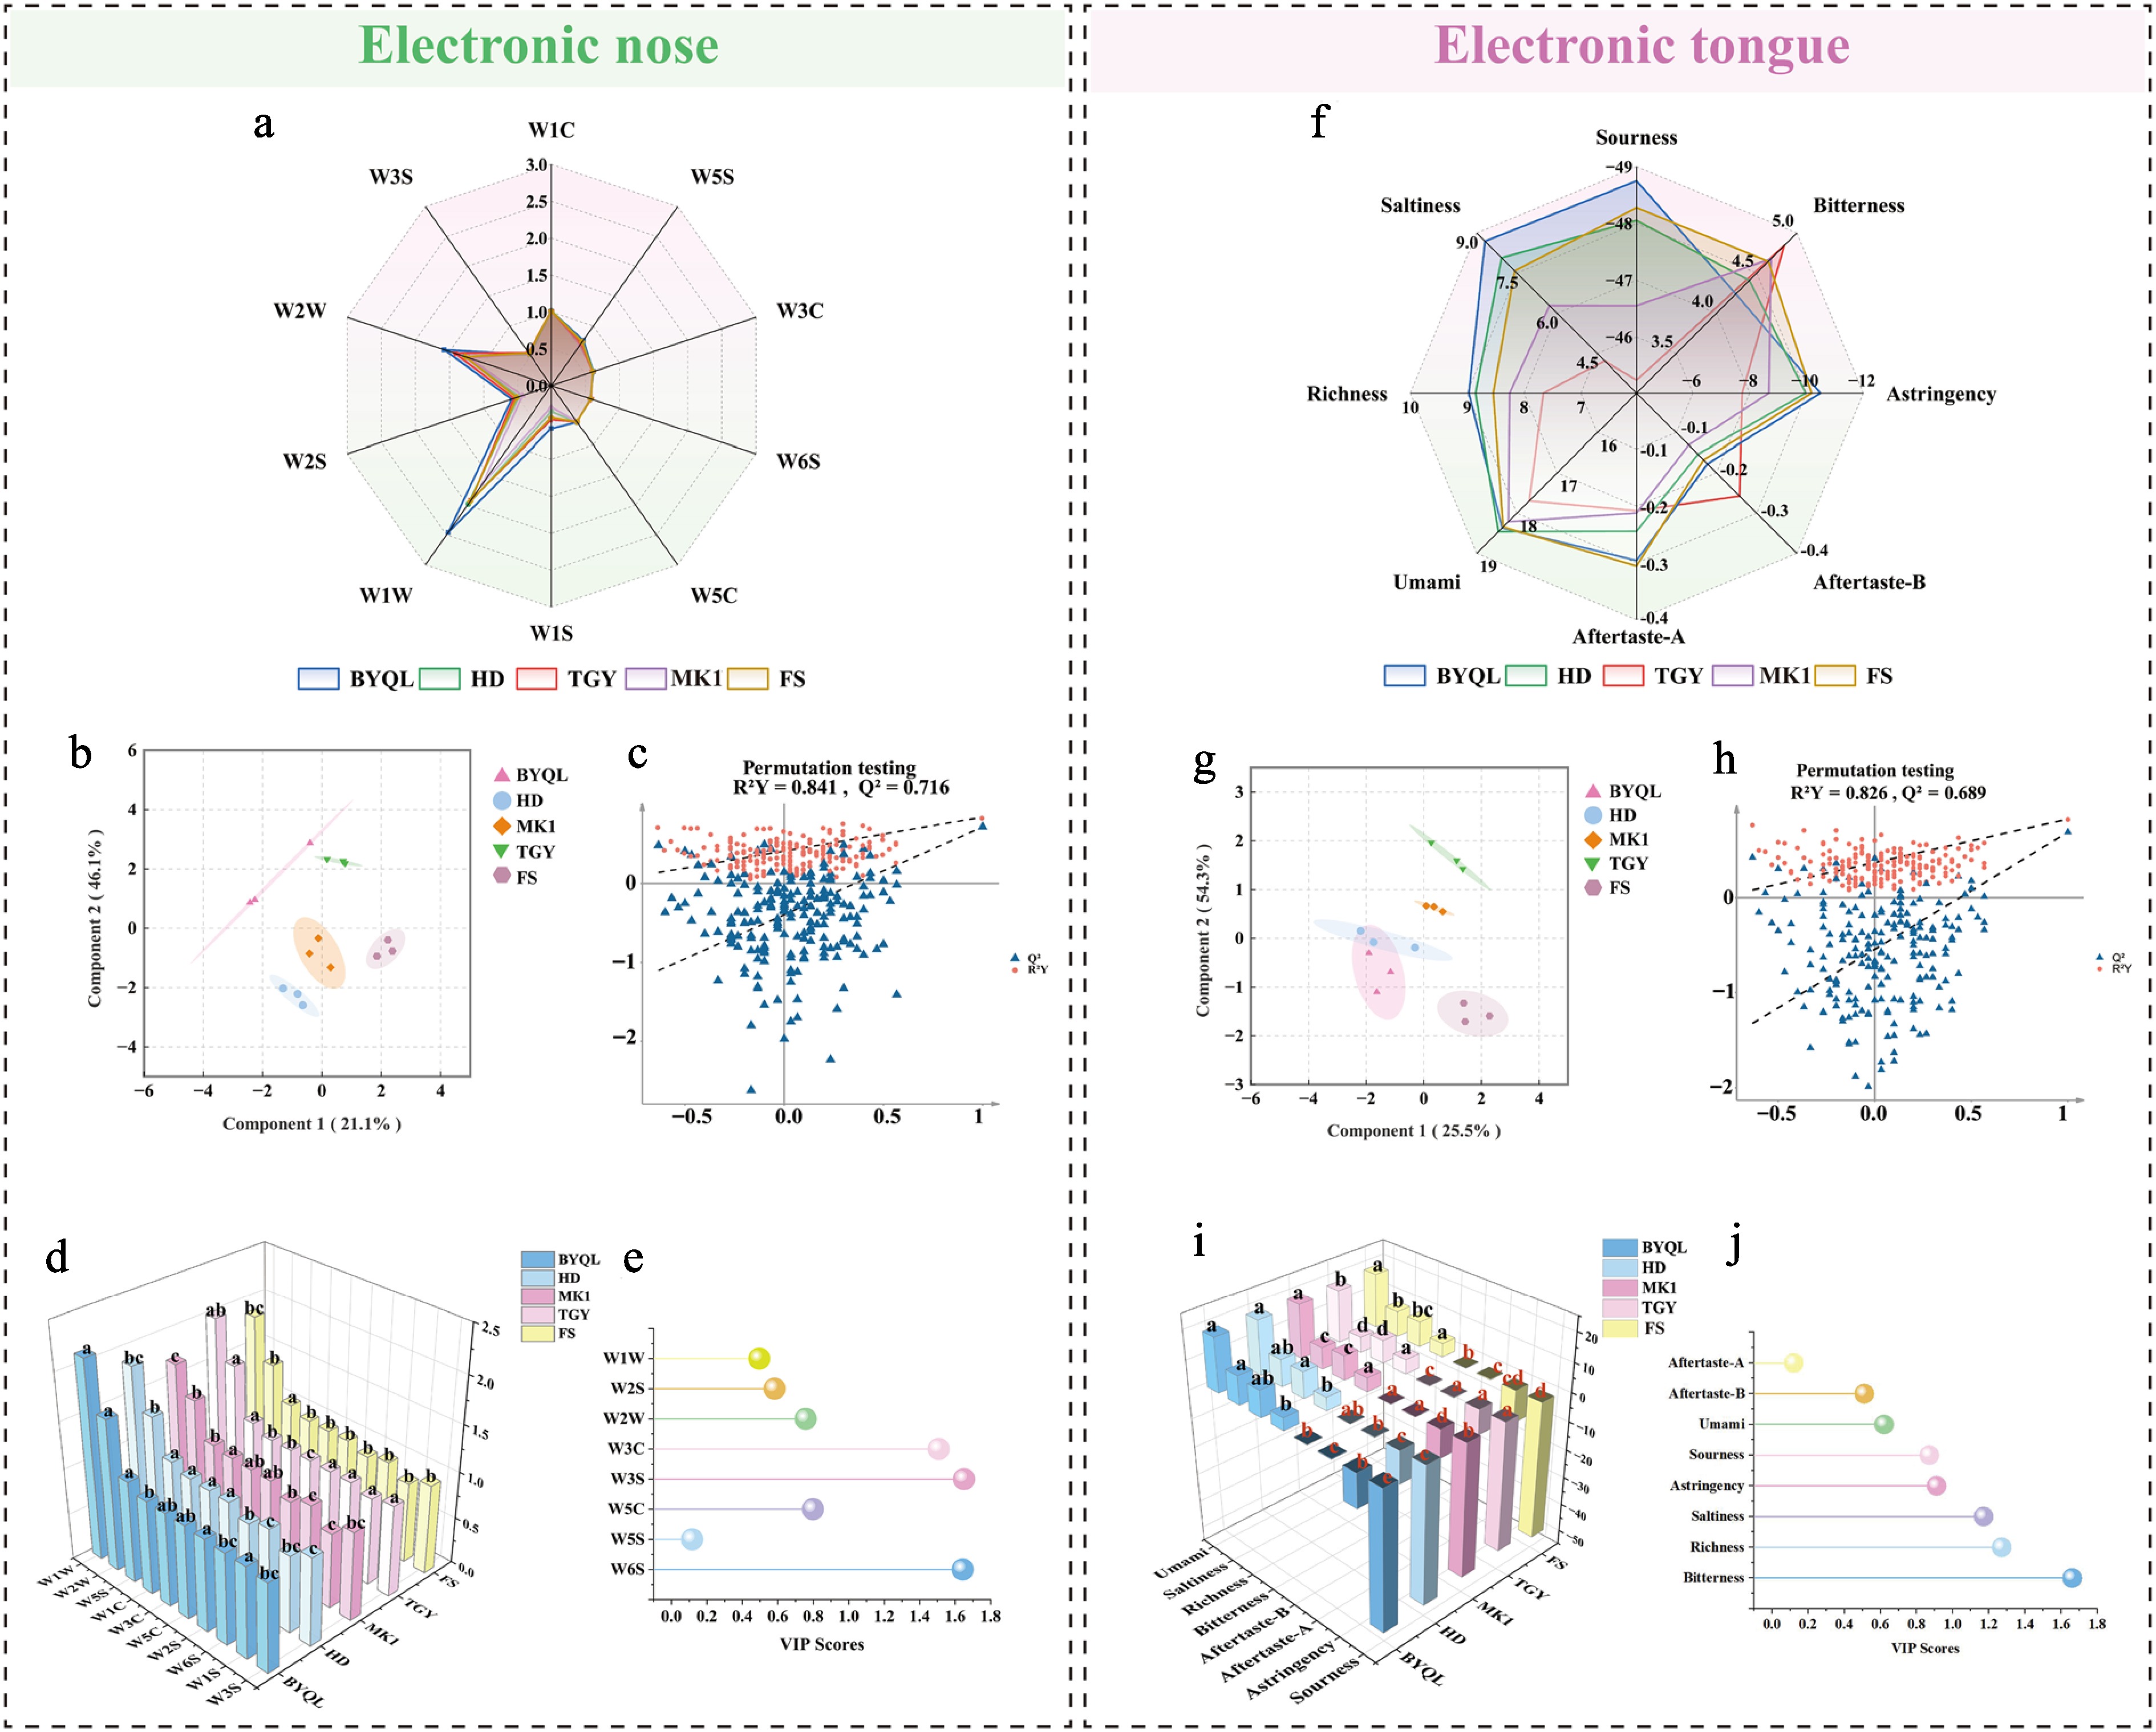
Figure 2.
Electronic sensory profiles and multivariate analysis of Minnan oolong tea varieties. (a) Radar chart of E-nose sensor responses. (b) OPLS-DA score plot from e-nose data. (c) Permutation test plot of the E-nose OPLS-DA model (200 permutations, R2Y = 0.841, Q2 = 0.716). (d) E-nose sensor response values (different letters indicate significant differences at p < 0.05). (e) VIP scores from E-nose analysis. (f) Radar chart of E-tongue taste attributes. (g) OPLS-DA score plot from E-tongue data. (h) Permutation test plot of the E-tongue OPLS-DA model (200 permutations, R2Y = 0.826, Q2 = 0.689). (i) E-tongue sensor response values (different letters indicate significant differences at p < 0.05). (j) VIP scores from E-tongue analysis.
To reduce the impact of subjective factors on sensory evaluation outcomes, an electronic tongue was utilised to analyse the taste characteristics of five sample groups. The findings of the study indicate that the electronic tongue's sourness threshold is −13, the saltiness threshold is −6, and the thresholds for other indicators are 0. Among the taste indicators for the five tea samples, sourness, astringency, aftertaste-A, and aftertaste-B were below the taste thresholds. This finding suggests that these tea samples do not elicit significant taste sensations, such as sourness and astringency, in tasters, which is consistent with the results of the sensory evaluation (Fig. 2f). The OPLS-DA model (Fig. 2g, h) effectively distinguished the five tea groups (R2Y = 0.826, Q2 = 0.689), revealing substantial differences in umami, saltiness, bitterness, and richness. 'TGY' showed the strongest bitterness, while 'BYQL' exhibited the weakest; richness followed an opposite trend, with 'BYQL' being highest and 'TGY' lowest. 'HD' demonstrated the most pronounced umami, while 'BYQL' and 'FS' showed similar umami intensity. Based on VIP scores (Fig. 2j), the key discriminating variables were bitterness (VIP = 1.66) > richness (VIP = 1.26) > saltiness (VIP = 1.17), suggesting that non-volatile compounds associated with these taste attributes are the primary drivers of inter-varietal differences. Further identification of non-volatile chemical components is required to elucidate the material basis underlying these characteristic taste profiles.
Profiling of non-volatile metabolites in five Minnan oolong tea varieties
-
The taste quality of tea is primarily determined by the composition of its non-volatile metabolites. To systematically elucidate the taste-forming basis of Minnan oolong teas, a comprehensive analysis of non-volatile components across five varieties was conducted using UHPLC-MS/MS. A total of 3,949 metabolites were identified (Supplementary Table S1), encompassing 237 flavonoids and flavonoid glycosides, 337 phenolic acids, 325 alkaloids, 575 terpenoids and saponins, 244 nitrogen-containing compounds, 155 sulfur-containing compounds, 176 phospholipids, 101 halogenated compounds, 608 lipids and lipid-like molecules, 77 carbohydrates, 200 ketones, 81 organic acids, 419 organic heterocyclic compounds, 50 steroids, and 364 other compounds. Among these, lipids and lipid-like molecules, together with terpenoids and saponins, constituted the major components of the metabolic background across the five sample groups, collectively accounting for over 30% of the total identified metabolites (Supplementary Fig. S1). To ensure data quality, the relative quantitative values of all metabolites in quality control (QC) samples were analyzed. The QC samples showed strong positive correlations (Pearson correlation coefficient r > 0.99), indicating excellent instrumental stability and data reliability throughout the analytical process (Supplementary Fig. S2), thereby meeting the requirements for subsequent multivariate statistical analysis.
Based on the total peak areas of 15 categories of non-volatile compounds, flavonoids and flavonoid glycosides, terpenoids and saponins, and alkaloids were identified as the three most abundant compound classes across the five Minnan oolong tea varieties. Their abundance varied among the samples (Fig. 3a), forming the key chemical matrix that determines the taste characteristics of oolong tea[15]. Specifically, flavonoids and flavonoid glycosides, which contribute primarily to astringency and partially to bitterness, showed the highest peak areas in 'HD' and 'TGY'. This may be due to the high expression of genes associated with secondary metabolism in the fresh leaves of 'TGY'[16]. The peak area in 'TGY' was more than 14% higher than that in 'FS', explaining why 'TGY' exhibited a significantly higher bitterness response in the electronic tongue analysis. The high levels of catechins, anthocyanins, caffeine, and limonene found in fresh 'TGY' leaves could be a key factor in the formation of TGY's 'Yin Rhyme' flavor[16]. Terpenoids and saponins were most abundant in 'BYQL', exceeding the lowest level (found in 'MK1') by 19%. High saponin content can enhance soup thickness and amplify sweetness perception[17], aligning with the sensory observation of BYQL's thick, mellow liquor and low bitterness. Alkaloids were enriched in 'MK1'. Caffeine and other alkaloids are key contributors to bitterness and stimulant activity, yet they can also form complexes with polyphenolic oxides via hydrogen bonding, yielding compounds with umami taste[18], which explains the pronounced freshness in 'MK1' tea infusion. Notably, both sensory evaluation and electronic tongue detection indicated that 'MK1' was characterized by prominent sweetness and weak bitterness. This may be attributed to synergistic interactions among multiple components in the tea infusion, where the complexation between alkaloids and catechins likely reduces the concentration of free bitter compounds[18], which explains the pronounced freshness in 'MK1' tea infusion.
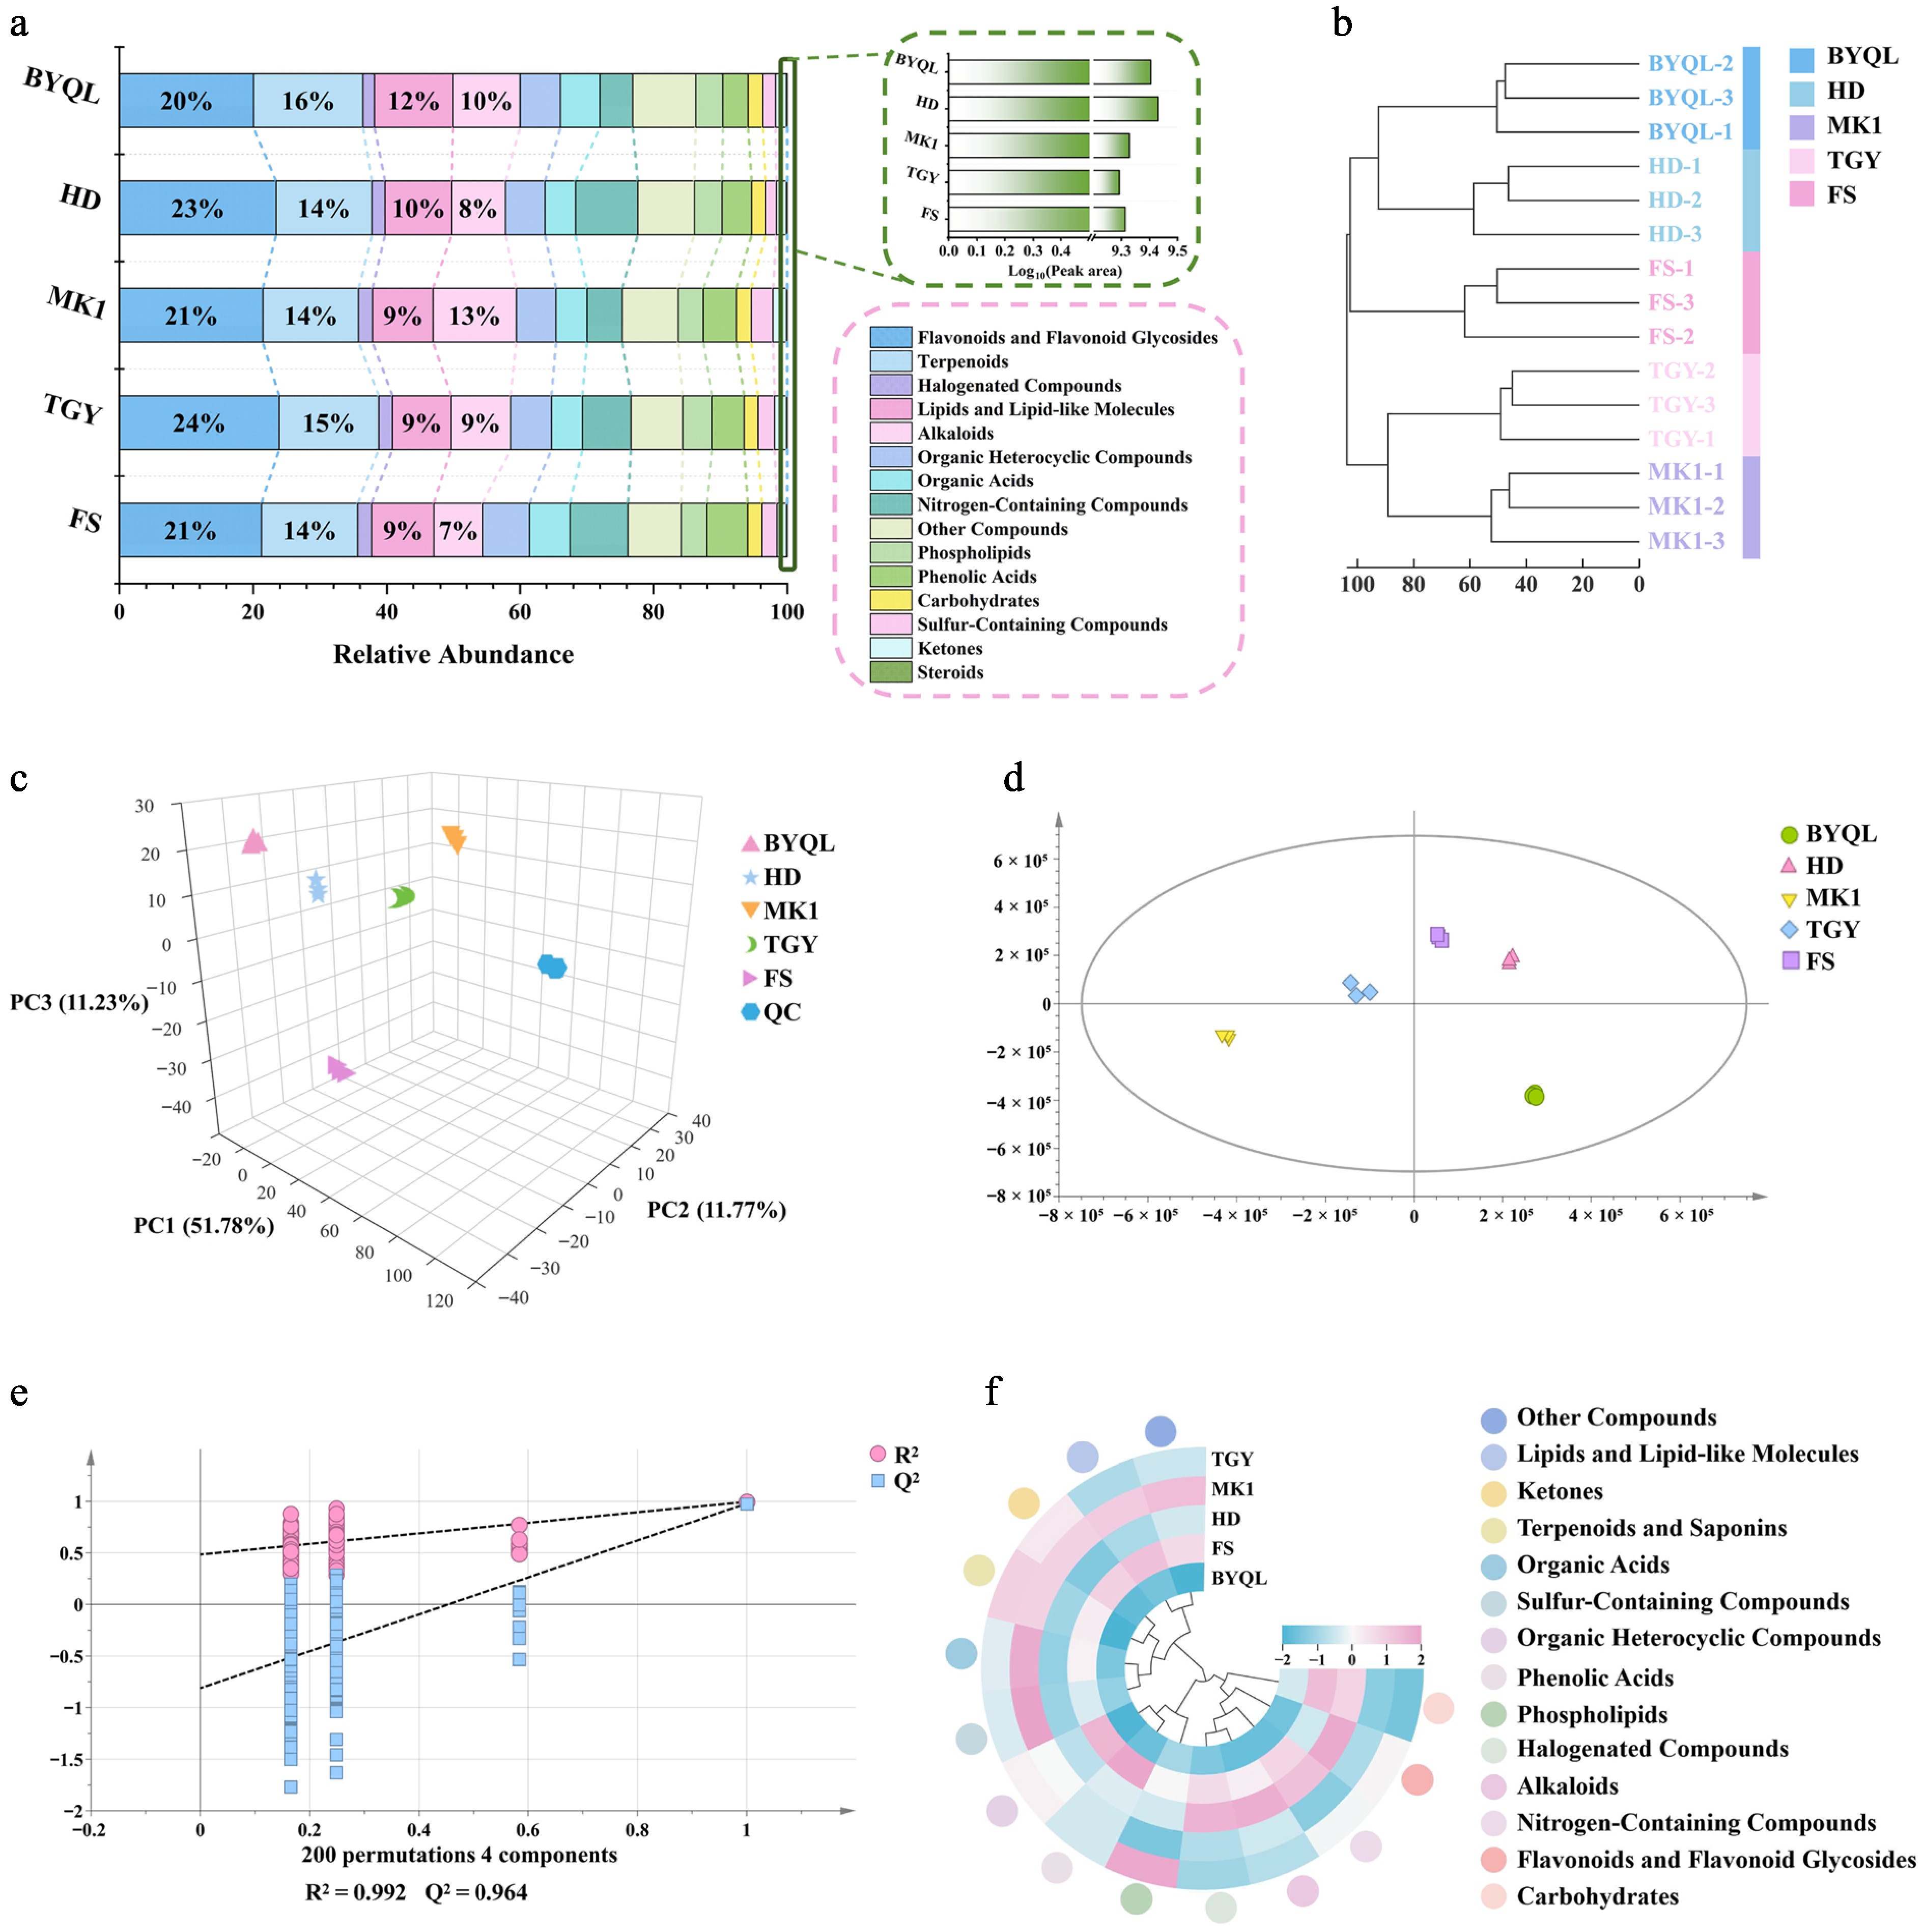
Figure 3.
Differential analysis of non-volatile compounds in tea samples based on non-targeted metabolomics. (a) Stacked bar plot showing the distribution of all identified non-volatile compounds across the five tea varieties. (b) Hierarchical clustering heatmap of samples based on metabolite profiles. (c) PCA score plot of non-volatile compounds from the five tea groups. (d) OPLS-DA score plot of non-volatile compounds from the five tea groups. (e) Permutation test plot (200 permutations, R2Y = 0.992, Q2 = 0.964). (f) Heatmap of differentially expressed non-volatile compounds (VIP > 1), with pink indicating high abundance and blue indicating low abundance.
Cluster analysis revealed clear separation among the five tea sample groups, with satisfactory intra-group reproducibility (Fig. 3b). In the PCA score plot, quality control (QC) samples were tightly clustered, confirming analytical stability and data reliability throughout the profiling process (Fig. 3c). The tea samples were distributed discretely in the three-dimensional space without overlap, preliminarily suggesting significant differences in chemical composition among varieties. The strong discriminatory performance of the OPLS-DA model (R2Y = 0.992, Q2 = 0.964, Fig. 3d) further supported this conclusion. In the score plot, 'BYQL', 'FS', 'HD', 'MK1', and 'TGY' samples exhibited clear inter-group separation and stable spatial distribution, a differentiation pattern primarily attributed to inherent genetic differences among the tea plant varieties. Based on the criteria of variable importance in projection (VIP) > 1 and fold change (FC) > 2, a total of 194 differentially expressed metabolites were identified. These comprised 12 alkaloids, 28 flavonoids and flavonoid glycosides, 17 lipids and lipid-like molecules, 26 terpenoids and saponins, 20 nitrogen-containing compounds, six saccharides, 10 halogenated compounds, five ketones, six organic acids, 13 organic heterocyclic compounds, 23 other compounds, 18 phenolic acids, four phospholipids, and six sulfur-containing compounds. The distribution patterns of these 14 metabolite classes across the five tea varieties are visualized in Fig. 3f. 'TGY' was characterized by higher abundances of terpenoids and saponins, along with elevated phospholipid content. 'MK1' showed enrichment in organic acids, ketones, and sulfur-containing compounds. 'HD' exhibited prominent accumulation of flavonoids and flavonol glycosides, alkaloids, nitrogen-containing compounds, and halogenated compounds, which may be directly associated with its notable antioxidant properties and distinct flavor characteristics[19]. In contrast, 'HD' exhibited lower phenolic acid content and higher tannin levels in the finished tea compared to fresh leaves, which is primarily attributed to the processing steps. During rolling and fermentation, polyphenol oxidase (PPO), and peroxidase (POD) were activated, catalyzing both the oxidation of phenolic acids into quinone intermediates—thereby reducing their content—and the oxidative polymerization of flavanols to form higher-order condensed tannins such as theaflavins and thearubigins[20]. 'FS' was distinguished by higher levels of saccharides, phenolic acids, organoheterocyclic compounds, and lipid molecules, suggesting active nitrogen and lipid metabolism that contributes to its rich mouthfeel[21]. In contrast, 'BYQL' demonstrated generally lower abundances across most metabolite categories, potentially indicating metabolic flux directed toward the accumulation of a limited number of specific compounds.
Identification and analysis of discriminatory non-volatile metabolites
-
Preliminary screening of differential compounds across the five tea varieties was performed using VIP values from the OPLS-DA model. To further identify characteristic metabolites specific to each variety, pairwise OPLS-DA models were constructed by comparing each variety against the remaining four (Supplementary Fig. S3). All five comparative models exhibited R2Y and Q2 values greater than 0.90, and permutation tests (200 iterations) confirmed negative intercepts of the Q2 regression lines, indicating robust explanatory power, predictive capability, and no overfitting. Based on these models, characteristic metabolites for each variety were selected using the following criteria: |p| > 0.05 and |p(corr)| > 0.5 from the S-plot, combined with VIP > 1, ANOVA p < 0.05, and fold change (FC) > 2. A total of 65 key differential metabolites were identified. A heatmap was generated to visualize their distribution patterns across the five varieties (Fig. 4a, Supplementary Table S2). Pheophorbide A (VIP = 17.0043) showed the highest VIP value. As a chlorophyll degradation product, its content indirectly reflects the extent of conversion of astringent and bitter substances during tea processing and is closely associated with a mellow and smooth taste of the tea infusion[20]. The abundance of pheophorbide A decreased in the order of 'HD', 'FS', 'TGY', 'MK1', and 'BYQL'.
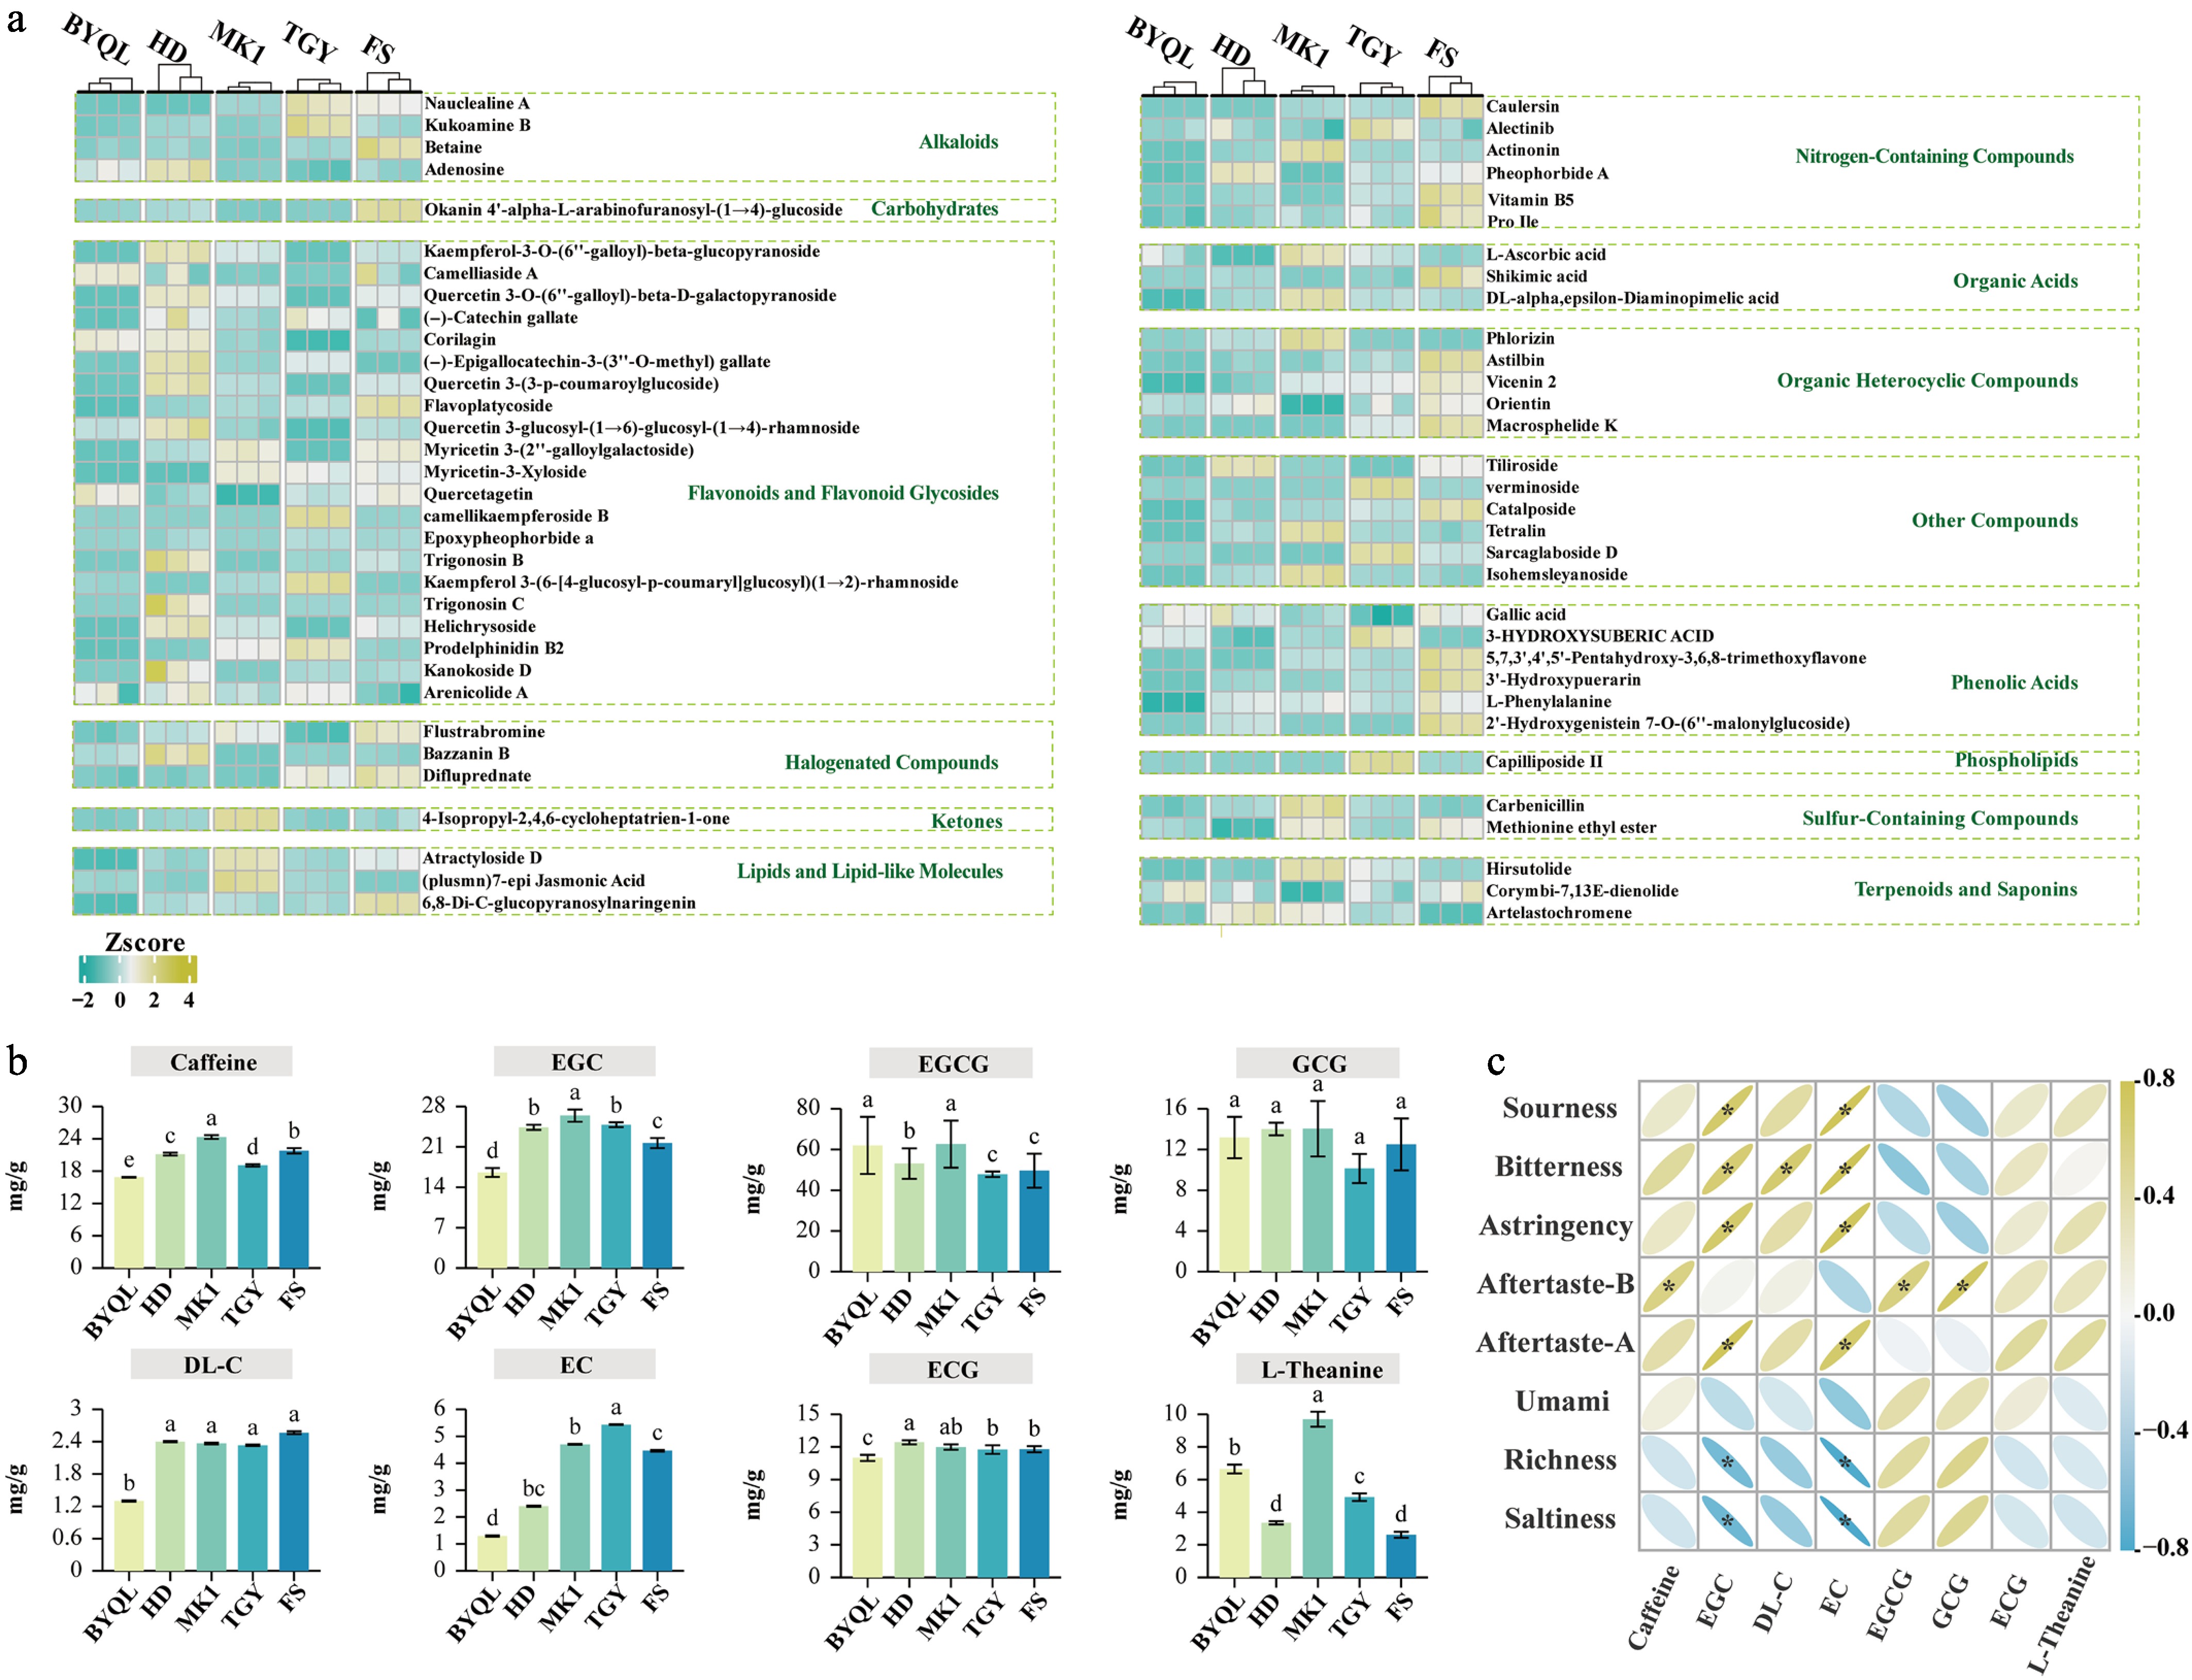
Figure 4.
Differential non-volatile compounds and their correlation with taste attributes in five oolong tea varieties. (a) Heatmap of key differential non-volatile compounds (screened with |p| > 0.05, |p(corr)| > 0.5, VIP > 1, ANOVA p < 0.05, and FC > 2; brown-yellow indicates high abundance, green indicates low abundance). (b) Comparison of caffeine, catechin, and L-theanine contents across the five tea groups (compound abbreviations correspond to: EGC: Epigallocatechin; EGCG: Epigallocatechin gallate; GCG: Gallocatechin gallate; DL-C: DL-catechin; EC: Epicatechin; ECG: Epicatechin gallate; different superscript letters indicate significant differences at p < 0.05). (c) Correlation analysis between taste attribute intensities and the contents of caffeine, catechins, and L-theanine (brown-yellow represents positive correlation, blue represents negative correlation. * Indicates p < 0.05).
Most flavonoids and flavonoid glycosides were predominantly accumulated in the 'HD' variety, with representative compounds including kaempferol-3-O-(6''-galloyl)-β-glucopyranoside, quercetin 3-(3-p-coumaroylglucoside), quercetin 3-glucosyl-(1→6)-glucosyl-(1→4)-rhamnoside, and quercetin 3-O-(6''-galloyl)-β-D-galactopyranoside. These glycosides are hydrolytically released during baking and storage stages, contributing to the characteristic color and flavor profile of the tea infusion. They are recognized as key constituents underlying the potential health benefits associated with oolong tea consumption. Additionally, substantially higher concentrations of (−)-epigallocatechin-3-(3''-O-methyl)gallate, and adenosine were detected in 'HD' compared to other varieties, suggesting their potential role as critical determinants of its distinctive sensory profile characterized by mild bitterness followed by a lingering sweet aftertaste.
In 'TGY', flavonoid glycosides including camellikaempferoside B and Kaempferol 3-(6-[4-glucosyl-p-coumaryl]glucosyl)(1→2)-rhamnoside were found to be particularly abundant. These kaempferol-based flavanol glycosides have been demonstrated to form water-soluble, structurally stable complexes through binding with sugar residues such as glucose and rhamnose[22]. From a sensory perspective, these compounds interact with salivary proteins to form astringent complexes that significantly contribute to the tea infusion's astringency[23]. However, this astringency should not be considered merely negative; it interacts synergistically with the sweetness, freshness, and mellowness of the tea infusion, contributing to the characteristic 'Yin rhyme' of 'TGY'.
'FS' exhibited characteristically elevated peak areas for components including vitamin B5, Pro Ile, betaine, shikimic acid, and L-phenylalanine. Among these, amino acids and related compounds play crucial roles in determining the fresh and crisp flavor profile. Pro Ile, a dipeptide with an exceptionally low taste threshold (approximately 0.3 mmol/L), has been shown to specifically activate umami receptors T1R1/T1R3 while simultaneously inhibiting bitter receptor T2R39. This dual mechanism significantly enhances the umami richness of tea infusion[24], explaining the high umami response values observed for 'FS' in electronic tongue analysis. Although L-phenylalanine itself possesses bitterness, it interacts with betaine's sweetness in the complex tea matrix, producing a taste-masking effect that substantially influences the overall flavor profile[25]. Shikimic acid, which accumulates through photorespiration during sun-drying and withering stages, serves as a common precursor for phenylpropanoid and terpenoid volatiles. During roasting, it undergoes Strecker degradation to form phenylacetaldehyde and 2-phenyl-2-butenal[26], thereby contributing to the characteristic floral-fruity and sweet aroma of 'FS'.
'MK1' was characterized by prominent peak values for myricetin 3-(2''-galloyl galactoside), myricetin-3-xyloside, (±)-7-epi-jasmonic acid, L-ascorbic acid, and DL-alpha,epsilon-Diaminopimelic acid. Myricetin glycosides demonstrated a strong correlation with tea infusion astringency intensity, with their content directly influencing mouthfeel perception[27]. Notably, the elevated concentration of L-ascorbic acid represents a key characteristic of 'MK1'. As an organic acid, it modulates the pH of the tea infusion, thereby affecting the solubility and molecular conformation of other flavor compounds and subsequently altering their recognition efficiency by taste receptors[28]. Moreover, L-ascorbic acid exhibits potent antioxidant capacity, effectively delaying the oxidative degradation of tea polyphenols while reducing the formation of brown pigments. This dual functionality contributes to maintaining the bright color and fresh taste profile characteristic of 'MK1' tea infusion[29].
The primary manifestation of 'BYQL' is an elevation in the peak areas of Camelliaside A, and gallic acid. Gallic acid, a key phenolic acid that is widely present in tea leaves, is mainly produced through tanninase hydrolysis of ester-type catechins during the rolling and fermentation stages. It plays a crucial role in determining the astringency, intensity, and colour browning of tea liquor[30]. It is noteworthy that gallic acid has been identified as a contributing factor to the sweet aftertaste of green tea[31]. Camelliaside A, a flavonol glycoside predominantly found in tea leaves, is formed through glycosylation modification of phenolic acids during metabolism. It exerts a substantial influence on the subtlety of astringency and the harmonious balance of flavours in tea liquor.
To quantitatively evaluate the contribution of key non-volatile metabolites to tea taste, absolute quantification was performed for caffeine, catechins, and L-theanine, and their dose-over-threshold (DOT) values were calculated (Supplementary Table S3). A DOT value greater than 1 indicates a significant taste contribution[32]. As shown in Fig. 4b, caffeine—a key bitter compound—was most abundant in 'MK1' (24.33 ± 0.32 mg/g), followed by 'FS' (21.80 ± 0.46 mg/g), and 'HD' (21.17 ± 0.21 mg/g), with lower levels in 'TGY' (19.07 ± 0.21 mg/g) and 'BYQL' (16.87 ± 0.06 mg/g). Among catechins, ester-type catechins such as EGCG and ECG exhibited significantly higher bitterness intensity than non-esterified forms such as EGC and EC[33]. Notably, EGCG, the most abundant catechin, was significantly higher in 'MK1' (62.63 ± 2.30 mg/g), and 'BYQL' (61.97 ± 2.85 mg/g) than in the other three varieties (by 8.86%–36.58%). Importantly, EGCG showed DOT values greater than 1 across all five varieties, confirming its substantial contribution to tea taste. Additionally, EGC, a non-ester catechin with a low taste threshold, was more abundant in 'TGY', 'HD', and 'MK1', whereas EC showed a decreasing trend across varieties ('TGY' > 'MK1' > 'FS' > 'HD' > 'BYQL'). L-Theanine, an important source of umami and sweetness that can mitigate bitterness, was highest in 'MK1' (9.71 ± 0.70 mg/g), followed by 'BYQL' (6.76 ± 0.35 mg/g), with other varieties containing less than 5 mg/g. These compositional differences significantly influence taste harmony. Correlation analysis (Fig. 4c) further revealed associations between compounds and sensory attributes. Caffeine and catechins were positively correlated with bitterness and astringency, with EC, EGC, and DL-C showing significant correlations (p < 0.05). L-Theanine was positively correlated with aftertaste-A and aftertaste-B. In contrast, high EGC content was negatively correlated with richness. In summary, key taste compounds—including caffeine, catechins, and L-theanine—significantly contribute to the distinct taste profiles of Minnan oolong tea varieties. The high levels of caffeine, catechins (e.g., EGCG and ECG), and L-theanine in 'MK1' contribute to its balanced bitterness and umami. Although 'BYQL' contains EGCG levels similar to 'MK1', its lower caffeine content reduces perceived bitterness, while its relatively high L-theanine enhances umami, forming a unique taste profile. In future work, additional reference standards will be collected to accurately quantify the taste contributions of important compounds. Taste recombination/omission experiments will also be conducted to investigate masking and synergistic effects among taste substances.
Profiling of volatile metabolites in five Minnan oolong tea varieties
-
The volatile profiles of five Minnan oolong tea varieties were characterized by headspace solid-phase microextraction comprehensive two-dimensional gas chromatography coupled with quadrupole time-of-flight mass spectrometry (HS-SPME/GC × GC-QTOFMS). A total of 111 volatile compounds were identified across all samples (Supplementary Table S4), comprising 10 alcohols (8.9%), seven aldehydes (6.3%), eight ketones (7.1%), 23 esters (20.5%), 35 alkenes (31.3%), 18 alkanes (16.1%), four nitrogen-containing compounds (3.6%), and seven other compounds (6.3%). Alkenes, alkanes, and esters constituted the predominant chemical classes, collectively representing over 65% of the total volatile composition, which aligns with previous findings[34]. Fu et al. analyzed the volatile compounds in fresh leaves from 22 major oolong tea cultivars in Fujian, identifying alcohols, aldehydes, and esters primarily[35]. The composition of these compounds differs remarkably from that in the dry tea, indicating that the complex manufacturing process of oolong tea significantly alters the accumulation and distribution of aroma compounds, thereby shaping its distinctive flavor. Esters, which exist in both free volatile and glycosylated forms, are widely distributed in tea leaves. The hydrolysis and re-esterification of ester bonds play a crucial role in regulating the release and persistence of floral and fruity aromas in oolong tea[36].
A total of 69, 62, 56, 51, and 49 volatile compounds were identified in 'BYQL', 'FS', 'HD', 'MK1', and 'TGY', respectively. Previous studies have shown that fresh 'FS' leaves contain the fewest volatile components compared with other varieties, pointing to the essential role of processing in driving the transformation and accumulation of aroma compounds in this cultivar[35]. Analysis of chemical group distribution revealed that alkenes constituted over 50% of the average relative content in 'BYQL', 'MK1', and 'HD', forming the fundamental aroma skeleton. This is consistent with the distribution of volatile components in fresh leaves. The high proportion of alkanes may be due to the presence of waxy substances composed of alkanes in the tea leaves[34].'FS' showed comparable levels of alcohols and alkenes, while 'TGY' exhibited the highest proportion of nitrogen-containing compounds (53.1%) (Fig. 5b, c). Analyses of fresh leaves from 22 oolong tea varieties revealed a set of 61 volatile compounds common to all, including major constituents such as (E)-3-hexenyl acetate, linalool, geraniol, and methyl salicylate[35]. Twenty-five aroma compounds were shared across all samples (Fig. 5d), primarily consisting of alcohols, esters, alkenes, and alkanes, which are suggested to form the fundamental basis of the characteristic aroma profile of Minnan oolong tea. Principal component analysis (Fig. 5e) indicated that the first two principal components accounted for 78.36% of the total variance, effectively capturing the overall variability in volatile composition among the tea varieties. 'MK1' and 'TGY' were clustered on the positive side of the X-axis, indicating high similarity in their aroma composition, potentially attributable to genetic relatedness. The remaining samples were distinctly separated, supporting the utility of volatile compounds for varietal discrimination. Cluster analysis demonstrated clear separation among the five varieties, with 'TGY' being most distantly related to 'BYQL' and 'FS' (Fig. 5f), reflecting substantial differences in their volatile compound profiles.
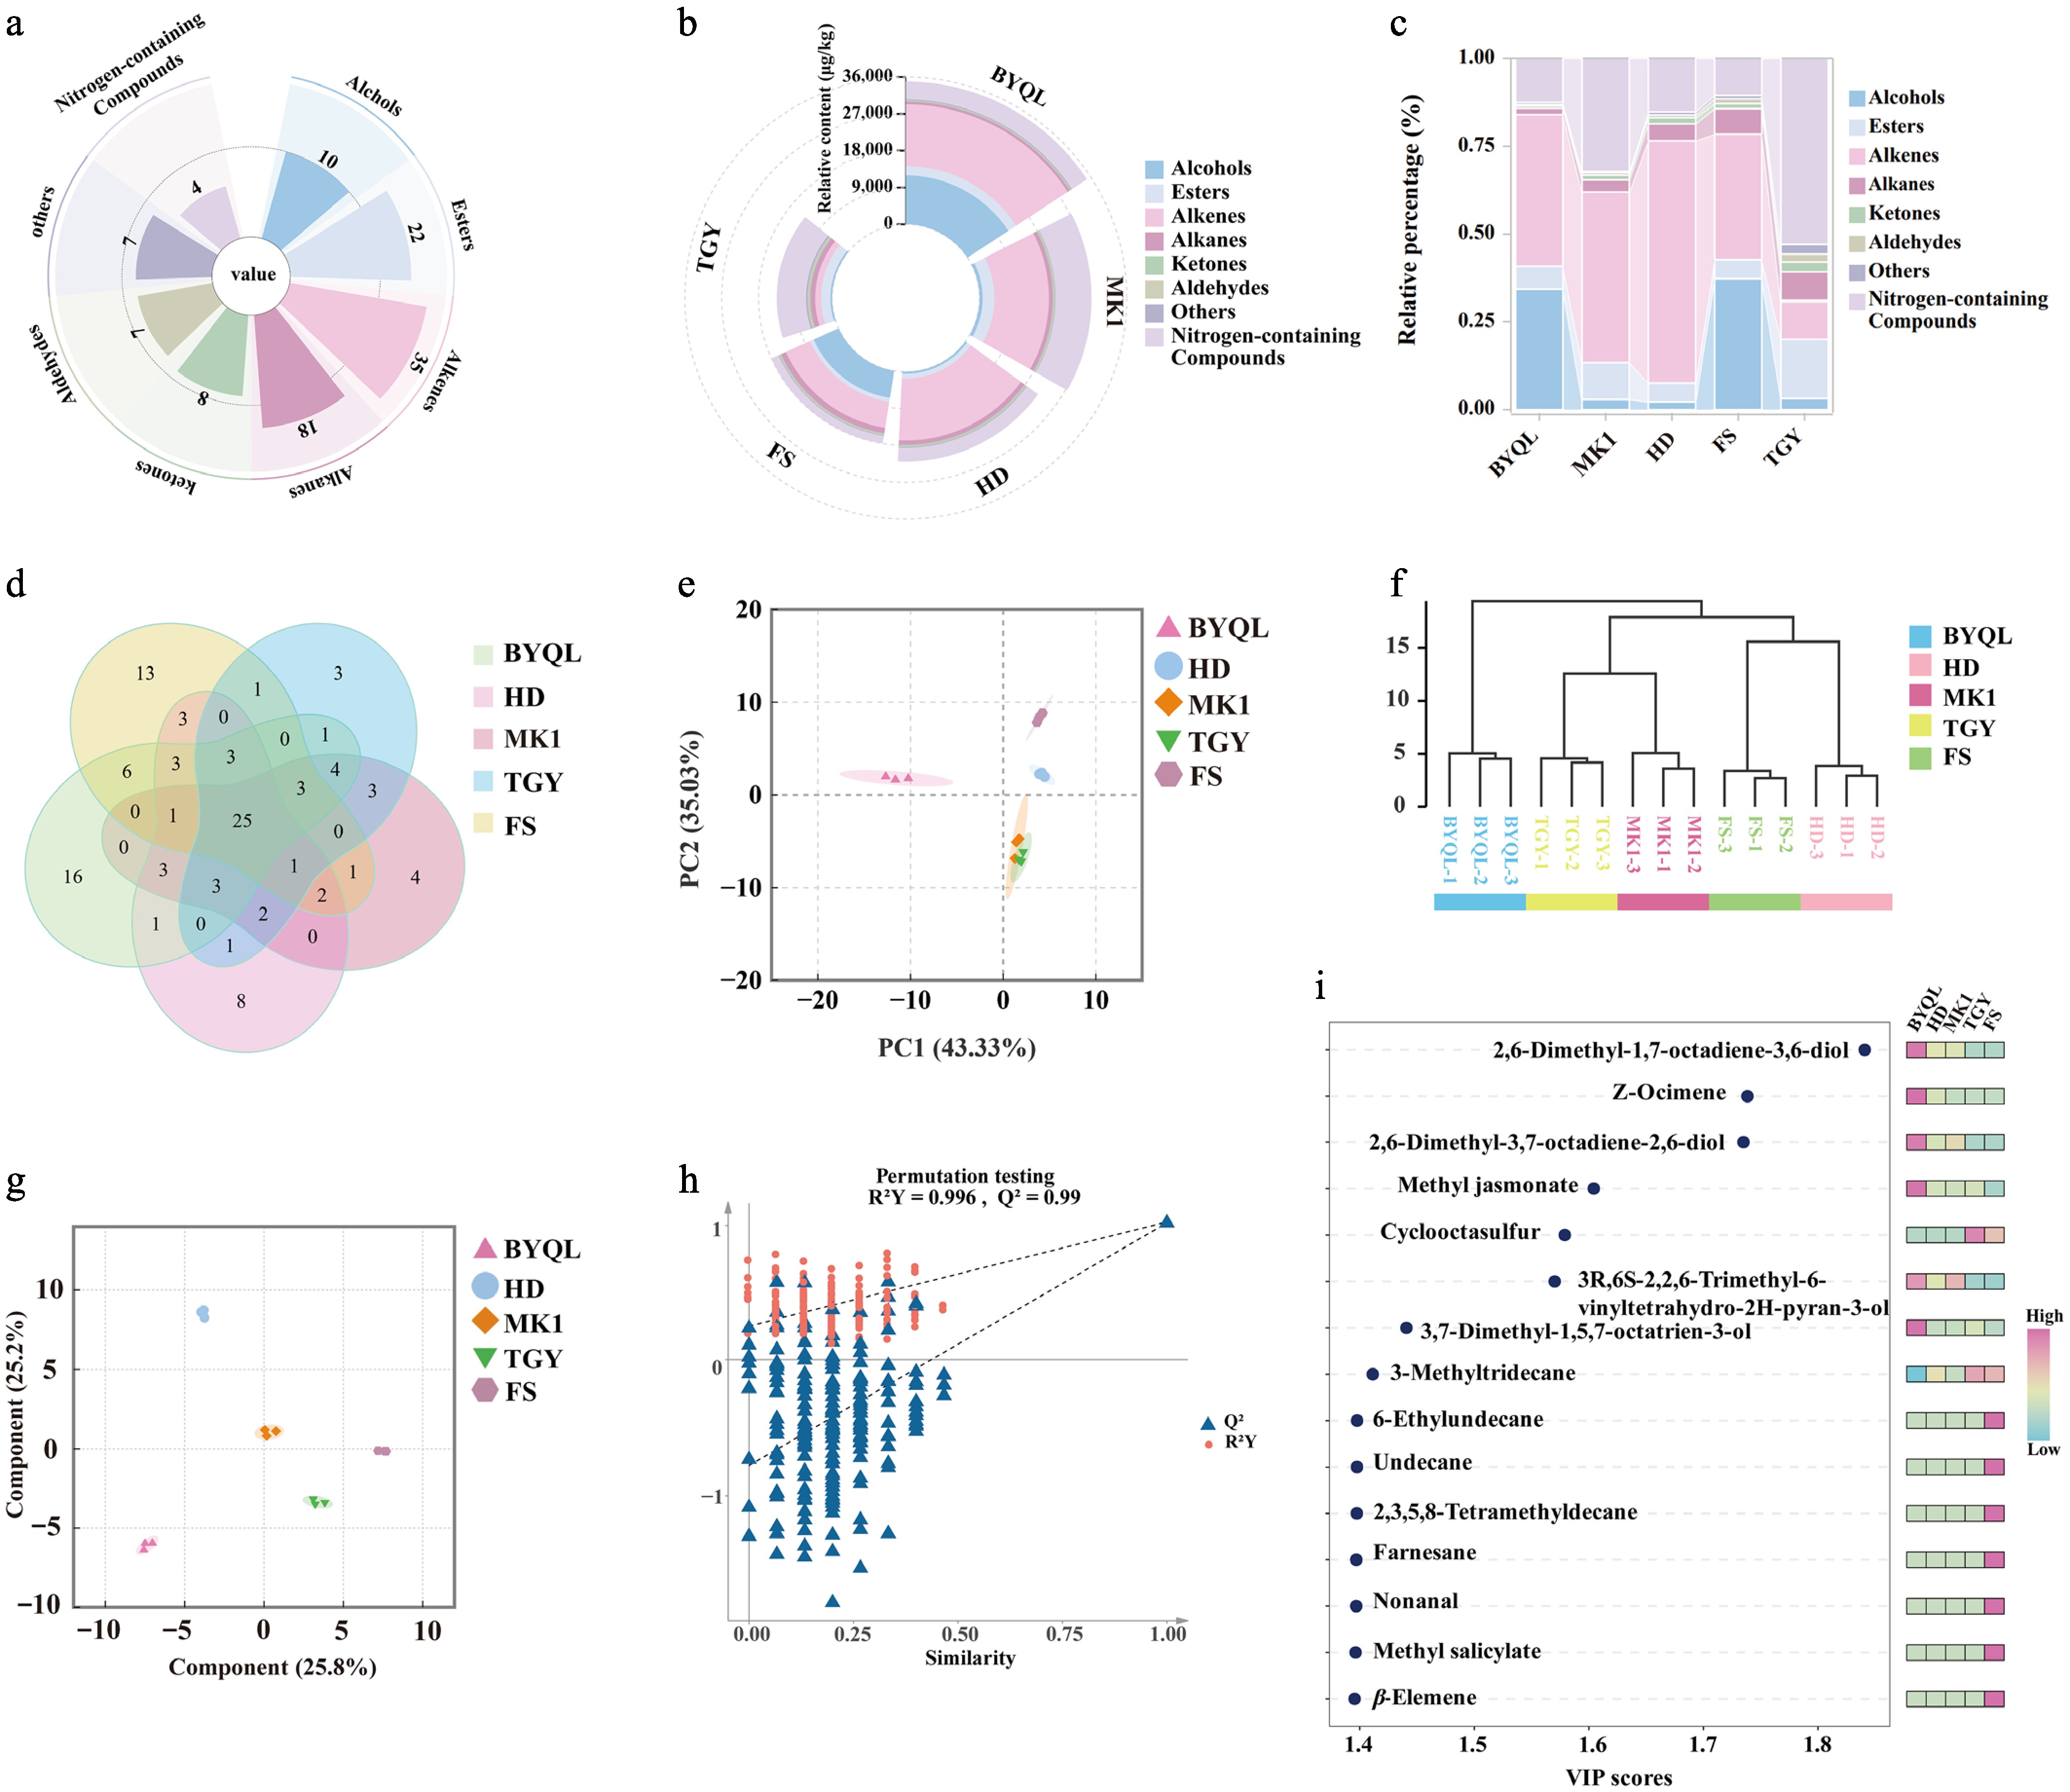
Figure 5.
Differential analysis of volatile compounds among five oolong tea varieties. (a) Proportion of volatile compound categories and quantities across the five tea groups. (b) Relative content (μg/kg) of volatile compounds in the five tea groups. (c) Stacked percentage plot of volatile compound distribution. (d) Venn diagram of volatile compounds across the five tea varieties. (e) Hierarchical clustering analysis of the five oolong tea samples. (f) PCA score plot of volatile compounds. (g) OPLS-DA score plot of volatile compounds. (h) Permutation test plot (200 permutations, R2Y = 0.996, Q2 = 0.99). (i) Heatmap of the top 15 volatile compounds ranked by VIP values (red indicates high abundance, blue indicates low abundance).
Discriminatory volatile compounds in five Minnan oolong tea varieties
-
To identify volatile compounds capable of discriminating the five tea varieties, OPLS-DA was performed. Model reliability was confirmed through cross-validation (Fig. 5h), with the negative intercept of the Q2 regression line indicating no overfitting. Clear separation among the five tea samples was observed, and their distribution patterns in the score plot aligned well with electronic nose results. Using VIP ≥ 1.0 and p < 0.05 as selection criteria, 47 differential volatile compounds were identified (Fig. 5i), comprising 13 esters, 10 alkanes, eight alkenes, six alcohols, four aldehydes, two nitrogen-containing compounds, two ketones, and two other compounds. Variations in the composition and concentration of these compounds form the fundamental basis for the distinct aroma characteristics of different oolong tea varieties.
As shown in Fig. 5i, 2,6-dimethyl-1,7-octadien-3,6-diol (VIP = 1.84) showed the highest VIP value in the model. This compound was detected in three varieties: 'BYQL' (64.197 ± 6.354 μg/kg), 'HD' (19.539 ± 2.711 μg/kg), and 'MK1' (16.383 ± 3.661 μg/kg). It exhibits floral and fruity characteristics, and represents a key aroma compound in tea, particularly abundant in oolong and black teas infested by green leafhoppers[37]. Methyl jasmonate (VIP = 1.60) was identified in all five tea samples, with concentrations ranging from 35.811 ± 2.968 μg/kg in 'FS' to 131.012 ± 33.322 μg/kg in 'BYQL'. Its accumulation in oolong tea primarily depends on jasmonic acid carboxymethyl transferase (JMT) catalysis and glycoside degradation, contributing a fresh magnolia-like fragrance[38]. The significantly higher content in 'BYQL' identifies it as a characteristic aroma compound of this variety. Phenethyl alcohol (VIP = 1.05) is formed during withering and fermentation through phenylalanine ammonia-lyase (PAL) catalysis[39]. It was highly enriched in 'MK1' (391.358 ± 144.831 μg/kg), imparting a distinctive rose aroma, while present at lower levels in 'HD' (42.557 ± 10.418 μg/kg), and undetectable in 'FS'. This distribution pattern may reflect varietal differences in metabolic pathways, where phenethyl alcohol potentially undergoes further oxidation to phenylethylaldehyde in some varieties, reducing its accumulation. Several compounds showed variety-specific distributions. For instance, farnesane (106.050 ± 5.799 μg/kg), methyl salicylate (28.486 ± 3.399 μg/kg), and β-elemene (58.963 ± 10.131 μg/kg) were exclusively detected in 'FS', contributing floral-fruity, cool minty, and woody-sweet notes, respectively, to its unique aroma profile. Notably, methyl salicylate, which is present at relatively high levels in fresh 'MK1' leaves, was not detected in the processed 'MK1' tea, implying its potential degradation or transformation during processing[35]. Additionally, δ-Cadinene (woody note) was characteristic of 'HD', while 2-Nitroethylbenzene l (floral note) reached its highest concentration in 'MK1', further enhancing its rich floral character. The aromatic differences among oolong tea varieties appear to originate from their distinct volatile compound profiles, though further validation is required to confirm the specific contributions of these volatiles to the overall aroma.
Key aroma-active compounds in five varieties of Minnan oolong tea
-
The contribution of volatile compounds to tea aroma characteristics depends on both their concentrations and corresponding odor thresholds. Typically, compounds with ROAV value > 1 are considered aroma-active[40]. In this study, 37 volatile compounds with ROAV > 1 were identified (Fig. 6a, Supplementary Table S5). Ten compounds were common across all tea varieties, including 3,7-Dimethyl-1,5,7-octatrien-3-ol (floral), indole (floral), α-Ionone (floral, fruity), linalool (floral, fruity), phenylacetaldehyde (floral), α-Copaene (honey-like), cis-jasmone (fresh, floral), Safranal (herbal, fruity), (Z,E)-α-farnesene (floral), and dihydrokiviol (floral). These shared compounds are considered to collectively form the fundamental aroma profile of Minnan oolong tea. Indole, a distinctive aroma compound that differentiates oolong tea from green, black, and white teas, serves as a characteristic component formed during the shaking process of oolong tea production[1]. Higher ROAV values were observed for indole in 'TGY' and 'MK1', establishing it as a fundamental component of their floral aroma. α-Farnesene (floral, fruity) was detected in 'TGY', 'BYQL', and 'MK1', while E-nerolidol (floral, fruity, woody) was identified in 'BYQL' and 'FS'. These compounds represent characteristic aroma components that further define the unique aromatic profiles of their respective tea varieties[41]. The number of key aroma compounds with ROAV > 100 identified in 'TGY', 'BYQL', 'HD', 'MK1', and 'FS' were five, four, four, four, and two, respectively. These included β-ocimene, β-ionone, trans-β-ionone, β-cyclocitral, 3,7-dimethyl-1,5,7-octatrien-3-ol, β-caryophyllene, 2-nitroethylbenzene, and neophytadiene. Notably, β-ocimene was unique to 'TGY' (ROAV = 10,403.30), contributing an intense sweet floral aroma due to its extremely low odor threshold. Neophytadiene was exclusively detected in 'HD' (ROAV = 133.10), imparting fresh and fruity notes. β-Caryophyllene, a key compound associated with sweet woody aromas, was primarily distributed in 'BYQL', 'HD', and 'MK1'. β-Ionone, characterized by floral-fruity notes with woody undertones, is formed through oxidative degradation of β-carotene during oolong tea processing and was identified as a key aroma-active component in 'TGY' (ROAV = 9,661.97), 'BYQL' (ROAV = 14,501), 'HD' (ROAV = 26,868.50), and 'FS' (ROAV = 20,899.45). 3,7-Dimethyl-1,5,7-octatrien-3-ol, which exhibits floral characteristics, was significantly more concentrated in 'BYQL' than in the other four varieties, contributing to its rich floral character. However, ROAV values derived from relative content calculations have limitations in accurately quantifying the contribution of aroma-active compounds to characteristic aroma formation. Future work will emphasize absolute quantification of key aroma-active compounds, combined with aroma recombination and omission experiments, to further elucidate their individual contributions and interactive effects.
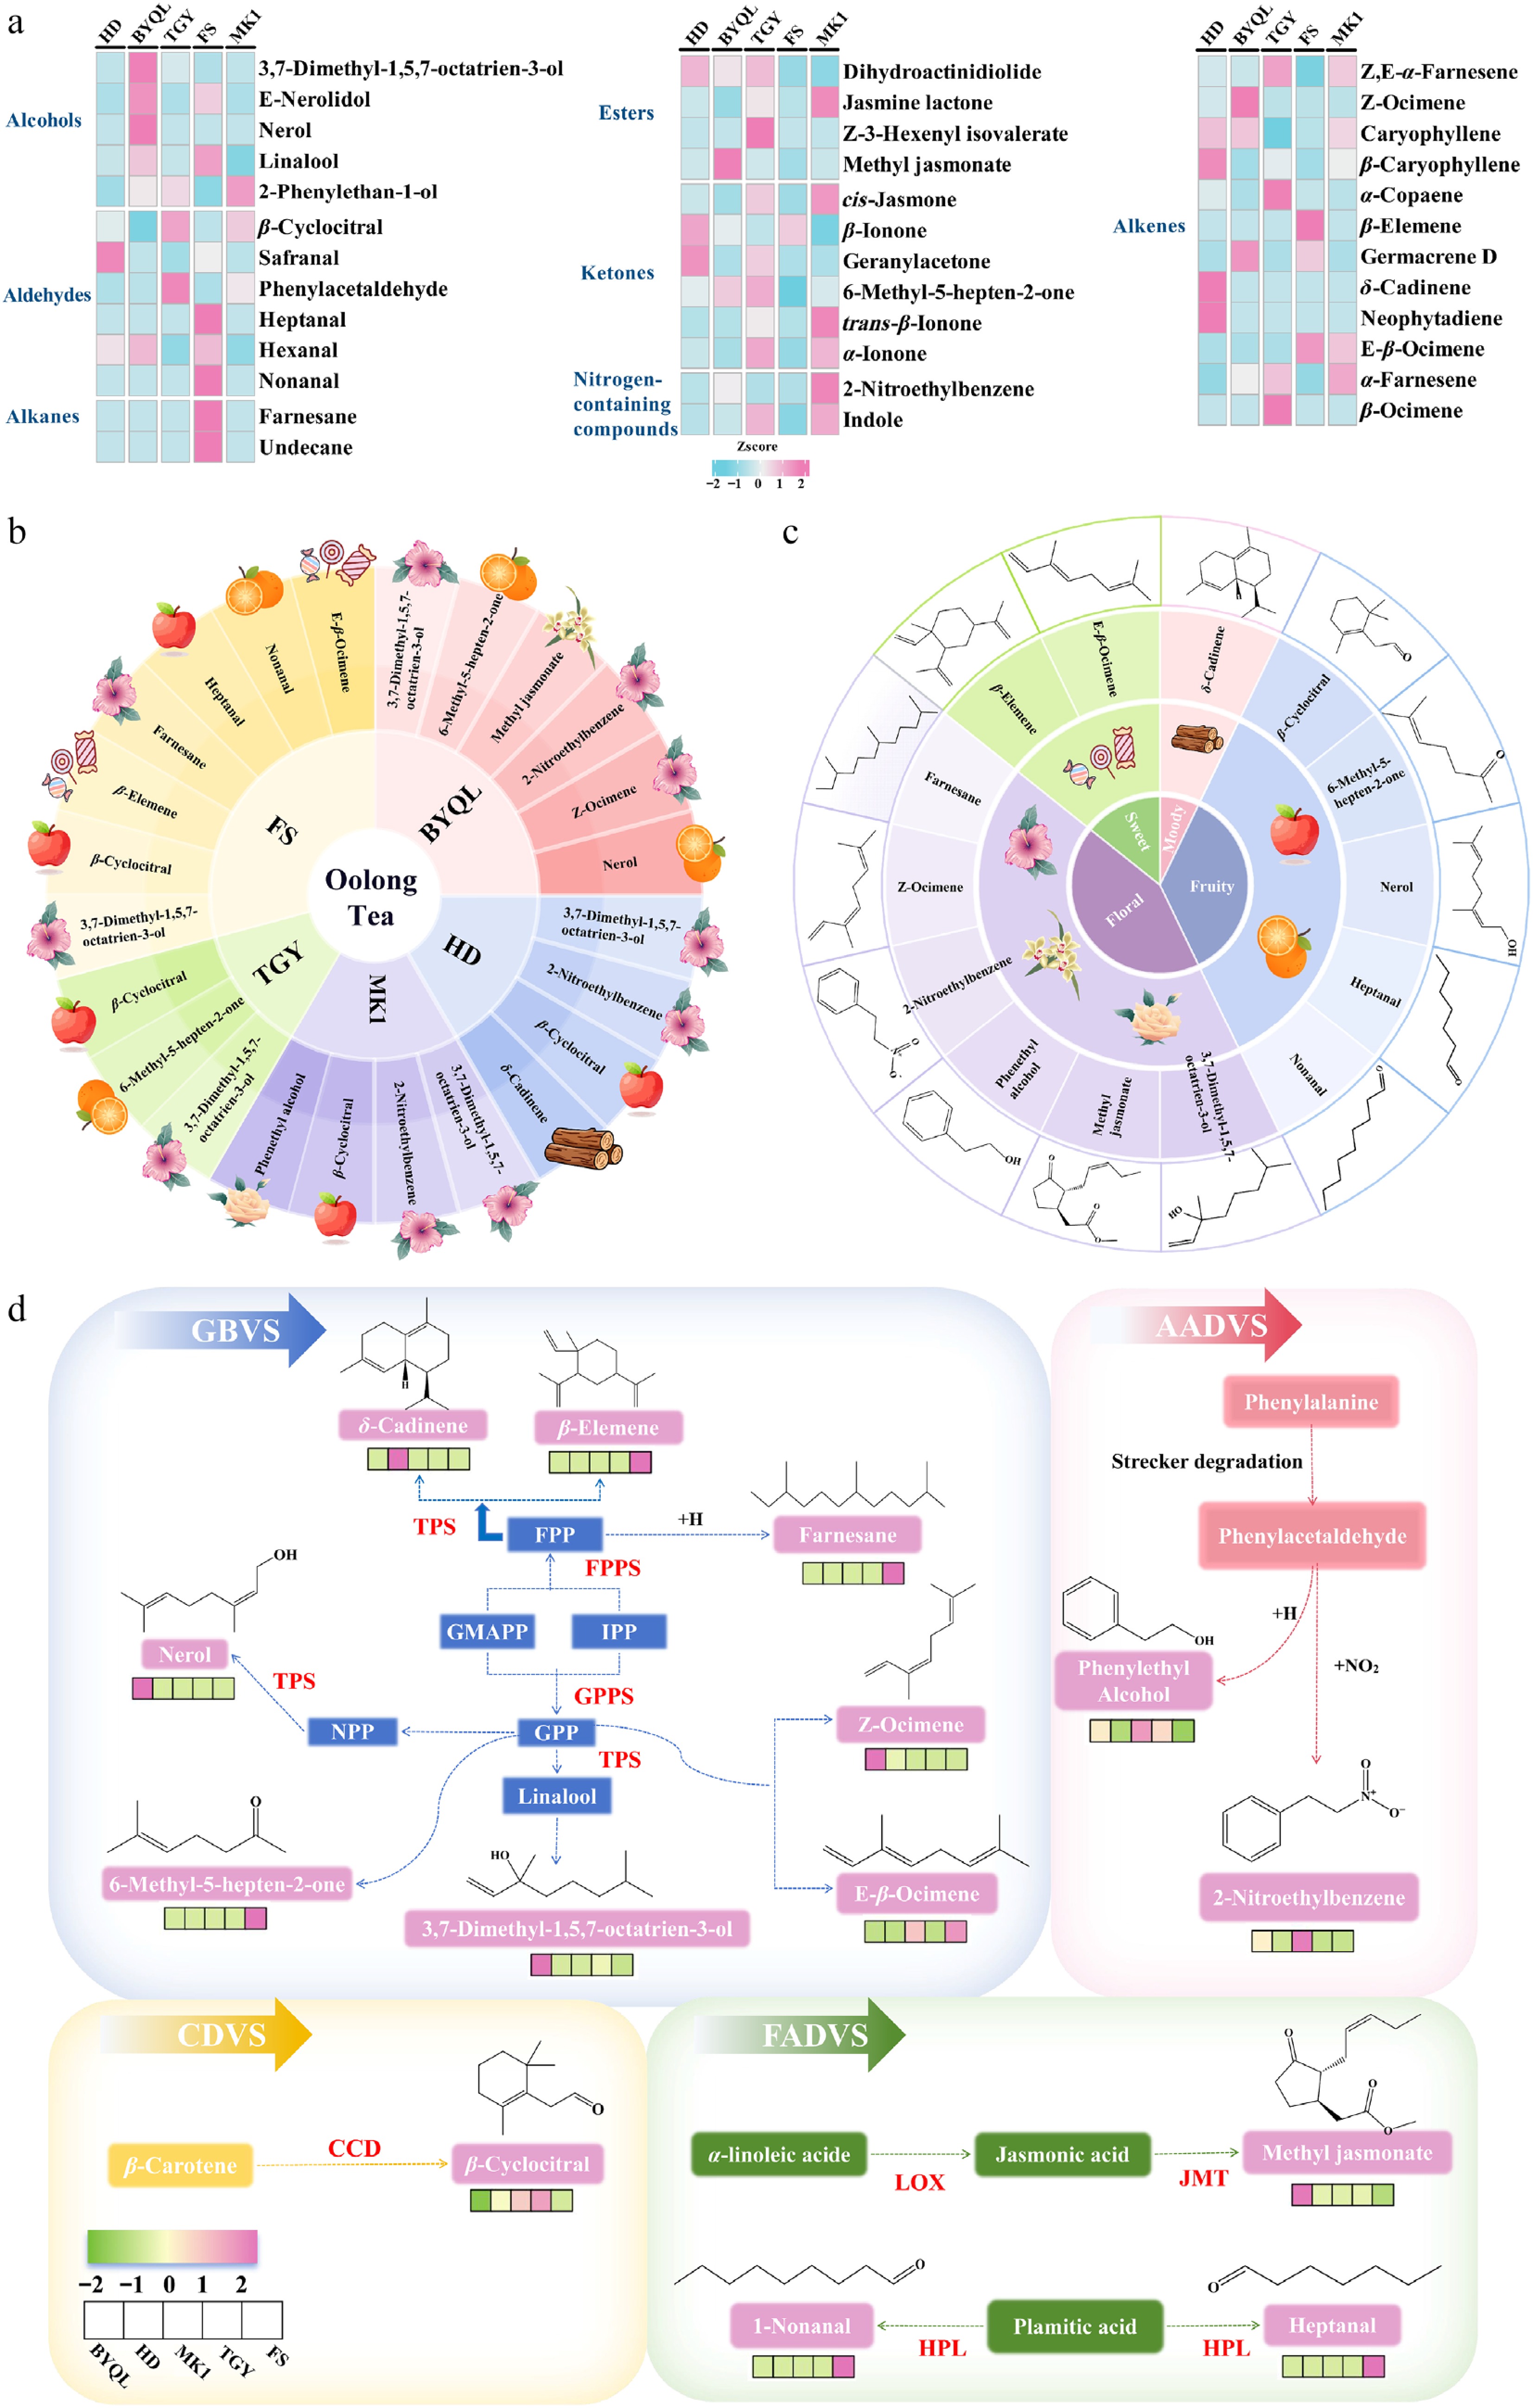
Figure 6.
(a) Heatmap showing the distribution of aroma-active compounds (ROAV > 1) across the five oolong tea varieties (pink indicates high abundance, blue indicates low abundance). (b) Distribution wheel of key aroma-active compounds in different oolong tea varieties. (c) Flavor wheel of key aroma compounds with four concentric layers representing: compound classification, aroma descriptors, compound names, and chemical structures. (d) Biosynthetic pathways of key aroma-active compounds in the five oolong tea varieties. Abbreviations: DMAPP, dimethylallyl diphosphate; IPP, isopentenyl diphosphate; GPPS, geranyl pyrophosphate synthase; FPPS, farnesyl diphosphate synthase; TPS, terpene synthase; LOX, lipoxygenase; CCD, carotenoid cleavage dioxygenase; JMT, jasmonic acid carboxyl methyltransferase; HPL, hydroperoxide lyase.
Based on OPLS-DA modeling and ROAV analysis, 14 key aroma compounds (VIP > 1.0, ANOVA p < 0.05, ROAV > 1) were identified across the five Minnan oolong tea varieties. According to their aroma attributes, these compounds were categorized as follows: nerol, 6-methyl-5-hepten-2-one, β-cyclocitral, heptanal, and nonanal primarily contributed sweet, fruity, and citrus notes; phenethyl alcohol, farnesane, methyl jasmonate, 3,7-dimethyl-1,5,7-octatrien-3-ol, (Z)-ocimene, and 2-nitroethylbenzene were associated with orchid and rose floral characteristics; β-elemene and (E)-β-ocimene exhibited predominantly sweet aromas; while δ-cadinene imparted woody notes. An aroma wheel was constructed based on these key aromatic compounds (Fig. 6b), systematically visualizing their collective contribution to the aroma characteristics of Minnan oolong teas (Fig. 6c). Furthermore, potential formation pathways of these key aroma compounds were summarized from the perspective of metabolic precursors through literature review[42,43]. Classification of the 14 key aroma compounds by precursor origin revealed four distinct categories: eight glycoside-bound volatiles (GBVs), two amino acid-derived volatiles (AADVs), one carotenoid-derived volatile (CDV), and three fatty acid-derived volatiles (FADVs). The precursors of glycoside-bound volatiles (GBVs) are derived from the enzymatic conversion of isopentenyl diphosphate (IPP) and dimethylallyl diphosphate (DMAPP), stored as conjugated forms such as β-D-glucosides in fresh tea leaves. During processing, mechanical disruption from shaking and thermal effects from roasting collectively activate endogenous β-glucosidase, catalyzing the hydrolysis of glycosidic conjugates[44]. This process releases free volatile compounds, including 3,7-dimethyl-1,5,7-octatrien-3-ol and nerol, leading to their significant accumulation and consequent enhancement of tea aroma quality[45]. Of particular significance, (E)-β-ocimene, a representative GBV, has been identified as a key synergistic component in the formation of jasmine-like aroma in 'Chungui' oolong tea[46]. Fatty acid-derived volatiles (FADVs) such as heptanal and nonanal are generated through lipid peroxidation and degradation, particularly during the shaking stage, contributing fruity undertones to the tea's aroma profile. The accumulation of heptanal has been demonstrated to help establish the distinctive milky aroma characteristic of Jinxuan oolong tea[47]. It is noteworthy that methyl jasmonate serves not only as a direct contributor to floral notes but also as an important signaling molecule that induces the synthesis of secondary metabolites during mechanical injury caused by shaking. Amino acid-derived volatiles (AADVs), represented by 2-nitroethylbenzene, are synthesized via Strecker degradation or deamination of L-alanine. Specifically, phenethyl alcohol has been confirmed as a critical constituent of the rose-like scent in oolong tea[48]. Carotenoid-derived volatiles (CDVs) such as β-cyclocitral are produced through carotenoid cleavage dioxygenase (CCD)-catalyzed oxidation during processing[49], further enriching the aromatic complexity of Minnan oolong tea.
-
To distinguish Minnan oolong tea made from different varieties and to screen for varietal markers, five tea varieties were processed into Minnan oolong tea. Distinct flavor profiles of each variety were revealed through quantitative descriptive analysis: 'BYQL' exhibited prominent floral and roasted notes with low bitterness; both 'TGY' and 'HD' demonstrated intense floral and fruity aromas; 'FS' was characterized by sweet and woody attributes accompanied by pronounced bitterness and astringency; while 'MK1' displayed high umami, sweetness, and fruity characteristics. Intelligent sensory discrimination enabled rapid and reliable varietal classification based on volatile and taste profiles. Metabolomic investigations further uncovered the chemical basis of these flavor differences. Among the non-volatile metabolites, 65 key differential compounds were identified. High accumulation of flavonoids and flavonoid glycosides in 'HD' and 'TGY' was associated with astringency and the characteristic 'Yin rhyme' sensation. 'FS' was enriched with umami-enhancing compounds, including prolyl-isoleucine and betaine, explaining its pronounced umami attributes. Elevated levels of L-ascorbic acid and myricetin glycosides in 'MK1' contributed to its fresh taste and enhanced astringency. The high terpenoid and saponin content in 'BYQL' improved the mellow profile while reducing bitterness perception. Absolute quantification combined with DOT values further confirmed the taste contributions of key components such as catechins. Volatile profiling identified 111 compounds, predominantly alkenes, alkanes, and esters, of which 47 were identified as varietal markers (VIP ≥ 1.0, p < 0.05). Among these, 37 aroma-active compounds (ROAV > 1) significantly contributed to the distinct aroma characteristics. Integrated OPLS-DA and ROAV analyses identified 14 key aroma compounds derived from four metabolic pathways: glycoside-bound, amino acid-derived, carotenoid-derived, and fatty acid-derived volatiles.
This research establishes an integrated framework combining sensory evaluation, electronic sensing, and non-targeted metabolomics for discriminating quality variations among Minnan oolong tea varieties. The identification of varietal markers provides a scientific basis for addressing the long-standing issue of 'variety-commercial name confusion' in tea markets. Future studies should expand sample diversity and incorporate transcriptomics to elucidate the genetic regulatory mechanisms underlying key flavor metabolite biosynthesis, thereby enhancing methodological robustness and deepening the comprehensive understanding of flavor formation mechanisms in Minnan oolong teas.
This work was supported in part by the National Natural Science Foundation of China (32341049, 32494780) and Research on the Roasting Process and Quality Characteristics of Zhangping Shuixian Tea (KH250223A).
-
National regulations do not mandate ethics approval or the establishment of a human ethics committee for sensory reviews. The appropriate protocols for protecting the rights and privacy of all participants were utilized during the execution of this research.
-
The authors confirm their contributions to the paper as follows: conceptualization: Xie H, Liu A; methodology: Xie H, Wu Y; investigation: Xie H, Zhang M, Wu Y, Huang J, Zhang S; data curation, formal analysis, validation: Zhang M; visualization: Xie H; writing − original draft: Xie H, Zhang M; writing − review and editing: Xie H, Liu Z, Liu A; supervision: Liu Z, Liu A; funding acquisition: Liu A. All authors reviewed the results and approved the final version of the manuscript.
-
All data generated or analyzed during this study are included in this published article and its supplementary information files.
-
The authors declare that they have no known competing financial interests or personal relationships that could have appeared to influence the work reported in this paper.
-
# Authors contributed equally: Han Xie, Mengcong Zhang
- Supplementary Table S1 Information on non-volatile compounds.
- Supplementary Table S2 Discriminatory non-volatile metabolites among minnan oolong tea varieties.
- Supplementary Table S3 Concentrations and DOT values of caffeine, catechins and L-theanine.
- Supplementary Table S4 Information of volatile compounds.
- Supplementary Table S5 Volatile compounds with ROAV > 1 in five Minnan oolong tea cultivars.
- Supplementary Fig. S1 Donut chart of non-volatile metabolite class proportions across five Minnan oolong tea cultivars.
- Supplementary Fig. S2 Pearson correlation heatmap of metabolite relative quantification values in quality control (QC) samples under positive and negative ionization modes.
- Supplementary Fig. S3 Scores plots (A–E) and S-plots (F–J) of OPLS-DA models for BYQL, FS, HD, MK1, and TGY varieties compared to the other varieties.
- Copyright: © 2026 by the author(s). Published by Maximum Academic Press, Fayetteville, GA. This article is an open access article distributed under Creative Commons Attribution License (CC BY 4.0), visit https://creativecommons.org/licenses/by/4.0/.
-
About this article
Cite this article
Xie H, Zhang M, Wu Y, Huang J, Zhang S, et al. 2026. Variety-driven flavor differentiation in Minnan oolong teas: integrative analysis by electronic sensory technologies and non-targeted metabolomics. Beverage Plant Research 6: e016 doi: 10.48130/bpr-0026-0001 

Variety-driven flavor differentiation in Minnan oolong teas: integrative analysis by electronic sensory technologies and non-targeted metabolomics
- Received: 01 December 2025
- Revised: 25 December 2025
- Accepted: 05 January 2026
- Published online: 29 April 2026
Abstract: Tea variety significantly influences the flavor of oolong tea, yet inconsistent market labeling hinders varietal authentication. This study employed integrated electronic sensing and high-resolution metabolomics (UHPLC-MS/MS; GC × GC-QTOFMS) to profile five Minnan oolong teas (Baiya Qilan, Huangdan, Mingke 1, Tieguanyin, Foshou). Distinct sensory profiles were observed: 'Baiya Qilan' characterized persistent orchid aroma; 'Huangdan' presented floral and sweetness; 'Mingke 1' displayed rich and balanced flavor; 'Tieguanyin' was typified by elegant orchid fragrance; 'Foshou' featured sweet, fruity, and woody. Intelligent sensing successfully discriminated varieties using e-nose sensors (W3C, W6S, W3S), and e-tongue indicators (bitterness, saltiness, richness). Non-targeted metabolomics identified 3,949 non-volatile, and 111 volatile metabolites, with 65 key differential non-volatile screened as varietal markers via multivariate analysis. VIP and ROAV analyses revealed 14 key aroma-active compounds (nerol, phenethyl alcohol, farnesene, etc.) that contribute to floral, fruity, sweet, and woody notes, with their biosynthetic pathways elucidated. The aroma wheel of different varieties of Minnan oolong tea was established. This work establishes an objective framework for varietal identification and quality assessment while providing mechanistic insights into flavor formation in Minnan oolong teas.