-
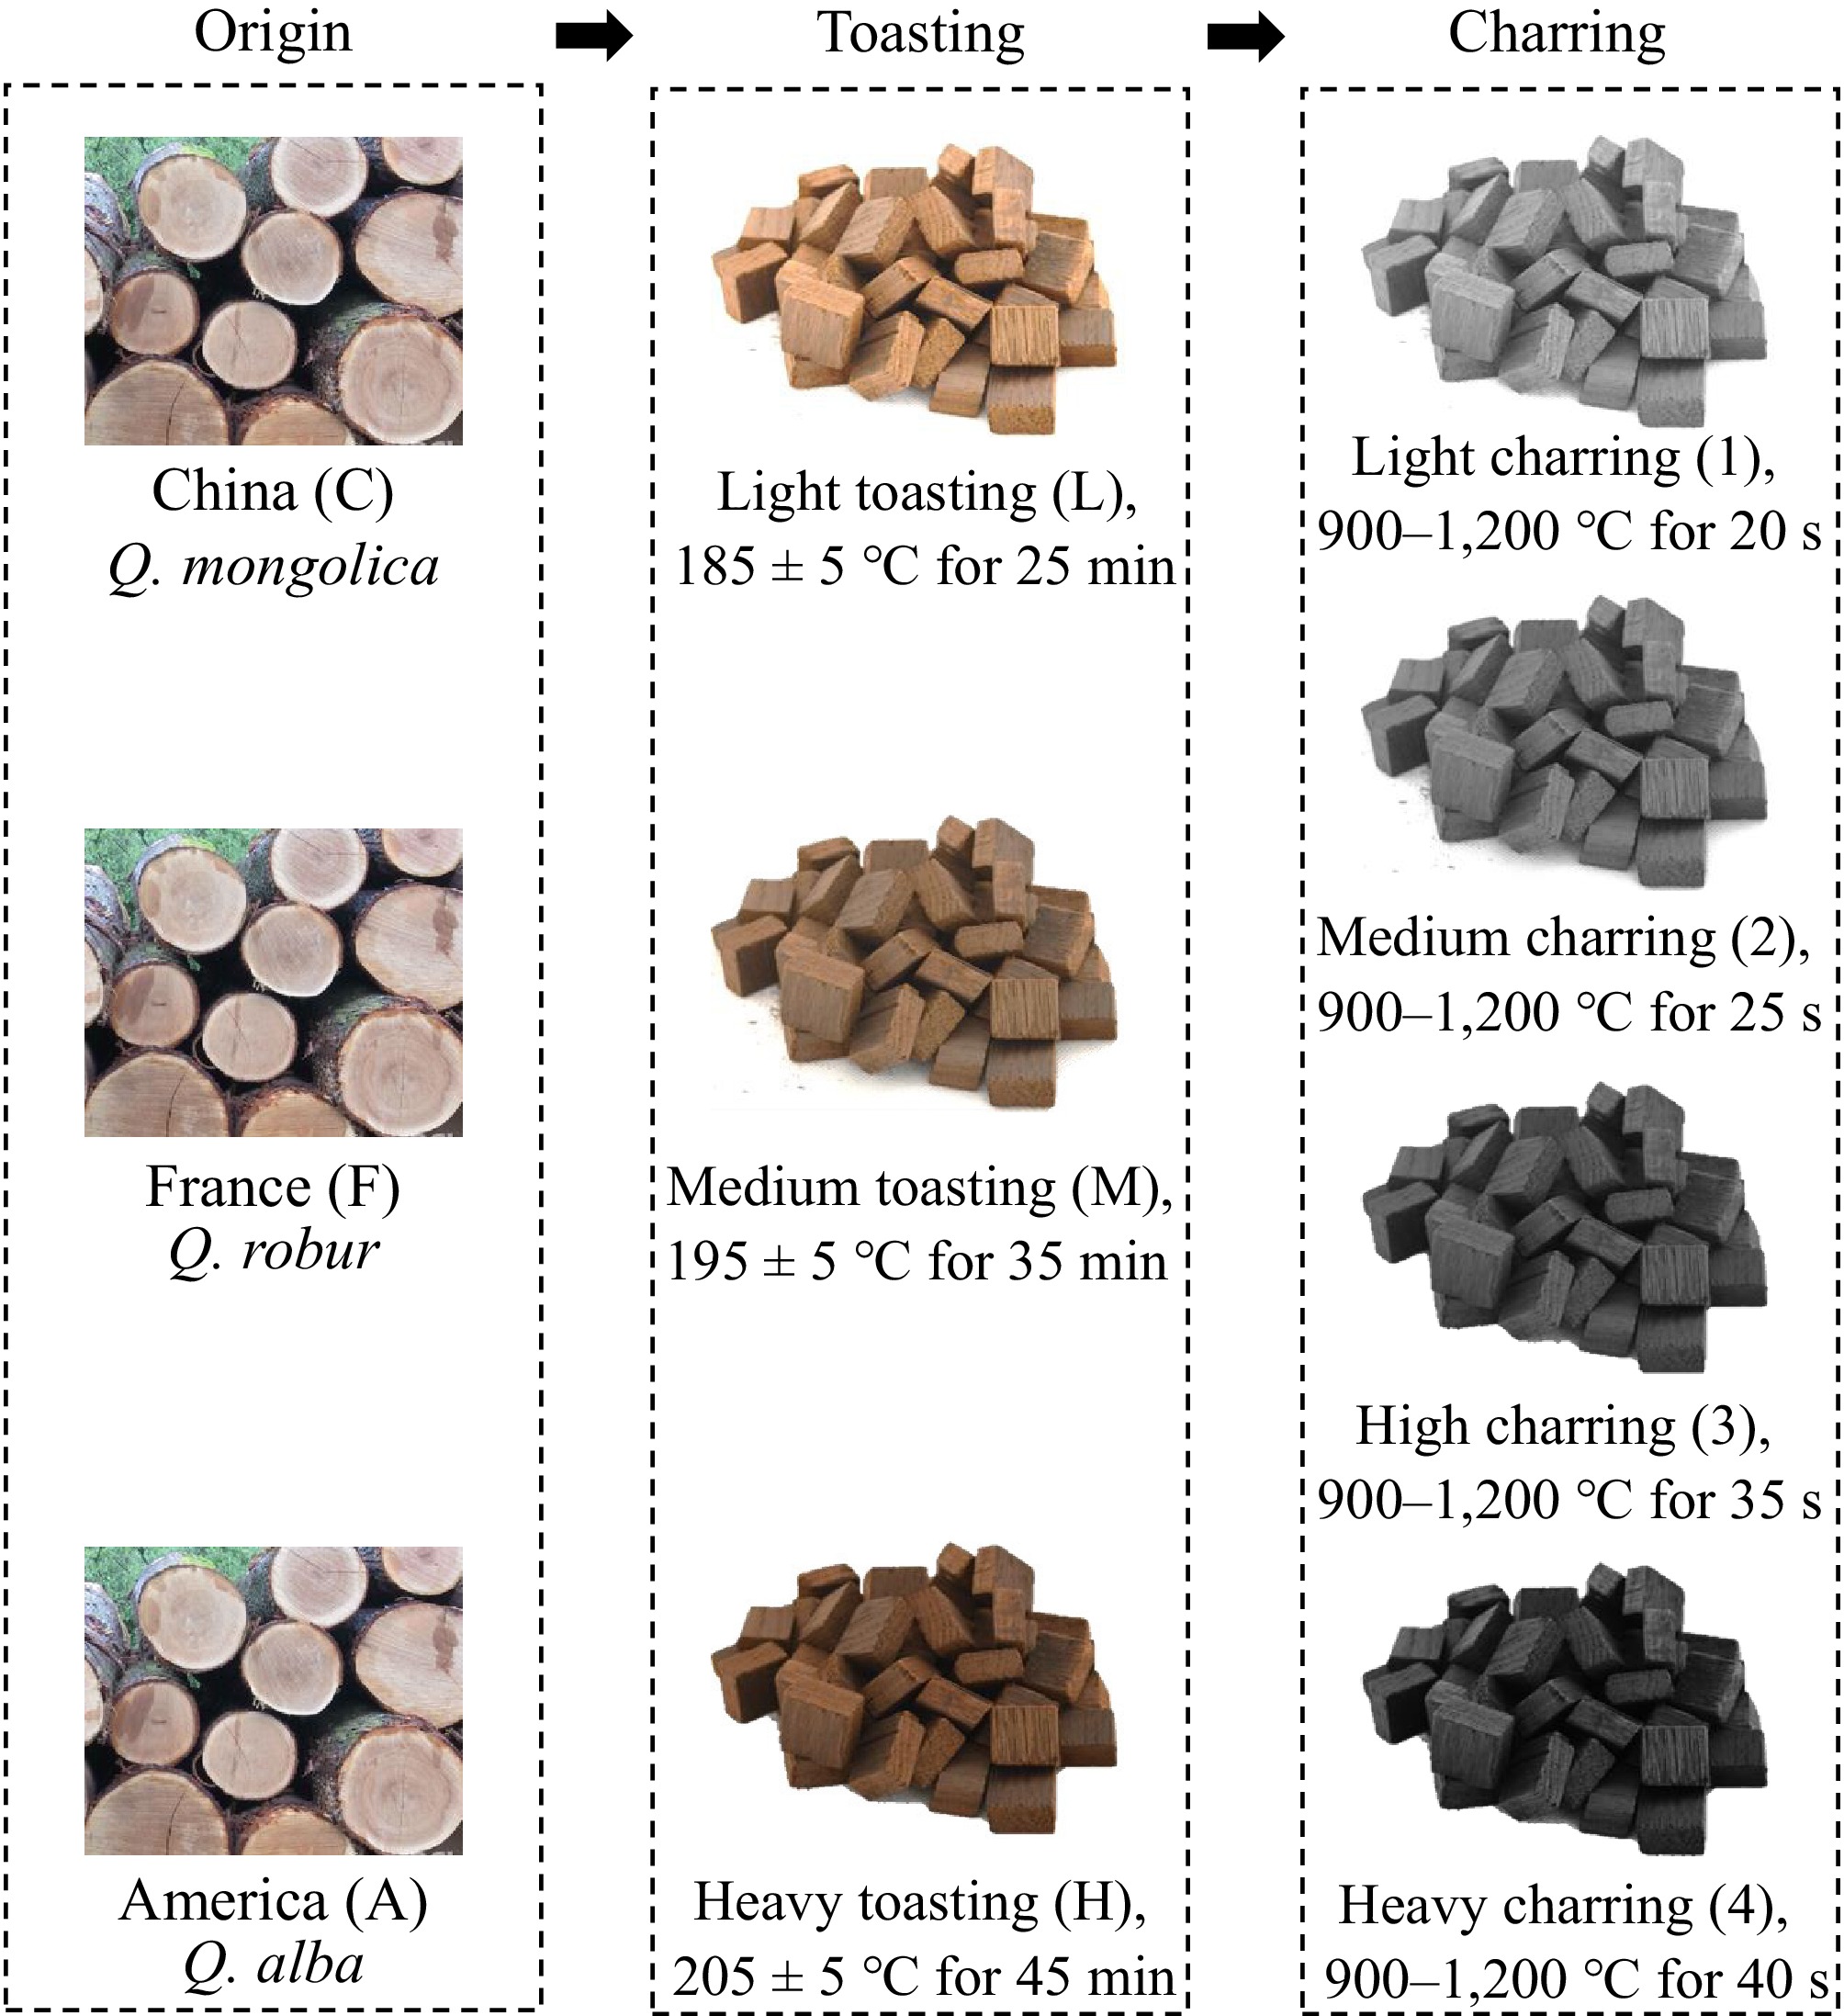
Figure 1.
Schematic diagram of the oak samples used in the experiment.
-
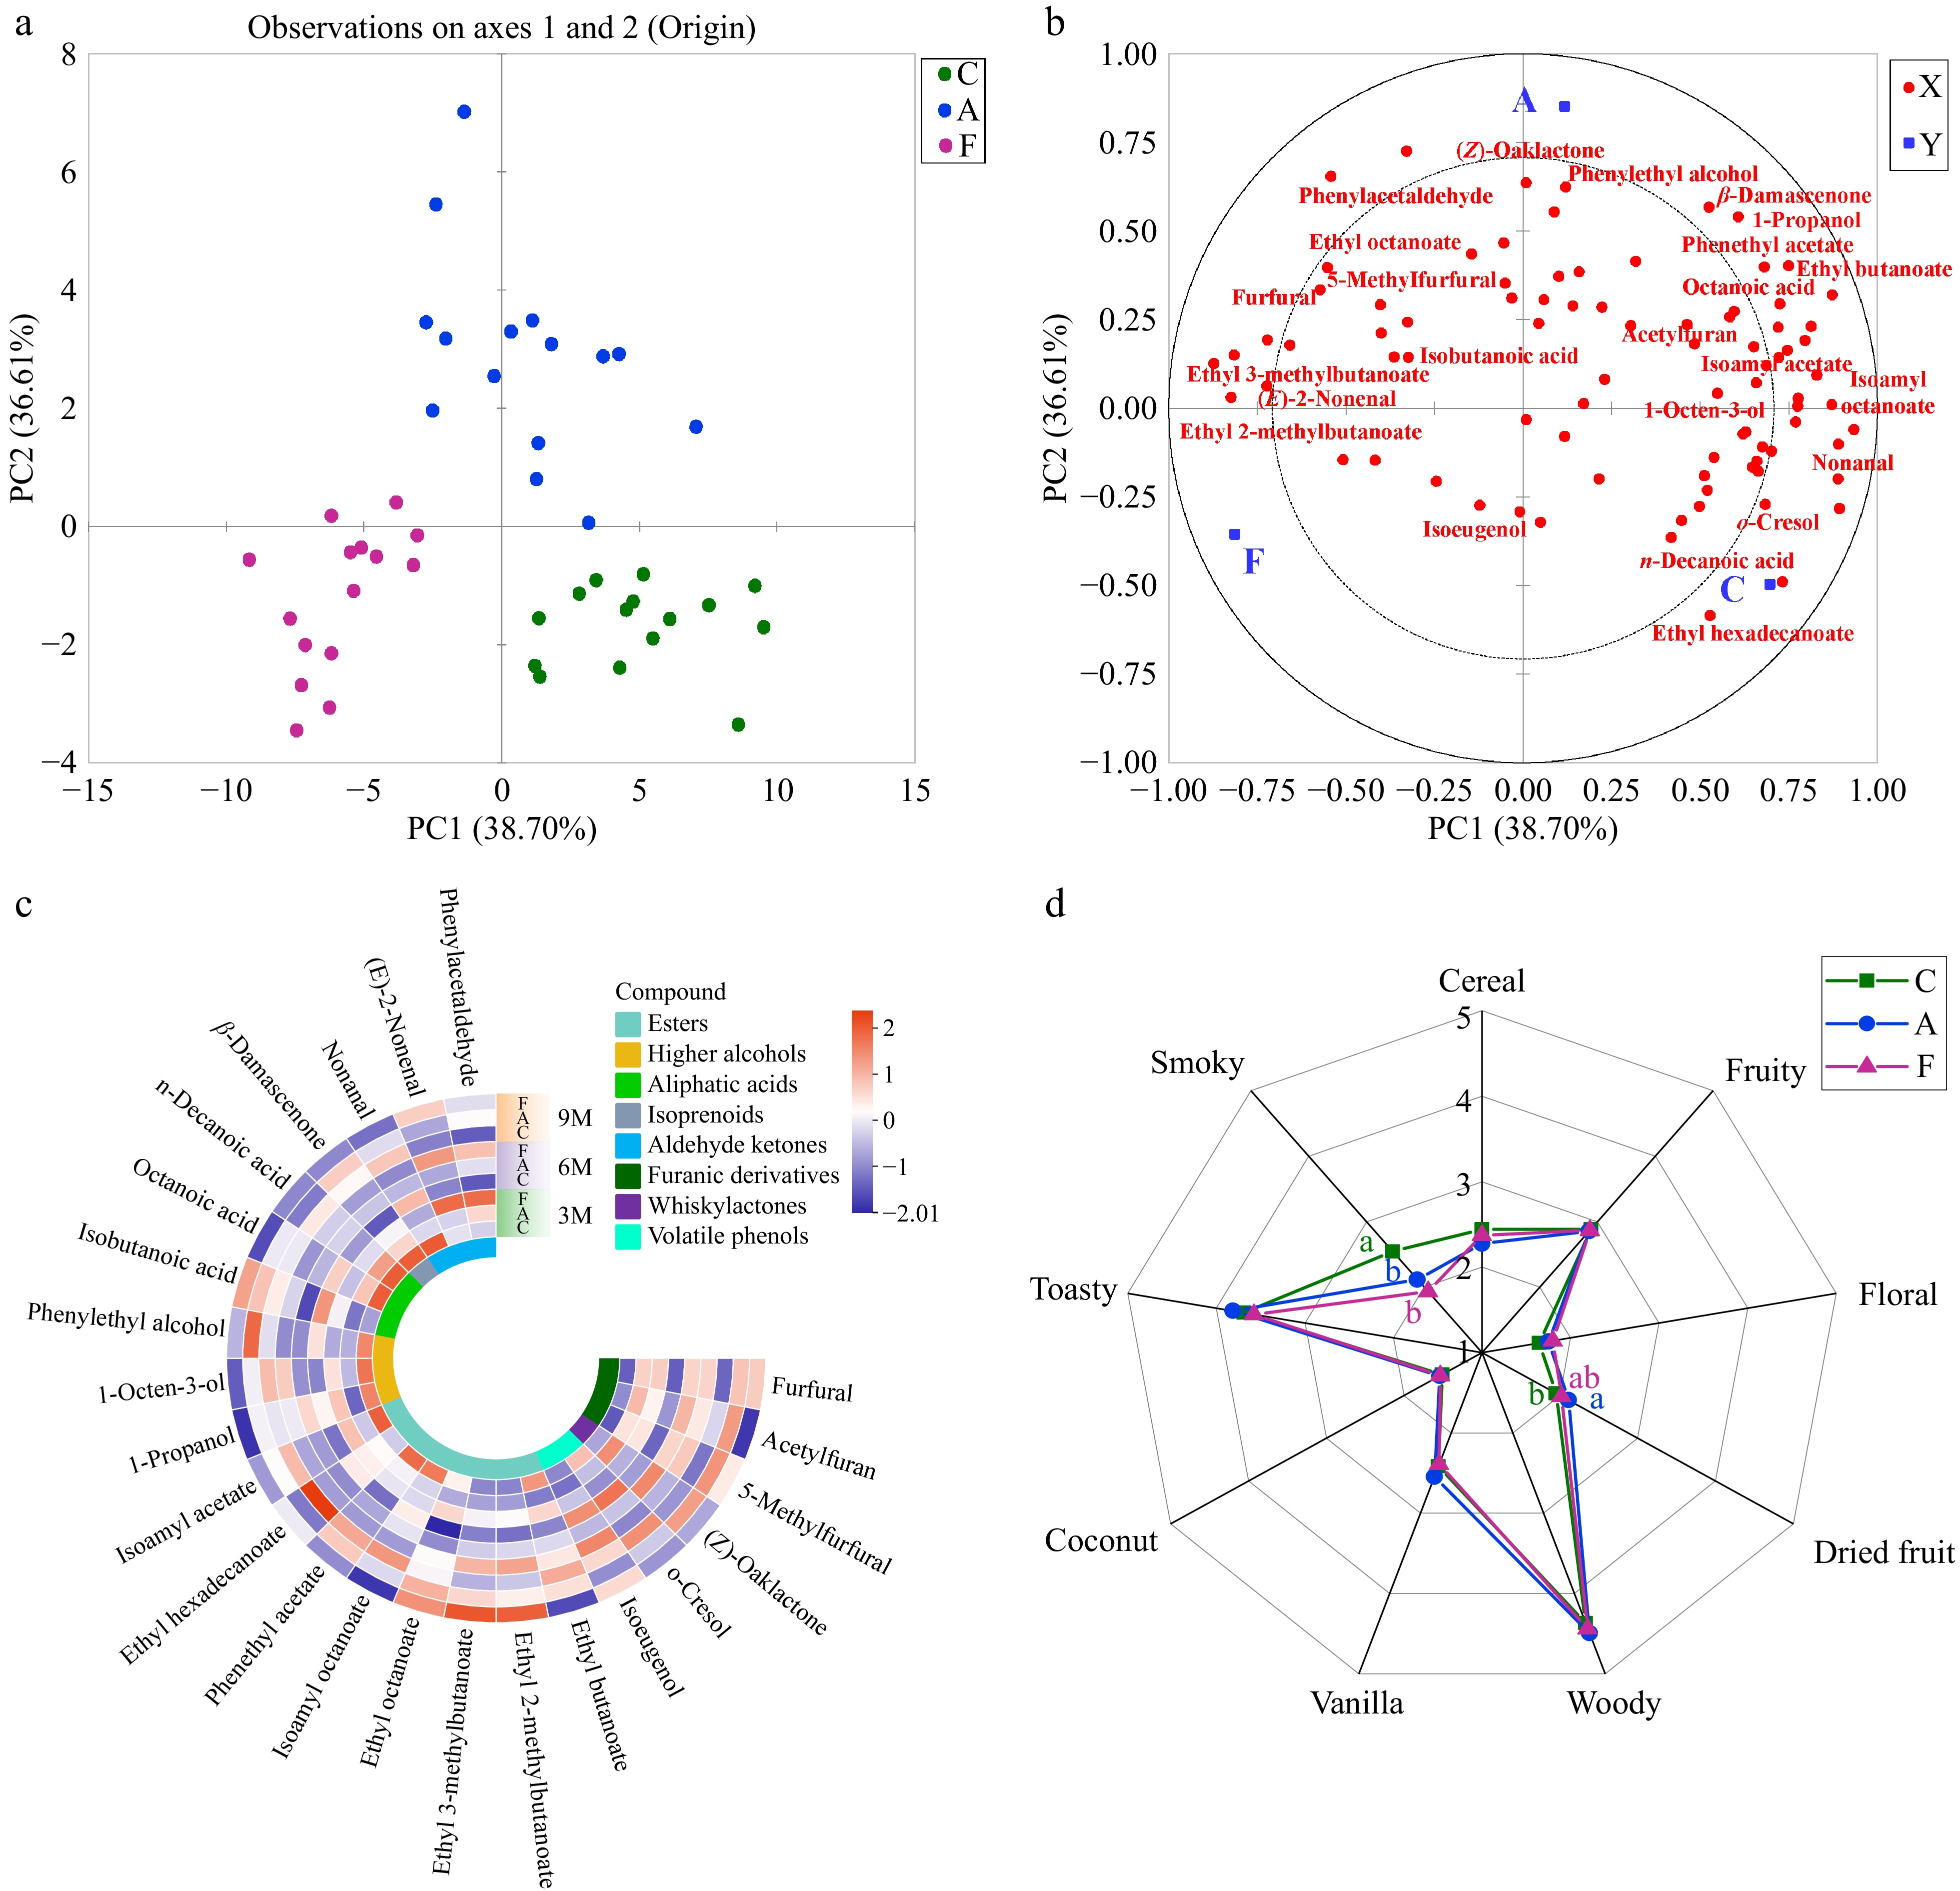
Figure 2.
Impact of oak origin on volatile concentration and aroma characteristics of aged whisky. (a) Score plot of oak-aged whisky samples (9 months) from different origins; C = Chinese oak, A = American oak, and F = French oak (Q2 = 0.79; R2 = 0.89). (b) Loading plot of oak aged whisky samples (9 months) from different origins; labeled compounds are those with VIP > 1, OAV > 1, and significant variation across origins. (c) Composition of volatile compounds in whisky aged in oak from different origins. (d) Sensory analysis of whisky aged in oak from different origins; different letters on the radar chart indicate significant differences among samples based on Duncan's multiple range test (p < 0.05).
-
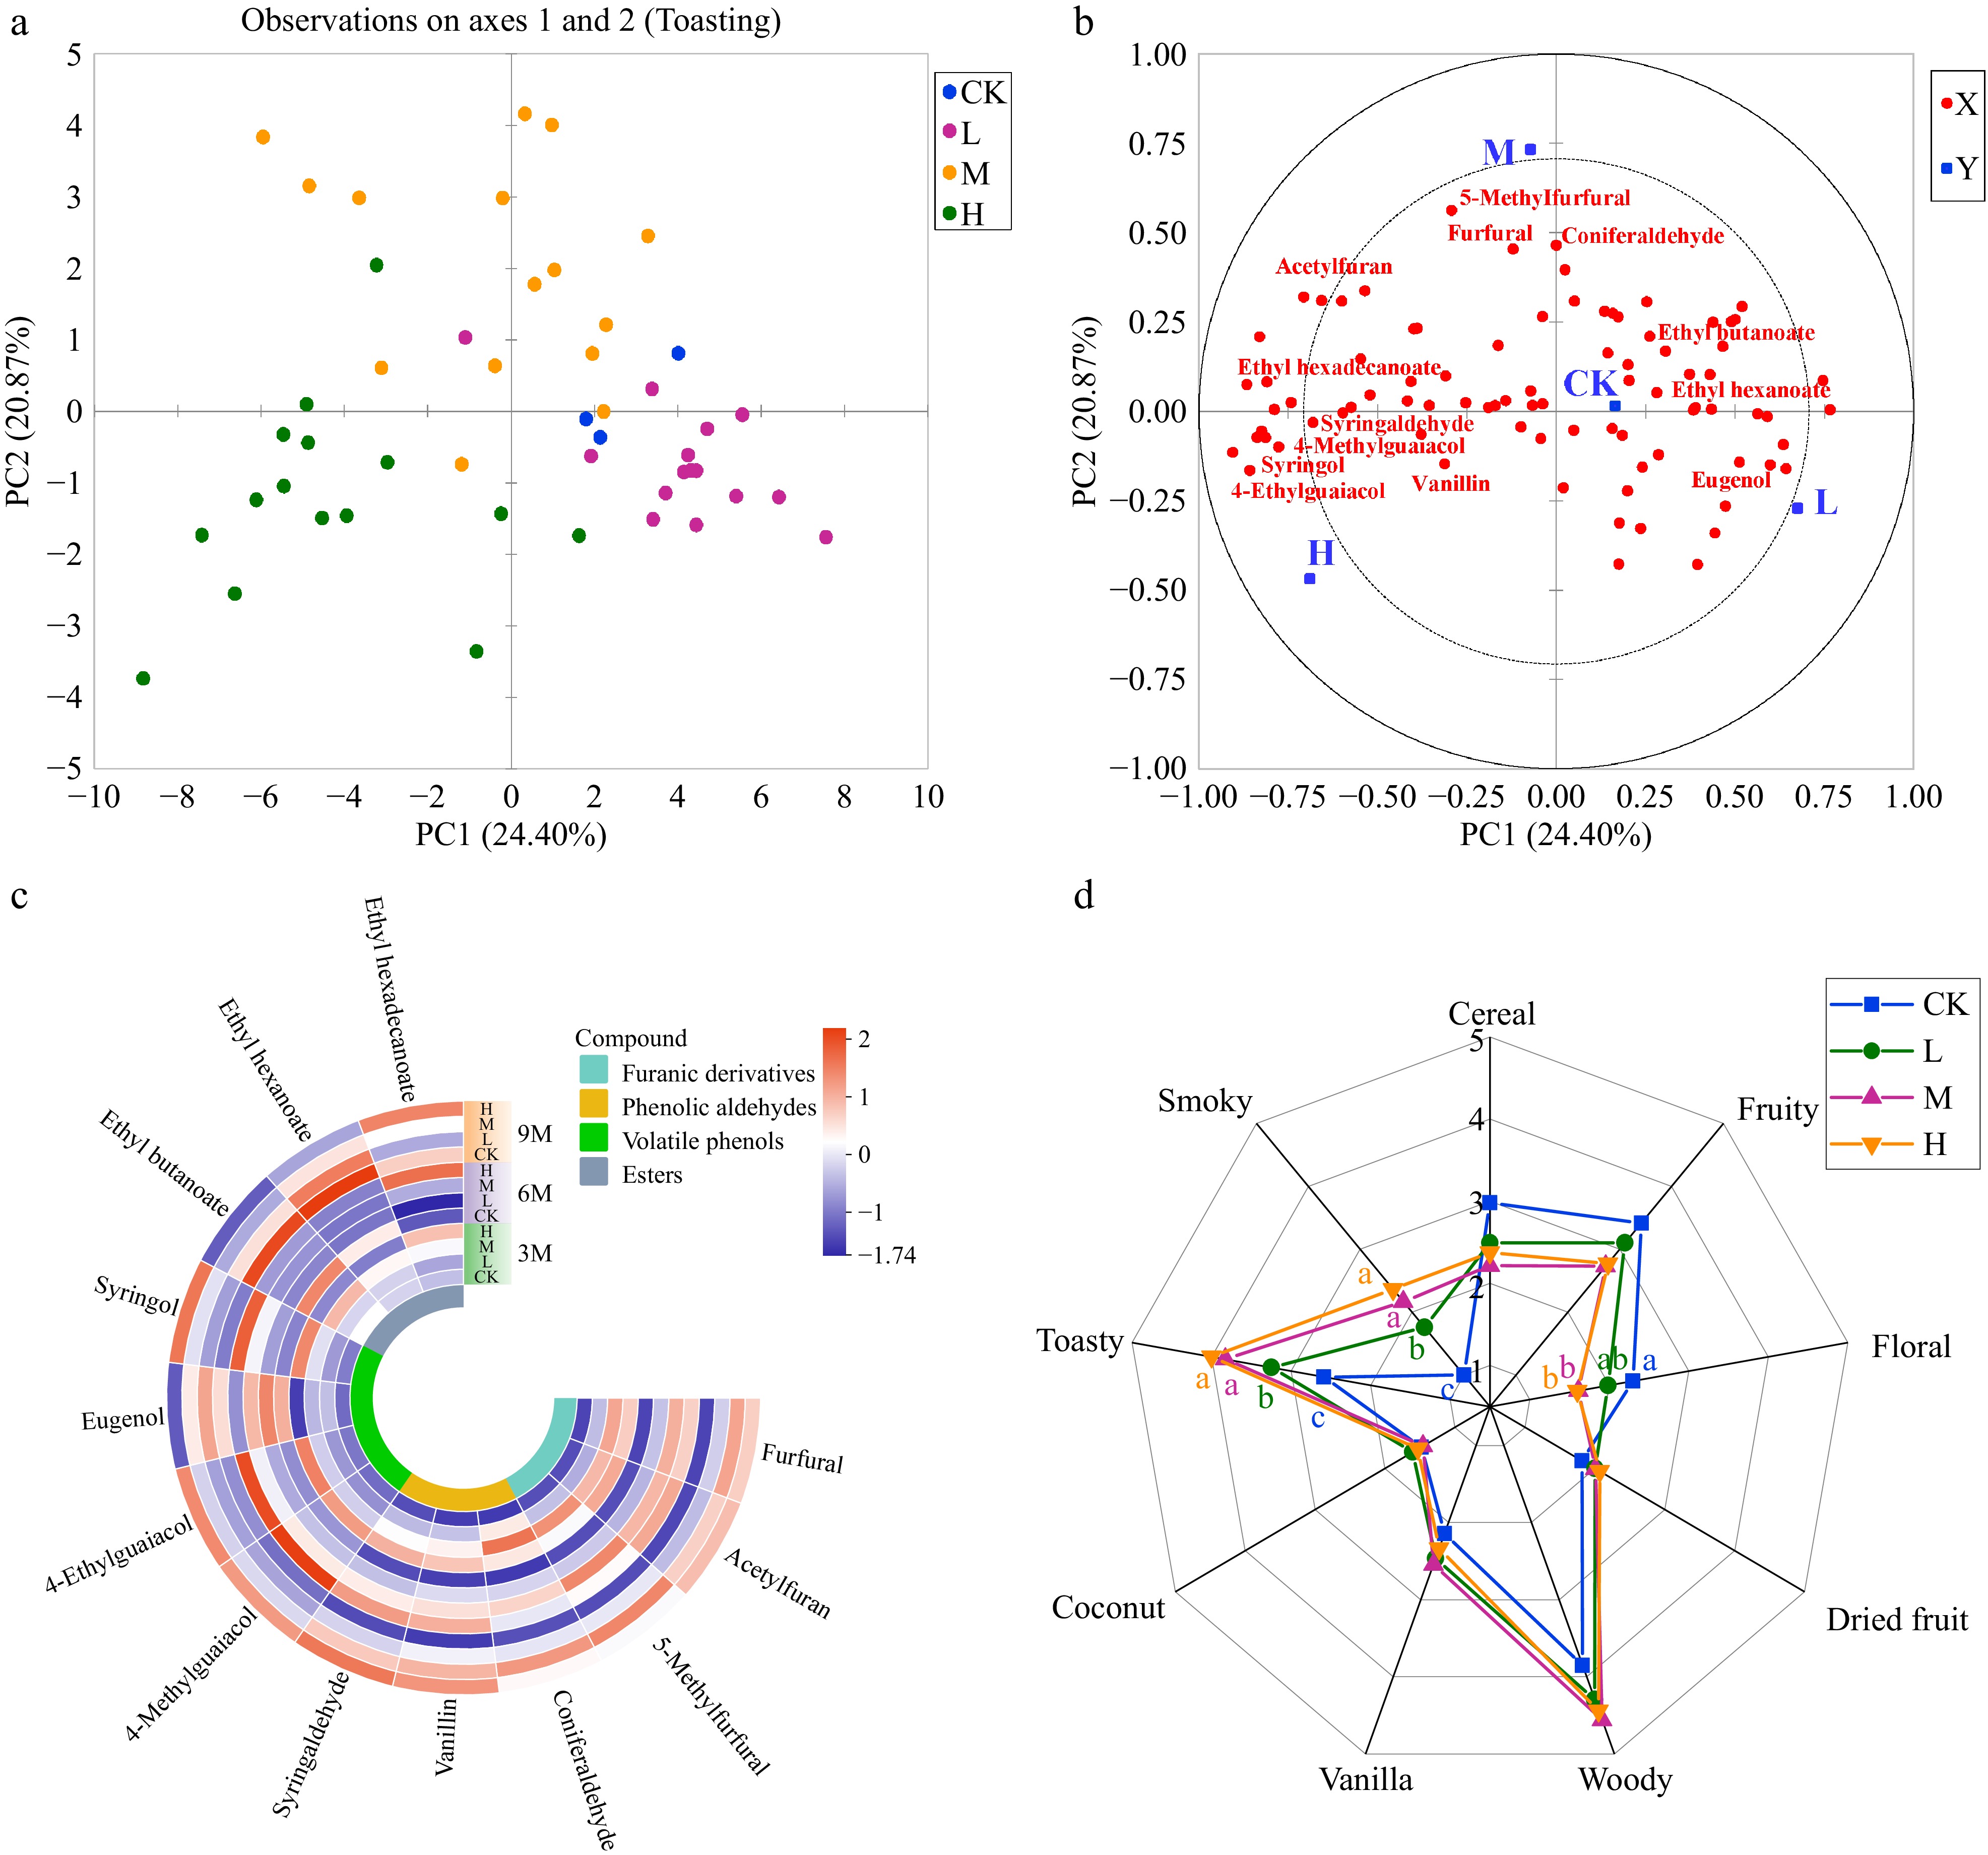
Figure 3.
Impact of oak toasting levels on volatile concentration and aroma characteristics of aged whisky. (a) Score plot of oak aged whisky samples (9 months) from different toasting levels; CK = untoasted, L = lightly toasted, M = medium toasted, and H = heavily toasted (Q2 = 0.60; R2 = 0.72). (b) Loading plot of oak aged whisky samples (9 months) from different toasting levels; labeled compounds are those with VIP > 1, OAV > 1, and significant variation across different toasting levels. (c) Composition of volatile compounds in whisky aged in oak from different toasting levels. (d) Sensory analysis of whisky aged in oak from different toasting levels; different letters on the radar chart indicate significant differences among samples based on Duncan's multiple range test (p < 0.05).
-
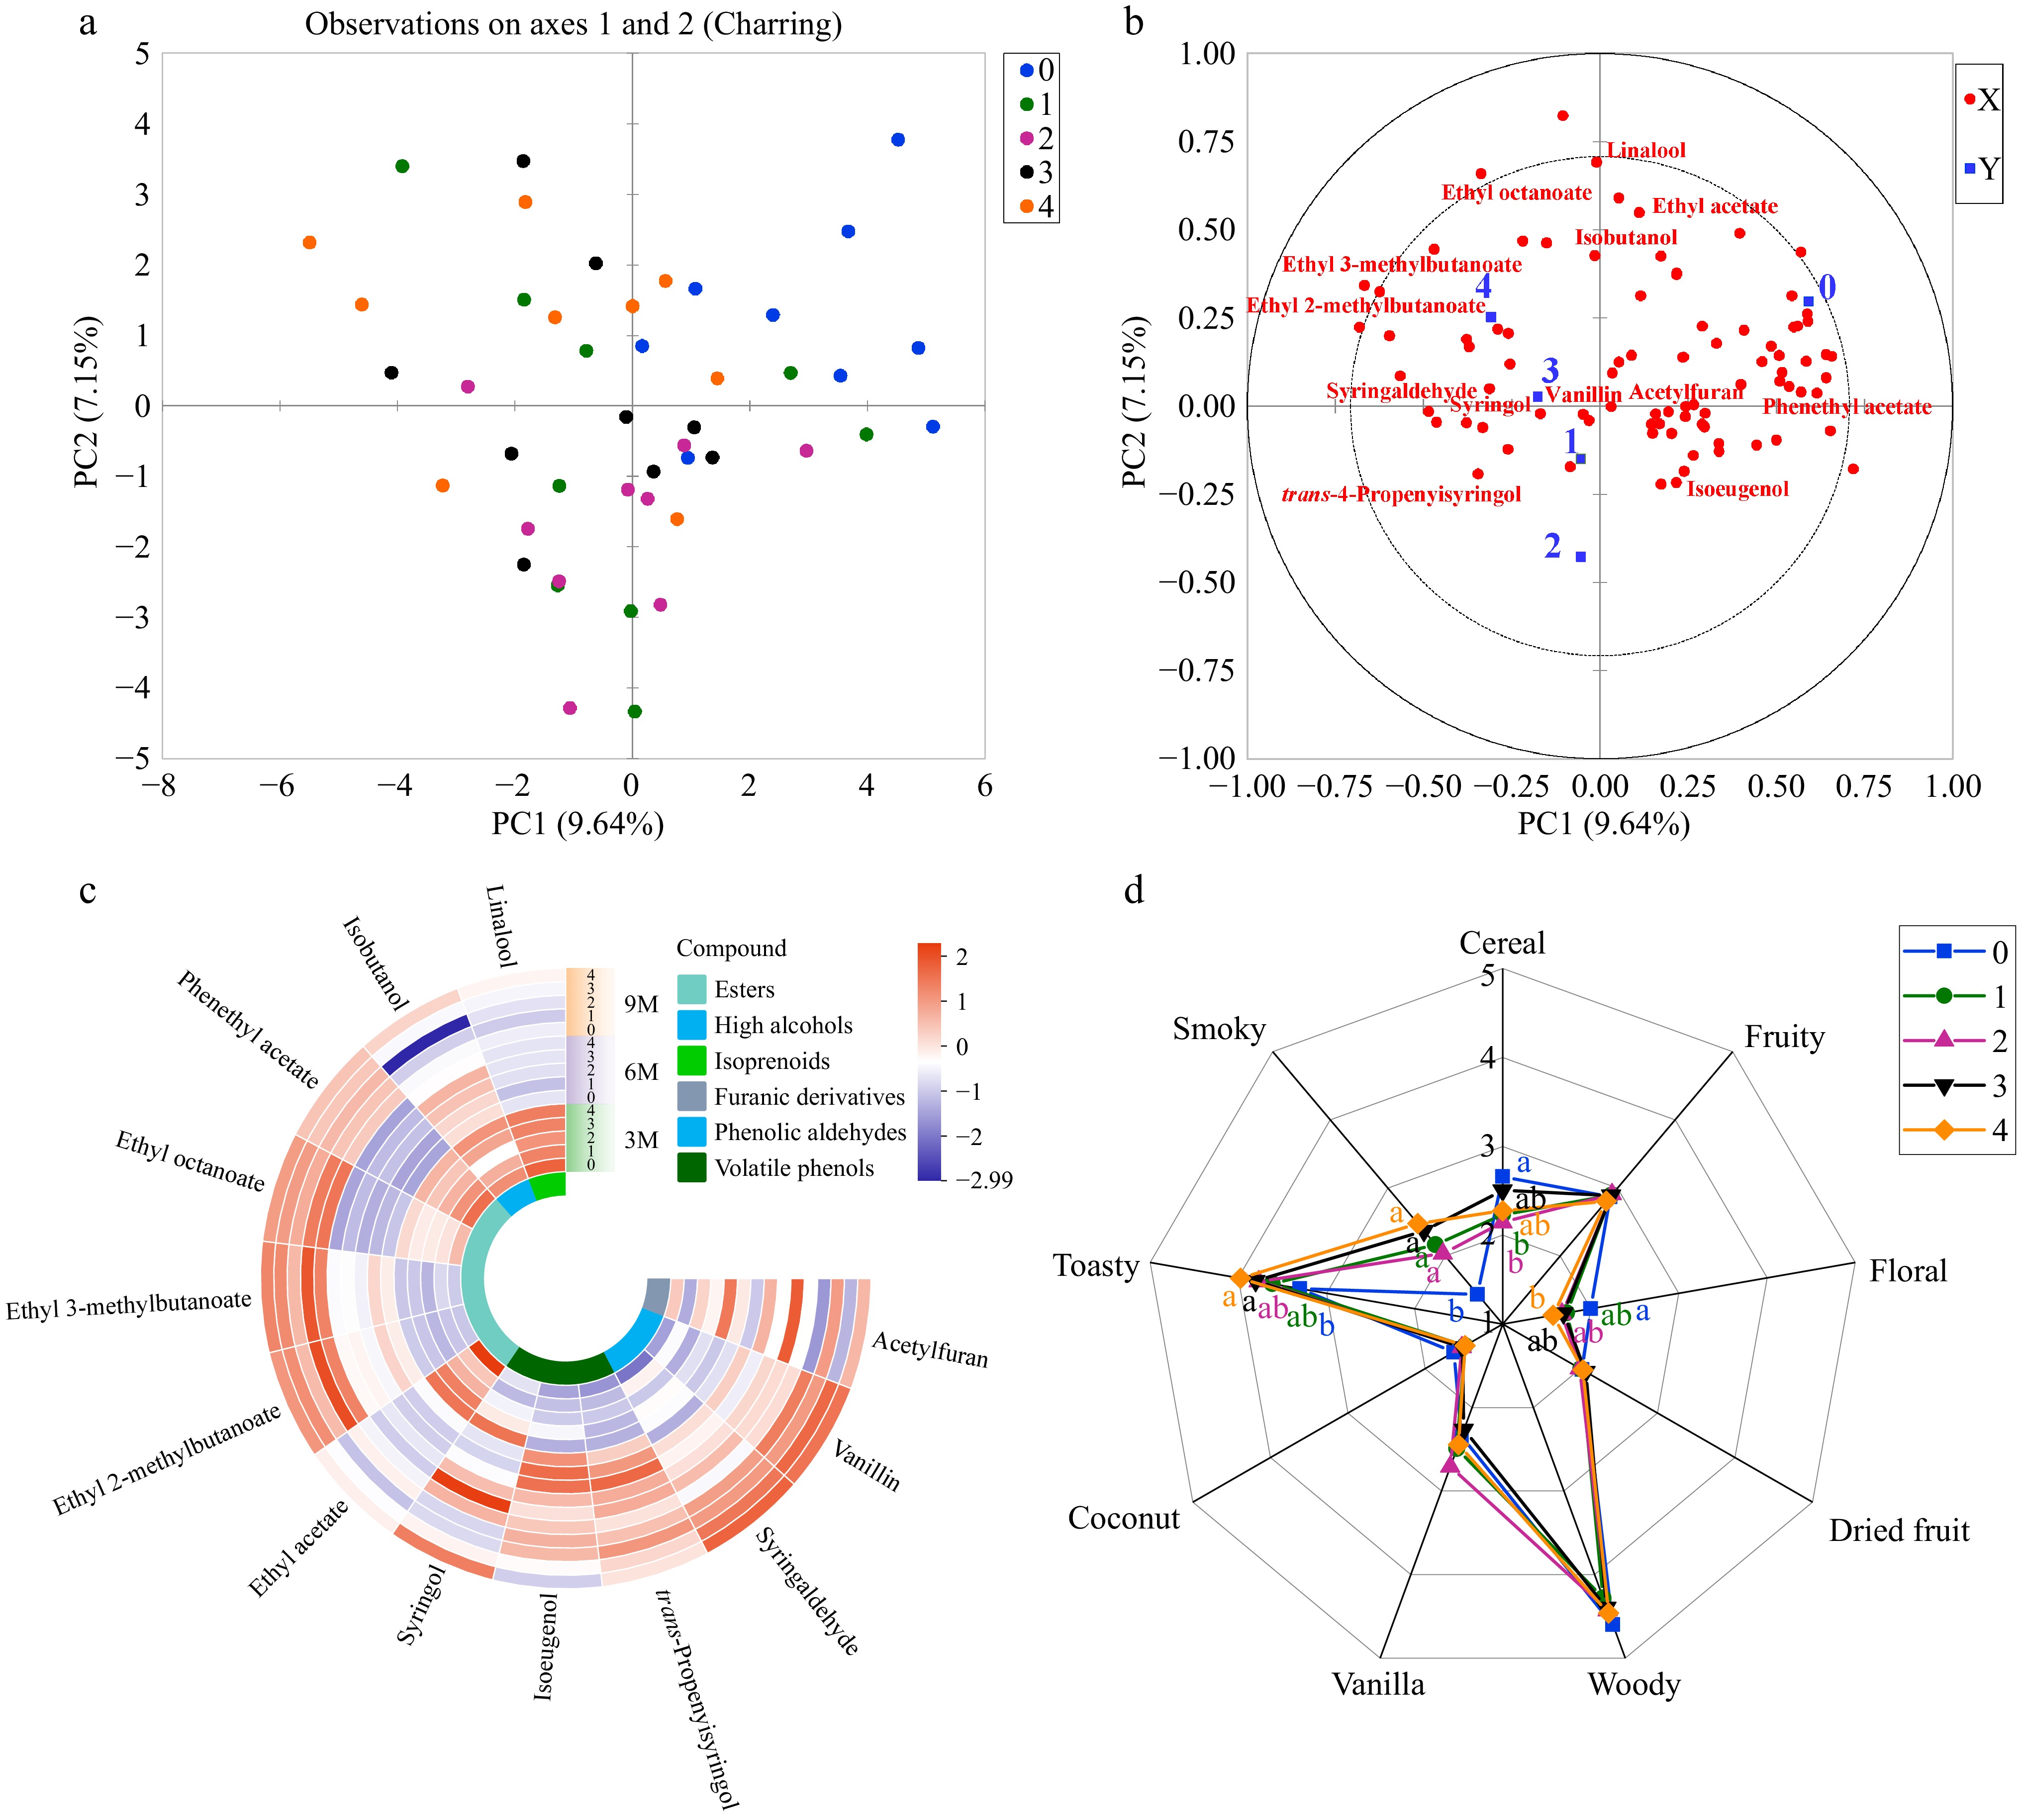
Figure 4.
Impact of oak charring intensity on volatile concentration and aroma characteristics of aged whisky. (a) Score plot of oak aged whisky samples (9 months) from different charring intensity; 0–4 indicates different levels of charring, where 0 = uncharred, 1 = light, 2 = medium, 3 = high, and 4 = heavy (Q2 = 0.23; R2 = 0.63). (b) Loading plot of oak aged whisky samples (9 months) from different charring intensities; labeled compounds are those with VIP > 1, OAV > 1, and significant variation across different charring intensity. (c) Composition of volatile compounds in whisky aged in oak from different charring intensity. (d) Sensory analysis of whisky aged in oak from different charring intensity; different letters on the radar chart indicate significant differences among samples based on Duncan's multiple range test (p < 0.05).
-
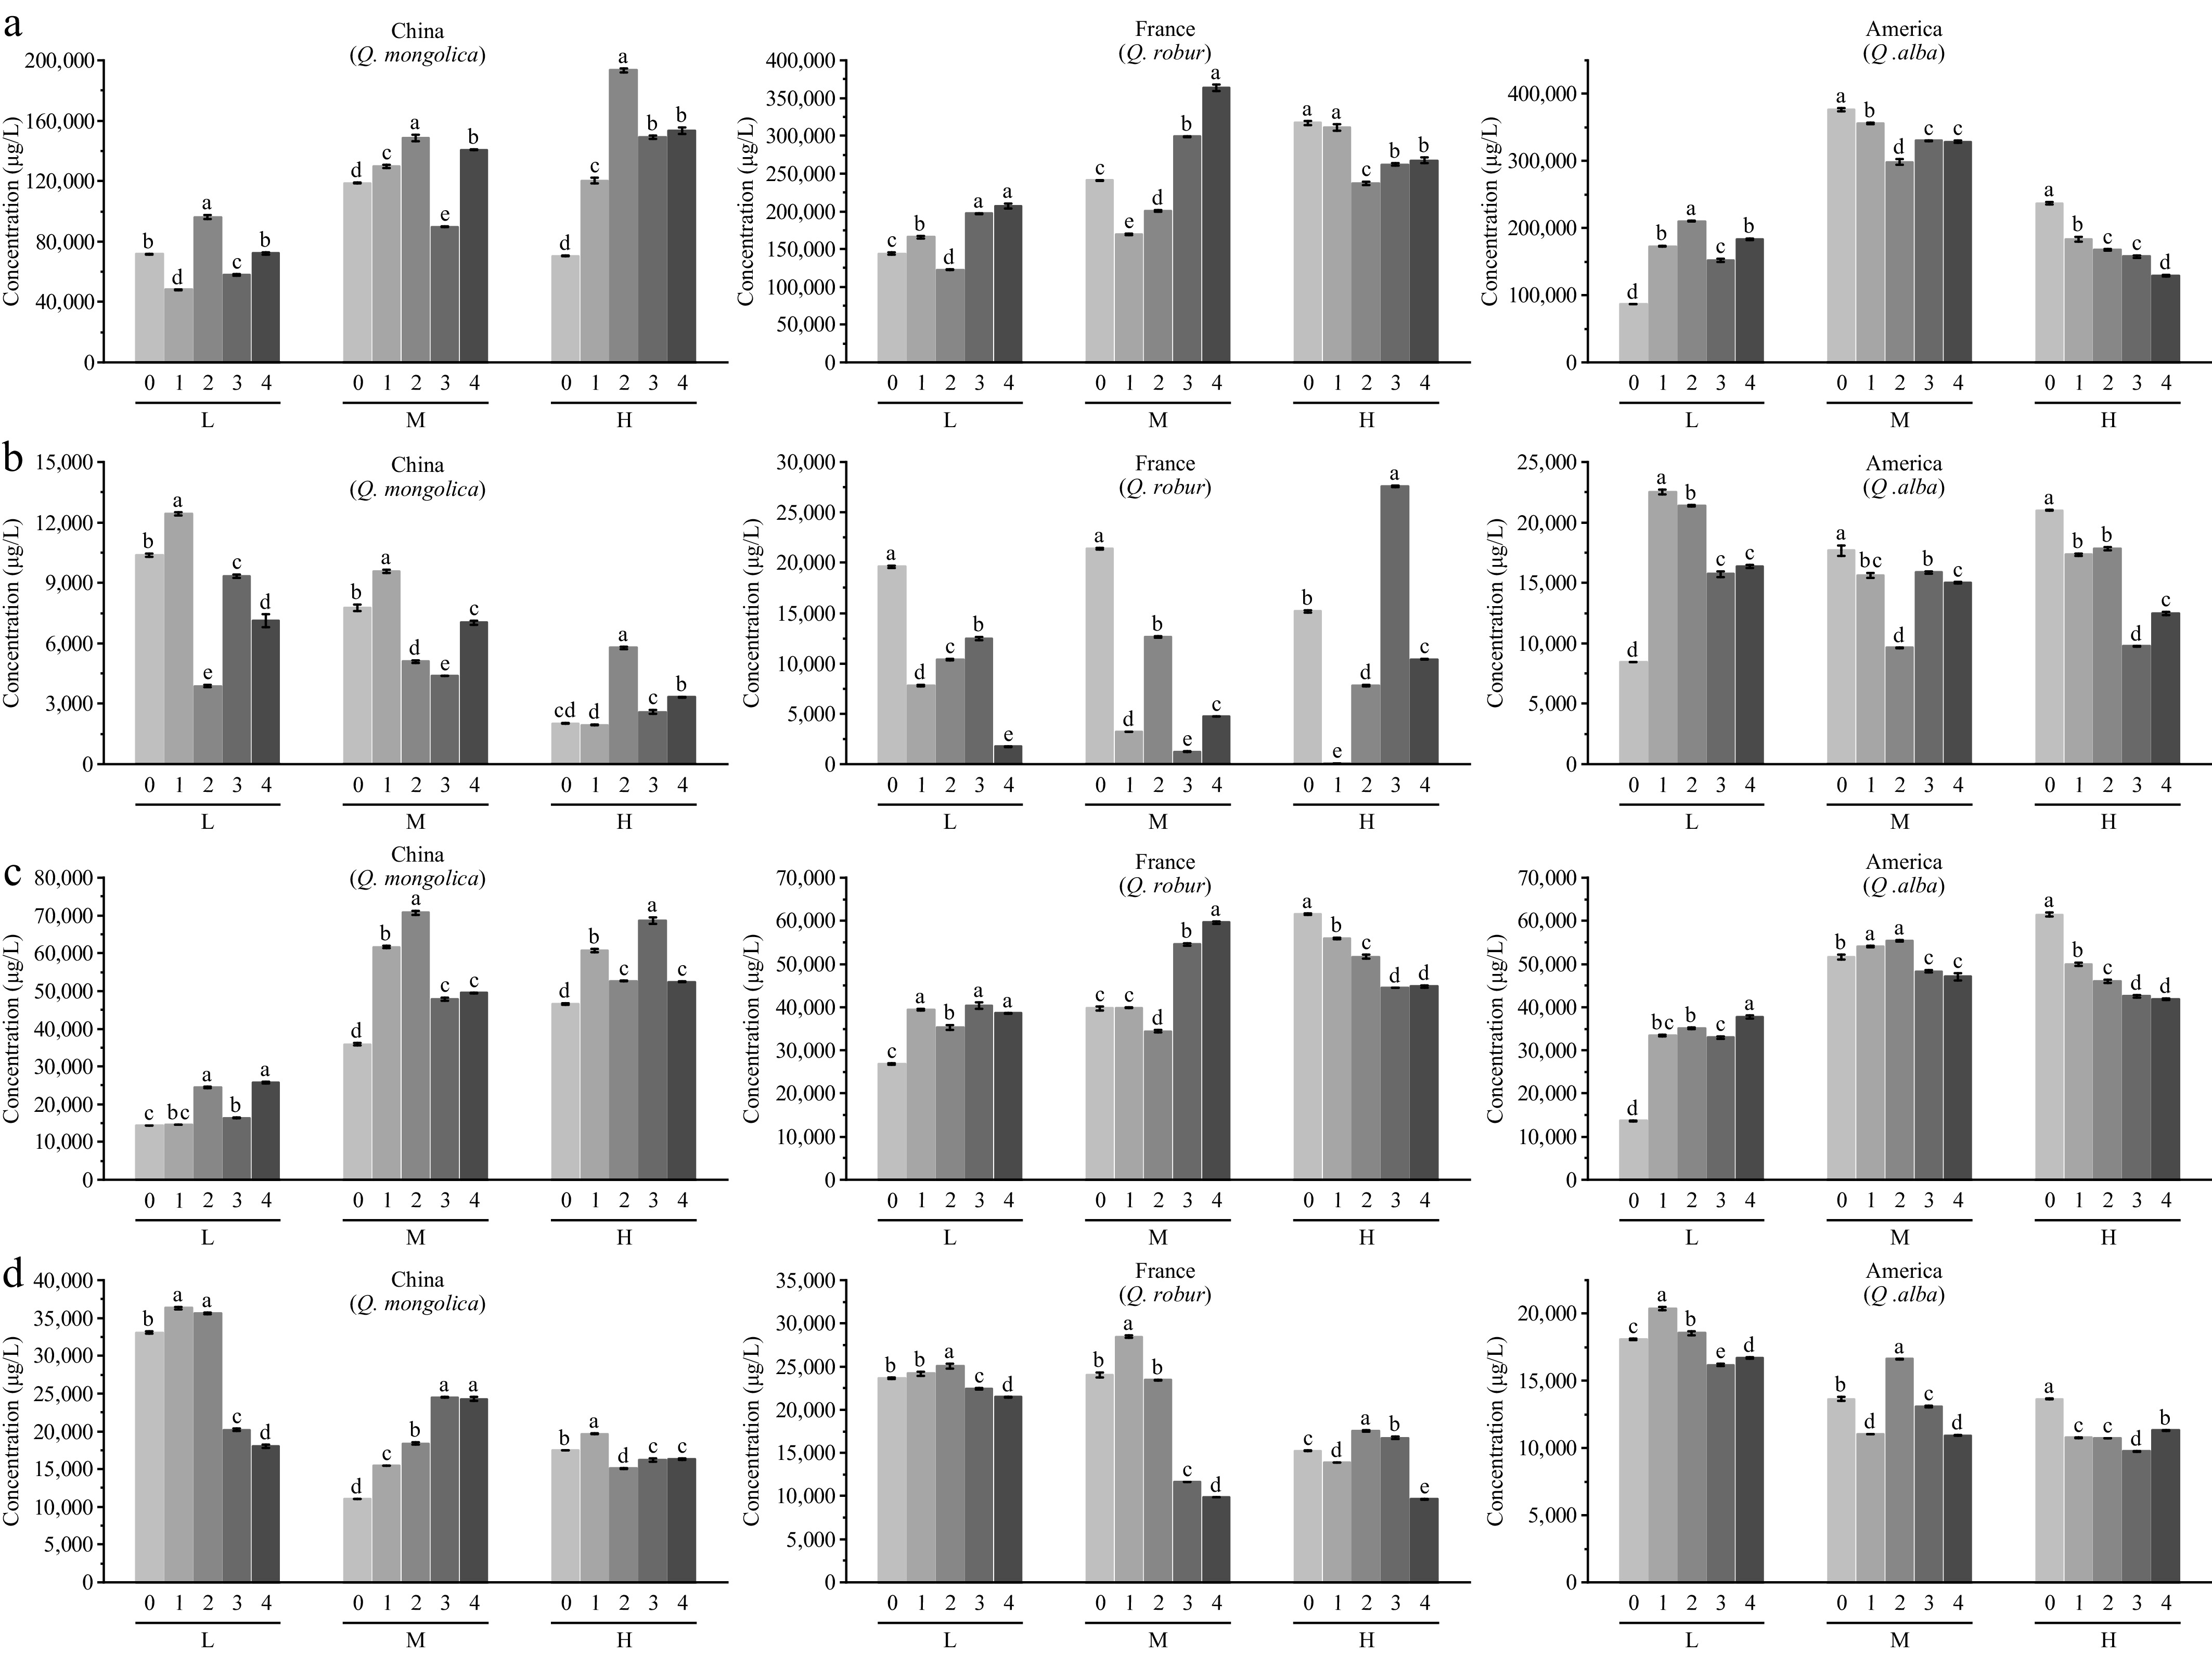
Figure 5.
Concentration of (a) furanic derivatives, (b) oaklactones, (c) phenolic aldehydes, and (d) volatile phenols in whisky aged with Chinese oak, French oak and American oak after 9 months. L = light toasted, M = medium toasted, and H = heavily toasted; 1–4 indicates different levels of charring, where 1 = light, 2 = medium, 3 = high, and 4 = heavy. Different lowercase letters on the bar chart denote significant differences according to Duncan's multiple range test (p < 0.05), with significance assessed across five charring levels within each toasting intensity.
Figures
(5)
Tables
(0)