-
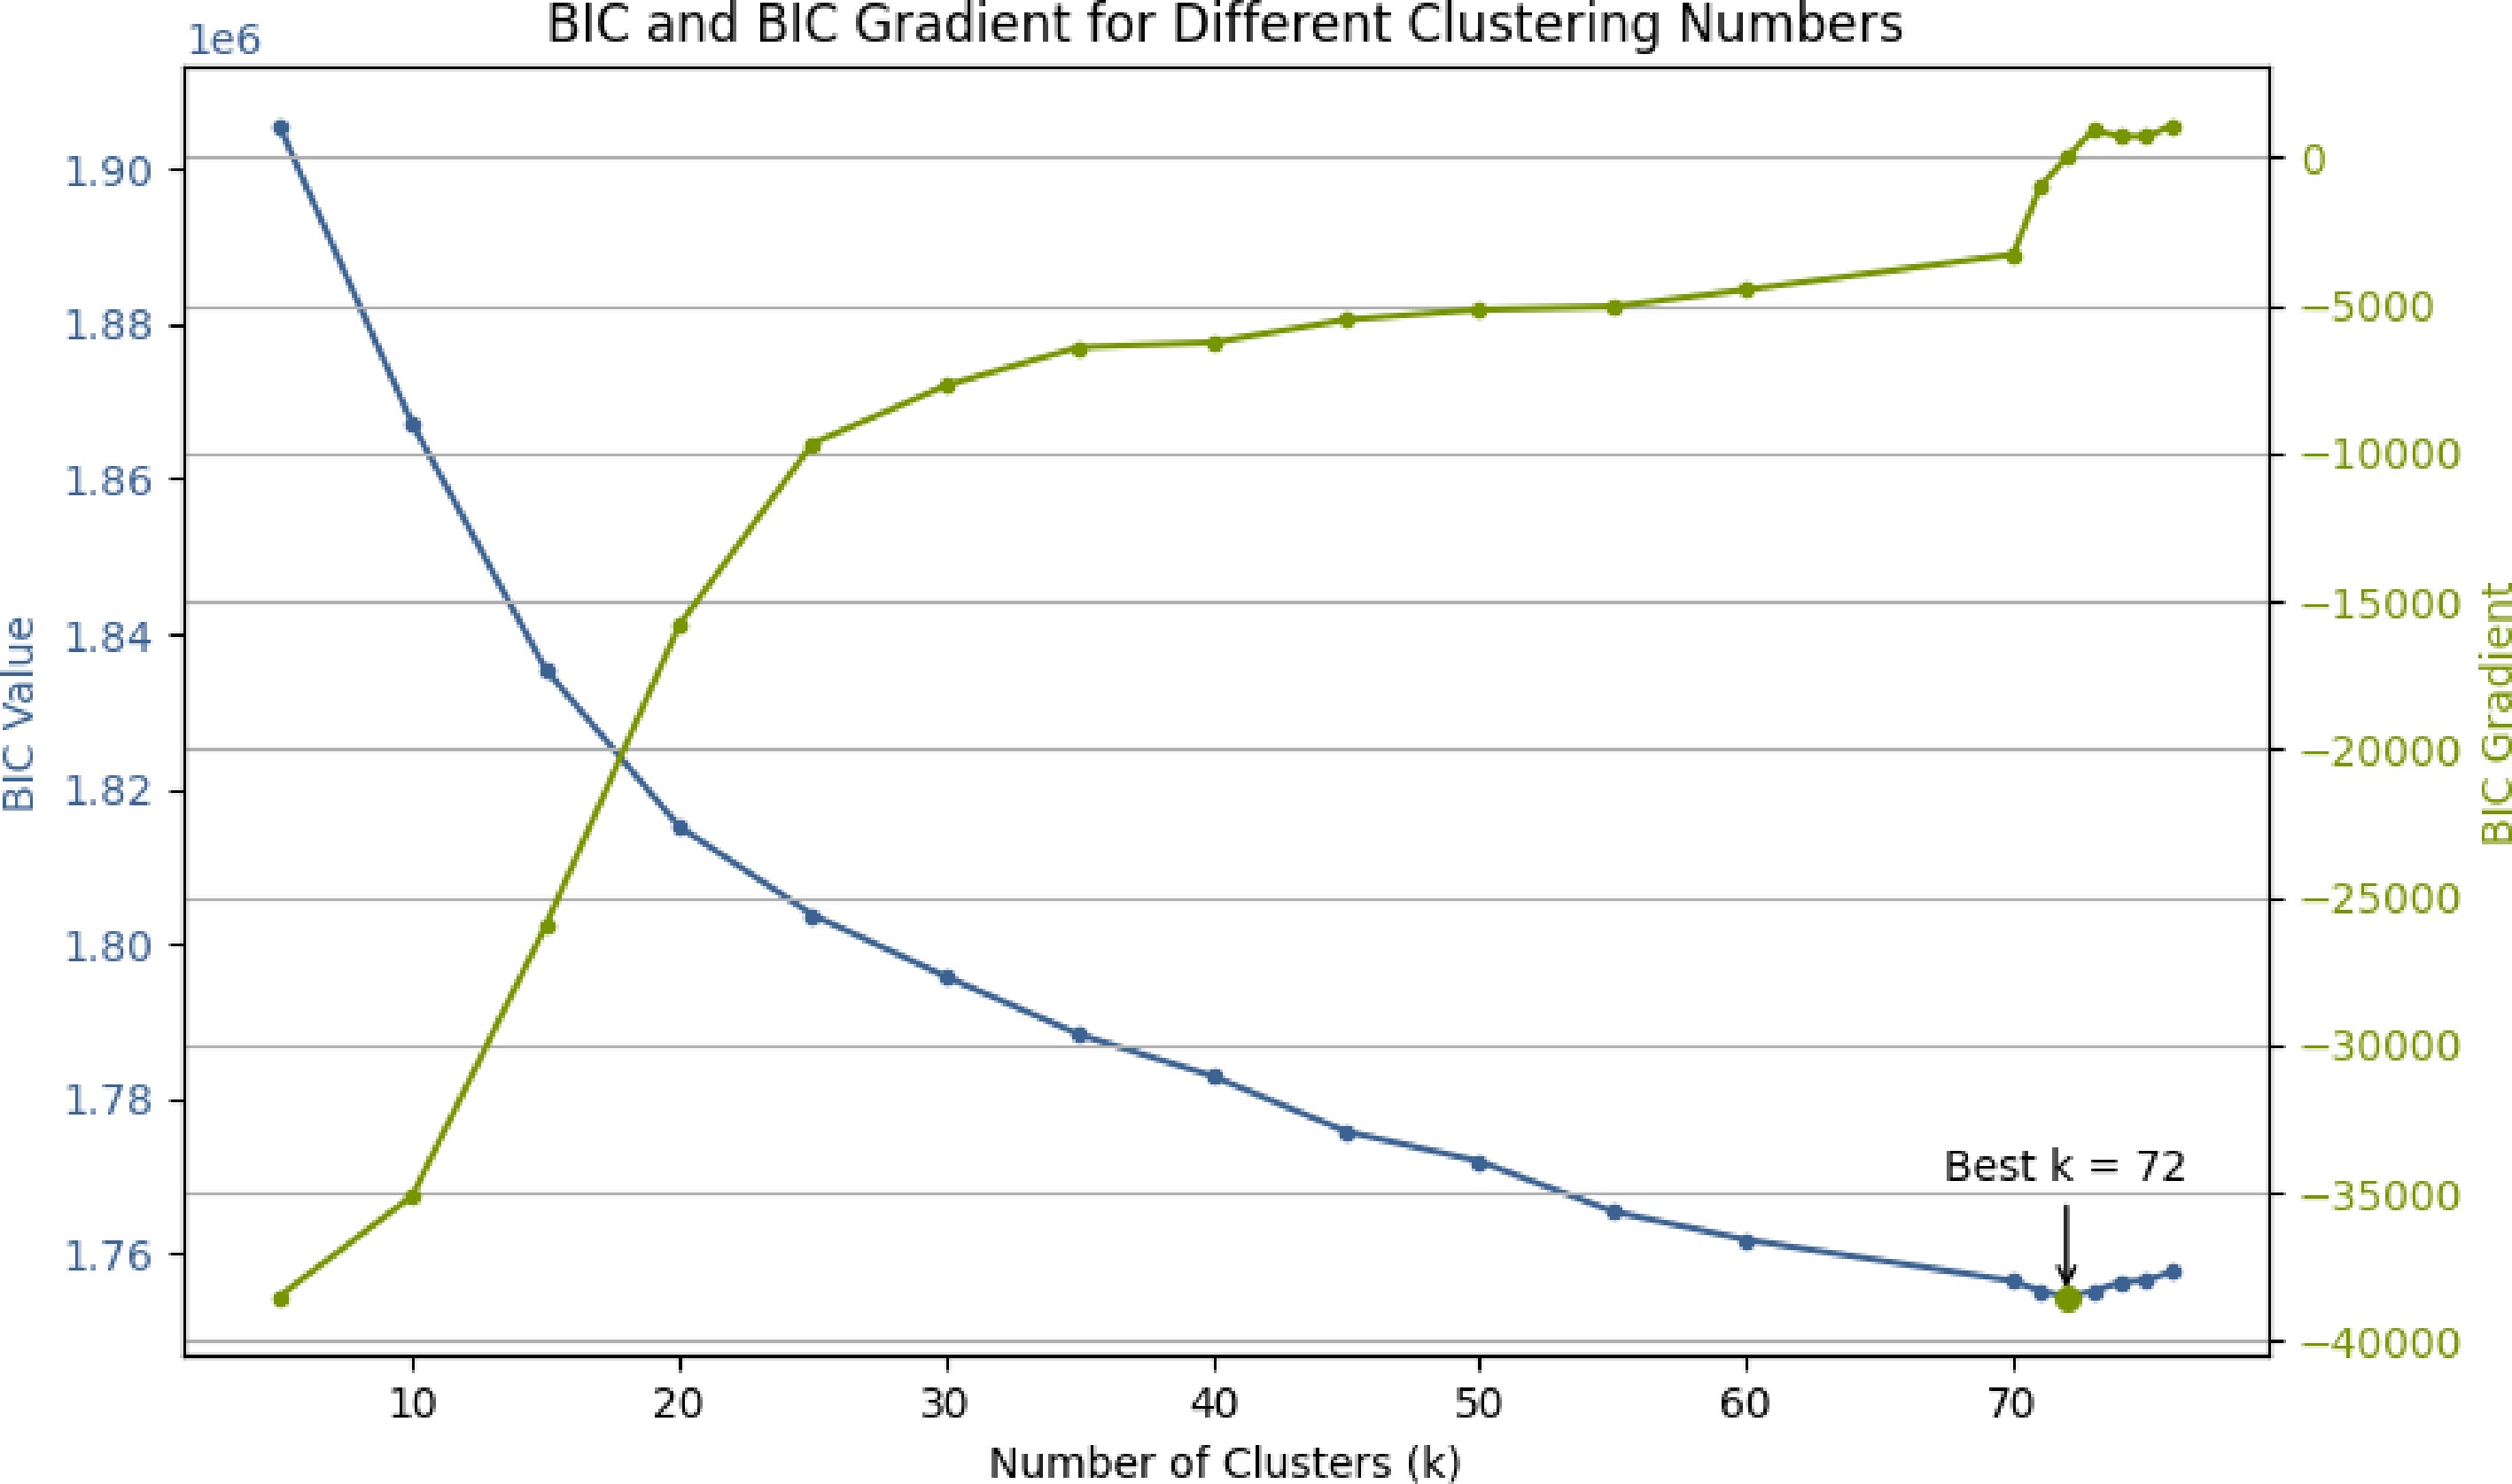
Figure 1.
BIC values under different cluster numbers, with the optimal value at K = 72.
-
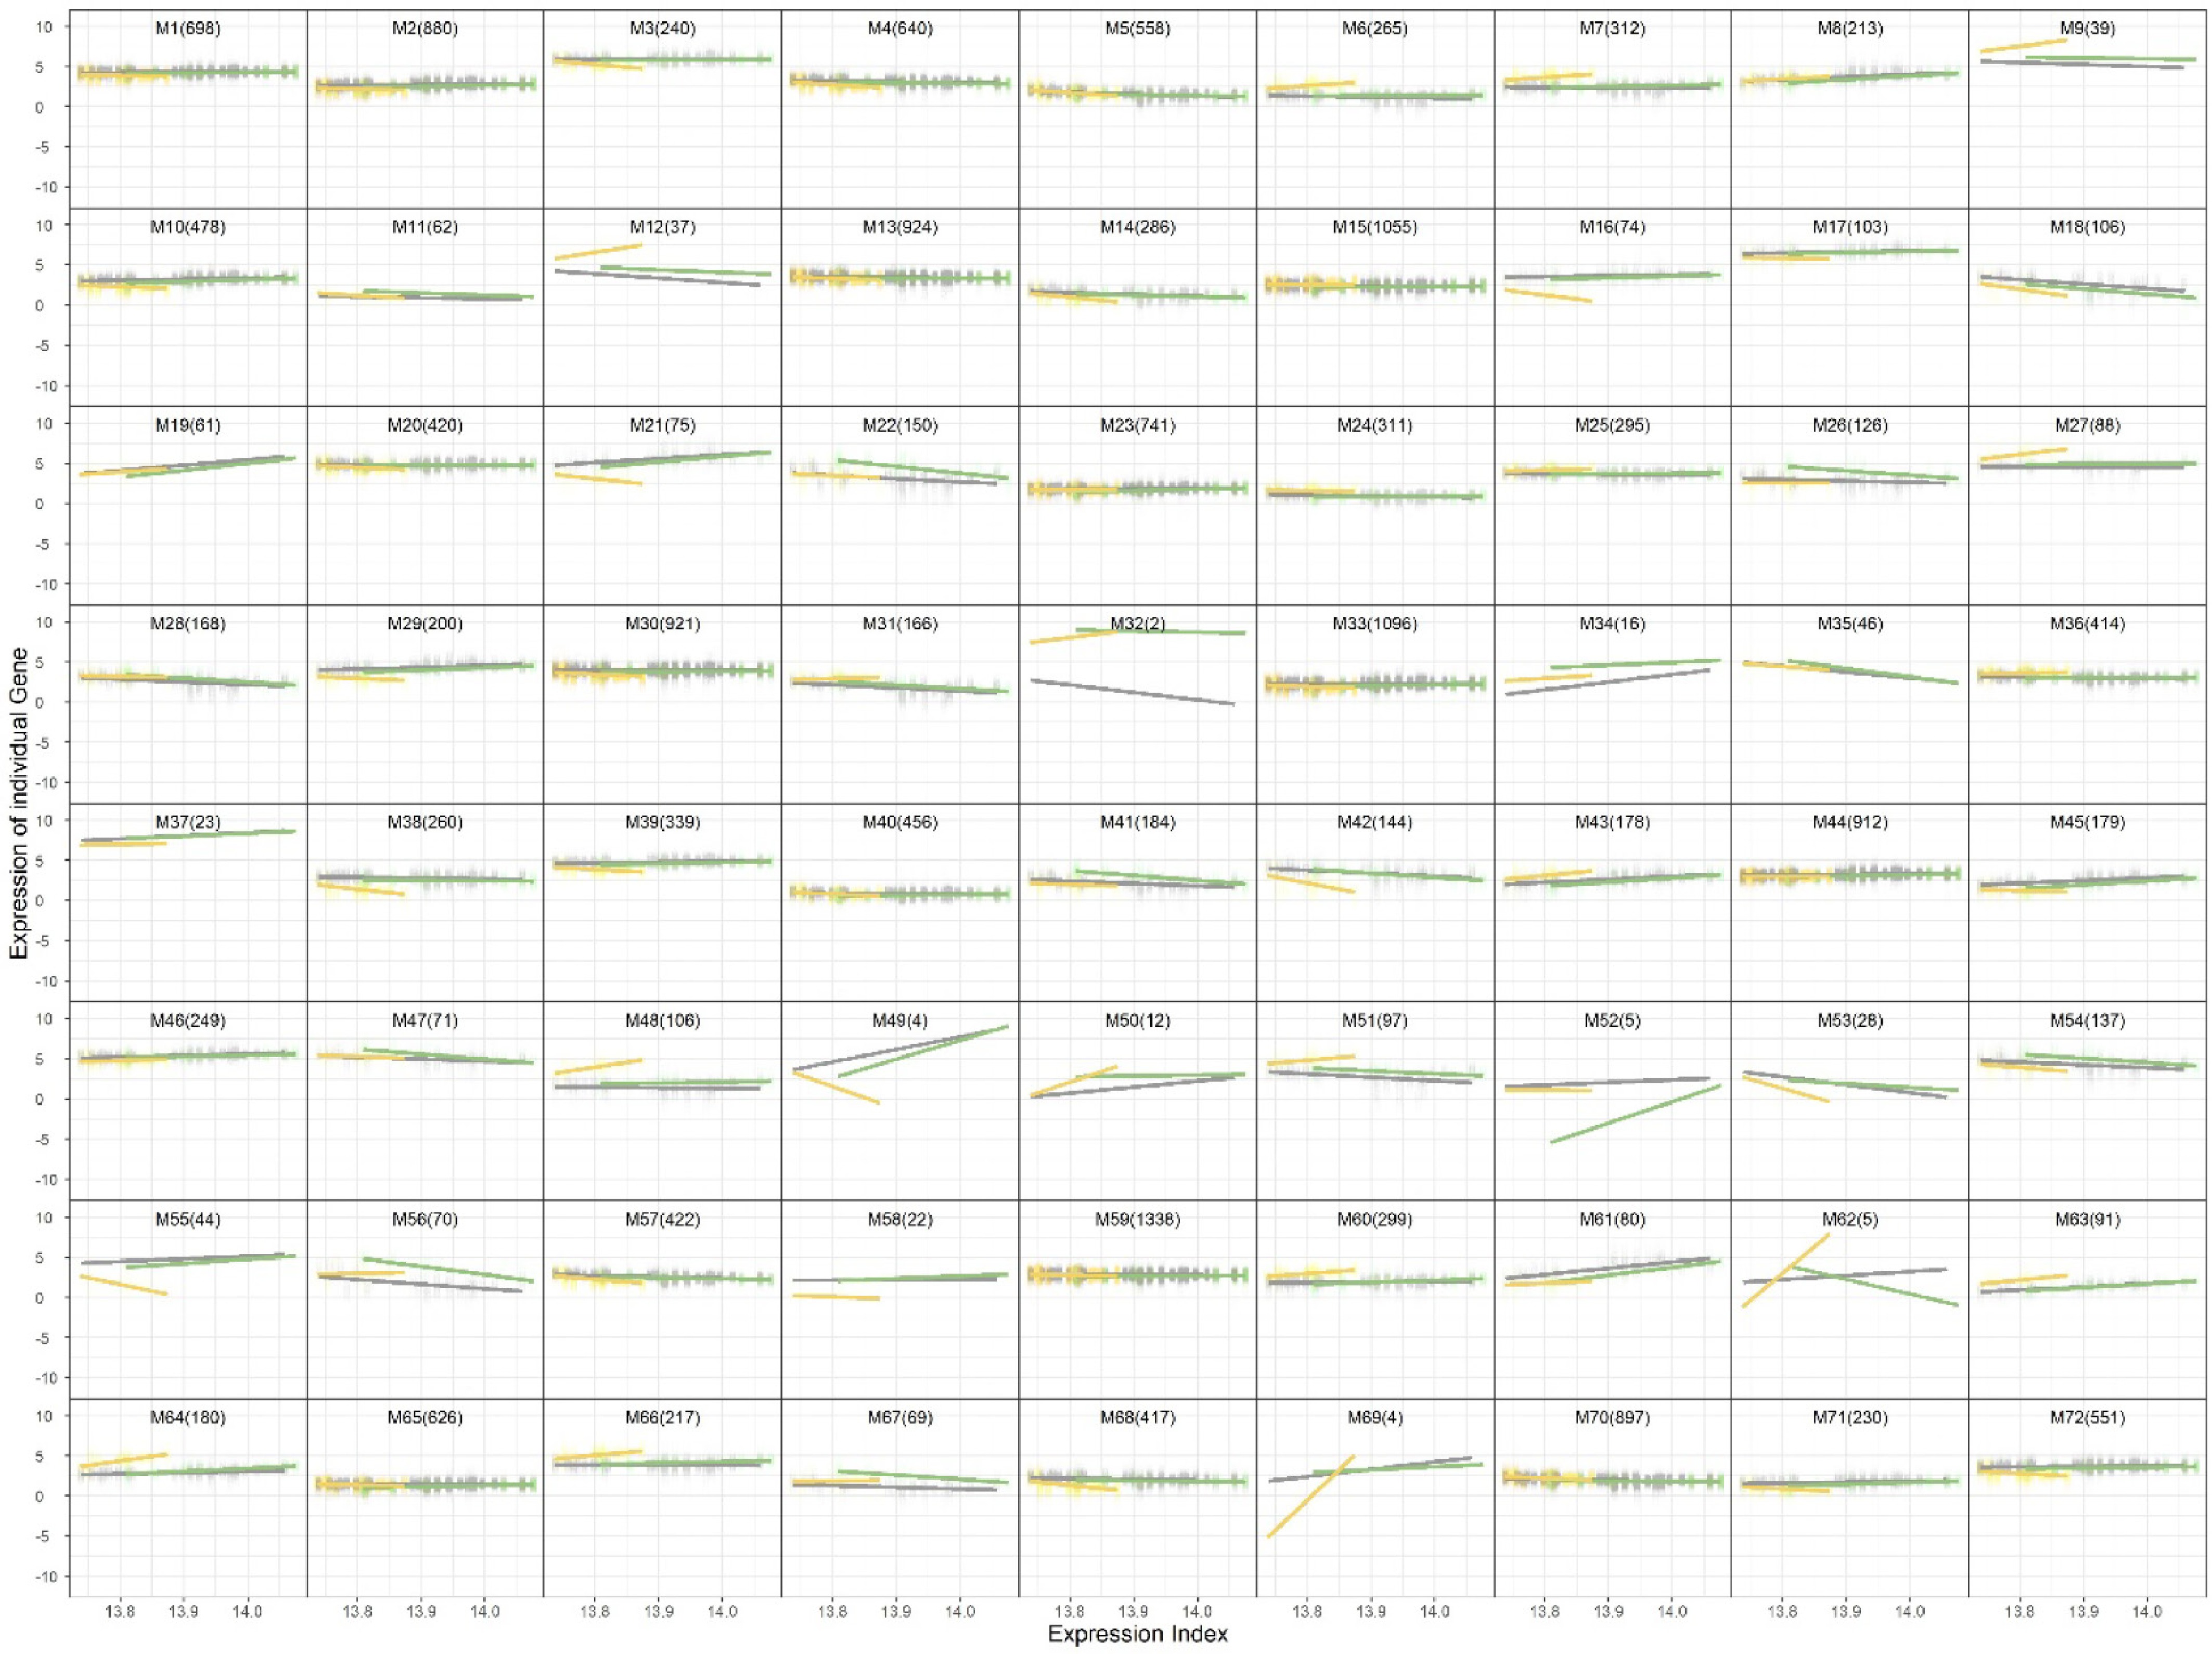
Figure 2.
Trivariate clustering results showing 72 gene modules across leaf, fruit peel, and fruit flesh tissues.
-
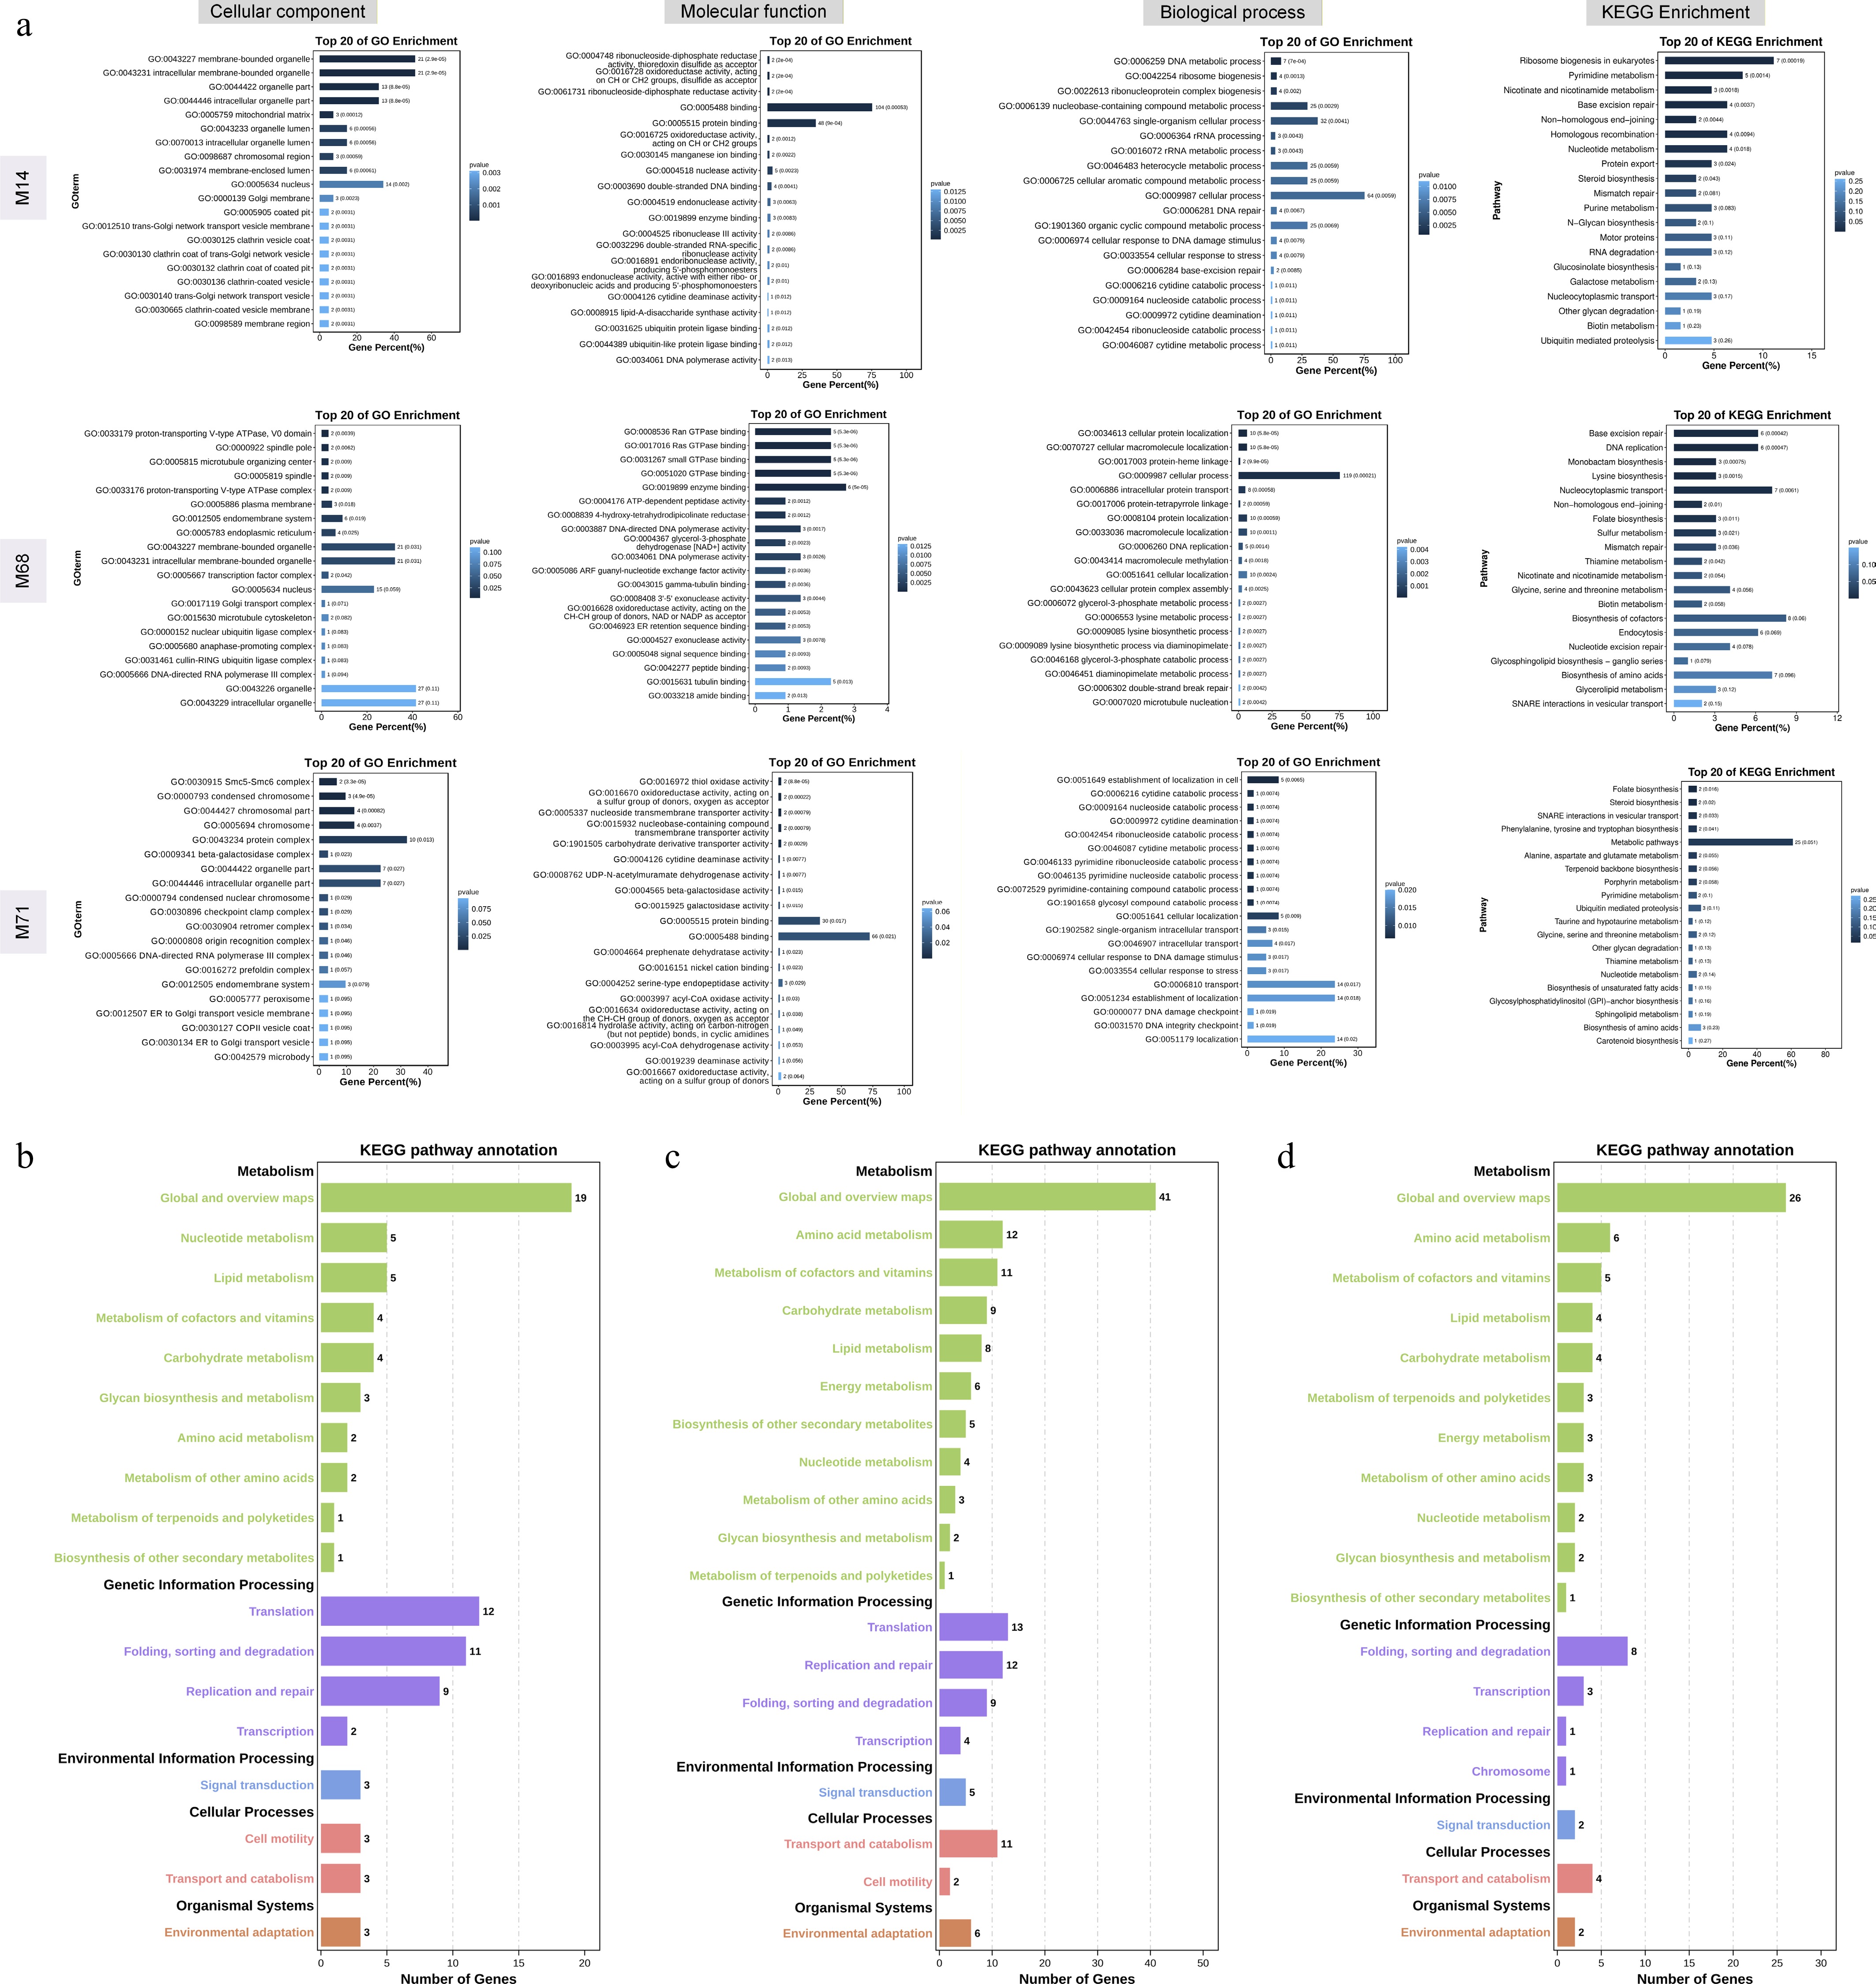
Figure 3.
GO and KEGG enrichment analysis of selected core modules. (a) GO and KEGG enrichment results for modules M14, M68, and M71. (b−d) Classification of enriched KEGG pathways at Level 2 for modules M14, M68, and M71.
-
$ {\nu }^{2} $ Method CA ARI NMI 0.2 FunClu 0.8732 ± 0.0642 0.8357 ± 0.0508 0.9271 ± 0.0217 0.2 FunClu_
Smoothing0.8646 ± 0.0474 0.8318 ± 0.0501 0.9236 ± 0.0227 0.2 GMM 0.7233 ± 0.0578 0.6590 ± 0.0682 0.8356 ± 0.0399 0.2 KMeans 0.7525 ± 0.0558 0.6820 ± 0.0564 0.8381 ± 0.0307 0.4 FunClu 0.6642 ± 0.0757 0.5805 ± 0.0783 0.7876 ± 0.0472 0.4 FunClu_
Smoothing0.6859 ± 0.0678 0.5912 ± 0.0668 0.7795 ± 0.0432 0.4 GMM 0.5025 ± 0.0510 0.3895 ± 0.0516 0.6515 ± 0.0389 0.4 KMeans 0.5174 ± 0.0442 0.3930 ± 0.0510 0.6520 ± 0.0397 0.6 FunClu 0.4841 ± 0.0506 0.3847 ± 0.0524 0.6600 ± 0.0399 0.6 FunClu_
Smoothing0.5115 ± 0.0421 0.3879 ± 0.0451 0.6456 ± 0.0357 0.6 GMM 0.3586 ± 0.0355 0.2439 ± 0.0371 0.5144 ± 0.0380 0.6 KMeans 0.3639 ± 0.0331 0.2347 ± 0.0335 0.5144 ± 0.0367 0.8 FunClu 0.3916 ± 0.0365 0.2776 ± 0.0334 0.5578 ± 0.0370 0.8 FunClu_
Smoothing0.4152 ± 0.0353 0.2762 ± 0.0328 0.5458 ± 0.0329 0.8 GMM 0.2996 ± 0.0262 0.1723 ± 0.0262 0.4388 ± 0.0393 0.8 KMeans 0.3005 ± 0.0279 0.1727 ± 0.0260 0.4396 ± 0.0387 1.0 FunClu 0.3323 ± 0.0247 0.2142 ± 0.0235 0.4929 ± 0.0285 1.0 FunClu_
Smoothing0.3407 ± 0.0228 0.2140 ± 0.0217 0.4861 ± 0.0275 1.0 GMM 0.2693 ± 0.0199 0.1412 ± 0.0193 0.3976 ± 0.0263 1.0 KMeans 0.2674 ± 0.0185 0.1490 ± 0.0154 0.3965 ± 0.0257 Table 1.
Simulation results (
$\nu $ -
$ {\nu }^{2} $ Method CA ARI NMI 0.2 FunClu 0.8818 ± 0.0629 0.8530 ± 0.0765 0.9565 ± 0.0225 0.2 FunClu_
Smoothing0.9067 ± 0.0465 0.8918 ± 0.0488 0.9588 ± 0.0215 0.2 GMM 0.8728 ± 0.0440 0.8537 ± 0.0540 0.9448 ± 0.0215 0.2 KMeans 0.9060 ± 0.0460 0.8864 ± 0.0521 0.9548 ± 0.0217 0.4 FunClu 0.8323 ± 0.0487 0.7872 ± 0.0551 0.9066 ± 0.0242 0.4 FunClu_
Smoothing0.8215 ± 0.0435 0.7752 ± 0.0534 0.8971 ± 0.0255 0.4 GMM 0.7431 ± 0.0597 0.6964 ± 0.0623 0.8633 ± 0.0304 0.4 KMeans 0.7845 ± 0.0573 0.7261 ± 0.0632 0.8716 ± 0.0287 0.6 FunClu 0.7183 ± 0.0392 0.6315 ± 0.0375 0.8791 ± 0.0263 0.6 FunClu_
Smoothing0.7156 ± 0.0303 0.6255 ± 0.0415 0.8123 ± 0.0289 0.6 GMM 0.6310 ± 0.0622 0.5392 ± 0.0647 0.7689 ± 0.0400 0.6 KMeans 0.6664 ± 0.0549 0.5621 ± 0.0653 0.7748 ± 0.0380 0.8 FunClu 0.6060 ± 0.0534 0.4860 ± 0.0605 0.7237 ± 0.0371 0.8 FunClu_
Smoothing0.6020 ± 0.0405 0.4771 ± 0.0523 0.7196 ± 0.0373 0.8 GMM 0.5095 ± 0.0364 0.3993 ± 0.0517 0.6732 ± 0.0377 0.8 KMeans 0.5311 ± 0.0421 0.4072 ± 0.0510 0.6729 ± 0.0429 1.0 FunClu 0.5380 ± 0.0382 0.4240 ± 0.0376 0.6891 ± 0.0288 1.0 FunClu_
Smoothing0.5360 ± 0.0393 0.4215 ± 0.0371 0.6916 ± 0.0373 1.0 GMM 0.4673 ± 0.0296 0.3490 ± 0.0293 0.6133 ± 0.0296 1.0 KMeans 0.4870 ± 0.0356 0.3557 ± 0.0327 0.6348 ± 0.0292 Table 2.
Simulation results (
$\nu $
Figures
(3)
Tables
(2)