


-
The concept of functional clustering was first systematically introduced by Rongling Wu and his team[1] to classify periodically expressed genes into different patterns through Fourier series expansions. This approach, particularly named Wu's functional clustering (or Wu's FunClu), was built on a mixture-based likelihood function containing weighted mixture components. Each of these components is assumed to follow a multivariate (longitudinal) normal distribution with a mean vector modeled by biologically meaningful mathematical equations, such as Fourier's periodic equations, and a (co)variance matrix modeled by an autoregressive process. Building on this foundation, Wu and his team[2] further expanded functional clustering to multiple dimensions of data, showing the important application and uniqueness of this approach to dissect and resolve complex systems.
Although there is a rich body of literature on clustering algorithms[3−5], Wu's FunClu has proved to be more powerful, versatile, and flexible for data clustering. Unlike conventional approaches that treat observations as static vectors, it explicitly considers the dynamic and temporal structure of the data. Its applications are especially important in analyzing omics datasets, including transcriptomics, proteomics, metabolomics, and single-cell data[2,6,7], where clustering can reveal hidden biological modules and functional relationships. A recent study by Wu et al.[2] applied functional clustering to large-scale metabolomics data. Metabolites in healthy and diseased groups were grouped into coherent modules, providing new insights into metabolic reprogramming in inflammatory bowel disease[2]. These examples highlight the broad potential of functional clustering as a versatile method that links advanced statistical modeling with key challenges in biomedicine and other scientific fields.
Modern transcriptome and multi-omics studies often involve tens of thousands to over hundreds of thousands of features, and the increasing sample size presents a significant challenge for data processing[8,9]. Traditional functional clustering methods struggle with large datasets because of the high computational demands, high memory requirements, and the risk of misclassification, leading to less effective clustering results. Additionally, time-series data are often limited or unavailable in biological research, which hinders the use of temporal clustering methods. Moreover, multi-omics datasets frequently vary in scale, noise characteristics, and correlation structures, requiring flexible and robust clustering techniques[10−12]. These factors highlight the need for improved functional clustering approaches that can efficiently handle high-dimensional, nontemporal, and heterogeneous biological data while providing meaningful biological insights.
In this study, we propose an improved framework of Wu's FunClu to leverage its capacity for clustering large-scale, multi-omics data. The framework combines the allometric scaling law, advanced optimization techniques, and enhanced covariance modeling approaches to produce accurate, robust, and biologically meaningful clustering results. This framework is designed to be scalable and adaptable, offering a versatile tool for analyzing complex biological datasets.
The rest of the paper is organized as follows. Section "Methods" details the proposed methodology. Section "Silulation" shows the simulation results, and section "Data analysis" demonstrates an application to real biological data. The last section concludes the paper with a discussion and future directions.
-
We assume that the dataset consists of
$ n $ $ m $ $ {y}_{i}=({y}_{i1},\cdots ,{y}_{im}{)}^{T} $ $ K $ $ p\left({y}_{i}|\Theta \right)=\sum \limits_{k=1}^{K}\,{\alpha }_{k}\mathcal{N}\left({y}_{i}|{\mu }_{ki},{\Sigma }_{k}\right) $ (1) where,
$ {\alpha }_{k} $ $ \sum \nolimits_{k=1}^{K}{\alpha }_{k}=1 $ $ \mathcal{N}(\cdot ) $ $ {\mu }_{ki} $ ${\Sigma }_{k}$ Traditional approaches are often constructed under the assumption that sufficient temporal or dynamic data are available. Such data enable the direct modeling of time-dependent trajectories. However, in many practical applications, longitudinal measurements are either infeasible to obtain or require excessive experimental and financial resources. This limitation motivates the need for alternative approaches that can extract dynamic-like information from static high-dimensional data.
The study of complex biological systems at the cellular and molecular levels has increasingly drawn parallels to community ecology[13−15]. Just as ecology examines the interactions between species and their environment, systems biology aims to model how the information flow between molecular components gives rise to the emergent behavior of the system[16].
A central pillar of this "crosspollination" is the concept of the ecological niche, which characterizes the response of organisms to their environment across time and space[17]. Within this niche space, a species' survival and growth are fundamentally governed by resource availability[18,19]. In natural ecosystems, resource availability is the net result of the interactions between all resident organisms and the environmental supply. Consequently, the "net quality" or productivity of such an ecosystem can be summarized by the ecosystem index, a surrogate measure derived from the total abundance of all organisms that reflects the environmental factors essential for the system's survival[20].
Analogously, we treat a sample as a gene ecosystem. In this framework, individual genes are equivalent to organisms, and their expression levels reflect their utilization of the "resources" provided by the cellular environment. Following the notion of the ecosystem index used in ecology and agriculture[21,22], we define the habitat index
$ {E}_{i} $ $ i $ $ {E}_{i}=\sum \limits_{j=1}^{m}\,{y}_{ij} $ (2) where,
$ {y}_{ij} $ $ j $ $ i $ In complex living systems, the variation of a specific component in response to the state of the whole system is rarely linear. Instead, these relationships are often observed to obey the allometric scaling law, a fundamental biological principle typically described by a power equation[23−25].
The term "allometry" was first coined by Huxley and Teissier[26] to investigate the phenomenon of relative growth, specifically how the proportions of an organism's parts change in relation to its total size. Since then, the scope of allometry has been broadly expanded to refer to almost any covarying biological measurements where the part's behavior is dictated by the scale of the whole.
As mentioned above, by conceptualizing each sample as a complex ecosystem of interconnected entities, we use the habitat index—defined as the cumulative abundance of all entities within a specific spatiotemporal context—as a robust proxy for assessing an ecosystem. The observed spectrum of habitat indices captures the systemic variability of gene ecosystems, likely driven by intricate internal interactions and external environmental influences. This framework effectively formalizes the part–whole relationship between individual entities' abundance and the collective habitat index across diverse samples. This methodological approach has already gained significant traction in the biological sciences. Its applications range from monitoring the functional stability of terrestrial soil microbiomes to deciphering the progressive decoupling of gene interactions during biological aging[27,28].
Translating this principle into the clustering model, the mean function of the
$ k $ $ {\mu }_{ki}={a}_{k}E_{i}^{{b}_{k}},i=1,\cdots ,n, $ (3) where,
$ {a}_{k} $ $ {b}_{k} $ The specification of the covariance matrix
${\Sigma }_{k}$ Let
$ {E}_{i} $ $ i $ $ i $ $ i $ $ j $ $ {\sigma }^{2}\left({E}_{i}\right)=\dfrac{1-{\phi }^{2i}}{1-{\phi }^{2}}{\nu }^{2},{\sigma }^{2}\left({E}_{i},{E}_{j}\right)={\phi }^{\mid i-j\mid }\dfrac{1-{\phi }^{2i}}{1-{\phi }^{2}}{\nu }^{2} $ (4) where,
$ {\nu }^{2} $ $ \phi \in (-1{,}1) $ $ d $ $\Sigma$ $ d\times d $ $ \Sigma =\left[\begin{matrix}\dfrac{1-{\phi }^{2}}{1-{\phi }^{2}}{\nu }^{2} & \phi \dfrac{1-{\phi }^{2}}{1-{\phi }^{2}}{\nu }^{2} & \cdots & {\phi }^{d-1}\dfrac{1-{\phi }^{2}}{1-{\phi }^{2}}{\nu }^{2}\\ \phi \dfrac{1-{\phi }^{2}}{1-{\phi }^{2}}{\nu }^{2} & \dfrac{1-{\phi }^{4}}{1-{\phi }^{2}}{\nu }^{2} & \cdots & {\phi }^{d-2}\dfrac{1-{\phi }^{2}}{1-{\phi }^{2}}{\nu }^{2}\\ \vdots & \vdots & \ddots & \vdots \\ {\phi }^{d-1}\dfrac{1-{\phi }^{2}}{1-{\phi }^{2}}{\nu }^{2} & {\phi }^{d-2}\dfrac{1-{\phi }^{2}}{1-{\phi }^{2}}{\nu }^{2} & \cdots & \dfrac{1-{\phi }^{2d}}{1-{\phi }^{2}}{\nu }^{2}\\ \end{matrix}\right] $ (5) Given a dataset
$ X=\{{x}_{1},{x}_{2},\cdots ,{x}_{n}\} $ $ L\left(X|\Theta \right)=\sum \limits_{i=1}^{n}\,\ln \left(\sum \limits_{k=1}^{K}\,{\alpha }_{k}\mathcal{N}\left({x}_{i}\mid {\mu }_{k}\left({E}_{i}\right),{\Sigma }_{k}\right)\right) $ (6) Introducing latent variables that indicate cluster membership, the Expetation-Maximization (EM) auxiliary function can be written as follows:
$ \begin{split}Q\left(\Theta |{\Theta }^{\left(t\right)}\right)=&\sum \limits_{i=1}^{n}\,\sum \limits_{k=1}^{K}\,\omega _{i,k}^{\left(t\right)}\left[\ln {\alpha }_{k}-\dfrac{1}{2}\ln \det \left({\Sigma }_{k}\right)\right.\\ &\left. -\dfrac{1}{2}{\left({x}_{i}-{\mu }_{k}\left({E}_{i}\right)\right)}^{\mathrm{\top }}\Sigma _{k}^{-1}\left({x}_{i}-{\mu }_{k}\left({E}_{i}\right)\right)\right] \end{split}$ (7) with the posterior responsibility
$ \omega _{i,k}^{\left(t\right)}=\dfrac{\alpha _{k}^{\left(t\right)}\mathcal{N}\left({x}_{i}|\mu _{k}^{\left(t\right)}\left({E}_{i}\right),\Sigma _{k}^{\left(t\right)}\right)}{\displaystyle\sum \limits_{\mathscr{l}=1}^{K}\,\alpha _{\mathscr{l}}^{\left(t\right)}\mathcal{N}\left({x}_{i}|\mu _{\mathscr{l}}^{\left(t\right)}\left({E}_{i}\right),\Sigma _{\mathscr{l}}^{\left(t\right)}\right)} $ (8) To estimate the model parameters, we use a hybrid EM algorithm characterized by a dual-optimization strategy in the M-step. Specifically, for parameters with explicit gradients (e.g., mixing proportions), we derive closed-form analytic solutions to ensure computational efficiency. For parameters lacking such analytic properties, we incorporate numerical optimization routines to iteratively maximize the auxiliary function. This hybrid approach balances analytical precision with numerical flexibility, ensuring robust convergence in complex parameter spaces.
The mixing proportions admit the following analytic solution:
$ \alpha _{k}^{\left(t+1\right)}=\dfrac{1}{n}\sum \limits_{i=1}^{n}\,\omega _{i,k}^{\left(t\right)} $ (9) However, in practice, it is possible that some clusters receive nearly zero assignments, leading to degeneracy (i.e., "empty clusters"). To mitigate this, we apply a smoothing transformation using the softmax function as follows:
$ \tilde{\alpha }_{k}^{\left(t+1\right)}=\dfrac{\exp \left(\gamma \alpha _{k}^{\left(t+1\right)}\right)}{\displaystyle\sum \limits_{\mathscr{l}=1}^{K}\,\exp \left(\gamma \alpha _{\mathscr{l}}^{\left(t+1\right)}\right)} $ (10) where,
$ \gamma $ For the mean function parameters
$ ({a}_{k},{b}_{k}) $ $ ({\phi }_{k},{v}_{k}) $ $ Q $ This mixed update strategy preserves analytic efficiency for simple parameters while leveraging modern optimization for complex components, thereby improving the convergence stability and scalability in high-dimensional applications.
Initialization of parameters is critical for the stability and convergence of the EM algorithm. In our framework, the mean function parameters are initialized using the results of a k-means clustering applied to the raw data matrix. Specifically, the empirical cluster centroids from k-means are taken as the initial estimates for the functional means, which are then projected onto the parametric form
$ {\mu }_{k}(E)={a}_{k}{E}^{{{b}_{k}}} $ The covariance parameters are initialized using identity-based structures with small perturbations to avoid singularity, whereas the mixing proportions are initialized uniformly, i.e.,
$ \alpha _{k}^{(0)}=1/K $ This initialization strategy provides a reasonable approximation to the underlying structure of the data, effectively reducing the risk of poor local optima during subsequent EM iterations.
The optimal number of clusters
$ K $ $ L(X\mid {\hat{\Theta }}_{K}) $ $ {d}_{K} $ $ \mathrm{BIC}\left(K\right)=-2\ln L\left(X|{\hat{\Theta }}_{K}\right)+{d}_{K}\ln n $ (11) where,
$ n $ We evaluate the BIC across a grid of candidate cluster numbers and select the value of
$ K $ Multivariate extension of functional clustering
-
In many real-world applications, data are collected across multiple conditions or tissues, which requires extending the functional clustering model to a multivariate setting. Suppose the dataset consists of paired vectors
$ {\mathbf{x}}_{i}=({x}_{i1},\cdots ,{x}_{ip}) $ $ {\mathbf{y}}_{i}=({y}_{i1},\cdots ,{y}_{iq}) $ $ k $ $ \mu _{k}^{x}(t)=f(\theta _{k}^{x};t) $ $ \mu _{k}^{y}(t)=f(\theta _{k}^{y};t) $ $ f(\cdot ) $ $ \theta _{k}^{x},\theta _{k}^{y} $ Assuming a shared covariance structure
$ \Sigma $ $ p\left({\mathbf{x}}_{i},{\mathbf{y}}_{i}|\Theta \right)=\sum \limits_{k=1}^{K}{\alpha }_{k}\,\mathcal{N}\left({\mathbf{x}}_{i}|\mu _{k}^{x},{\Sigma }^{x}\right)\,\mathcal{N}\left({\mathbf{y}}_{i}|\mu _{k}^{y},{\Sigma }^{y}\right), $ (12) where,
$ {\alpha }_{k} $ $ L\left(D|\Theta \right)=\sum \limits_{i=1}^{n}\ln \left(\sum \limits_{k=1}^{K}{\alpha }_{k} \mathcal{N}\left({\mathbf{x}}_{i}|\mu _{k}^{x},{\Sigma }^{x}\right) \mathcal{N}\left({\mathbf{y}}_{i}|\mu _{k}^{y},{\Sigma }^{y}\right)\right). $ (13) Parameter estimation proceeds via the EM algorithm described in section "Methods", with the possibility of smoothing the mixing proportions to avoid degenerate (empty) clusters. This formulation naturally generalizes to more than two tissues or conditions.
-
To evaluate the performance of the proposed EM algorithm, we conducted a series of simulation studies based on synthetic datasets. Each dataset consisted of
$ n=500 $ $ p=50 $ $ k=20 $ For each cluster
$ c\in \{1,\cdots ,k\} $ $ {\mu }_{c}\left(t\right)={a}_{c}+{b}_{c}\log \left(t\right),t=1,\cdots ,p, $ (14) where, the intercepts
$ {a}_{c} $ $ U(0.5{,}5) $ $ {b}_{c} $ $ U(0.1{,}3) $ Conditional on the cluster assignment
$ {y}_{i} $ $ i $ $ {X}_{i}\sim \mathcal{N}\left({\mu }_{{{y}_{i}}},\Sigma \left(\phi ,v\right)\right) $ (15) The covariance structure is assumed to be common across all components and follows the type form given in Eq. (4).
We considered two correlation settings,
$ \phi =0.6 $ $ \phi =0.9 $ $ v\in \{0.2{,}\;0.4{,}\;0.6{,}\;0.8{,}\;1.0\} $ Methods compared
-
We compare four algorithms:
FunClu: The full functional clustering pipeline described in section "Methods". In the variant FunClu, we do not apply softmax smoothing to the updated mixing proportions
$ {\alpha }_{k} $ FunClu smoothing: The same as FunClu except that after the analytic update of
$ {\alpha }_{k} $ This renormalization avoids zero weights and shrinks extreme small weights toward a nonzero baseline; in practice, it markedly reduces the occurrence of empty clustersand improves numeric stability when some components receive few or zero responsibilities.
We report the results for both variants to demonstrate the concrete effect of smoothing.
GMM: The standard Gaussian mixture model with full covariance, fitted by the EM. We use the same K (true
$ k $ KMeans: The standard k-means on the raw
$ X $ $ k $ For all methods, we evaluate clustering recovery relative to the true labels.
Evaluation metrics
-
We assess clustering performance using the following metrics.
(1) Clustering accuracy (CA): The proportion of correctly classified samples under optimal label matching.
(2) Adjusted Rand index (ARI): This accounts for chance agreement in clustering.
(3) Normalized mutual information (NMI): This measures information-theoretic similarity.
Each experiment was replicated 50 times to reduce variability.
Simulation results
-
Tables 1 and 2 report the averaged performance (mean ± standard deviation [SD] over the replicates) of four methods (FunClu, FunClu Smoothing, GMM, and KMeans) under the noise levels
$ v\in \{0.2{,}\;0.4{,}\;0.6{,}\;0.8{,}\;1.0\} $ $ \phi =0.6 $ $ \phi =0.9 $ Table 1. Simulation results ($\nu $ = 0.9).
$ {\nu }^{2} $ Method CA ARI NMI 0.2 FunClu 0.8732 ± 0.0642 0.8357 ± 0.0508 0.9271 ± 0.0217 0.2 FunClu_
Smoothing0.8646 ± 0.0474 0.8318 ± 0.0501 0.9236 ± 0.0227 0.2 GMM 0.7233 ± 0.0578 0.6590 ± 0.0682 0.8356 ± 0.0399 0.2 KMeans 0.7525 ± 0.0558 0.6820 ± 0.0564 0.8381 ± 0.0307 0.4 FunClu 0.6642 ± 0.0757 0.5805 ± 0.0783 0.7876 ± 0.0472 0.4 FunClu_
Smoothing0.6859 ± 0.0678 0.5912 ± 0.0668 0.7795 ± 0.0432 0.4 GMM 0.5025 ± 0.0510 0.3895 ± 0.0516 0.6515 ± 0.0389 0.4 KMeans 0.5174 ± 0.0442 0.3930 ± 0.0510 0.6520 ± 0.0397 0.6 FunClu 0.4841 ± 0.0506 0.3847 ± 0.0524 0.6600 ± 0.0399 0.6 FunClu_
Smoothing0.5115 ± 0.0421 0.3879 ± 0.0451 0.6456 ± 0.0357 0.6 GMM 0.3586 ± 0.0355 0.2439 ± 0.0371 0.5144 ± 0.0380 0.6 KMeans 0.3639 ± 0.0331 0.2347 ± 0.0335 0.5144 ± 0.0367 0.8 FunClu 0.3916 ± 0.0365 0.2776 ± 0.0334 0.5578 ± 0.0370 0.8 FunClu_
Smoothing0.4152 ± 0.0353 0.2762 ± 0.0328 0.5458 ± 0.0329 0.8 GMM 0.2996 ± 0.0262 0.1723 ± 0.0262 0.4388 ± 0.0393 0.8 KMeans 0.3005 ± 0.0279 0.1727 ± 0.0260 0.4396 ± 0.0387 1.0 FunClu 0.3323 ± 0.0247 0.2142 ± 0.0235 0.4929 ± 0.0285 1.0 FunClu_
Smoothing0.3407 ± 0.0228 0.2140 ± 0.0217 0.4861 ± 0.0275 1.0 GMM 0.2693 ± 0.0199 0.1412 ± 0.0193 0.3976 ± 0.0263 1.0 KMeans 0.2674 ± 0.0185 0.1490 ± 0.0154 0.3965 ± 0.0257 Table 2. Simulation results ($\nu $ = 0.6).
$ {\nu }^{2} $ Method CA ARI NMI 0.2 FunClu 0.8818 ± 0.0629 0.8530 ± 0.0765 0.9565 ± 0.0225 0.2 FunClu_
Smoothing0.9067 ± 0.0465 0.8918 ± 0.0488 0.9588 ± 0.0215 0.2 GMM 0.8728 ± 0.0440 0.8537 ± 0.0540 0.9448 ± 0.0215 0.2 KMeans 0.9060 ± 0.0460 0.8864 ± 0.0521 0.9548 ± 0.0217 0.4 FunClu 0.8323 ± 0.0487 0.7872 ± 0.0551 0.9066 ± 0.0242 0.4 FunClu_
Smoothing0.8215 ± 0.0435 0.7752 ± 0.0534 0.8971 ± 0.0255 0.4 GMM 0.7431 ± 0.0597 0.6964 ± 0.0623 0.8633 ± 0.0304 0.4 KMeans 0.7845 ± 0.0573 0.7261 ± 0.0632 0.8716 ± 0.0287 0.6 FunClu 0.7183 ± 0.0392 0.6315 ± 0.0375 0.8791 ± 0.0263 0.6 FunClu_
Smoothing0.7156 ± 0.0303 0.6255 ± 0.0415 0.8123 ± 0.0289 0.6 GMM 0.6310 ± 0.0622 0.5392 ± 0.0647 0.7689 ± 0.0400 0.6 KMeans 0.6664 ± 0.0549 0.5621 ± 0.0653 0.7748 ± 0.0380 0.8 FunClu 0.6060 ± 0.0534 0.4860 ± 0.0605 0.7237 ± 0.0371 0.8 FunClu_
Smoothing0.6020 ± 0.0405 0.4771 ± 0.0523 0.7196 ± 0.0373 0.8 GMM 0.5095 ± 0.0364 0.3993 ± 0.0517 0.6732 ± 0.0377 0.8 KMeans 0.5311 ± 0.0421 0.4072 ± 0.0510 0.6729 ± 0.0429 1.0 FunClu 0.5380 ± 0.0382 0.4240 ± 0.0376 0.6891 ± 0.0288 1.0 FunClu_
Smoothing0.5360 ± 0.0393 0.4215 ± 0.0371 0.6916 ± 0.0373 1.0 GMM 0.4673 ± 0.0296 0.3490 ± 0.0293 0.6133 ± 0.0296 1.0 KMeans 0.4870 ± 0.0356 0.3557 ± 0.0327 0.6348 ± 0.0292 First, FunClu generally outperforms the baseline methods in terms of CA, ARI, and NMI. This improvement is especially pronounced at low to moderate noise levels (
$ \gamma \leq 0.6 $ Second, the smoothing strategy (FunClu_Smoothing) adds stability. Although FunClu alone often achieves the highest numerical scores, with several parameter settings, it suffers from empty clusters, which undermines the interpretability of the clustering solution. FunClu_Smoothing, by contrast, prevents class loss by regularizing the mixing proportions through a softmax transformation, ensuring that all clusters are retained. Although the smoothing variant sometimes yields slightly lower CA, ARI, or NMI values, its solutions remain more reliable and biologically interpretable.
Third, as expected, performance decreases as the noise variance increases. All methods exhibit declining accuracy and agreement metrics when
$ \gamma $ Finally, comparing across correlation strengths (
$ v=0.9 $ $ \mathrm{v}=0.6 $ $ \mathrm{v}=0.6 $ Summary
-
In summary, the simulation results consistently demonstrate the advantages of the proposed FunClu framework. By jointly modeling the cluster-specific mean structure through an allometric scaling law and incorporating SAD1 covariance, FunClu achieves more accurate clustering performance than standard approaches in most parameter settings. However, in several high-noise configurations, FunClu occasionally suffers from empty clusters, which, although accompanied by higher numerical indices, may reduce the interpretability of the clustering solution. The smoothing variant effectively mitigates this issue by regularizing the mixing proportions through a softmax transformation, thereby preventing class loss and ensuring that all identified clusters remain biologically interpretable. Collectively, these findings suggest that FunClu, particularly with smoothing, provides a principled and flexible tool for functional clustering with high-dimensional dependent data, laying a solid foundation for subsequent applications to real biological datasets.
The simulation study is intended to evaluate the proposed method under its target modeling assumptions. Testing robustness to severe deviations from the allometric mean structure is beyond the scope of the present work and will be investigated in future studies.
-
To further demonstrate the practical utility of our proposed method, we applied it to a transcriptomic dataset of Prunus mume 'Meiren', which was previously reported by Meng et al[34]. The dataset consists of RNA-seq measurements from three distinct tissues (leaves, exocarps, and mesocarps), providing a comprehensive view of tissue-specific gene expression patterns[34]. This setting is particularly suitable for applying our multivariate functional clustering model, as it allows us to simultaneously capture both shared and tissue-specific gene expression patterns.
The number of clusters was determined by the BIC. As shown in Fig. 1, the BIC curve reached its minimum at K = 72, which was selected as the optimal number of clusters for subsequent analysis.
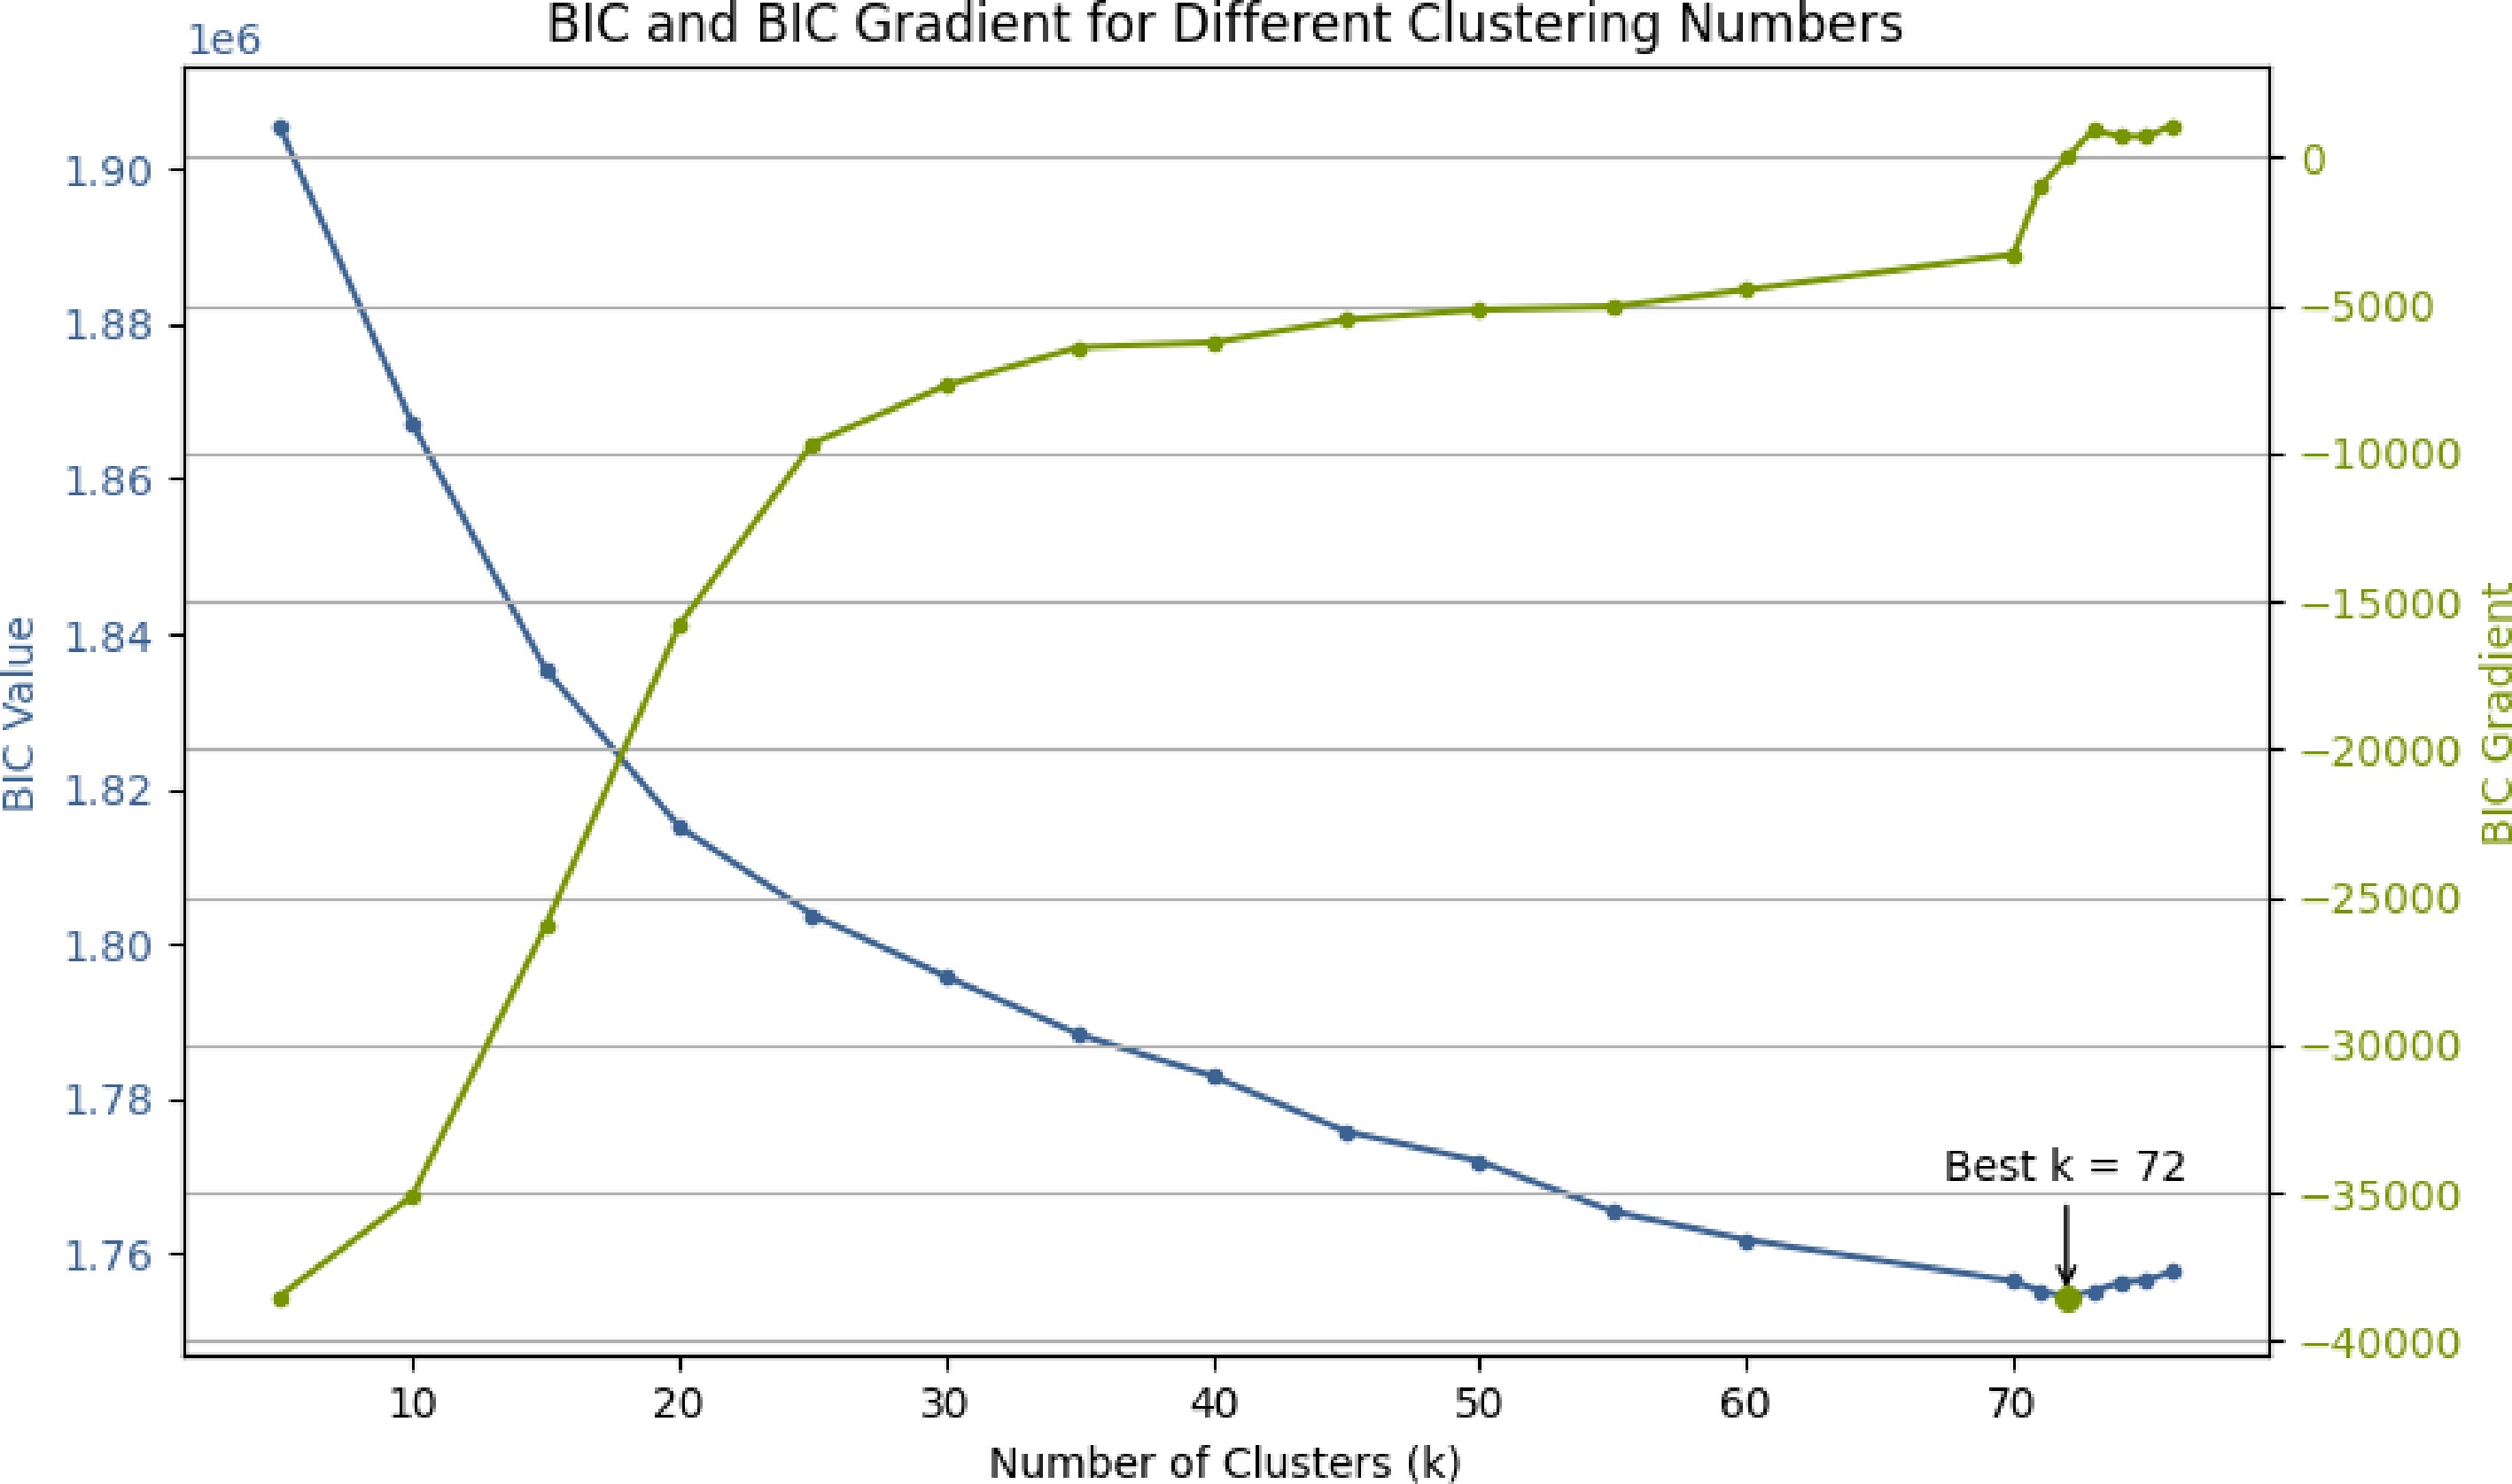
Figure 1.
BIC values under different cluster numbers, with the optimal value at K = 72.
On the basis of this choice, the trivariate clustering identified 72 gene modules, each representing a distinct expression pattern across the three tissues. Several clusters exhibited uniform expression across leaves, fruit peel, and fruit flesh, indicating their involvement in core biological processes shared across tissues. In contrast, many clusters demonstrated tissue-specific expression.
The resulting cluster assignments are illustrated in Fig. 2, where the genes are grouped by their expression profiles across the three tissues.
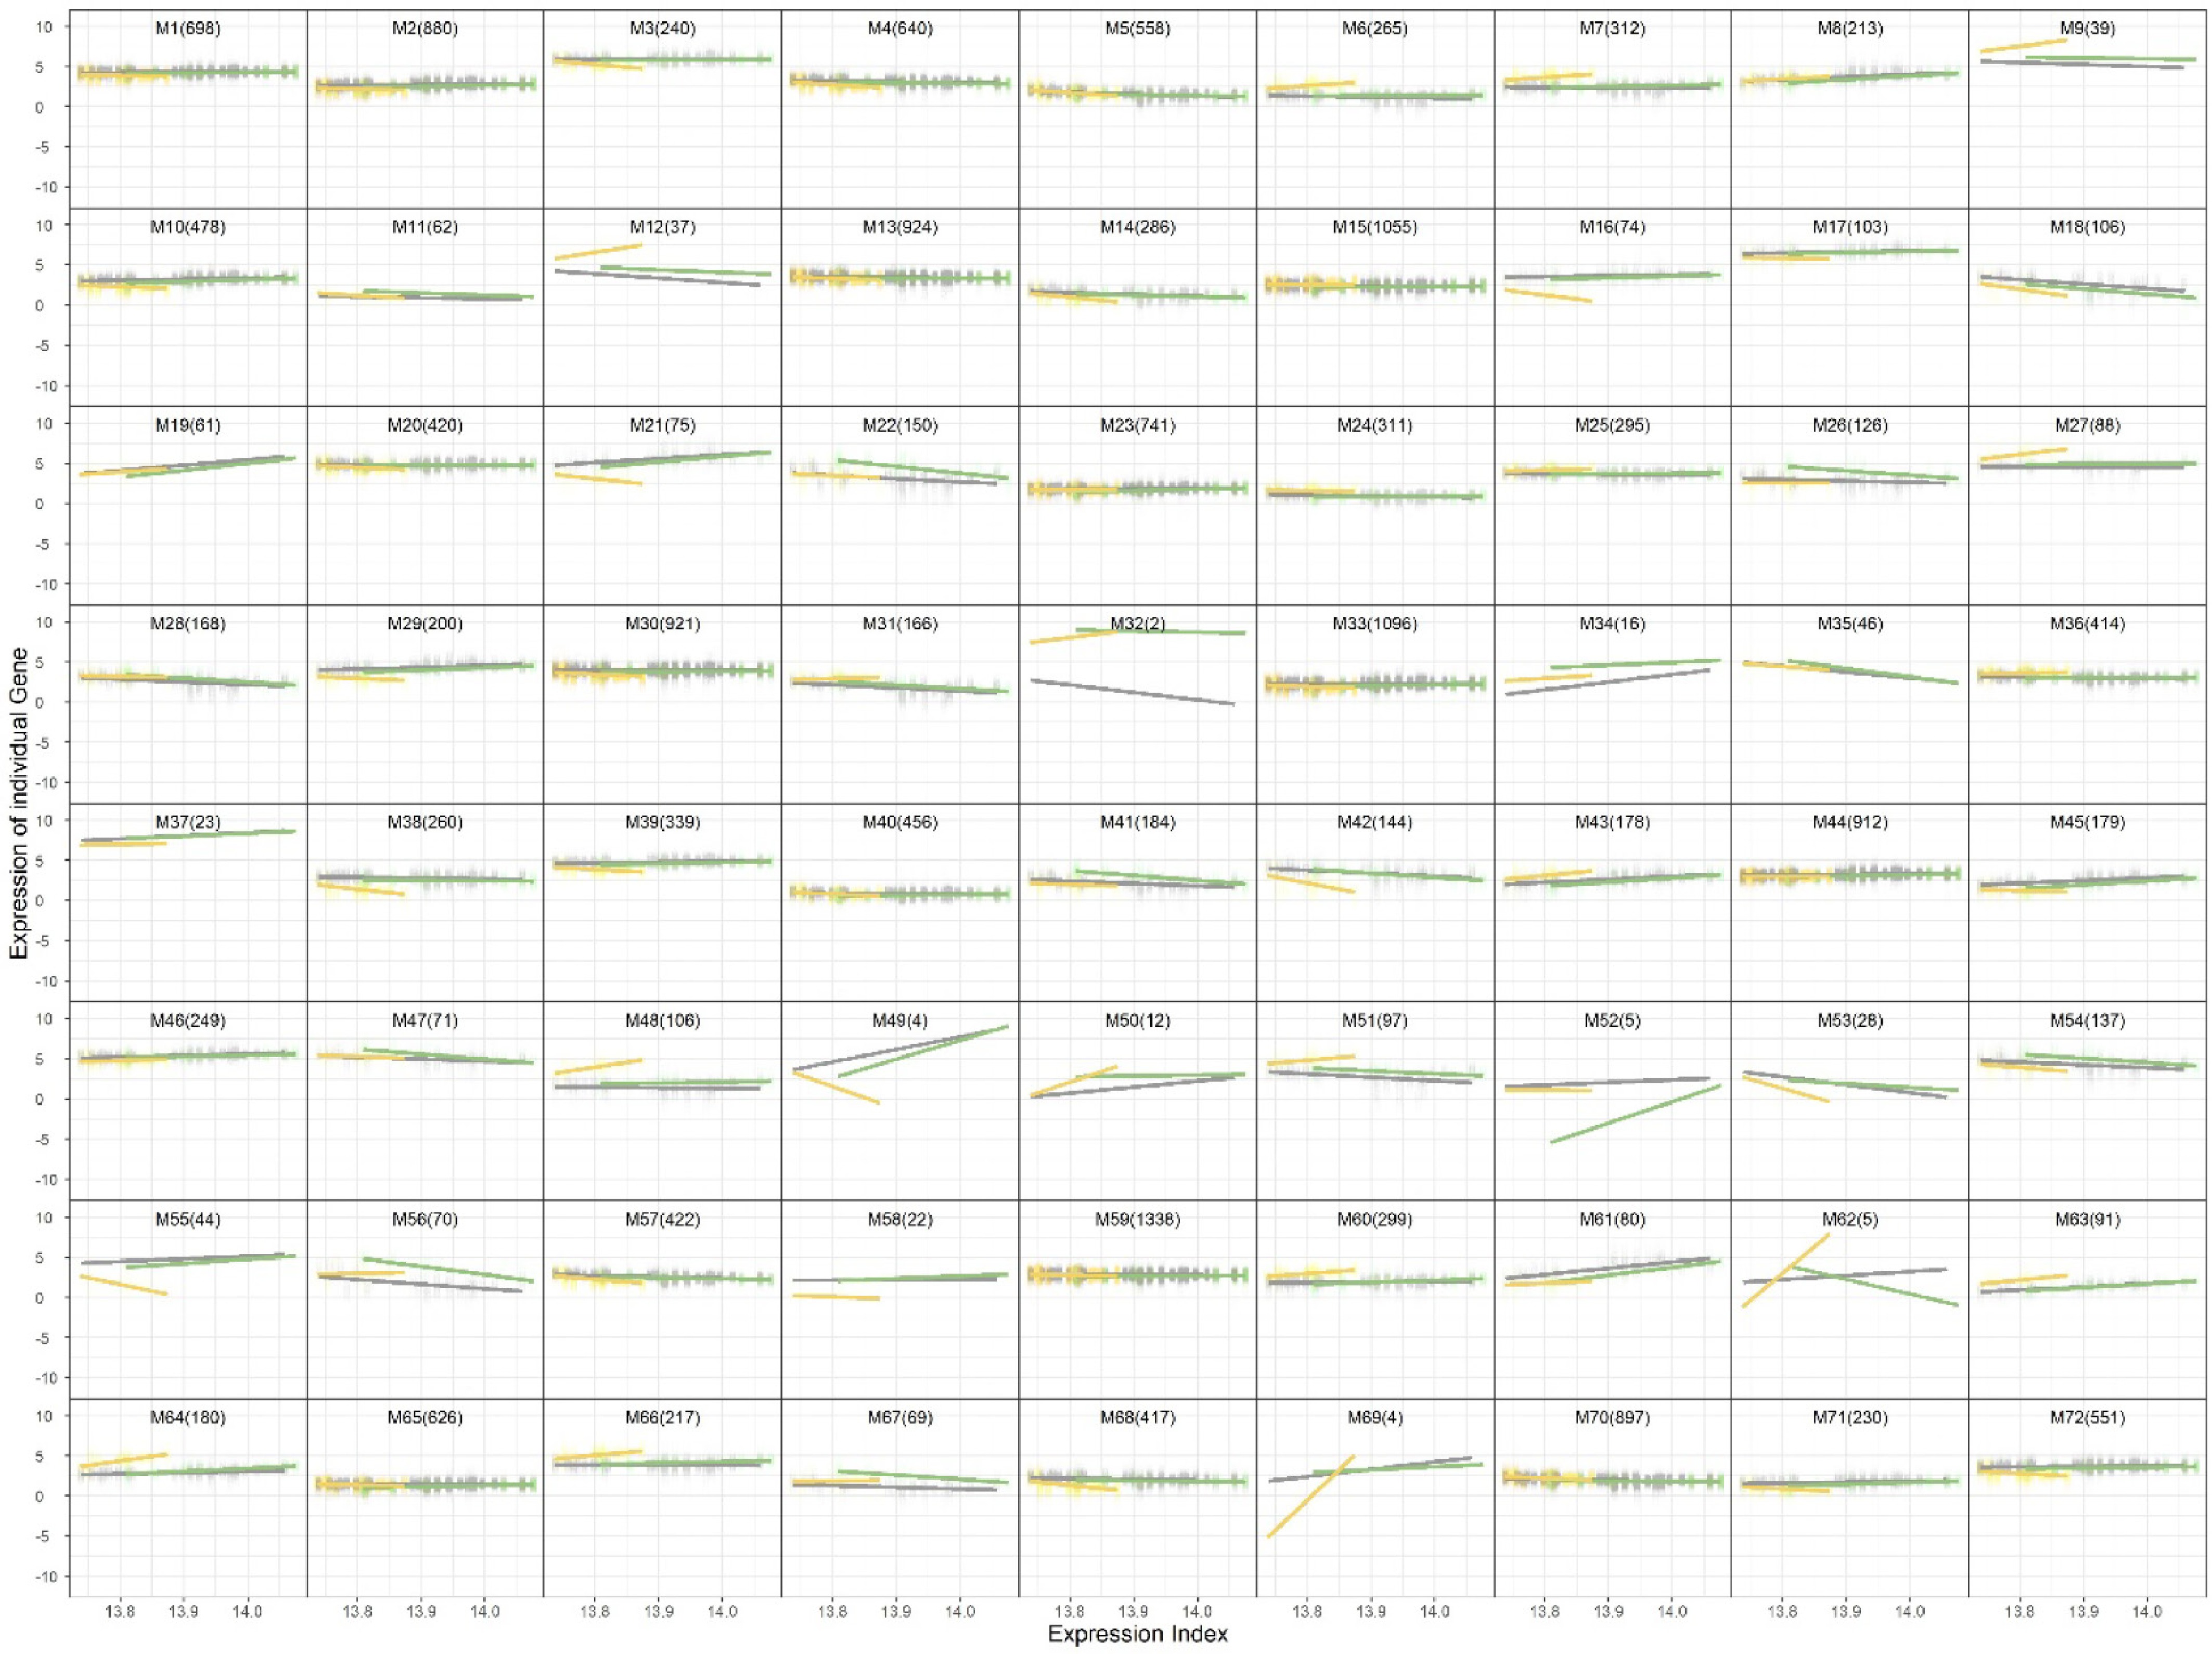
Figure 2.
Trivariate clustering results showing 72 gene modules across leaf, fruit peel, and fruit flesh tissues.
To further extract biologically relevant modules, we constructed a gene interaction network using the idopNetwork[35] algorithm (results not shown). On the basis of network topology and biological interpretability, we selected three hub modules (M14, M68, and M71) for detailed functional enrichment analysis, and the results are shown in Fig. 3. Gene Ontology (GO) enrichment and Kyoto Encyclopedia of Genes and Genomes (KEGG) pathway analysis were performed using the OmicShare tools[36−38].
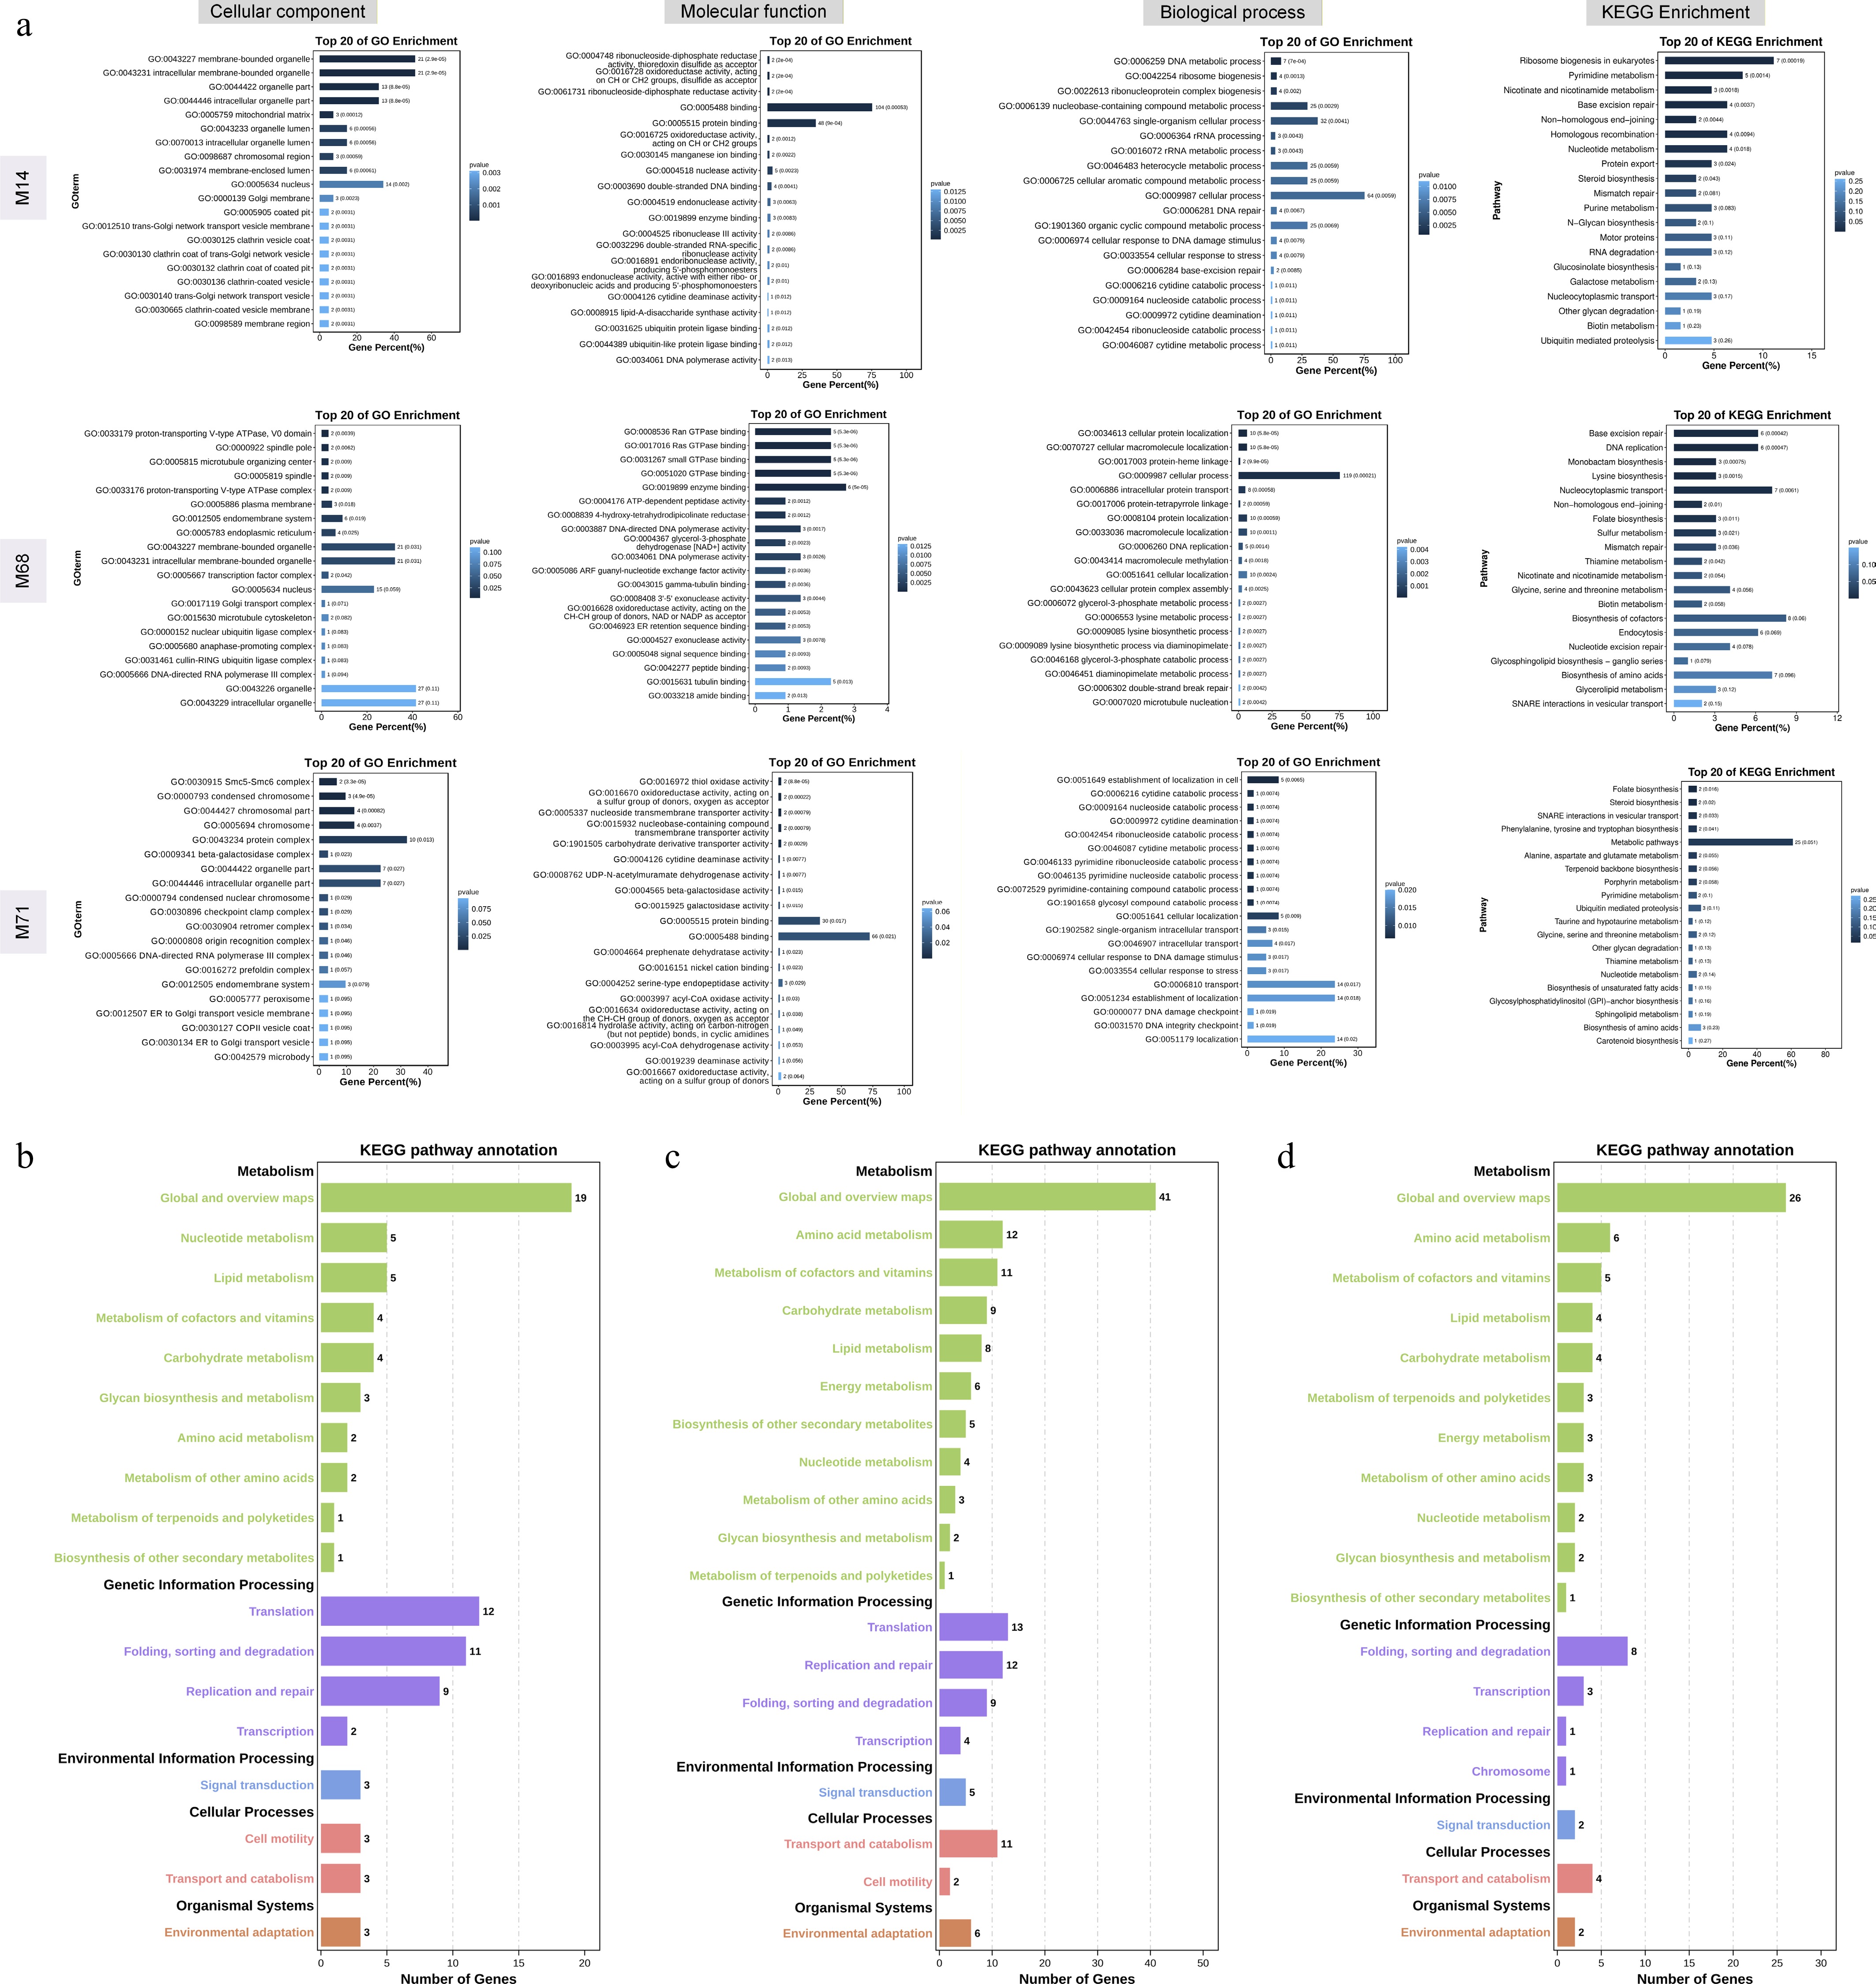
Figure 3.
GO and KEGG enrichment analysis of selected core modules. (a) GO and KEGG enrichment results for modules M14, M68, and M71. (b−d) Classification of enriched KEGG pathways at Level 2 for modules M14, M68, and M71.
The enrichment patterns observed in the three core modules suggest both convergent and divergent regulatory strategies across Prunus mume 'Meiren' tissues.
Both M14 and M68 are enriched in DNA replication and repair pathways, which are fundamental to cell proliferation and genome stability. The concurrent enrichment in protein synthesis/processing (M14) and protein transport/localization (M68) suggests that these two modules capture different stages of cellular maintenance.
Although these modules are less active in the fruit flesh than in the leaves and peel, they collectively highlight their complementary yet distinct regulatory roles in maintaining tissue function.This observation may reflect tissue-specific downregulation of cell-cycle and protein-turnover processes in fruit flesh during its developmental stage.
Unlike M14 and M68, Module M71 highlights secondary metabolism, specifically phenylalanine biosynthesis. This pathway serves as the metabolic entry point for anthocyanin biosynthesis, a class of pigments responsible for purple and red coloration.
The enrichment of this pathway aligns with the distinct pigmentation phenotype of Prunus mume 'Meiren', in which anthocyanins are distributed throughout the vegetative and reproductive tissues.
The finding that this pathway shows reduced expression in fruit flesh relative to leaf and peel suggests the possible spatial regulation of anthocyanin accumulation, with peel and leaf being the predominant pigment-producing tissues. This agrees with the common biological observation that fruit peel, rather than flesh, contributes more strongly to the intensity of pigmentation in many species.
Together, these modules reflect an interplay between primary processes (DNA/protein metabolism) and secondary metabolism (phenylpropanoid pathway).
The simultaneous detection of DNA maintenance pathways and phenylalanine metabolism may indicate that clustering does not only capture the similarity of expression but also functionally meaningful co-regulation. For example, plant cells undergoing stress or differentiation may coordinately downregulate DNA/protein biosynthesis while upregulating pathways that are critical for phenotypic traits such as pigmentation.
In summary, application of the proposed trivariate functional clustering to Prunus mume transcriptome data successfully identified 72 expression clusters, among which the core modules demonstrated clear functional relevance to tissue differentiation and pigmentation. The integration of clustering with network-based module selection and enrichment analysis underscores the utility of the method in uncovering biologically meaningful regulatory pathways in complex plants.
-
Wu's FunClu is a powerful statistical algorithm for clustering high-dimensional dynamic data on the basis of their underlying trajectories rather than static data points. In this study, we proposed an improved framework of Wu's FunClu that integrates an allometric scaling-based mean structure, a novel covariance modeling strategy, and a hybrid EM optimization procedure. This differs from conventional functional clustering approaches that rely on periodic Fourier basis functions, which restrict analyses to time-series data. The improved FunClu's incorporation of allometric scaling extends its applicability to static gene expression profiles. Moreover, the improved numerical optimization strategy significantly accelerates the convergence speed compared with conventional algorithms. Through extensive simulations, the improved version of Wu's FunClu demonstrates superior accuracy and robustness compared with classical clustering benchmarks, including Kmeans and GMM. Importantly, the use of softmax-based smoothing effectively prevented class collapse, securing robust performance in high-dimensional biological contexts.
Application to real transcriptomic data from Prunus mume revealed biologically meaningful modules across leaf, fruit peel, and fruit flesh tissues[34]. Notably, our model identified core gene clusters enriched in fundamental processes such as DNA replication, repair, and protein metabolism, as well as tissue-specific pathways like phenylalanine biosynthesis, which is directly linked to anthocyanin production and the purple phenotype of ornamental cultivars. These findings highlight both the statistical reliability and the biological interpretability of our approach.
Although the proposed framework is built upon an allometric assumption, we note that such a relationship is empirically observed in the majority of omics datasets encountered in our applications. This reflects a common part–whole scaling behavior arising from coordinated biological regulation. Nevertheless, the method is intended for use in conjunction with an initial diagnostic assessment, and its application to data with pronounced nonstationarity or abrupt structural changes warrants further methodological extensions.
Overall, the proposed method provides a versatile statistical tool for clustering high-dimensional omics data, offering both methodological innovation and practical utility in functional genomics and beyond.
The authors are thankful for the Editorial Office for their help in the submission and review process, and the two reviewers for their thoughtful and constructive comments.
-
The authors confirm their contribution to the paper as follows. study conception and design: Pan W, Wu S; data collection: Pan W; analysis and interpretation of results: Pan W; manuscript preparation: Pan W, Che J, Wu S. All authors reviewed the results and approved the final version of the manuscript.
-
The datasets generated during and/or analyzed in the current study are available from the corresponding author upon reasonable request.
-
The authors declare that they have no conflict of interest.
- Copyright: © 2026 by the author(s). Published by Maximum Academic Press, Fayetteville, GA. This article is an open access article distributed under Creative Commons Attribution License (CC BY 4.0), visit https://creativecommons.org/licenses/by/4.0/.
-
About this article
Cite this article
Pan W, Che J, Wu S. 2026. An improved method of Wu's functional clustering. Statistics Innovation 3: e005 doi: 10.48130/stati-0026-0006 

An improved method of Wu's functional clustering
- Received: 07 December 2025
- Revised: 28 January 2026
- Accepted: 03 March 2026
- Published online: 30 April 2026
Abstract: Functional clustering is a statistical framework designed to classify high-dimensional dynamic data on the basis of their underlying trajectories rather than static data points. Although this approach has been widely applied to omics and single-cell research, it is frequently challenged by data heterogeneity. To generalize its applications, we propose an improved framework of functional clustering by integrating (i) an allometric scaling-based mean-feature structure to characterize heteroscedasticity; (ii) a structured covariance model tailored to complex biological signal patterns; and (iii) a hybrid Expetation-Maximization (EM) algorithm incorporating softmax-based adaptive smoothing to effectively mitigate cluster collapse. Through extensive simulation studies, we demonstrate that the proposed method outperforms existing approaches in terms of clustering accuracy, stability, and robustness, particularly under complex covariance structures or high dimensionality. We use the new approach to analyze transcriptome data of Prunus mume 'Meiren', identifying 72 biologically meaningful gene modules related to DNA replication and repair, protein metabolism, and tissue-specific pathways, such as phenylalanine biosynthesis underlying anthocyanin production and the purple ornamental phenotype of this cultivar. The improved framework leverages functional clustering to strengthen optimization stability, biological interpretability, robustness, and flexibility for pattern discovery in high-dimensional data.
-
Key words:
- Clustering /
- Allometric scaling law /
- EM algorithm