-
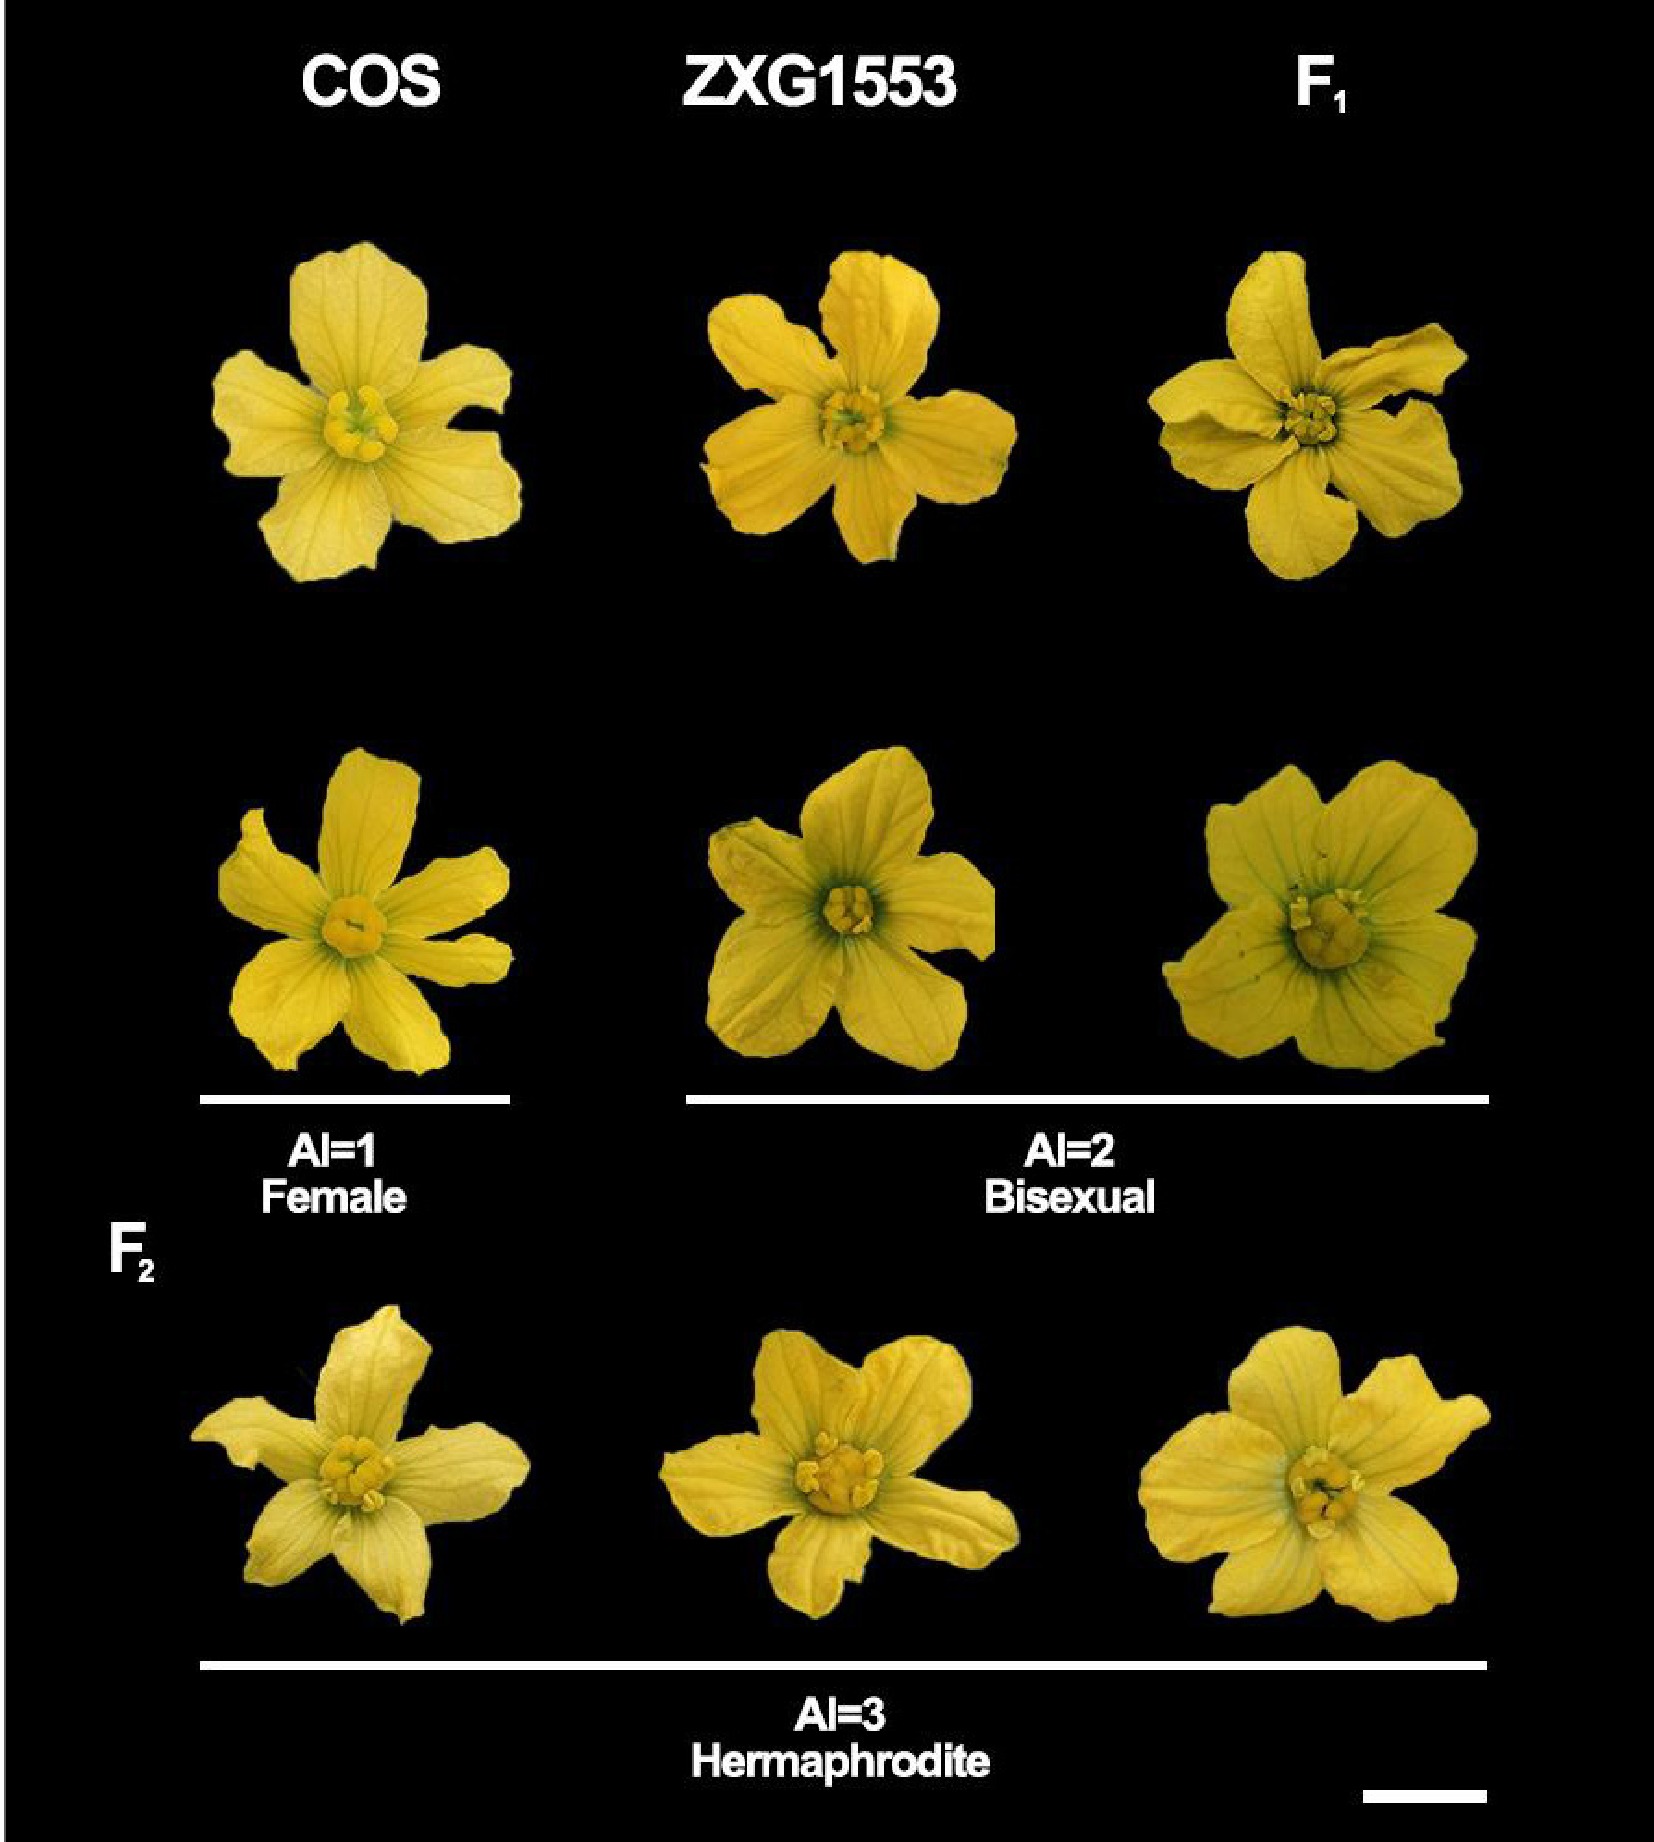
Figure 1.
Sexual differentiation phenotypic characteristics in the parental lines and F1 and F2 populations. AI, andromonoecious index. Bar = 1 cm.
-
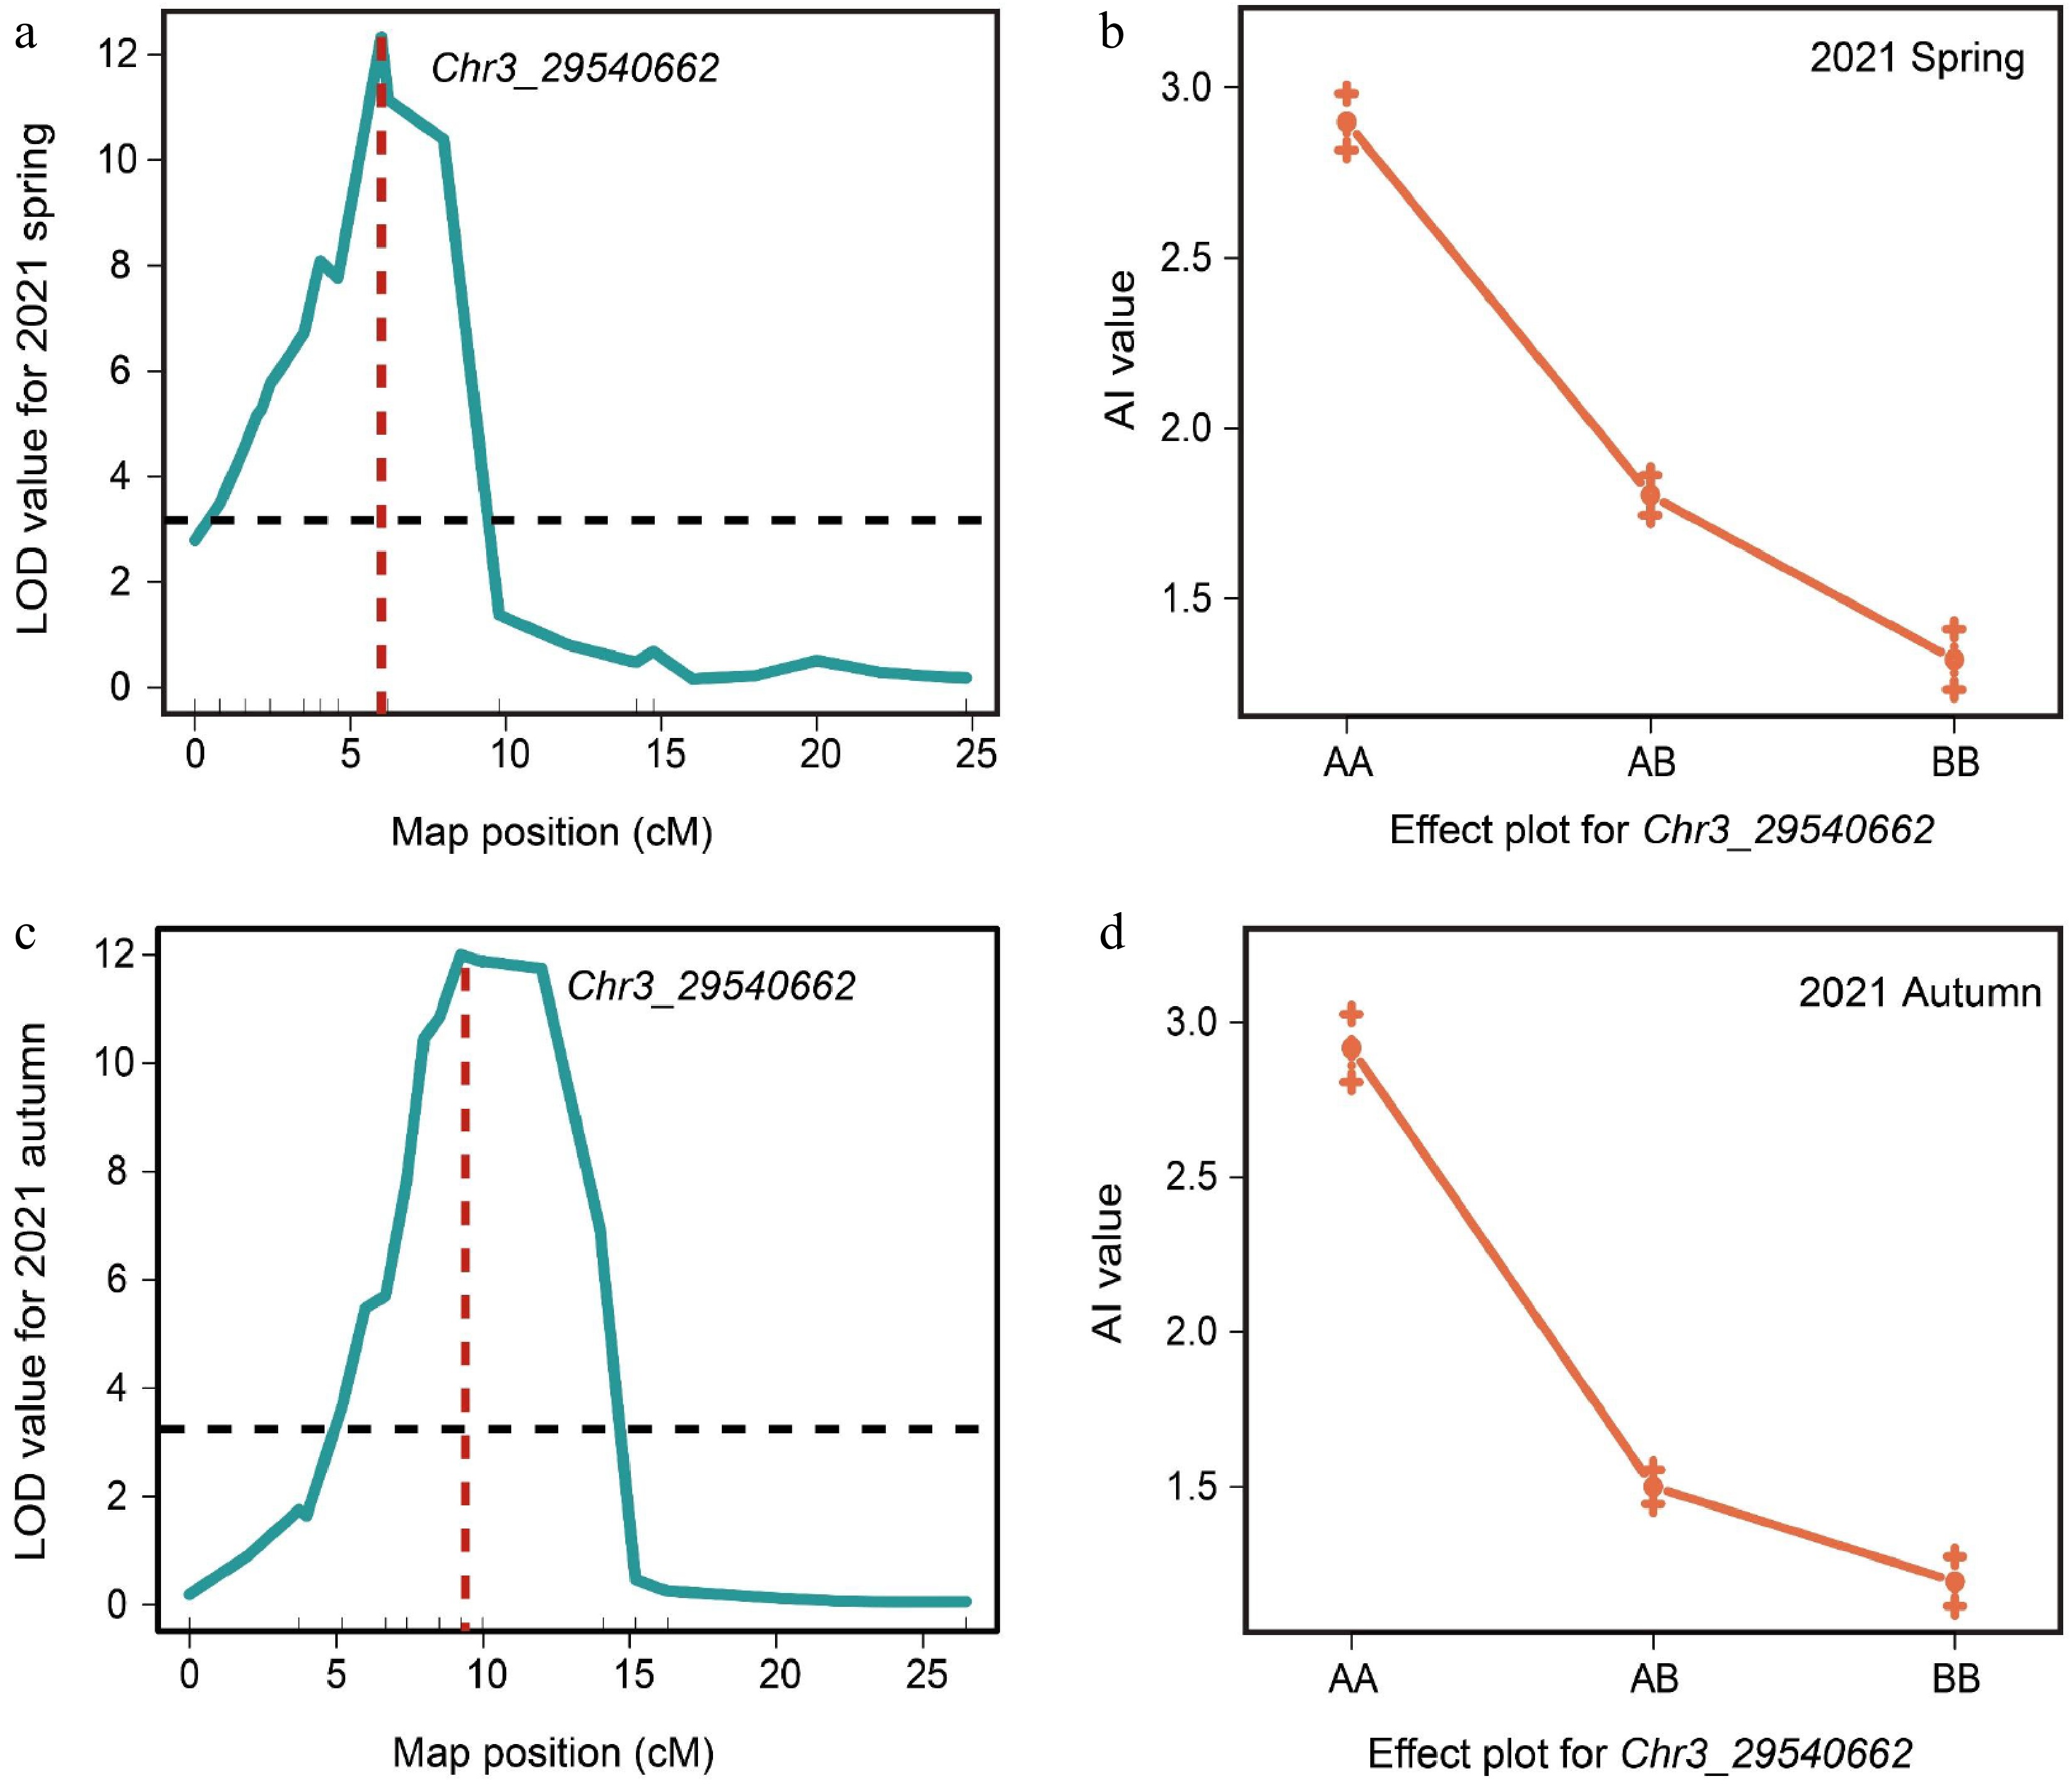
Figure 2.
QTL analysis of the a locus based on the initial mapping region. (a) QTL analysis of F2 population in spring 2021. (b) Correlations between phenotypes and genotypes based on the marker Chr3_29540662 in spring 2021. (c) QTL analysis of F2 population in autumn 2021. (d) Correlations between phenotypes and genotypes based on the marker Chr3_29540662 in autumn 2021.
-
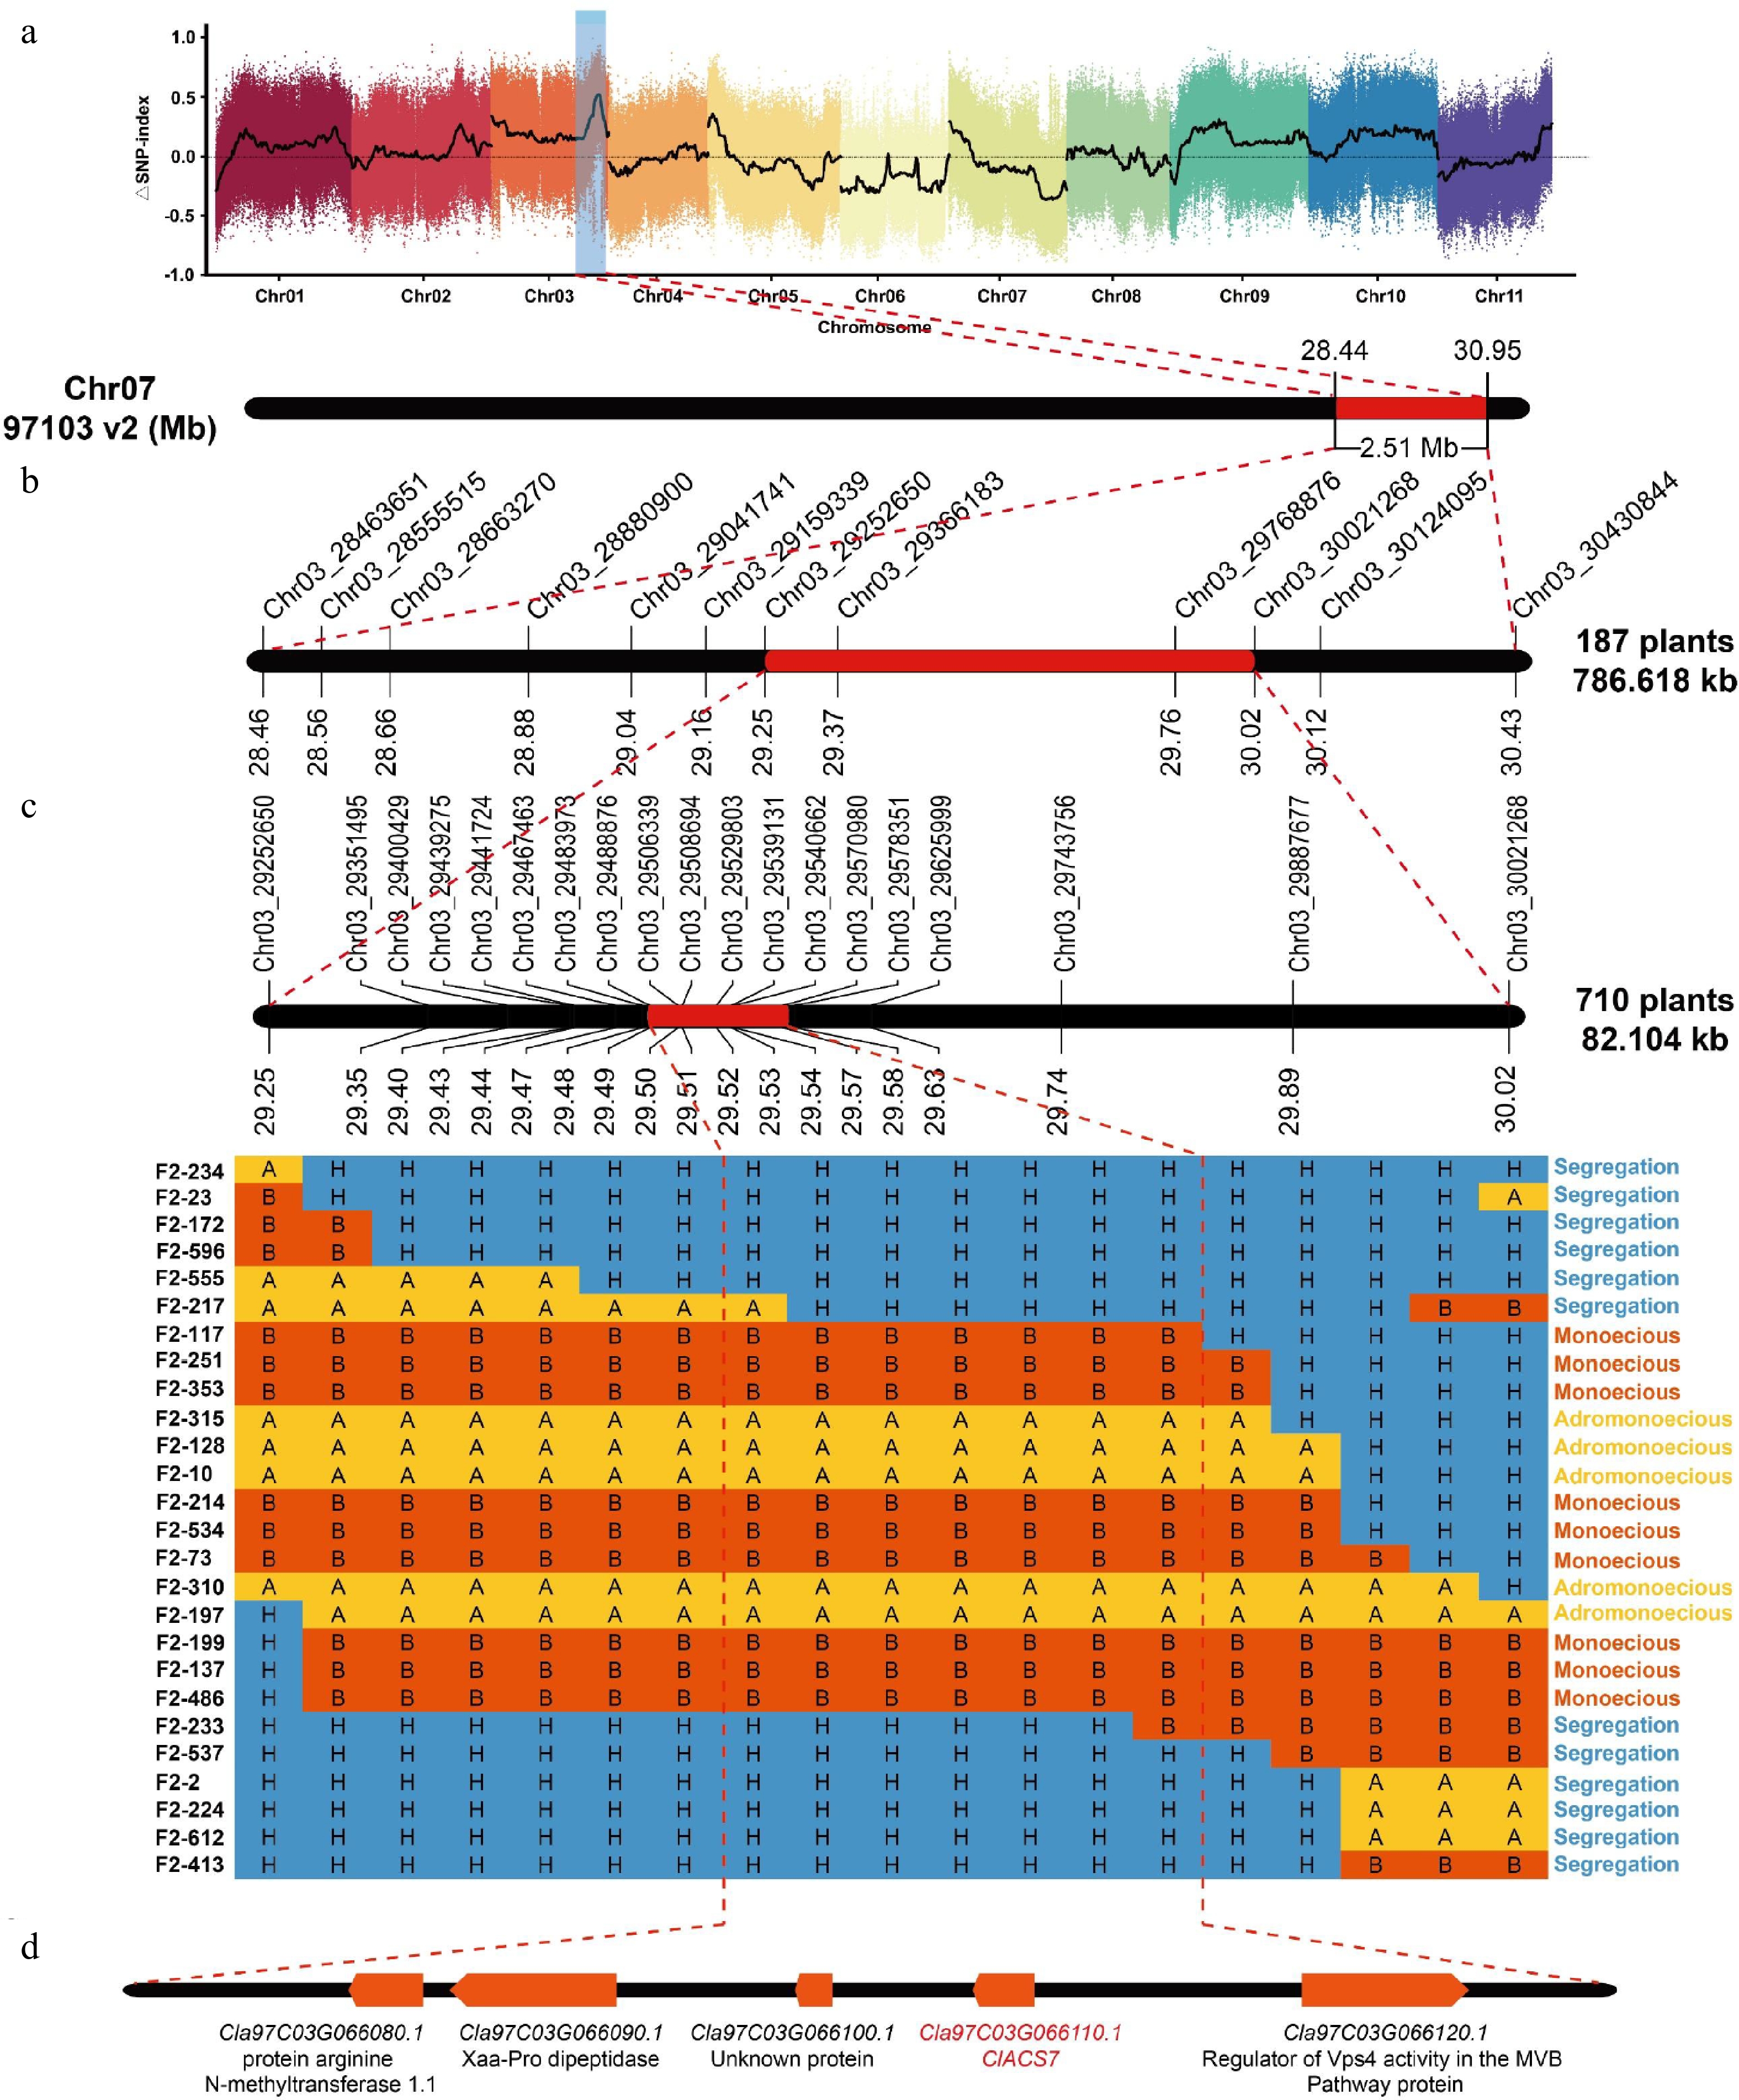
Figure 3.
Fine mapping of the a locus. (a) ΔSNP index plot from BSA-seq. (b) Initial mapping of the a locus to a 786.62-kb region[26]. (c) Fine mapping of the a locus to an 82.10-kb region with 26 recombinant plants. 'A' denotes the ZXG1555 genotype, 'B' represents the COS genotype, and 'H' signifies the heterozygous genotype. (d) The five candidate genes in the fine mapping region.
-
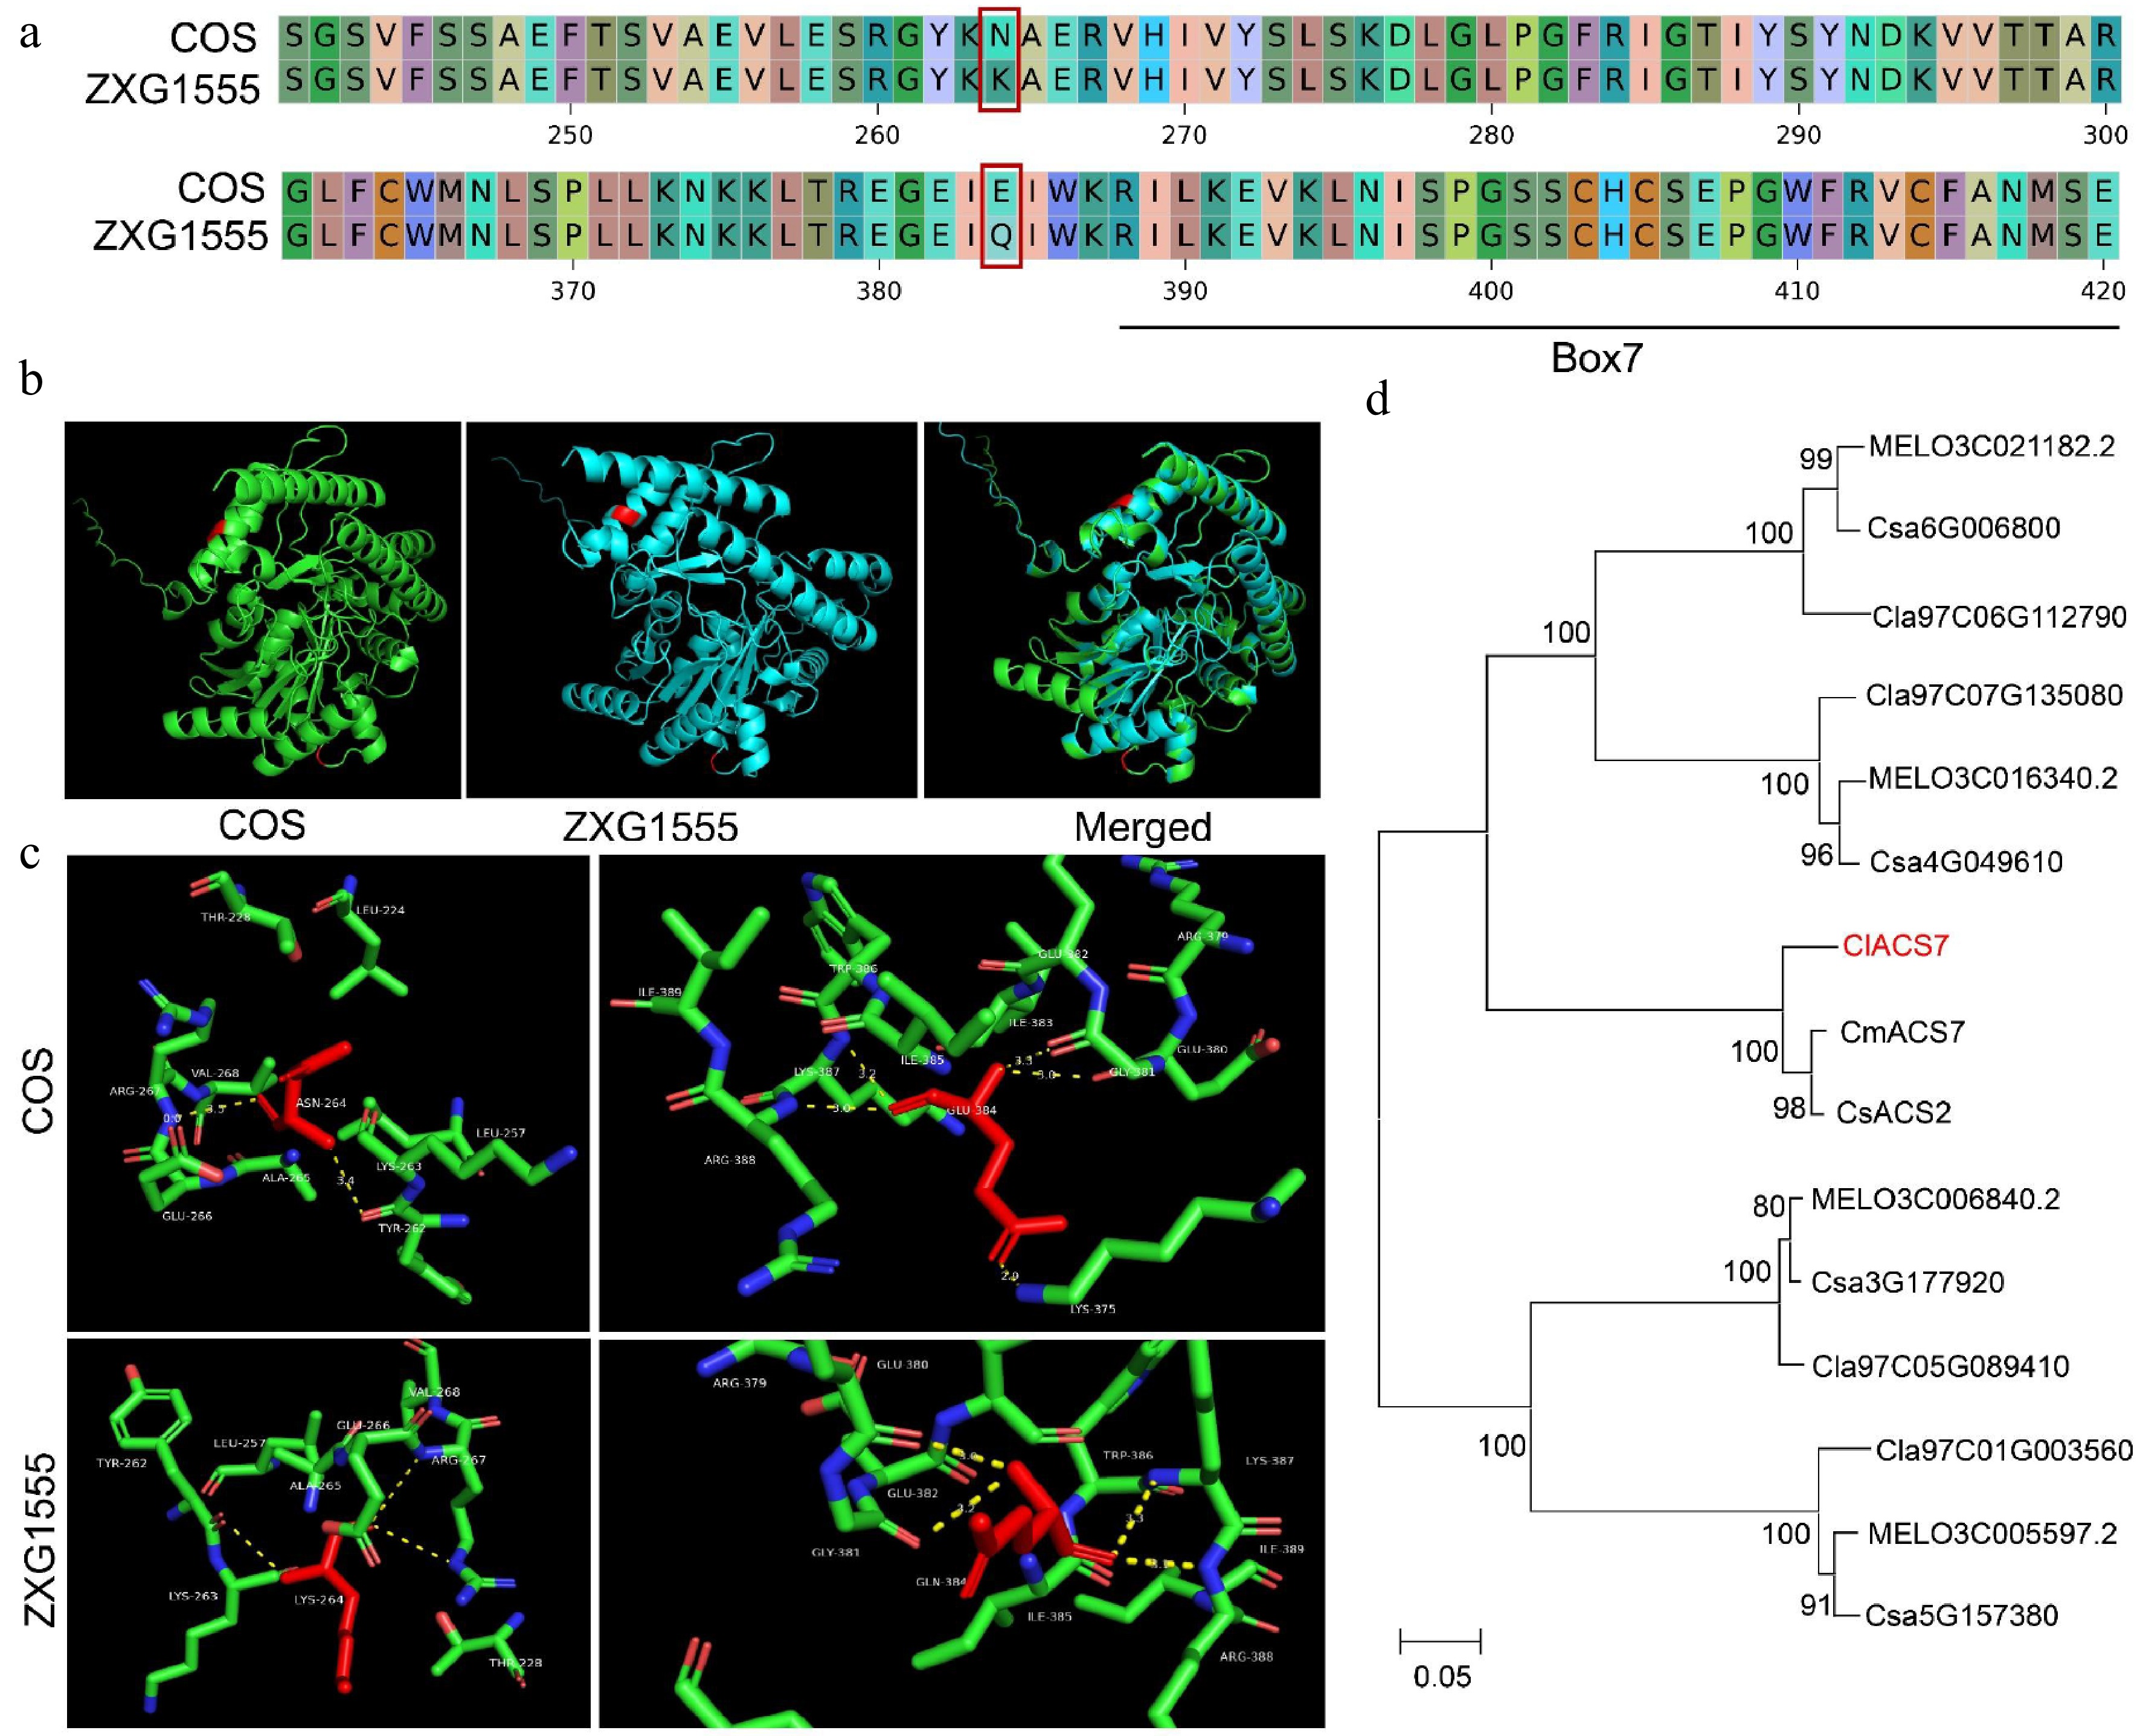
Figure 4.
Sequence analysis of ClACS7. (a) The amino acid alignment of ClACS7 in the two parental lines. The red box lines indicate the amino acid mutations caused by non-synonymous mutations. (b) Prediction and comparison of 3D protein structure of the ClACS7. Red color represents the locations where the two SNPs (SNP264 and SNP384) are located. (c) Hydrogen bond analysis of SNP264 and SNP384. The yellow dotted line represents the number of hydrogen bonds. (d) The phylogenetic tree of ClACS7 homologous genes. CmACS7: MELO3C015444.2, CsACS2: Csa1M580750.
-
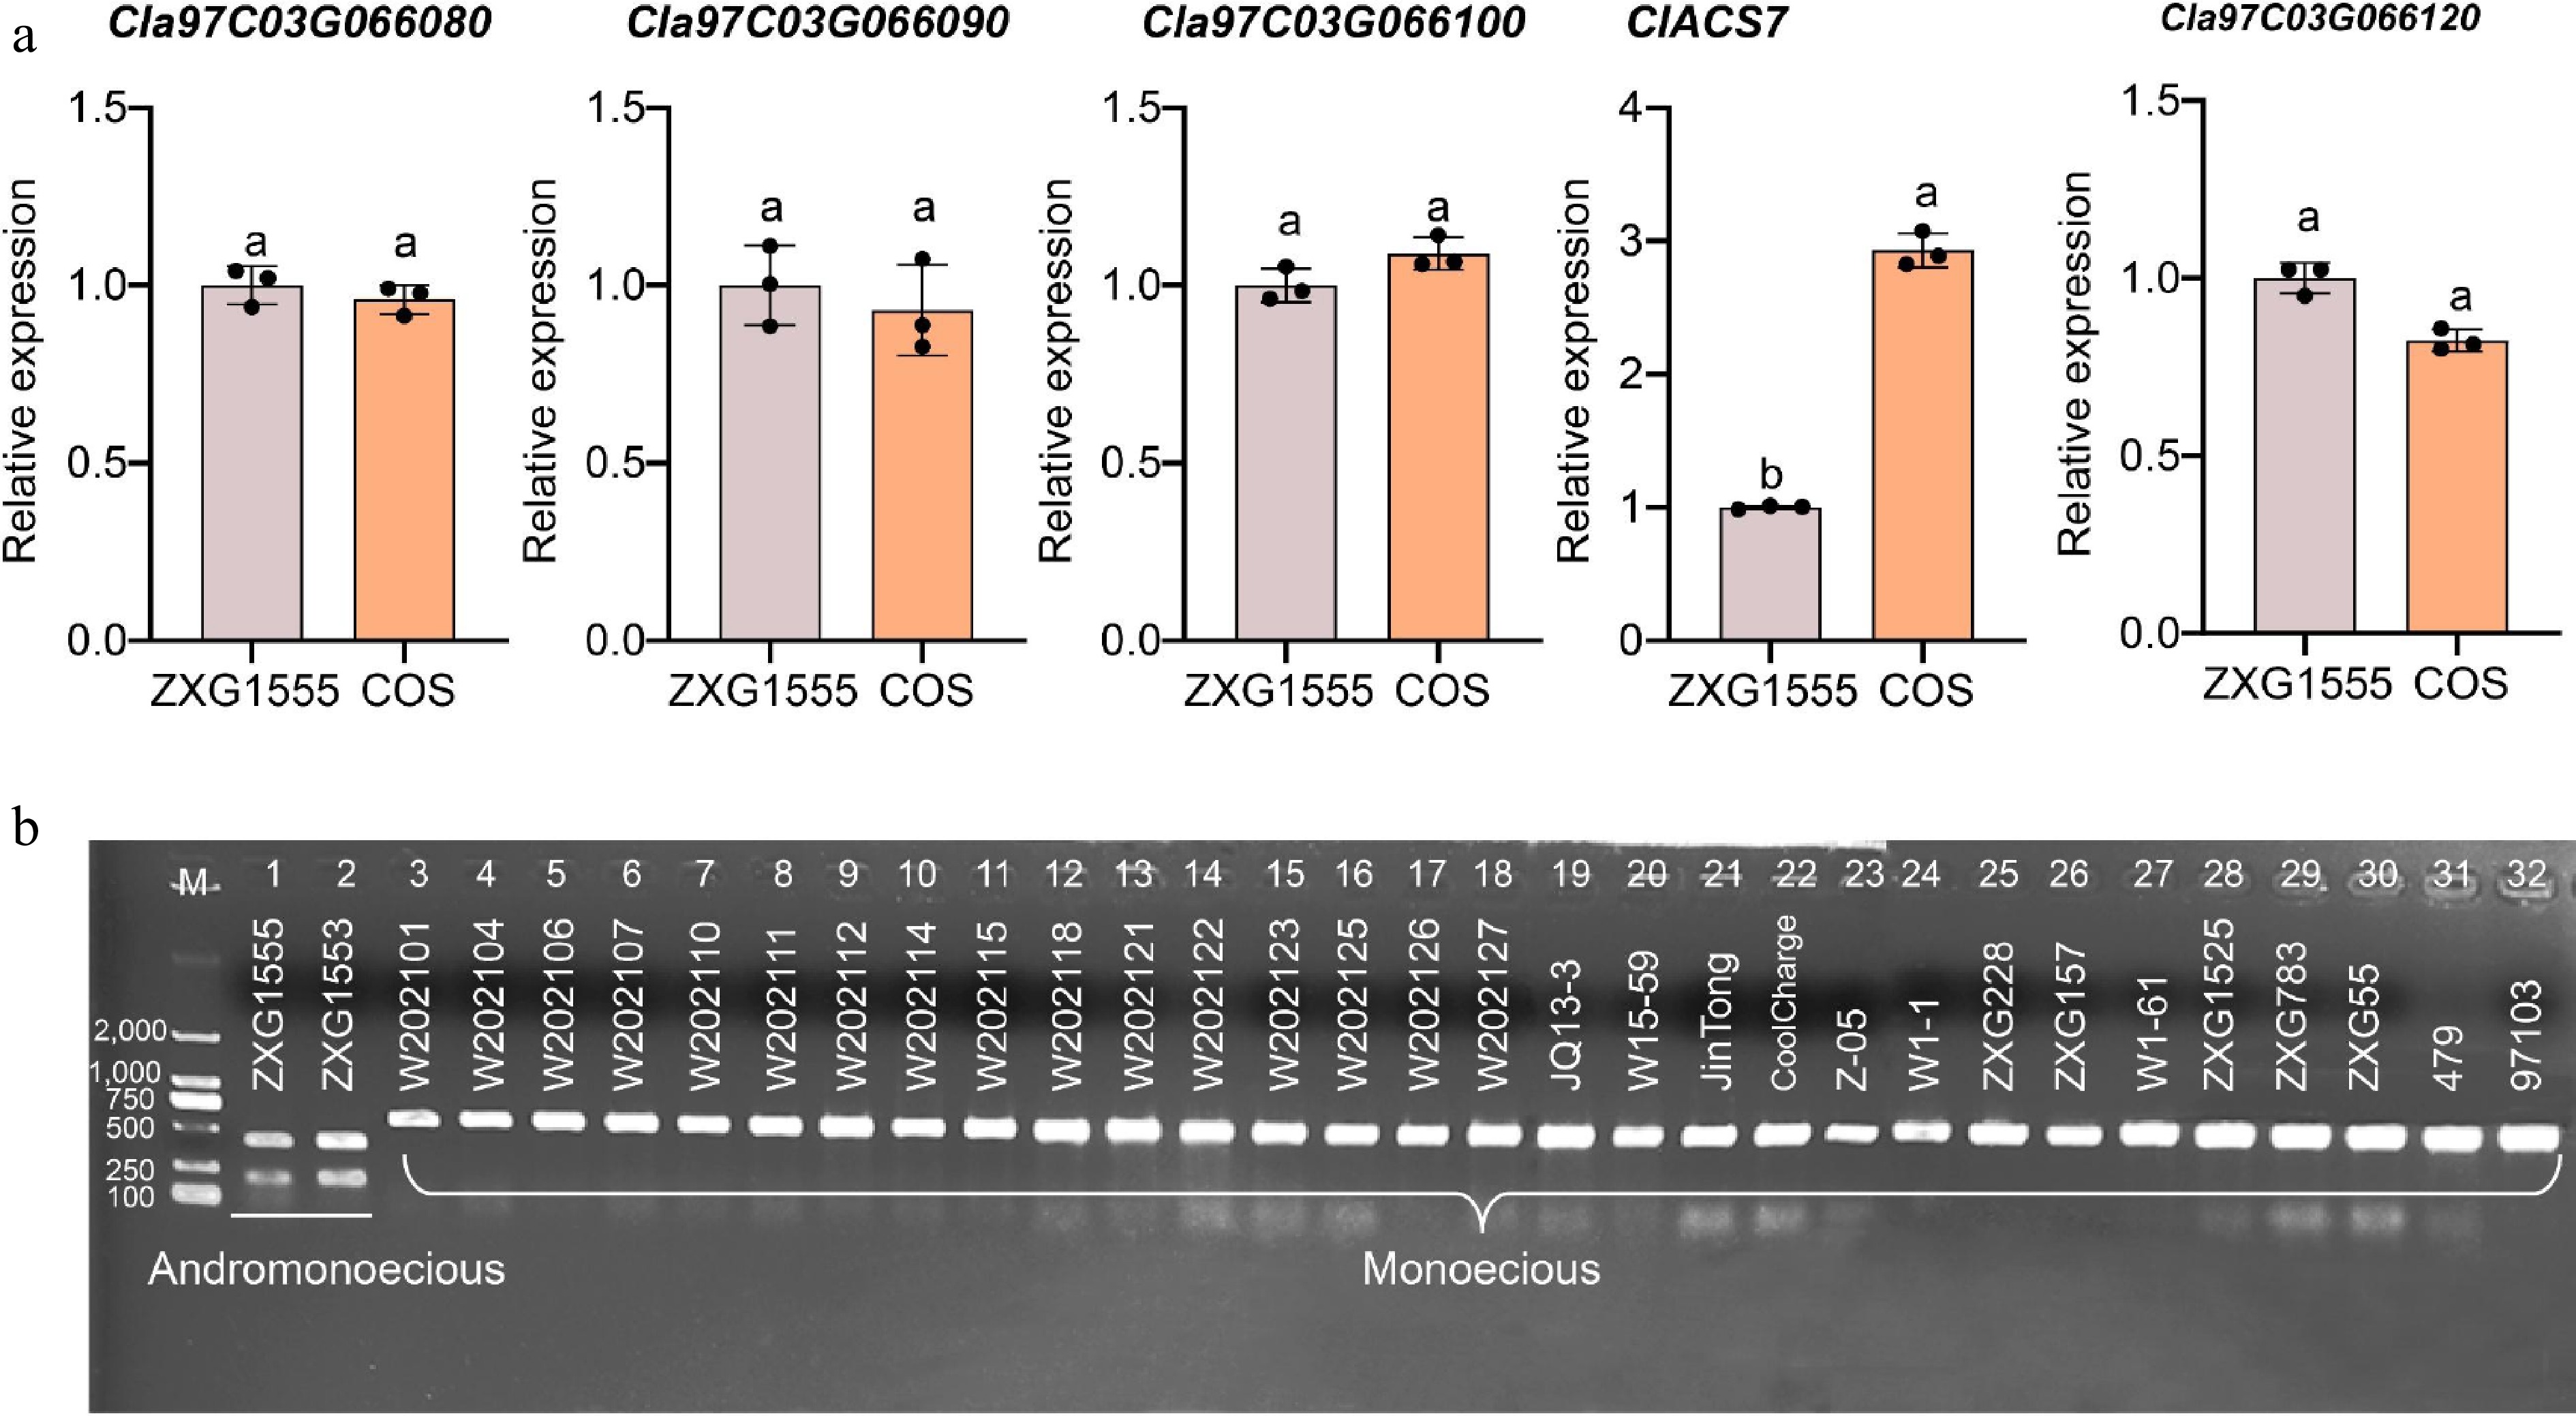
Figure 5.
Determination of the expression levels of five candidate genes and establishment of a molecular marker-assisted selection technology system for monoecious/andromonoecious flowers in watermelon. (a) The expression levels of five candidate genes analysis in the flower buds of the two parental lines. The different letters denote significance (p < 0.05), as determined by analysis of variance. (b) Validation of marker Chr3_29539131 in natural populations of watermelon. M, DL2000 marker. The numbers on the left indicate the size of the marker, bp.
-
Year Left marker Right marker LOD Phenotypic
variation (%)2021 Spring Chr03_29252650 Chr03_30021268 12.73 55.38 2021 Autumn Chr03_29252650 Chr03_30021268 11.98 46.18 Table 1.
QTL for monoecious/andromonoecious based on interval mapping in the F2 population from both spring and autumn in 2021.
Figures
(5)
Tables
(1)