-
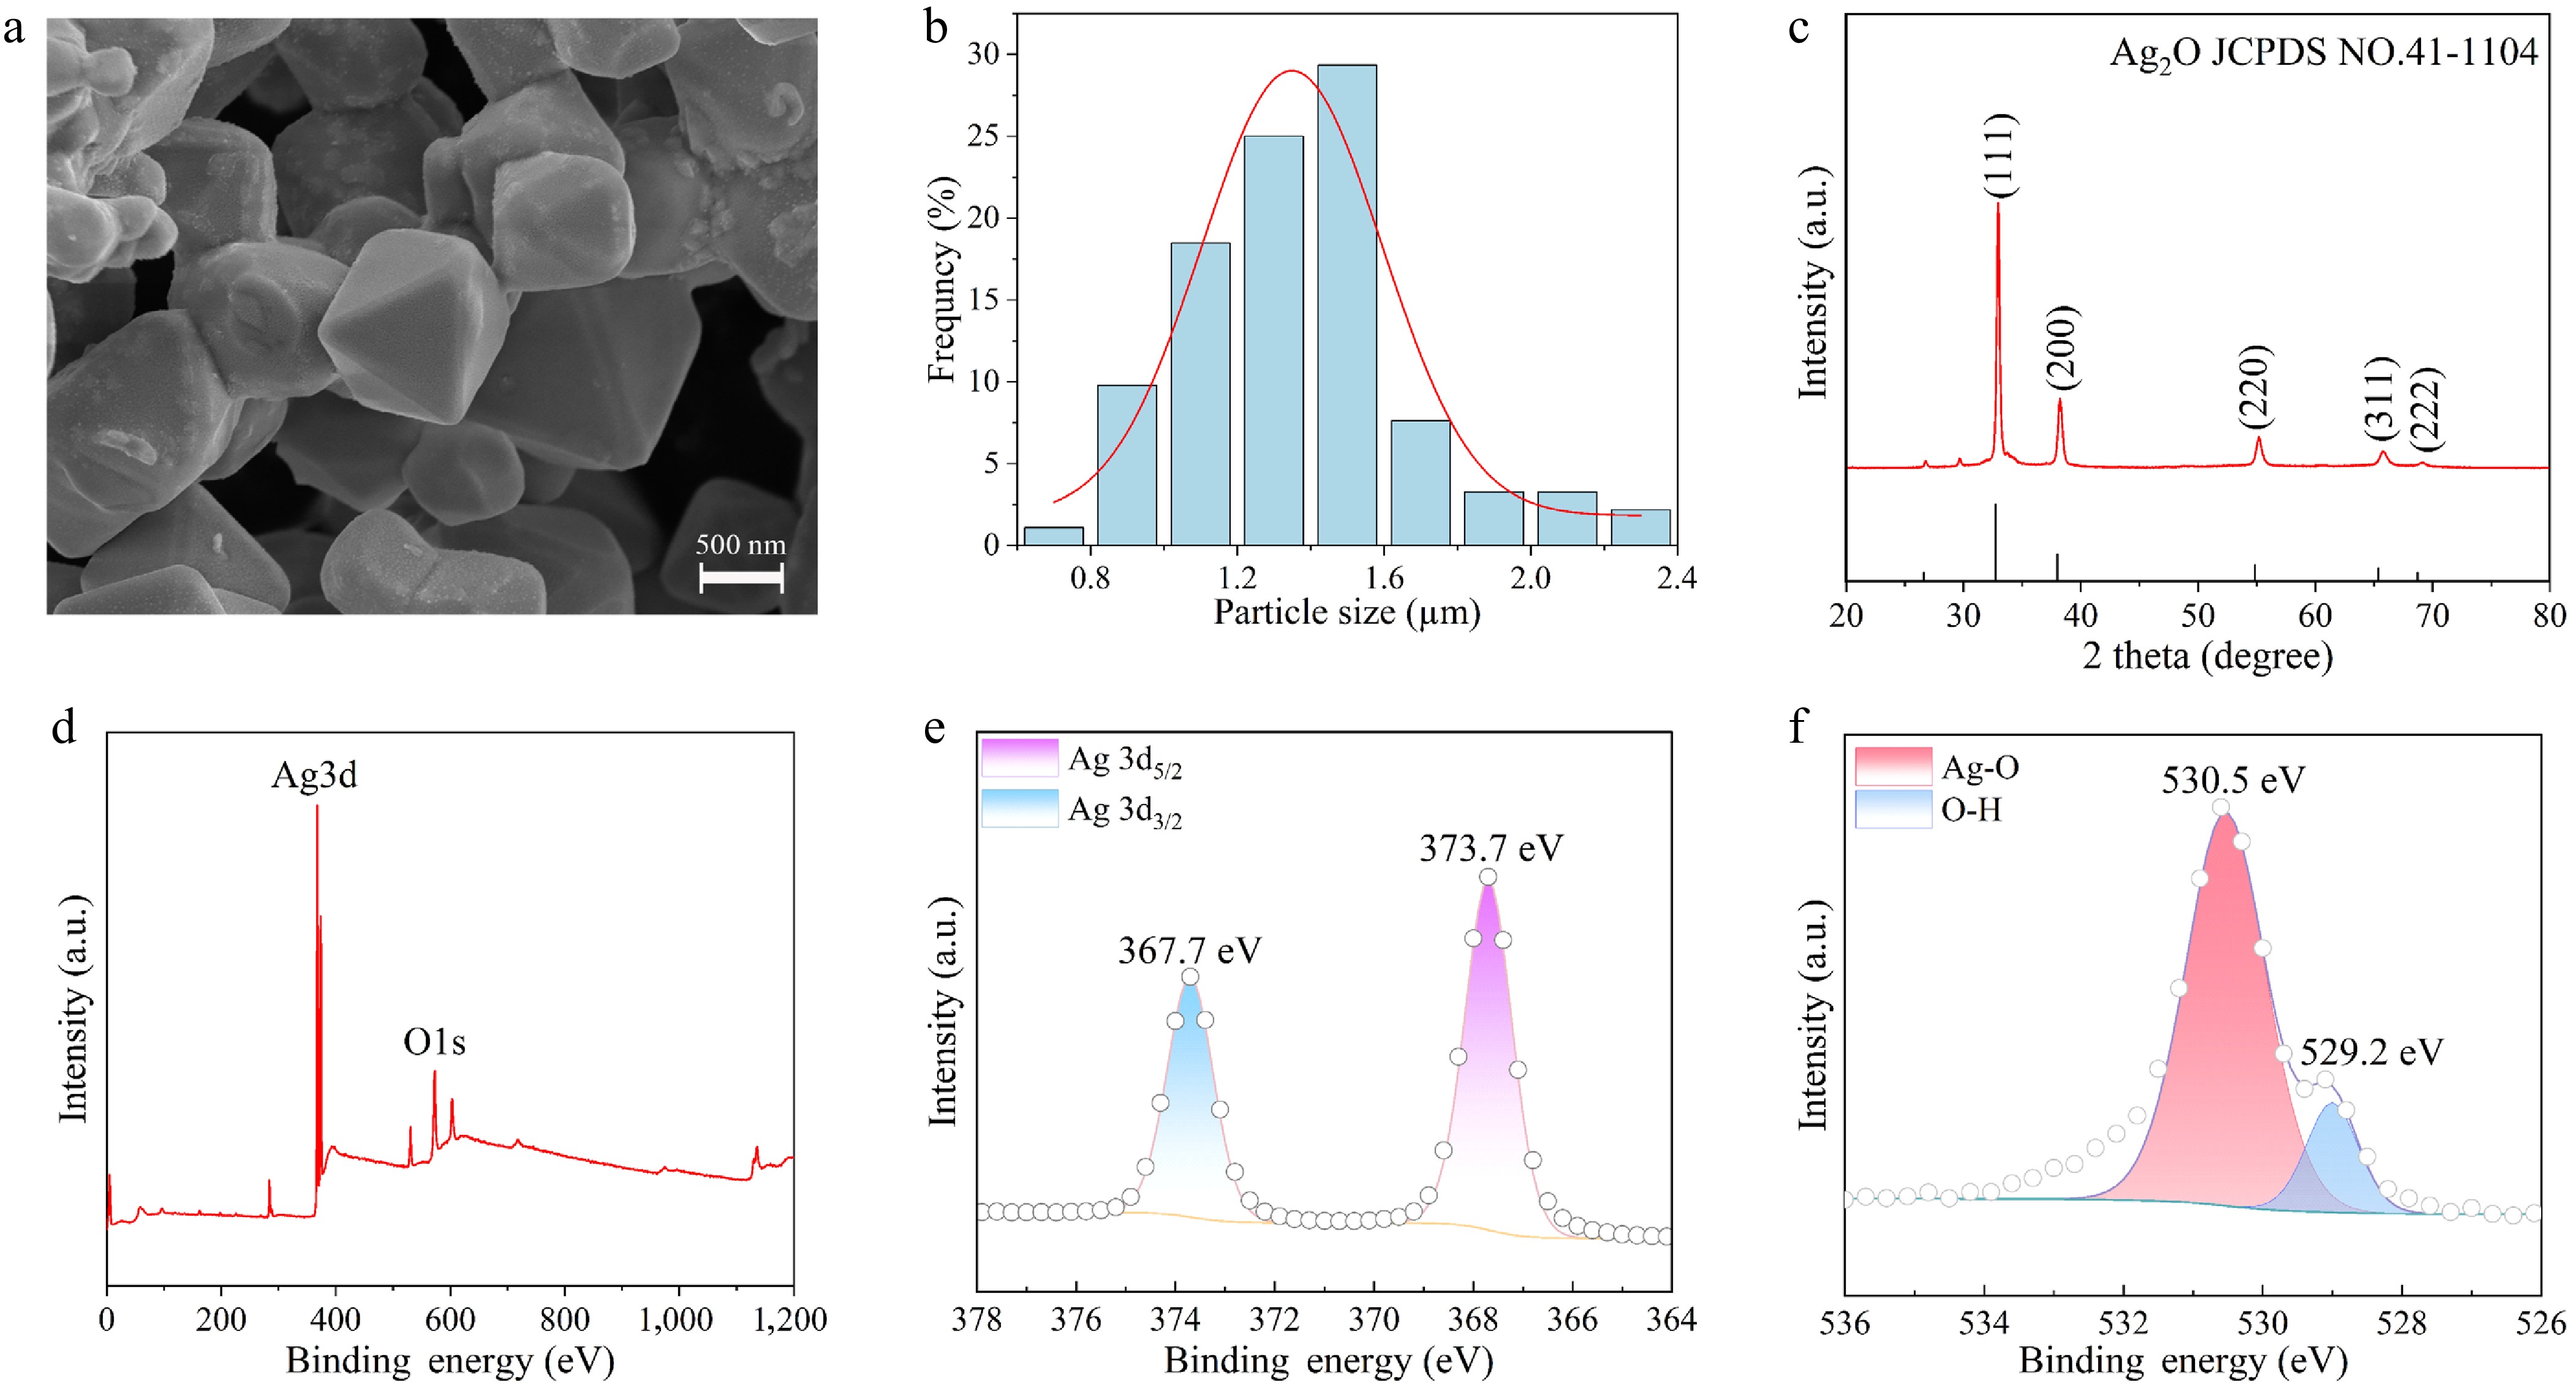
Figure 1.
(a) SEM of octahedral Ag2O NPs. (b) Size distribution characteristics of Ag2O NPs. (c) XRD patterns of Ag2O NPs. (d) XPS survey spectrum of Ag2O NPs. (e) High-resolution Ag3d XPS data of Ag2O NPs. (f) High-resolution O1s XPS data of Ag2O NPs.
-
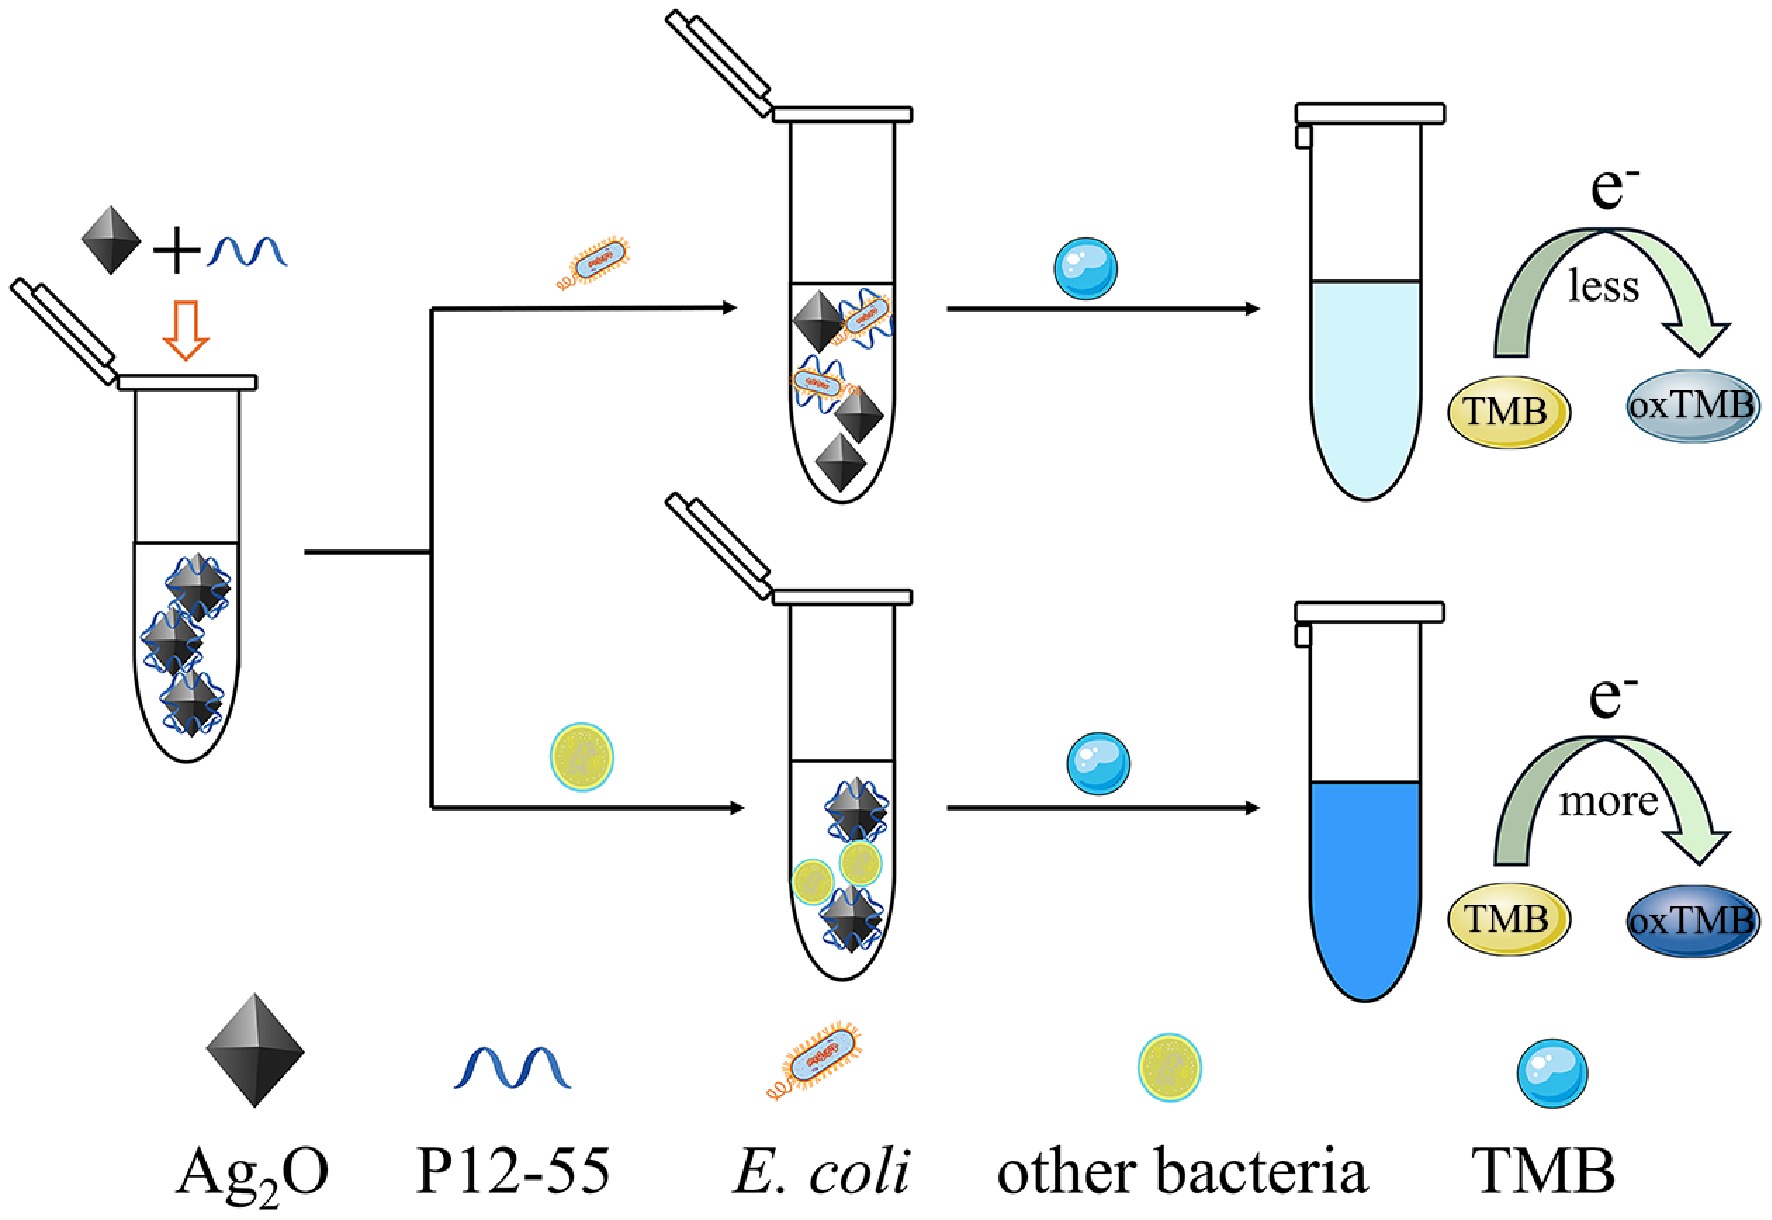
Figure 1.
Schematic representation of the biosensor for the colorimetric detection of E. coli.
-
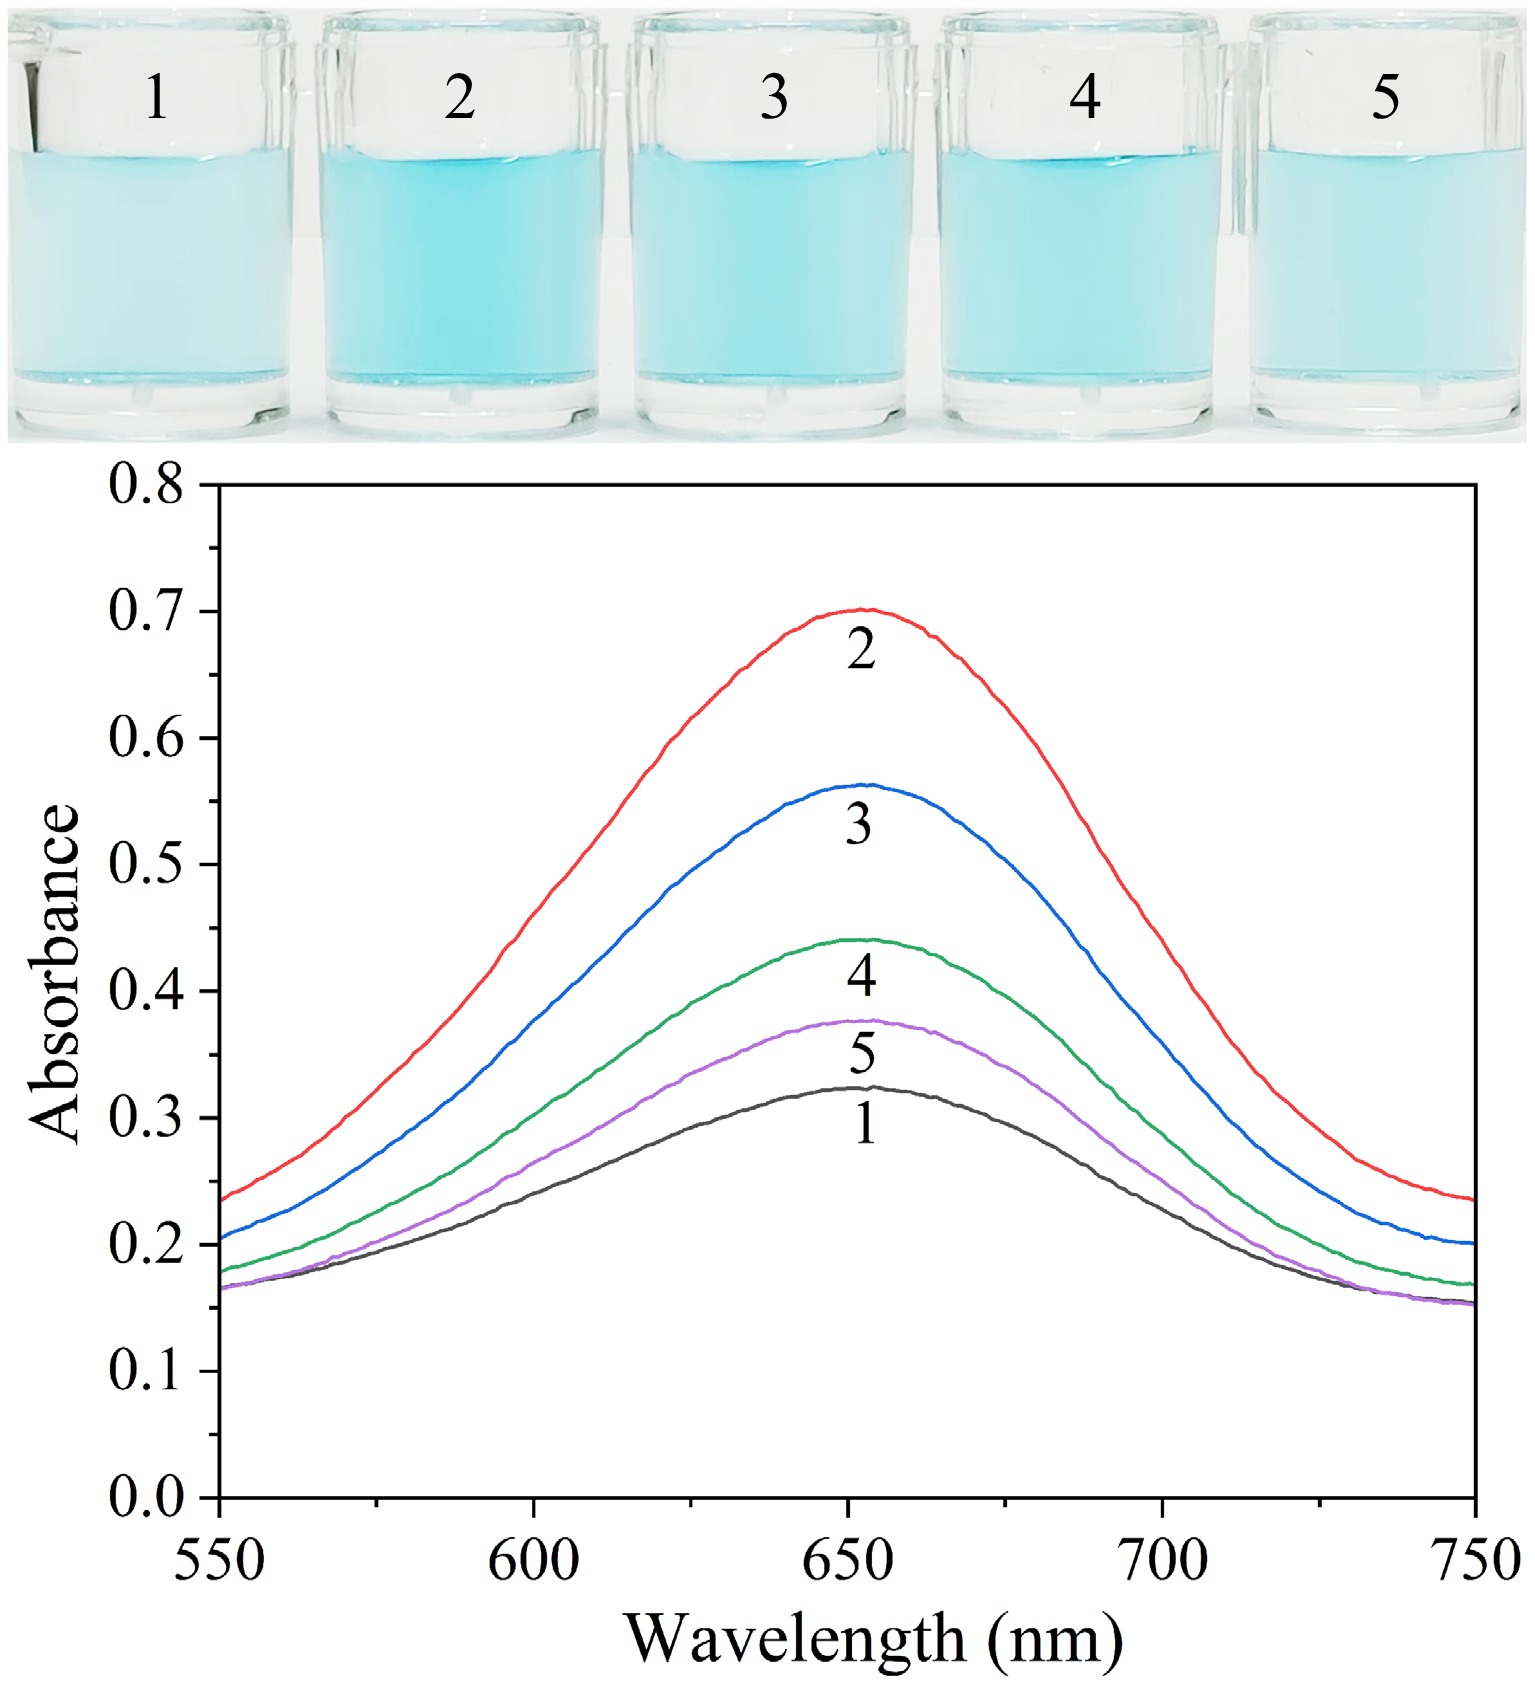
Figure 2.
Visual images and absorption spectra of solutions including different compounds. Sample 1: Octahedral Ag2O NPs + TMB; Sample 2: Sample 1 + P12-55 aptamer; Sample 3: Sample 2 + 3 × 10² CFU·mL−1 E. coli; Sample 4: Sample 2 + 3 × 10⁴ CFU·mL−1 E. coli; Sample 5: Sample 2 + 3 × 10⁵ CFU· mL−1 E. coli.
-
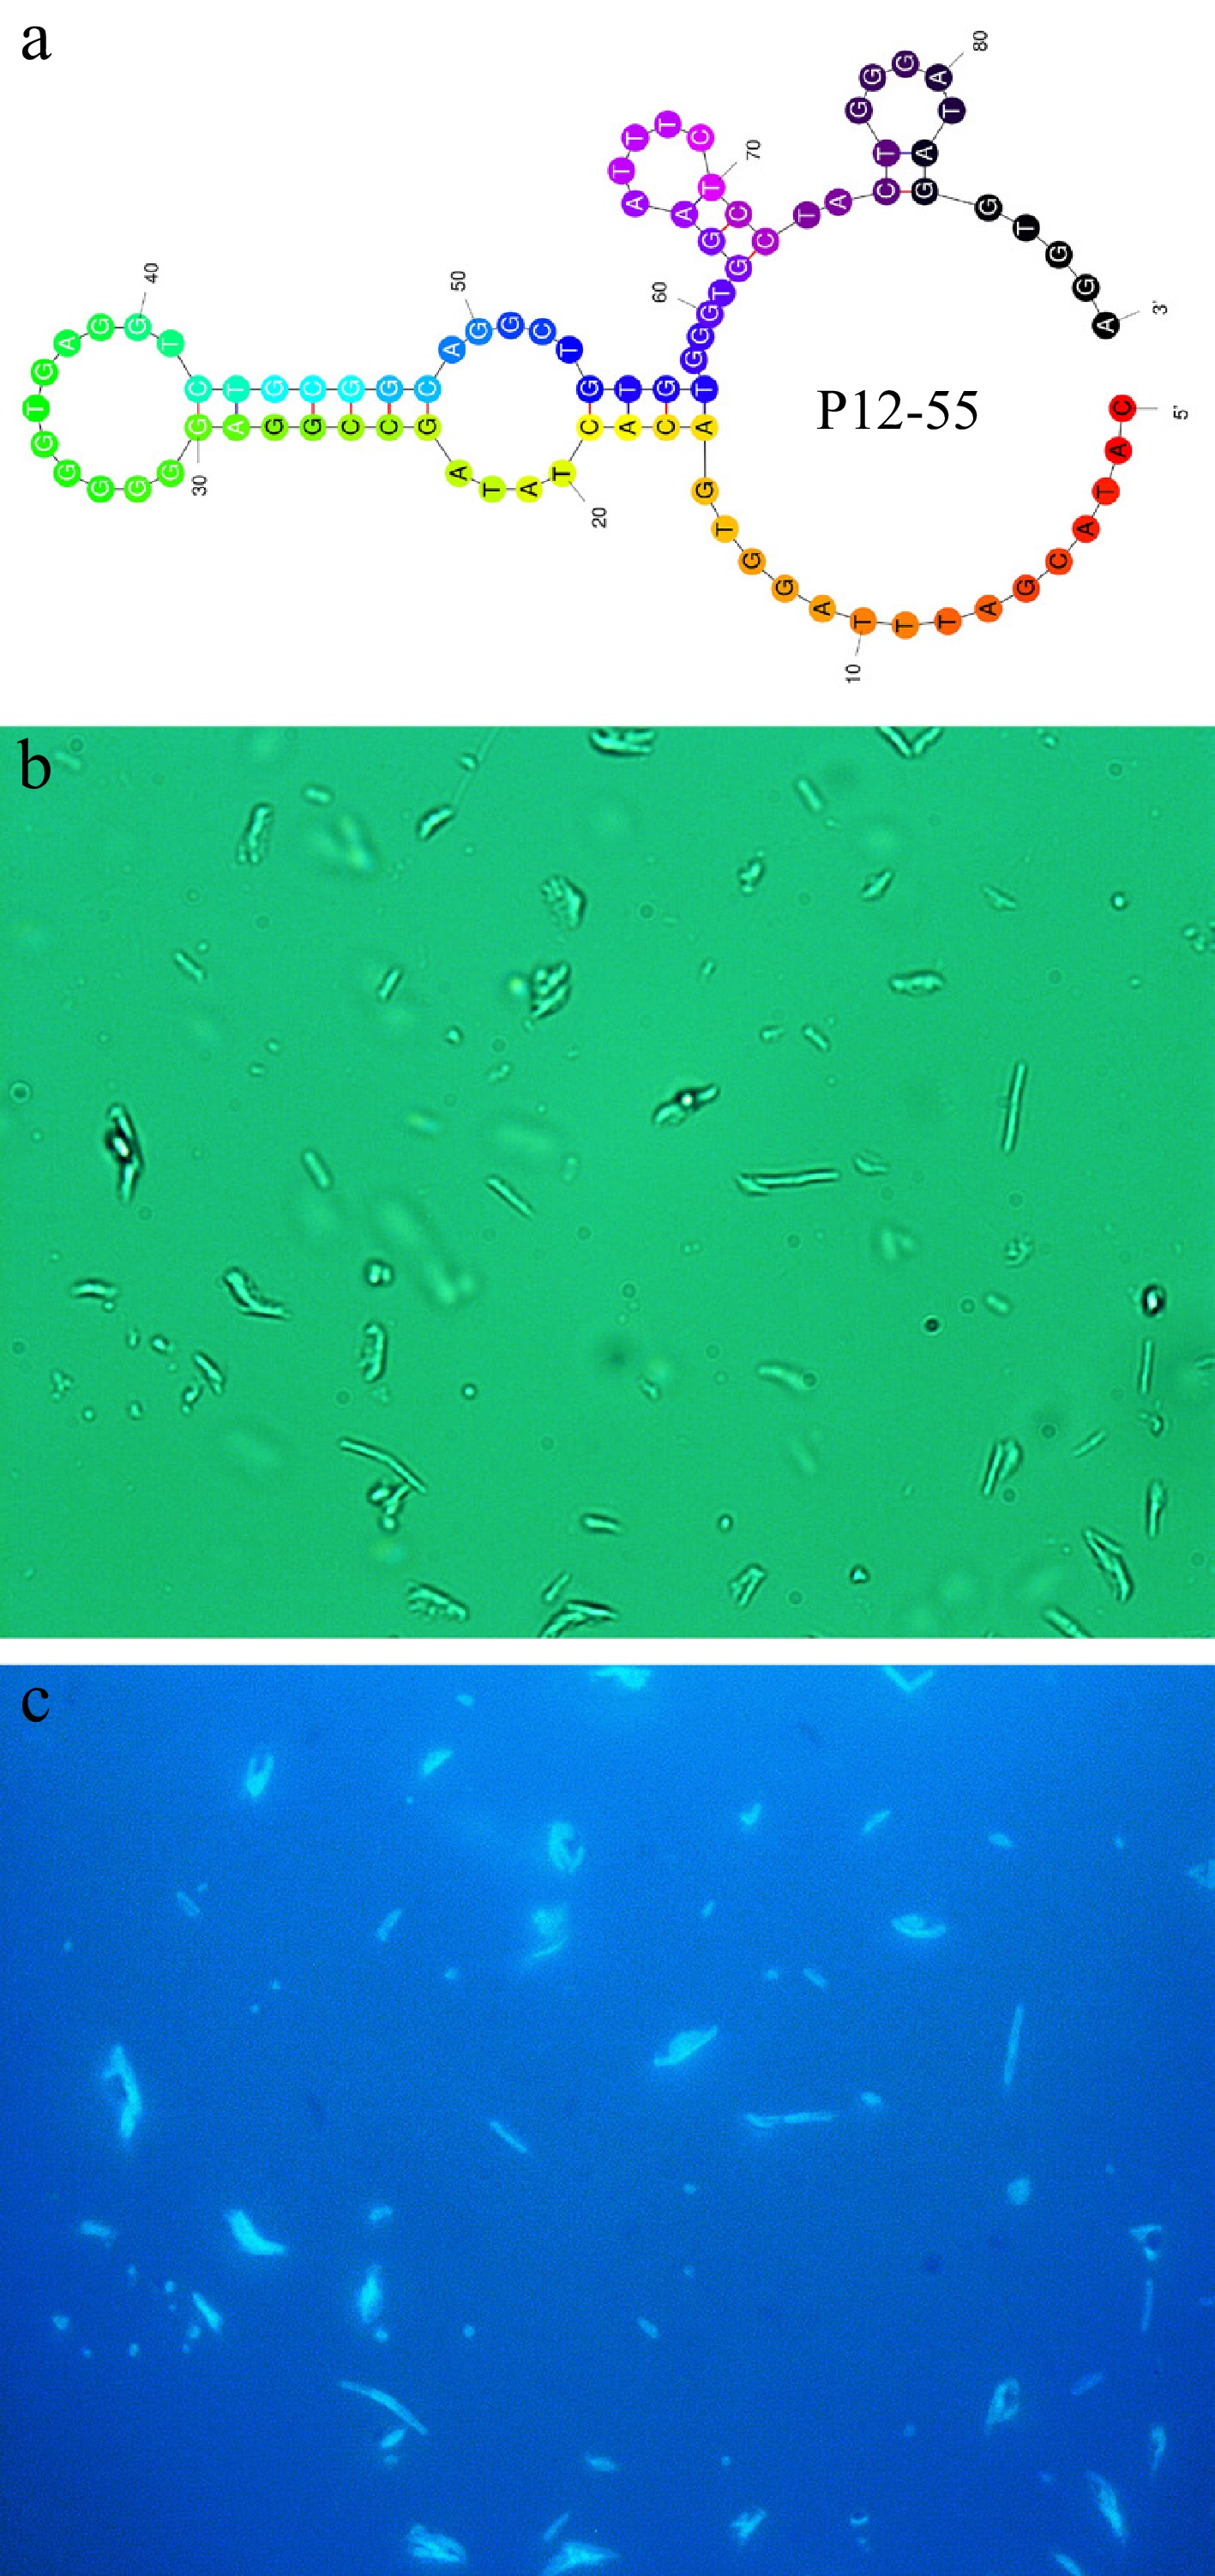
Figure 3.
(a) Secondary structure with the least energy of the P12-55 aptamer. (b) Natural light image of E. coli treated with FAM-labeled P12-55 aptamer. (c) Fluorescent image of E. coli treated with FAM-labeled P12-55 aptamer.
-
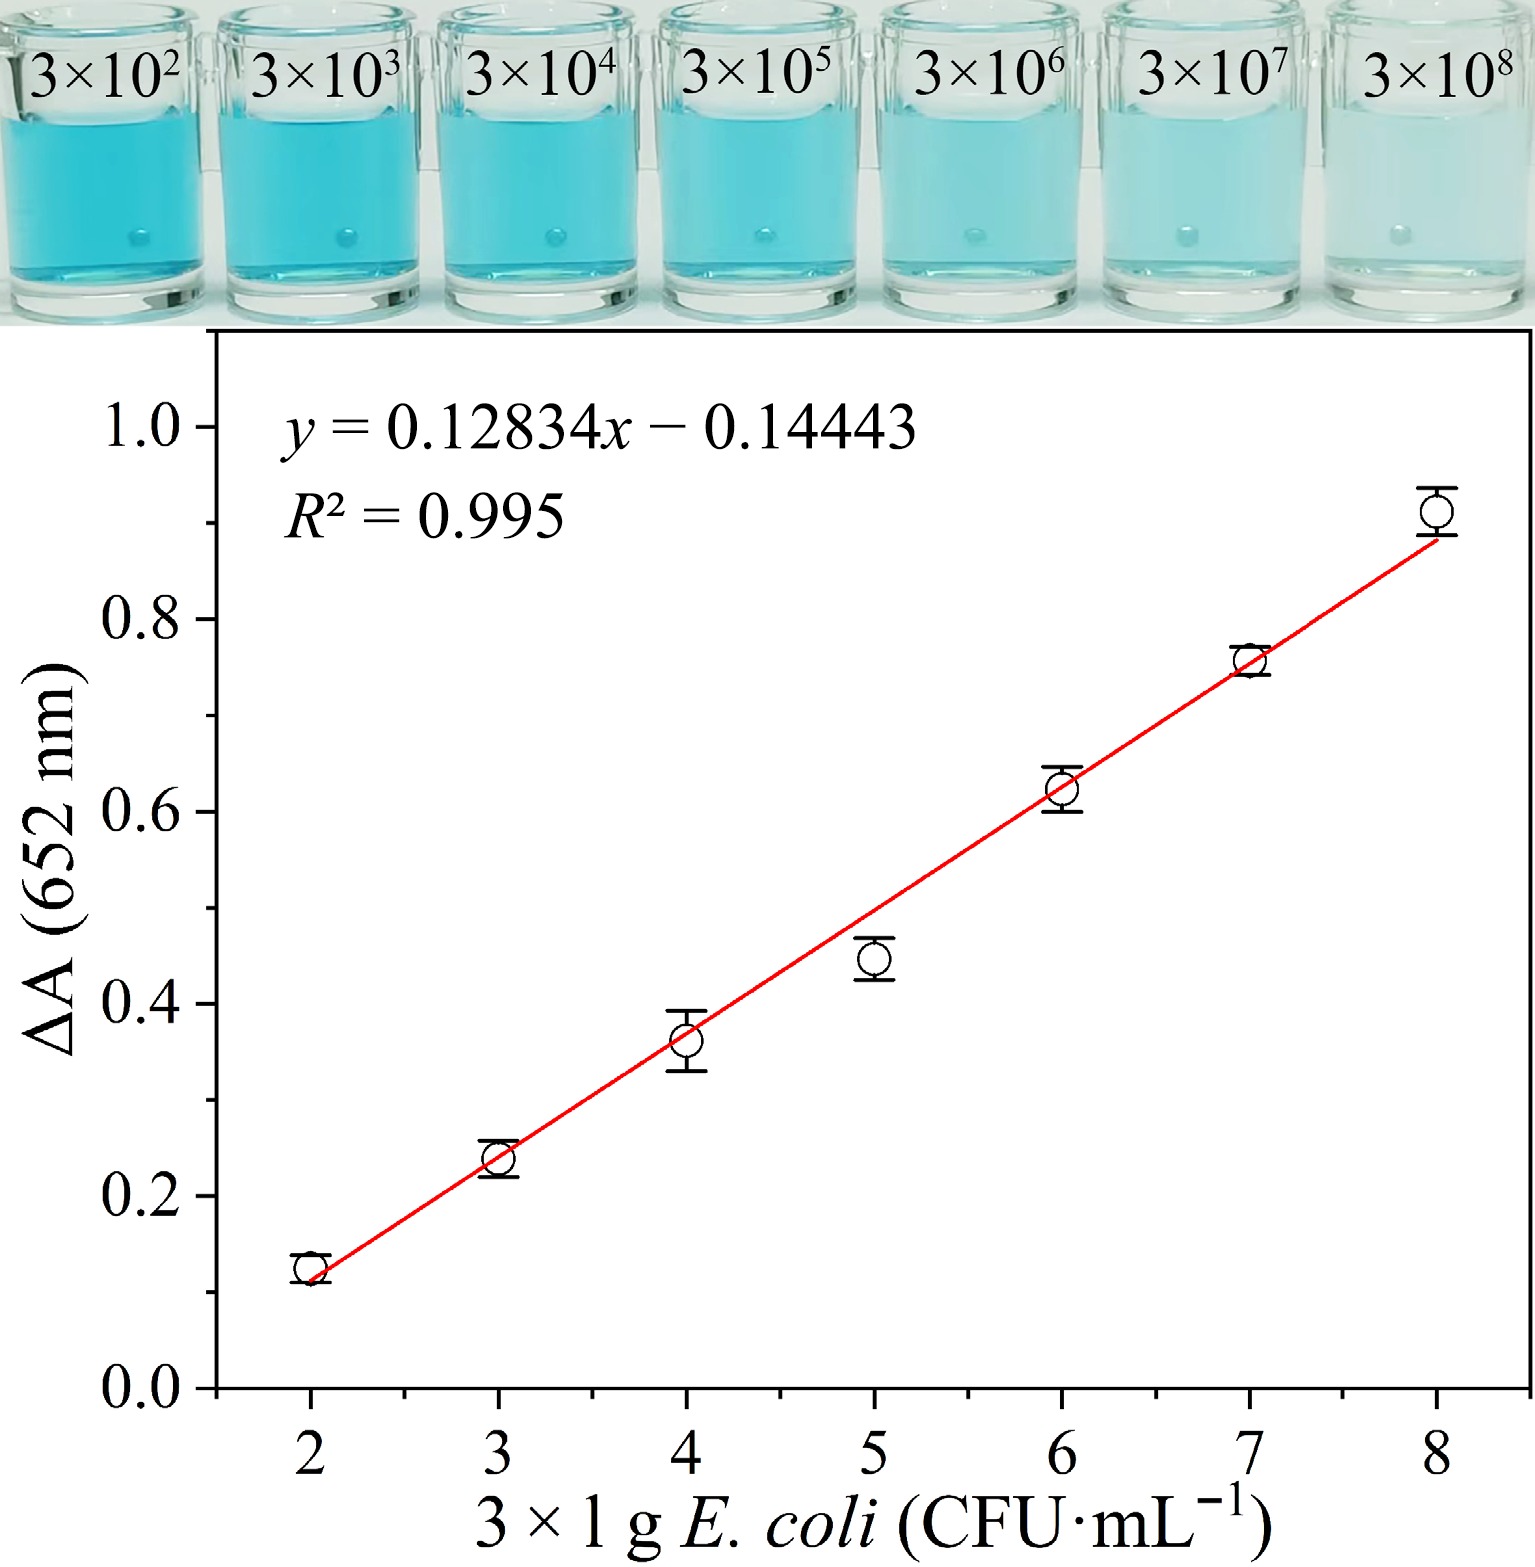
Figure 4.
Visual color and absorption variation (ΔA) of the catalytic solution added with varying concentrations of E. coli.
-
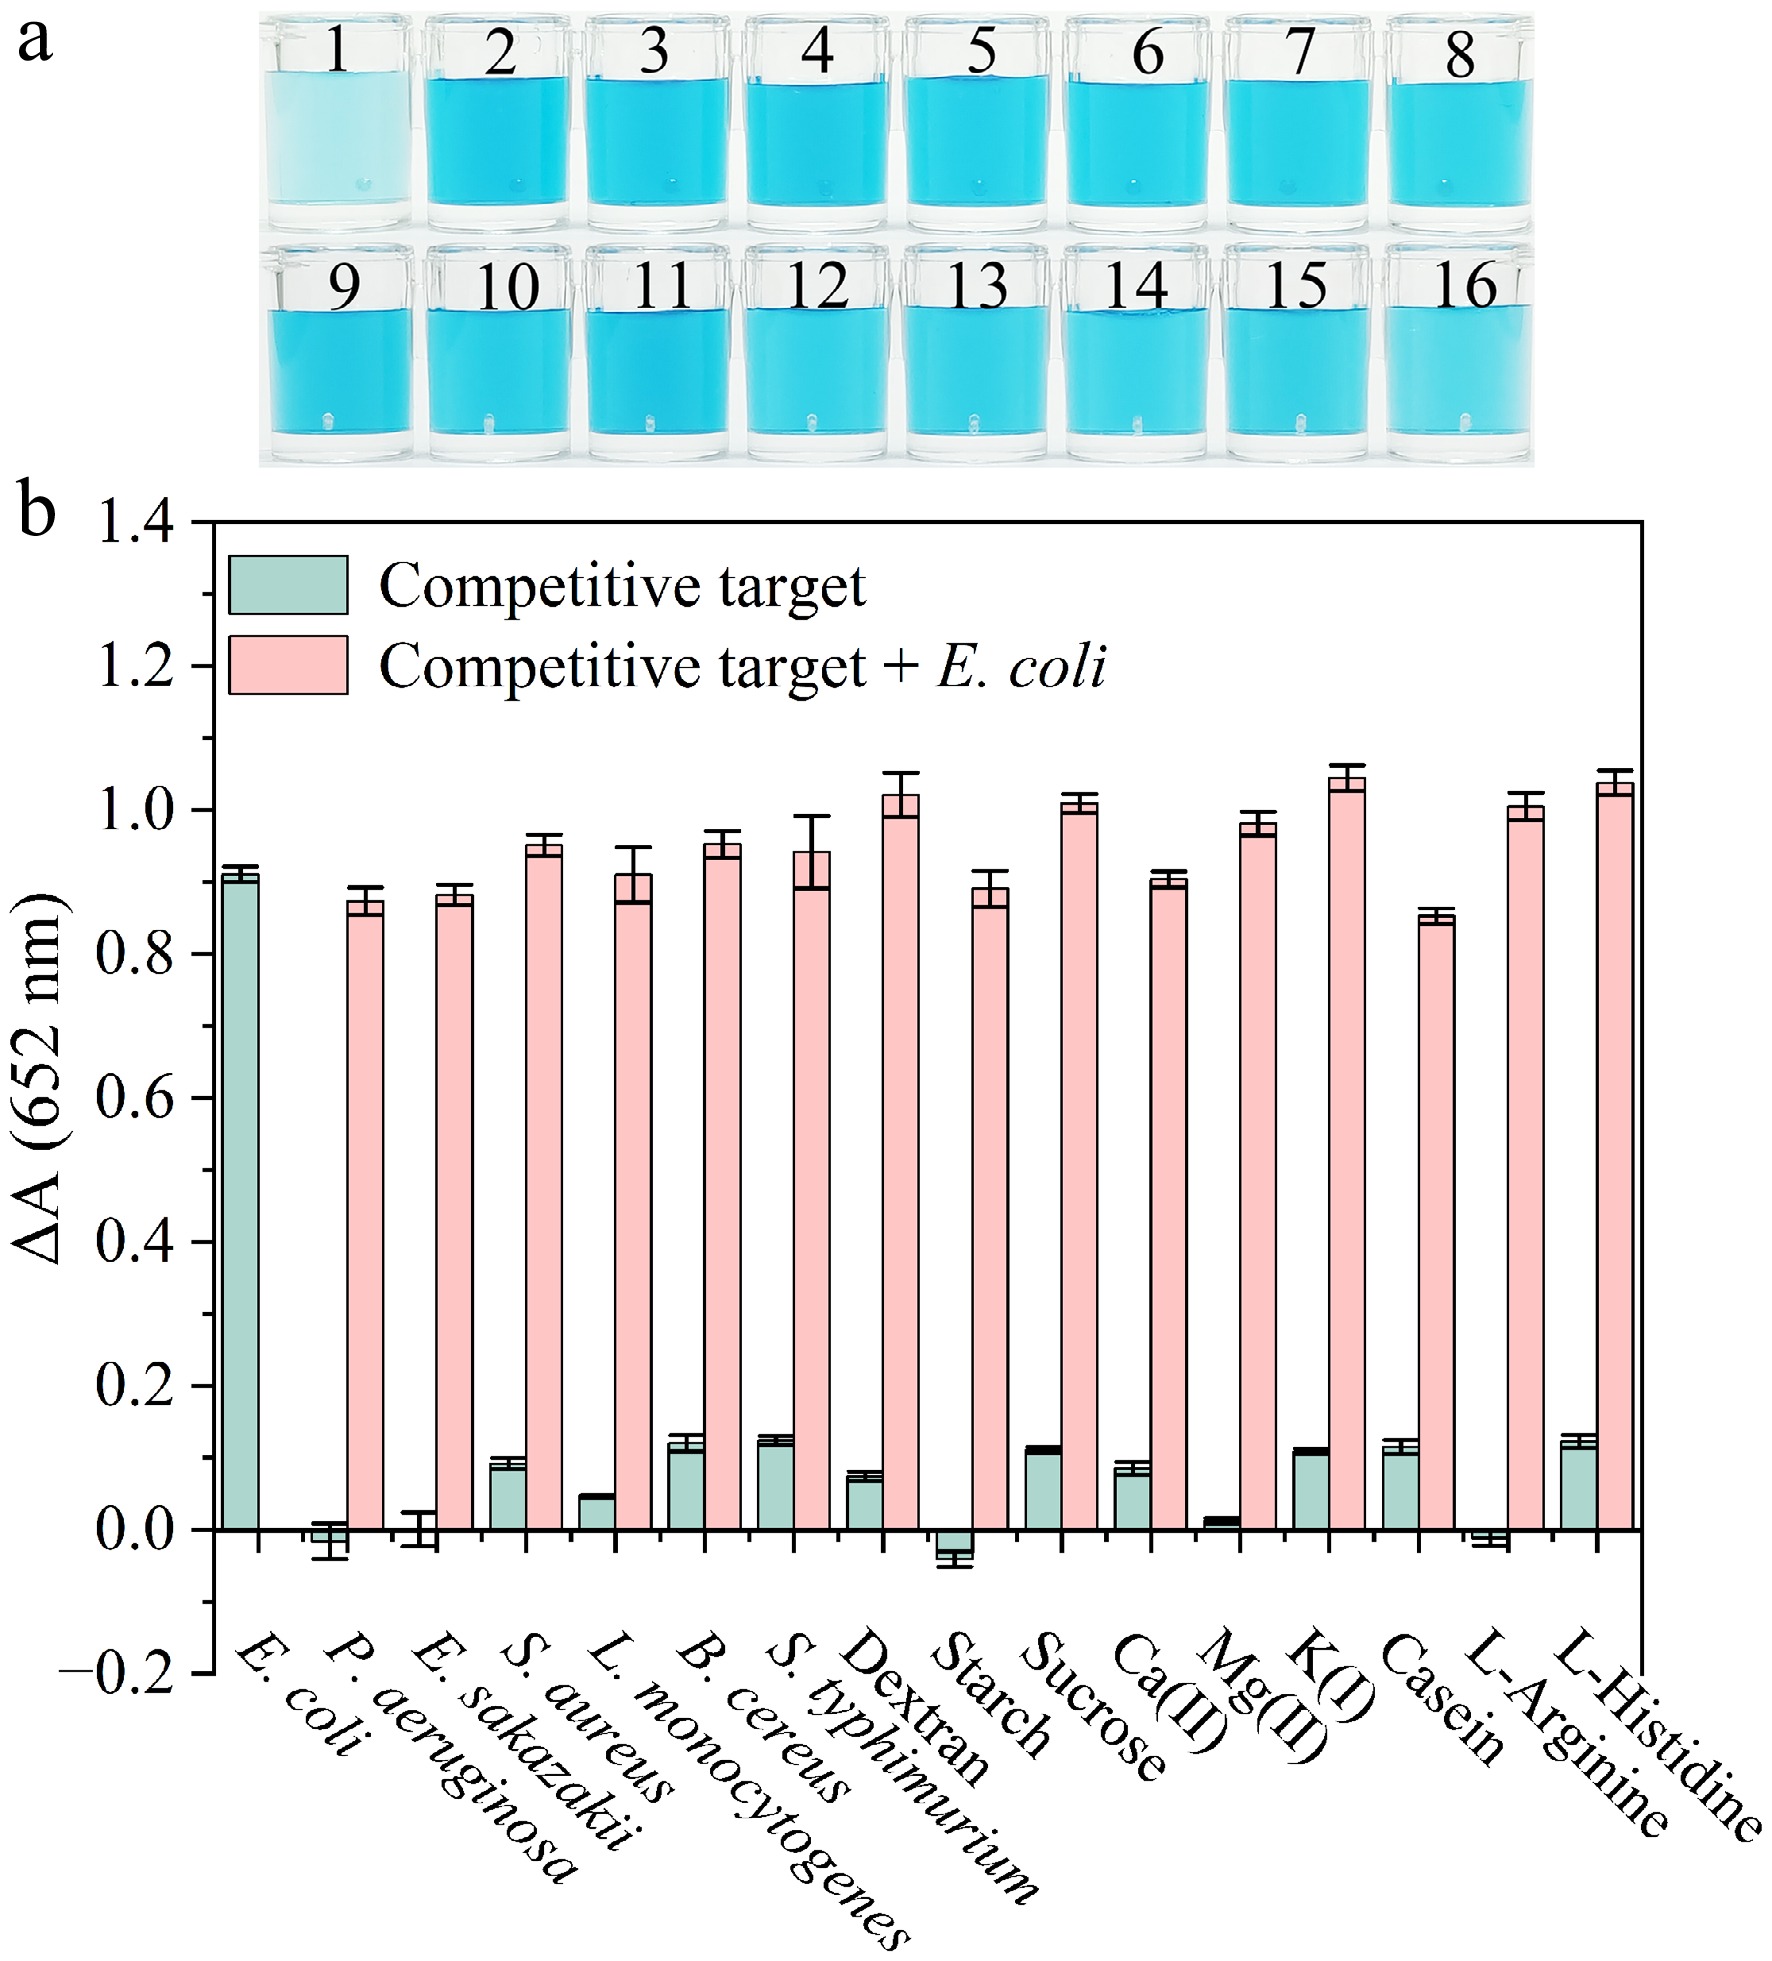
Figure 5.
(a) Color change of the colorimetric sensor in the presence of competitive targets. Samples 1 to 16 are individually E. coli, P. aeruginosa, E. sakazakii, S. aureus, L. monocytogenes, B. cereus, S. typhimurium, dextran, starch, sucrose, Ca (II), Mg(II), K(I), casein, L-Arginine and L-Histidine. (b) Variation in absorbance in response to E. coli and other targets. The concentration of each bacterial strain was 3 × 10⁸ CFU·mL−1. Concentrations of carbohydrates, metal ions, and amino acids of 100 μg·mL−1.
-
Method Materials Linear range (CFU·mL−1) LOD (CFU·mL−1) Actual sample Ref. Electrochemistry Ag NPs 3.4 × 101−3.4 × 10⁶ 34 Tap water, artificial urine, milk [54] MXene-GO 3.0–3.0 × 10⁶ 3.0 Serum [55] Fe3O4@COF-Au NPs 1.0 × 10²−1.0 × 10⁹ 10 Orange juice, milk, serum [56] Fluorescence UCNPs-WS2 8.5 × 101−8.5 × 10⁸ 17 Tap water, green tea powder [57] TPE-(COOH)4Na 6.5–6.5 × 10⁷ 2.8 Milk [58] Fe3O4 + FAM-Apt 1.0 × 101−1.0 × 10⁸ 6.0 Milk [33] Colorimetry K, Na-PHI 1.0 × 10²−1.0 × 10⁴ 85 Egg white, tofu, soya milk [59] Au NRs 1.0 × 101−1.0 × 10⁶ 7.0 Water [43] Apt-Au@Fe3O4 NPs 1.0 × 101−1.0 × 10⁸ 3.0 Tap water, milk, orange juice [60] Ag2O NPs 3.0 × 10²−3.0 × 10⁸ 4.0 Tap water, milk This work MXene-GO: MXene and graphene oxide composite; COF: covalent organic framework; UCNPs: upconversion nanoparticles; TPE-(COOH)4Na: sodium tetrakis (phenylethynyl) benzenesulfonate; K, Na-PHI: potassium/sodium poly (heptazine imide); NRs: nanorods. Table 1.
Comparison of the established colorimetric biosensor in detecting E. coli with other methods.
-
Sample Addition
(CFU·mL−1)Detection
(CFU·mL−1)Recovery
rate (%)RSD (%) Milk 0 0 None None 3.00 × 10⁸ 3.04 × 10⁸ 101 5.10 3.00 × 10⁷ 3.06 × 10⁷ 102 4.57 3.00 × 10⁶ 2.97 × 10⁶ 99.1 4.88 Water 0 0 None None 3.00 × 10⁸ 3.13 × 10⁸ 104 5.91 3.00 × 10⁷ 3.03 × 10⁷ 101 6.11 3.00 × 10⁶ 3.08 × 10⁶ 103 5.19 Table 2.
Determination of E. coli in the spiked real food samples.
Figures
(6)
Tables
(2)