-
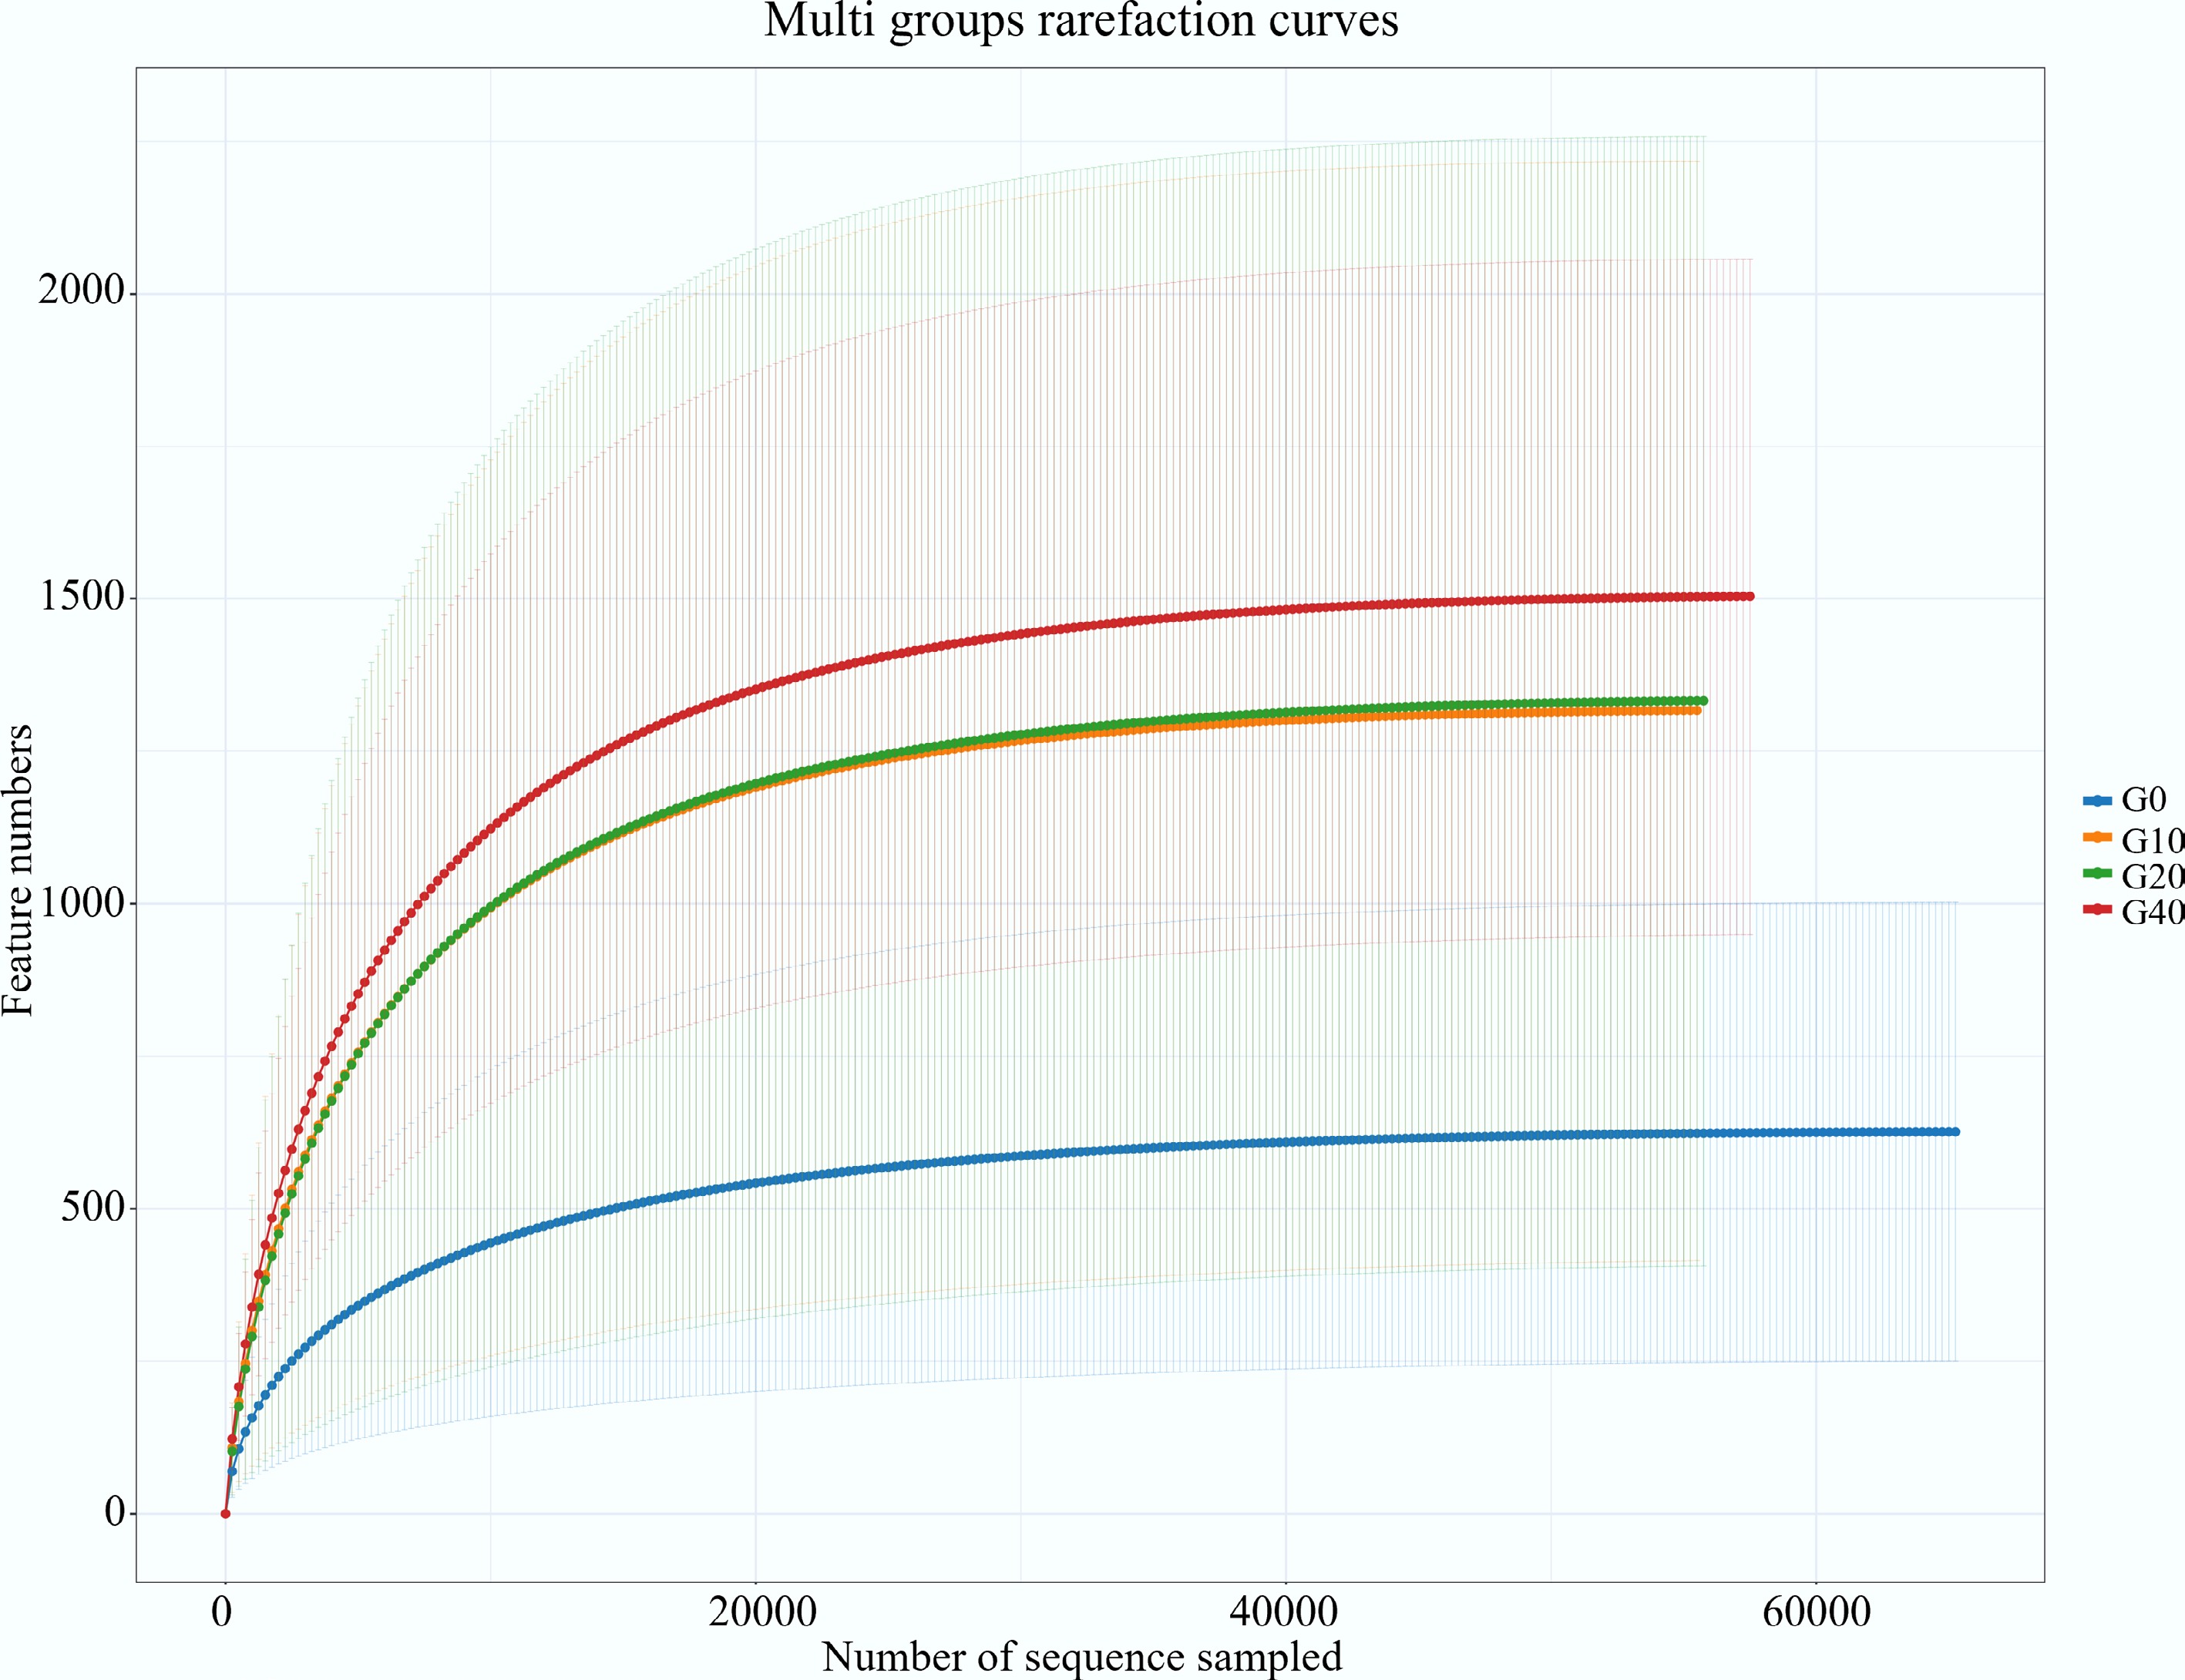
Figure 1.
Rarefaction curves of intestinal microbiota of largemouth bass fed with different feed formulations (G0, G10, G20, and G40).
-
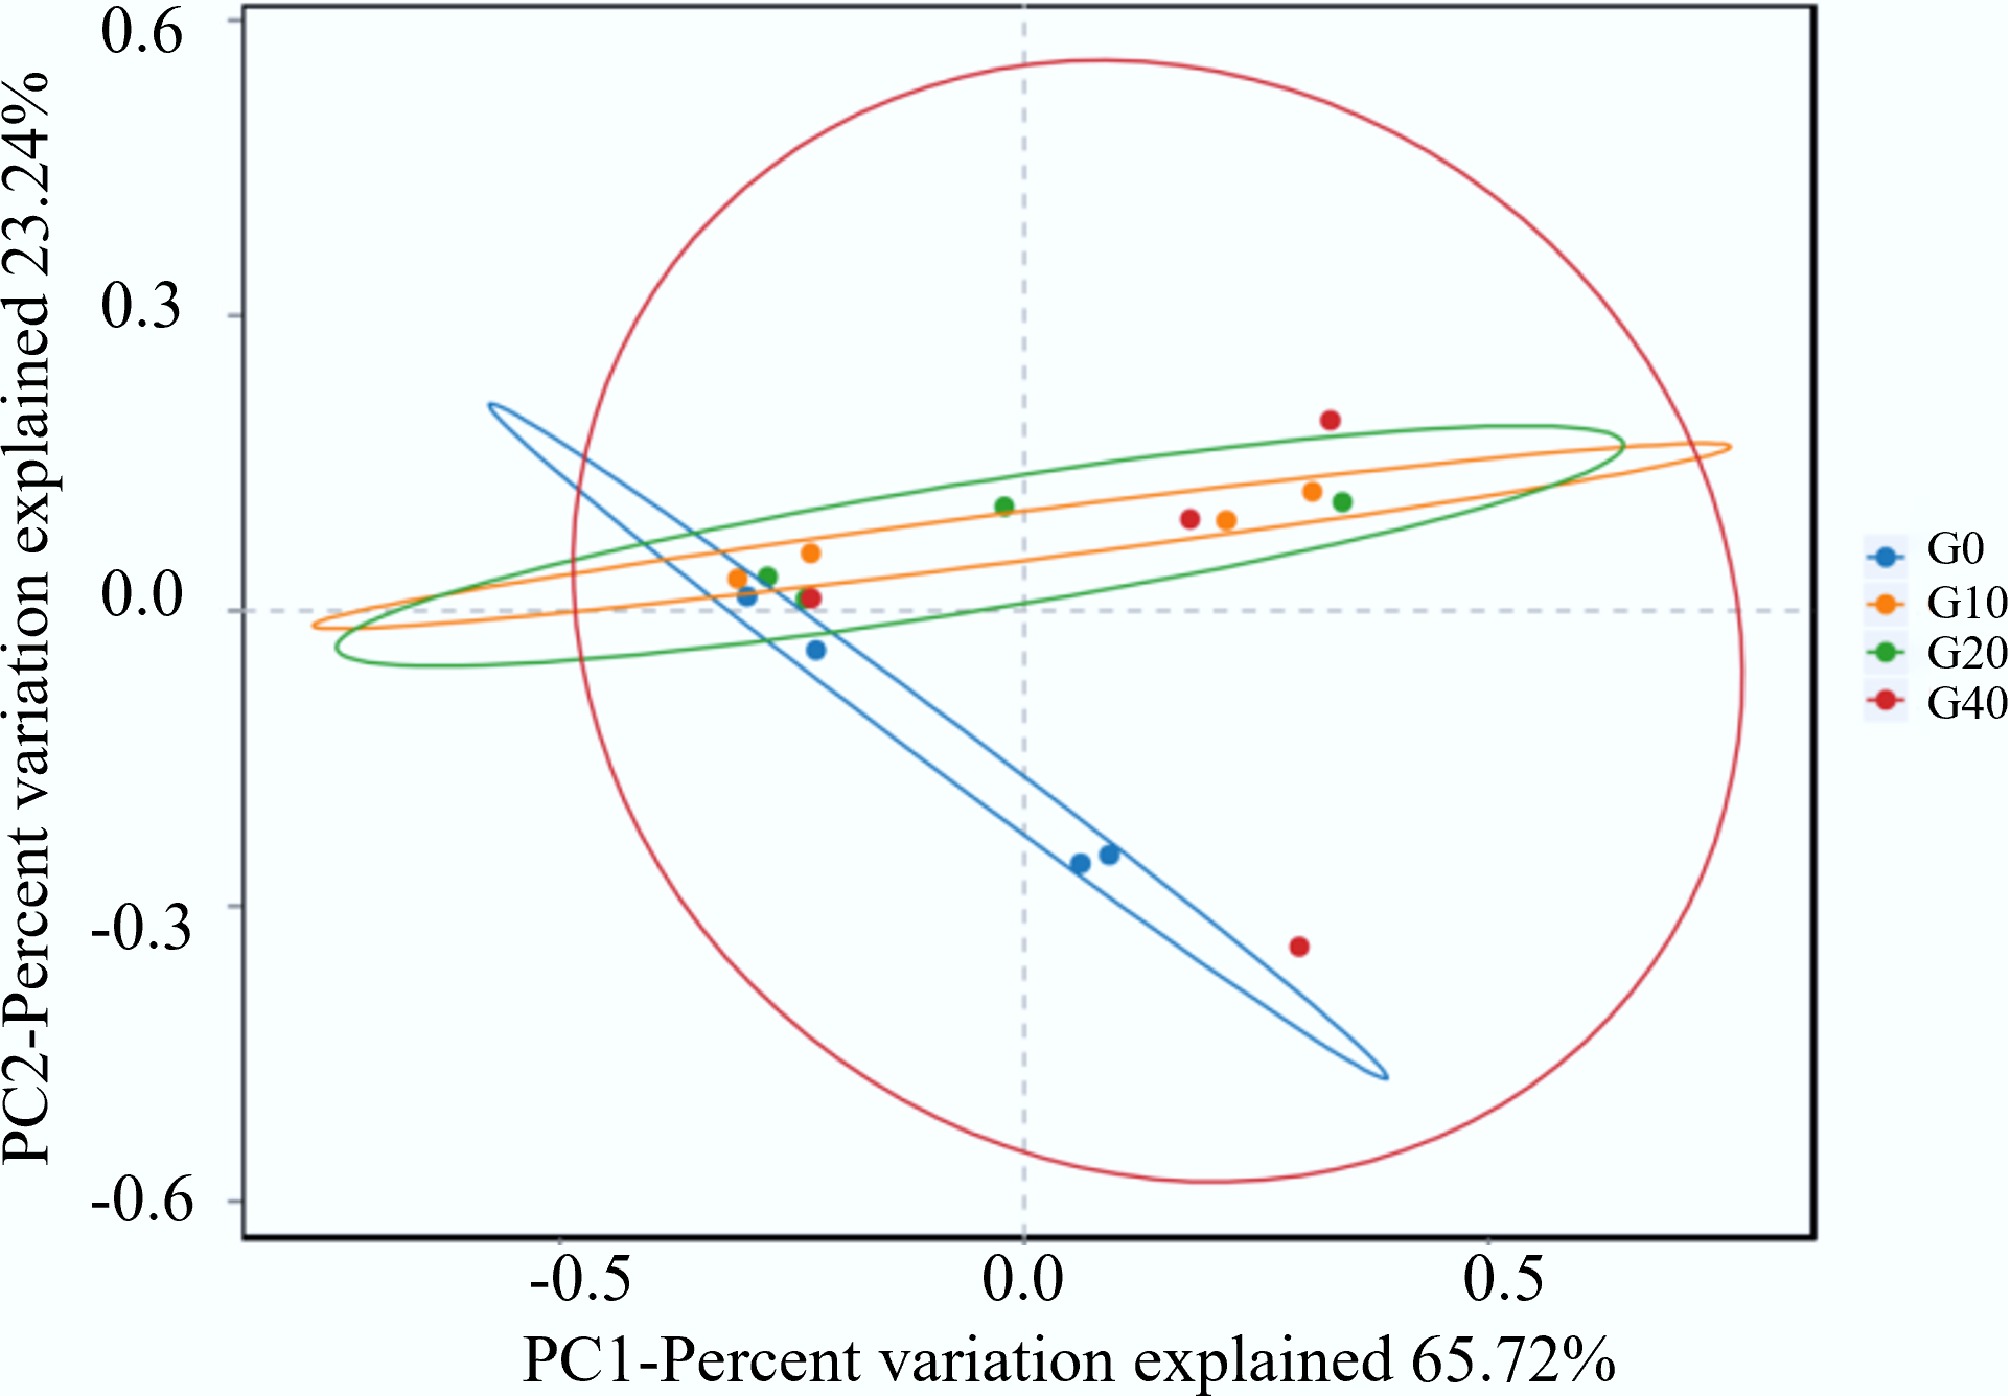
Figure 2.
Beta diversity of largemouth bass gut microbiota.
-
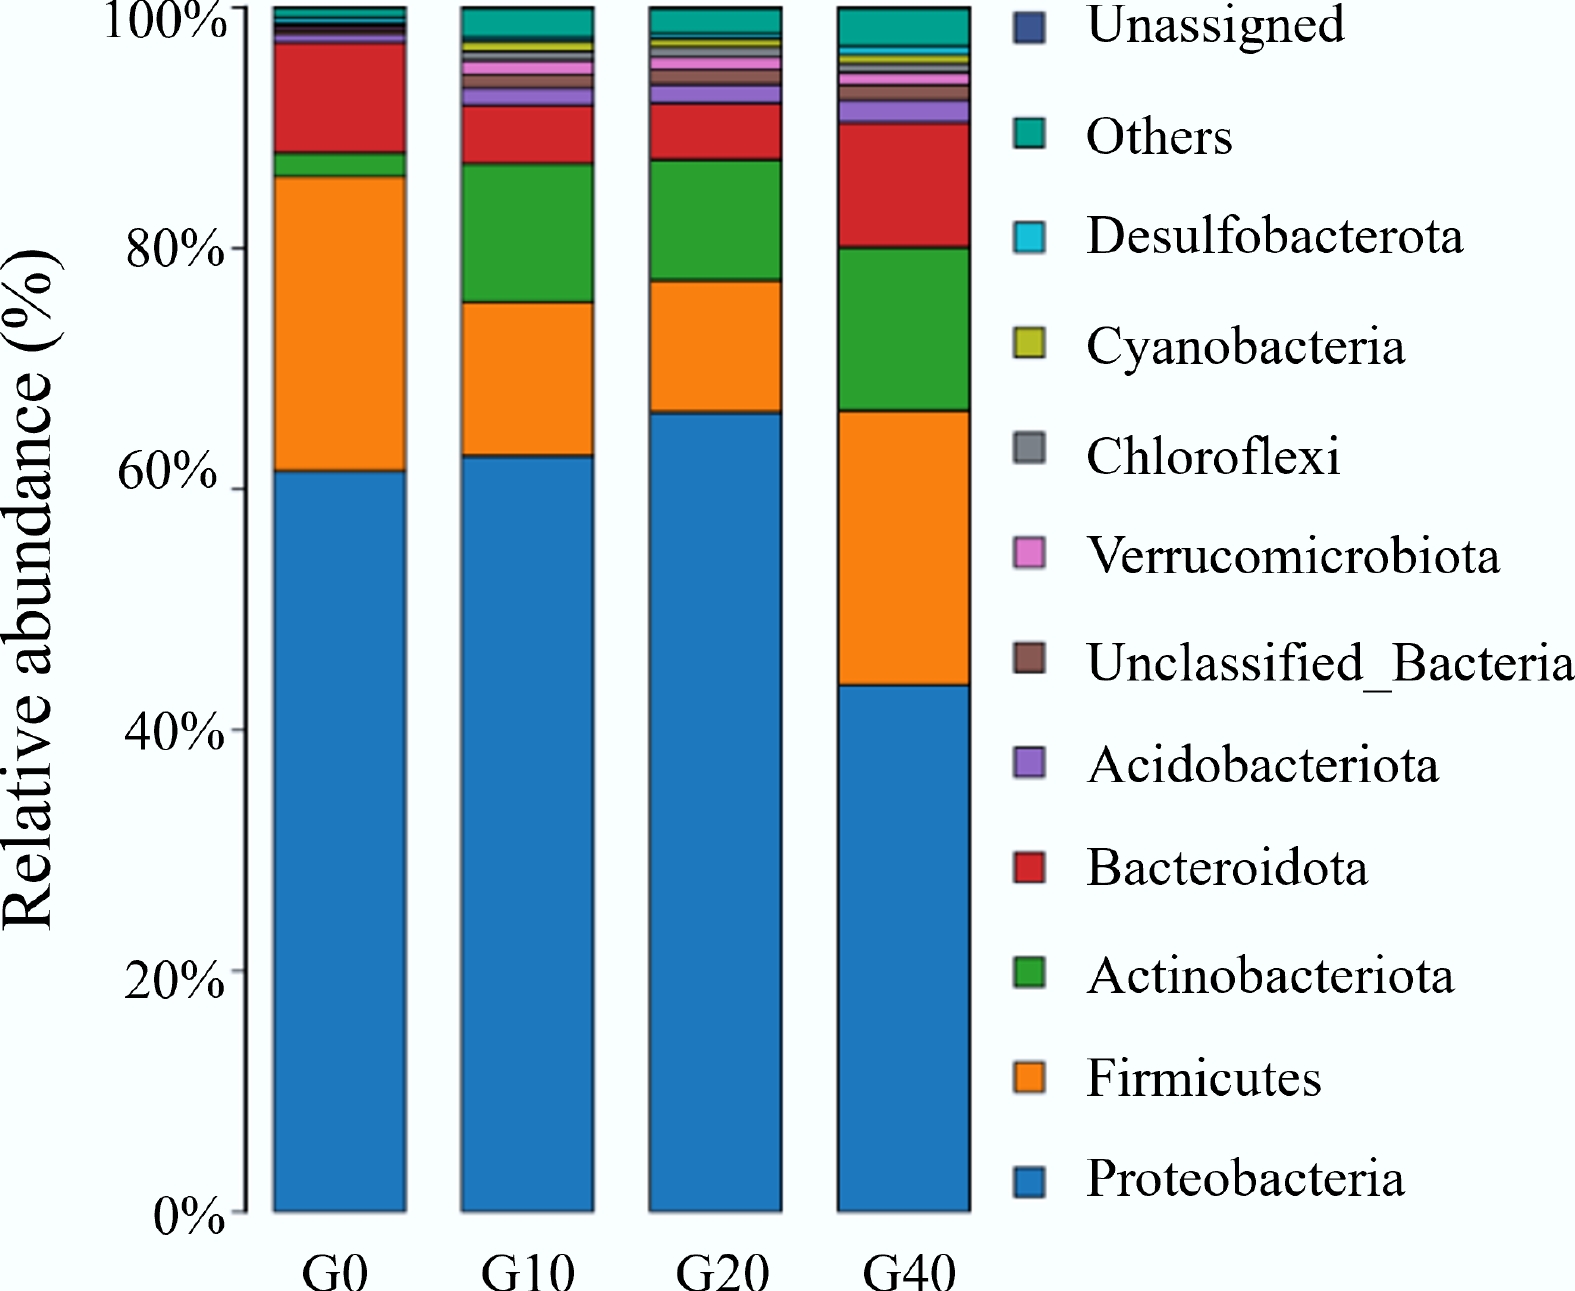
Figure 3.
Relative abundance at phylum levels of the intestinal microbiota of largemouth bass fed with different feed formulations (G0, G10, G20, and G40).
-
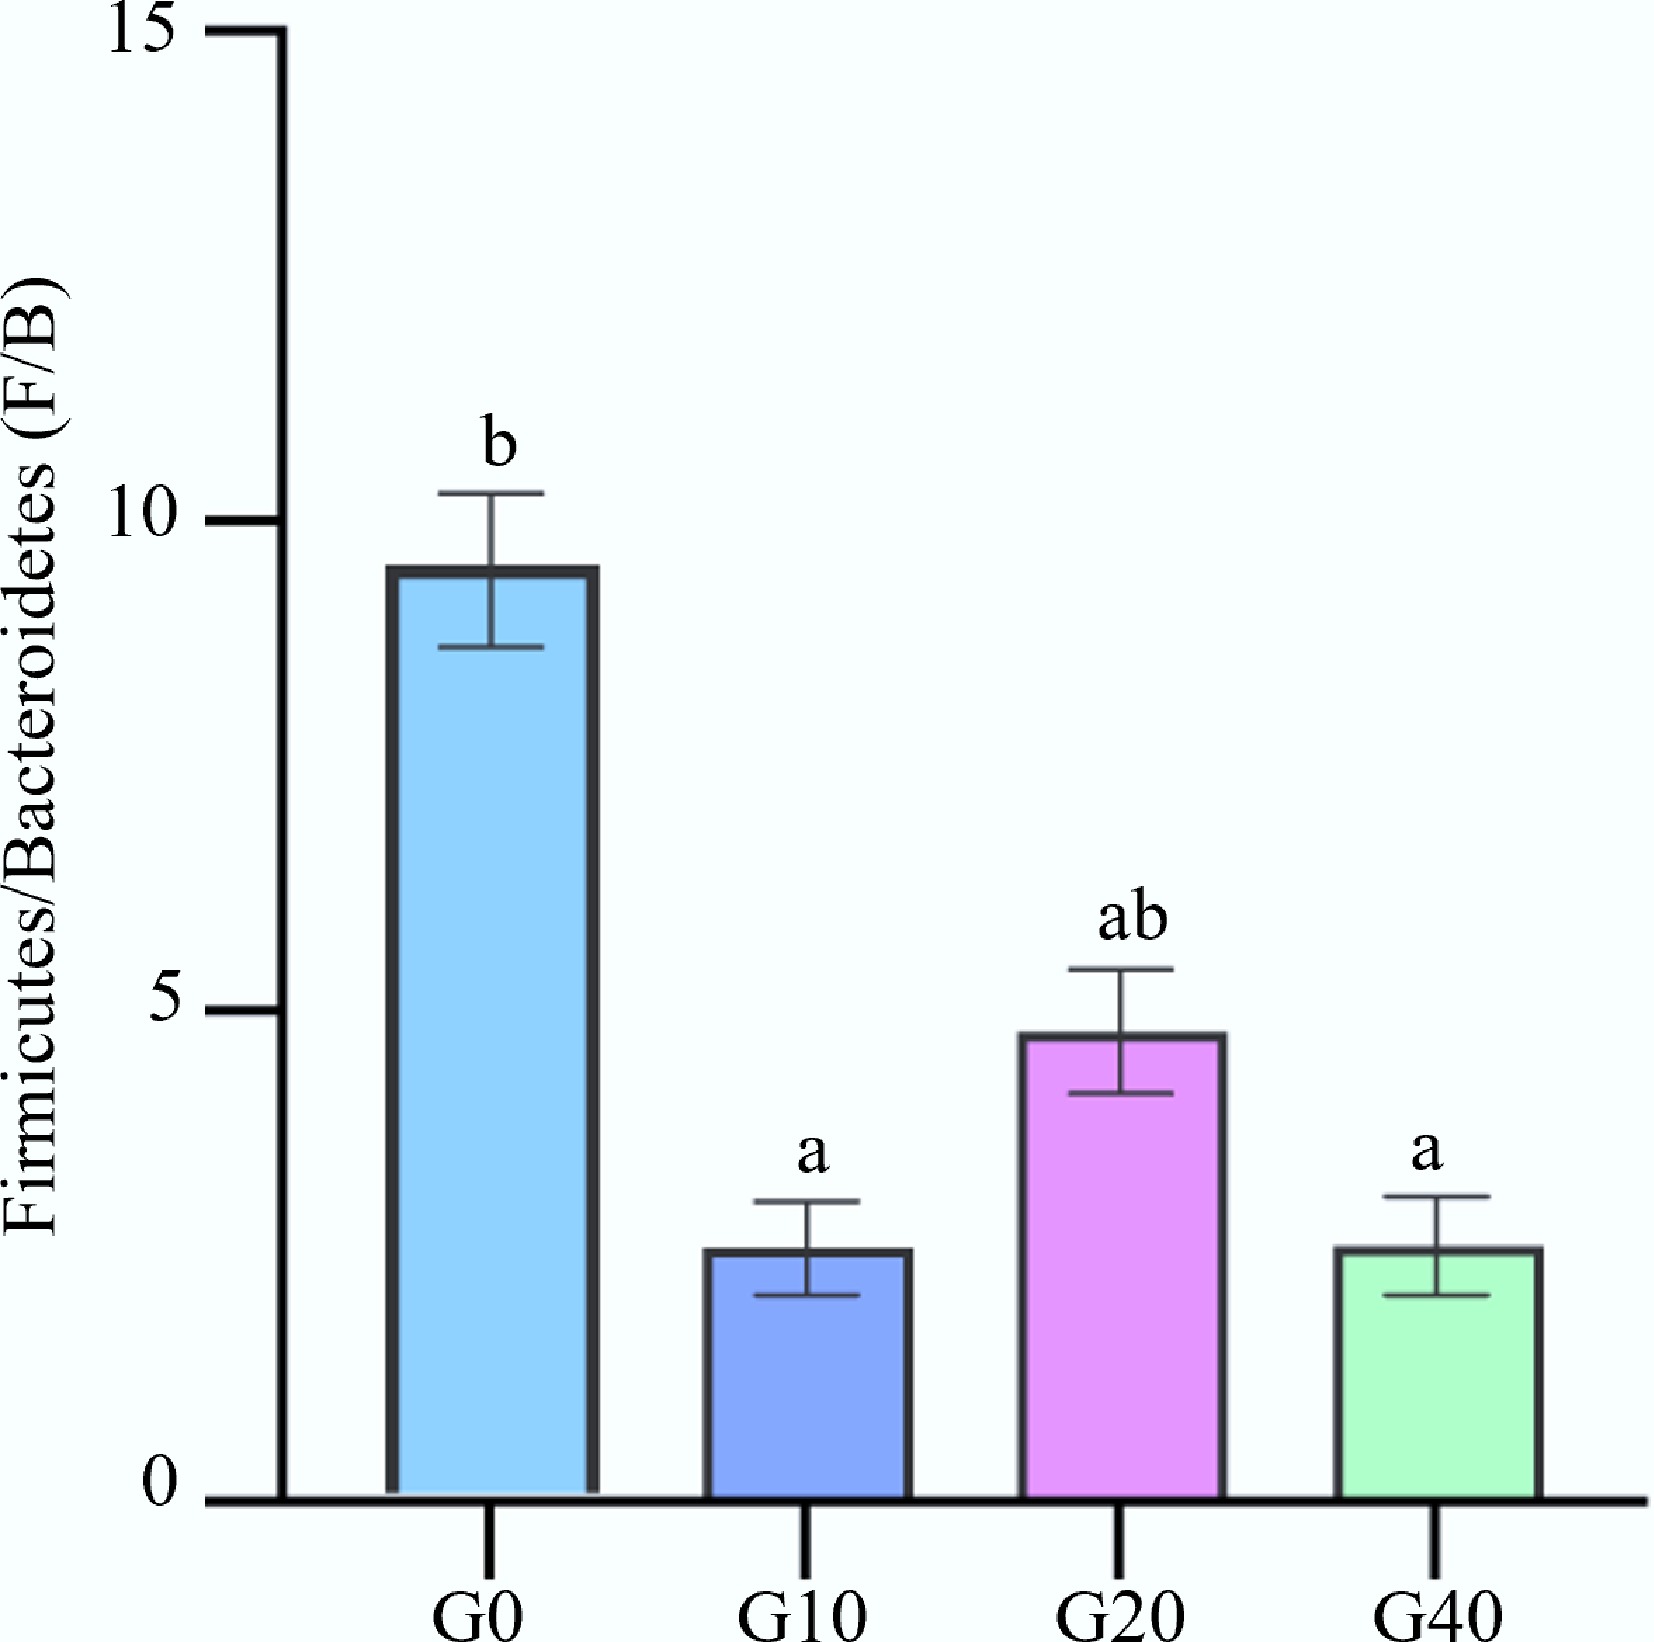
Figure 4.
Effect of biochar addition on Firmicutes/Bacteroidetes values (F : B). Values within the same row sharing a common superscript letter are not significantly different (p > 0.05), while values with different superscript letters differ significantly (p < 0.05).
-
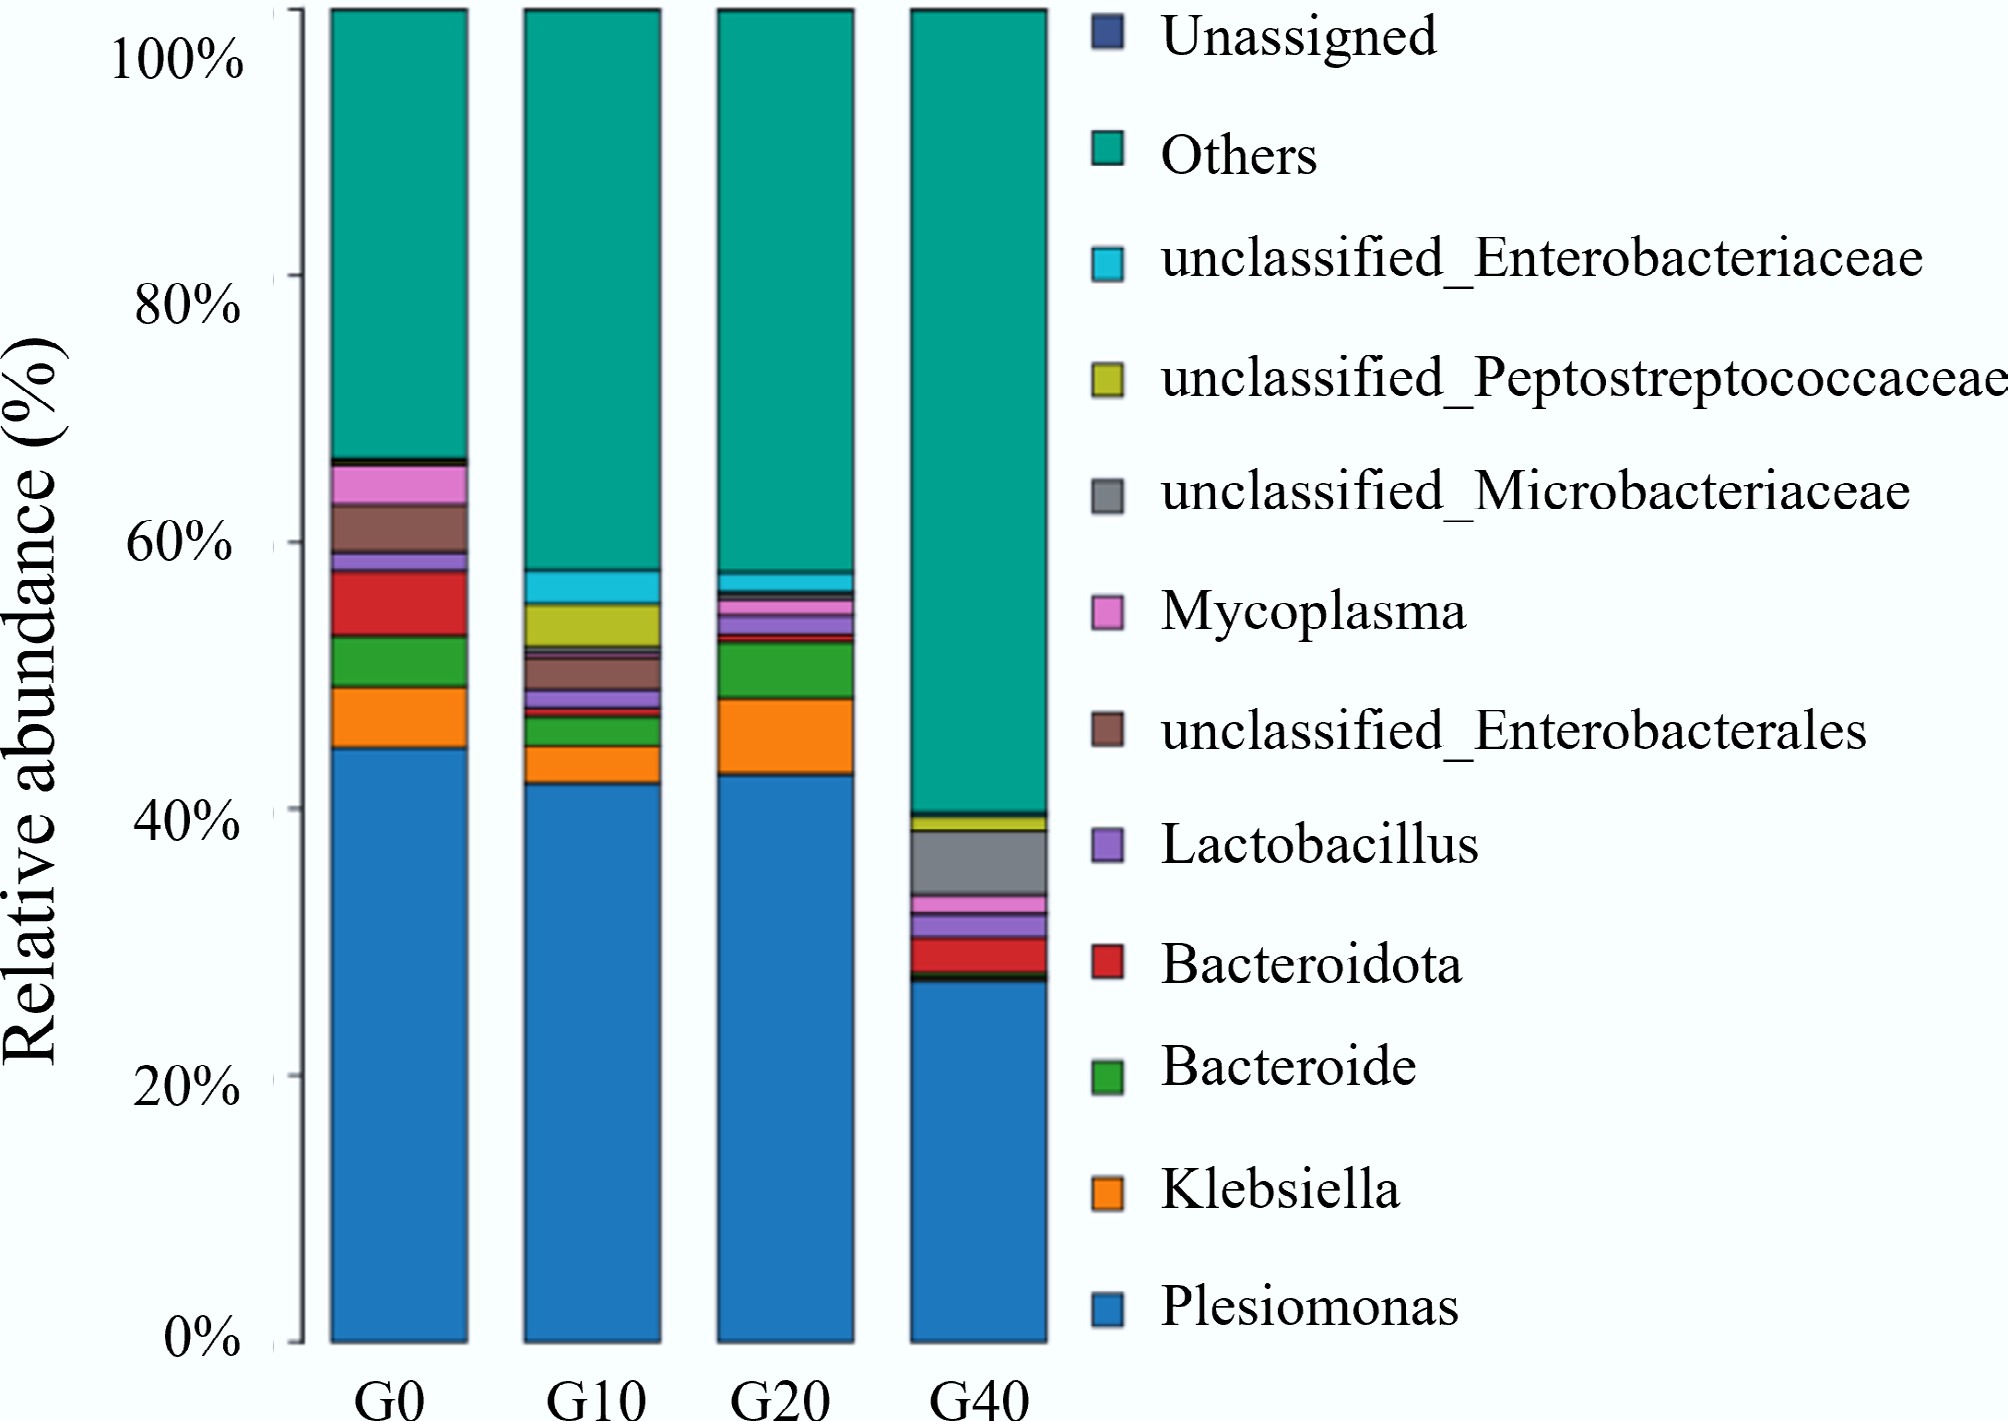
Figure 5.
Relative abundance at genus levels of the intestinal microbiota of largemouth bass fed with different feed formulations (G0, G10, G20, and G40).
-
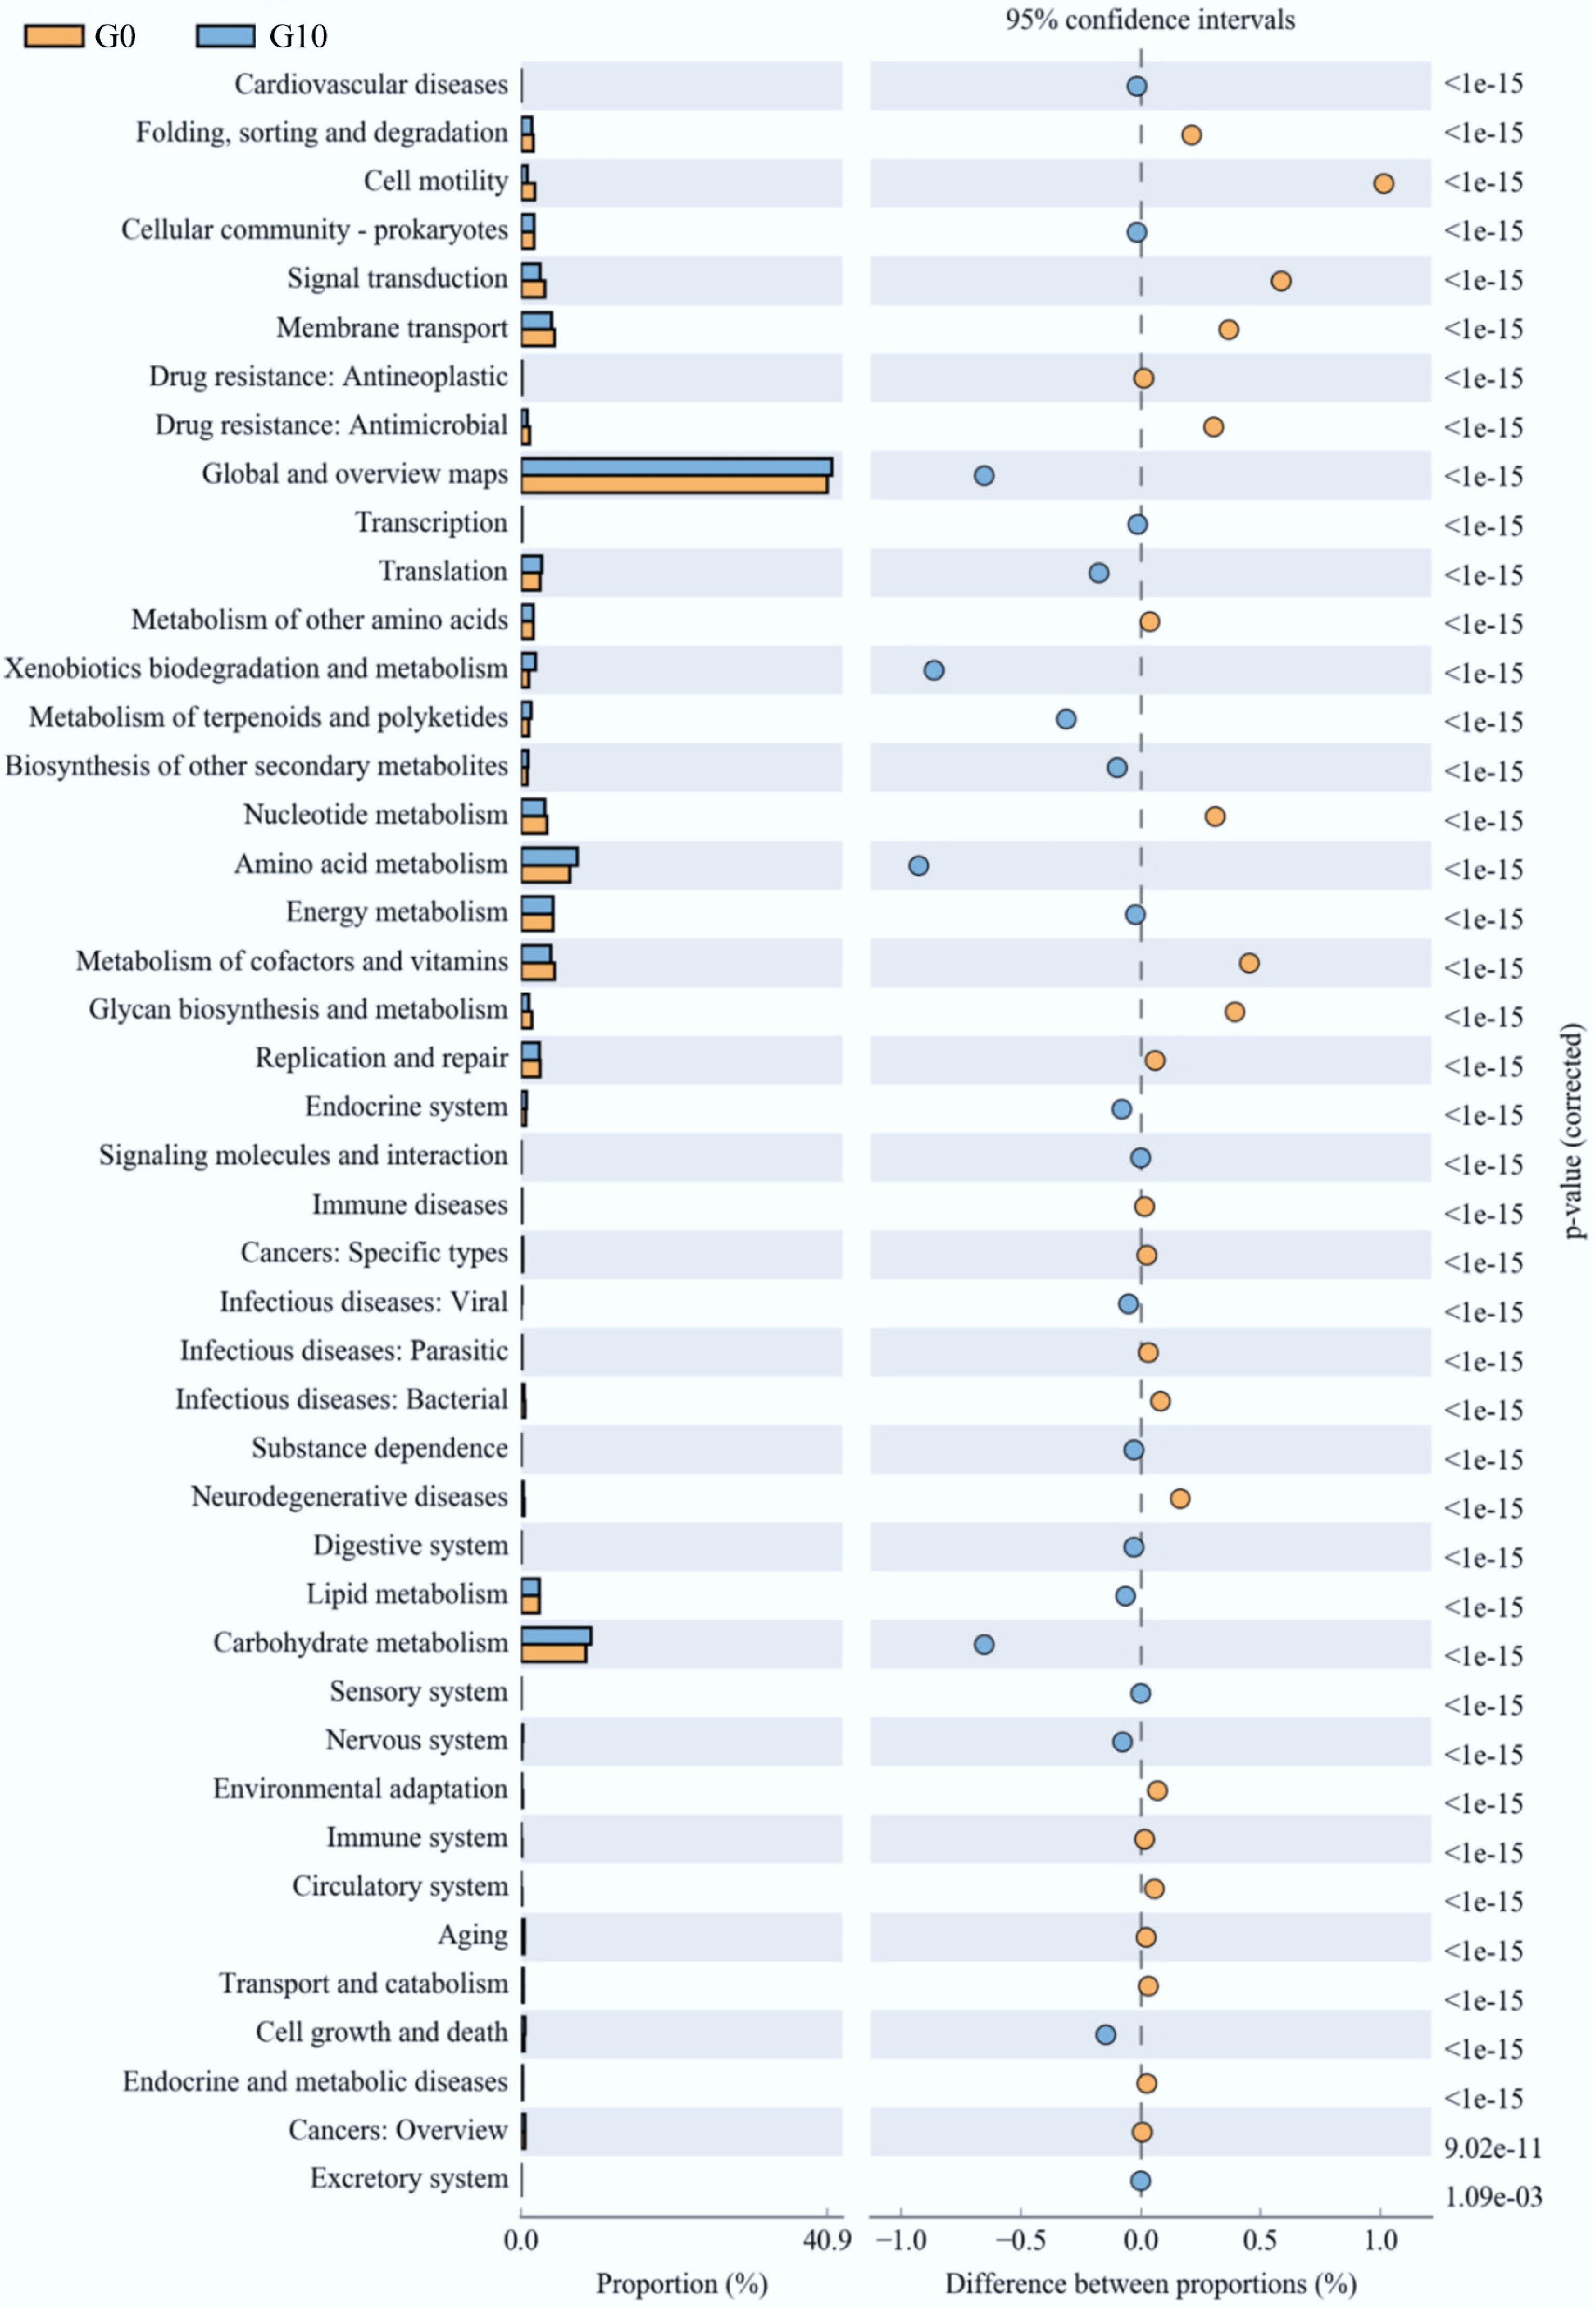
Figure 6.
Functional prediction of gut microbiota in the G0 and G10 groups.
-
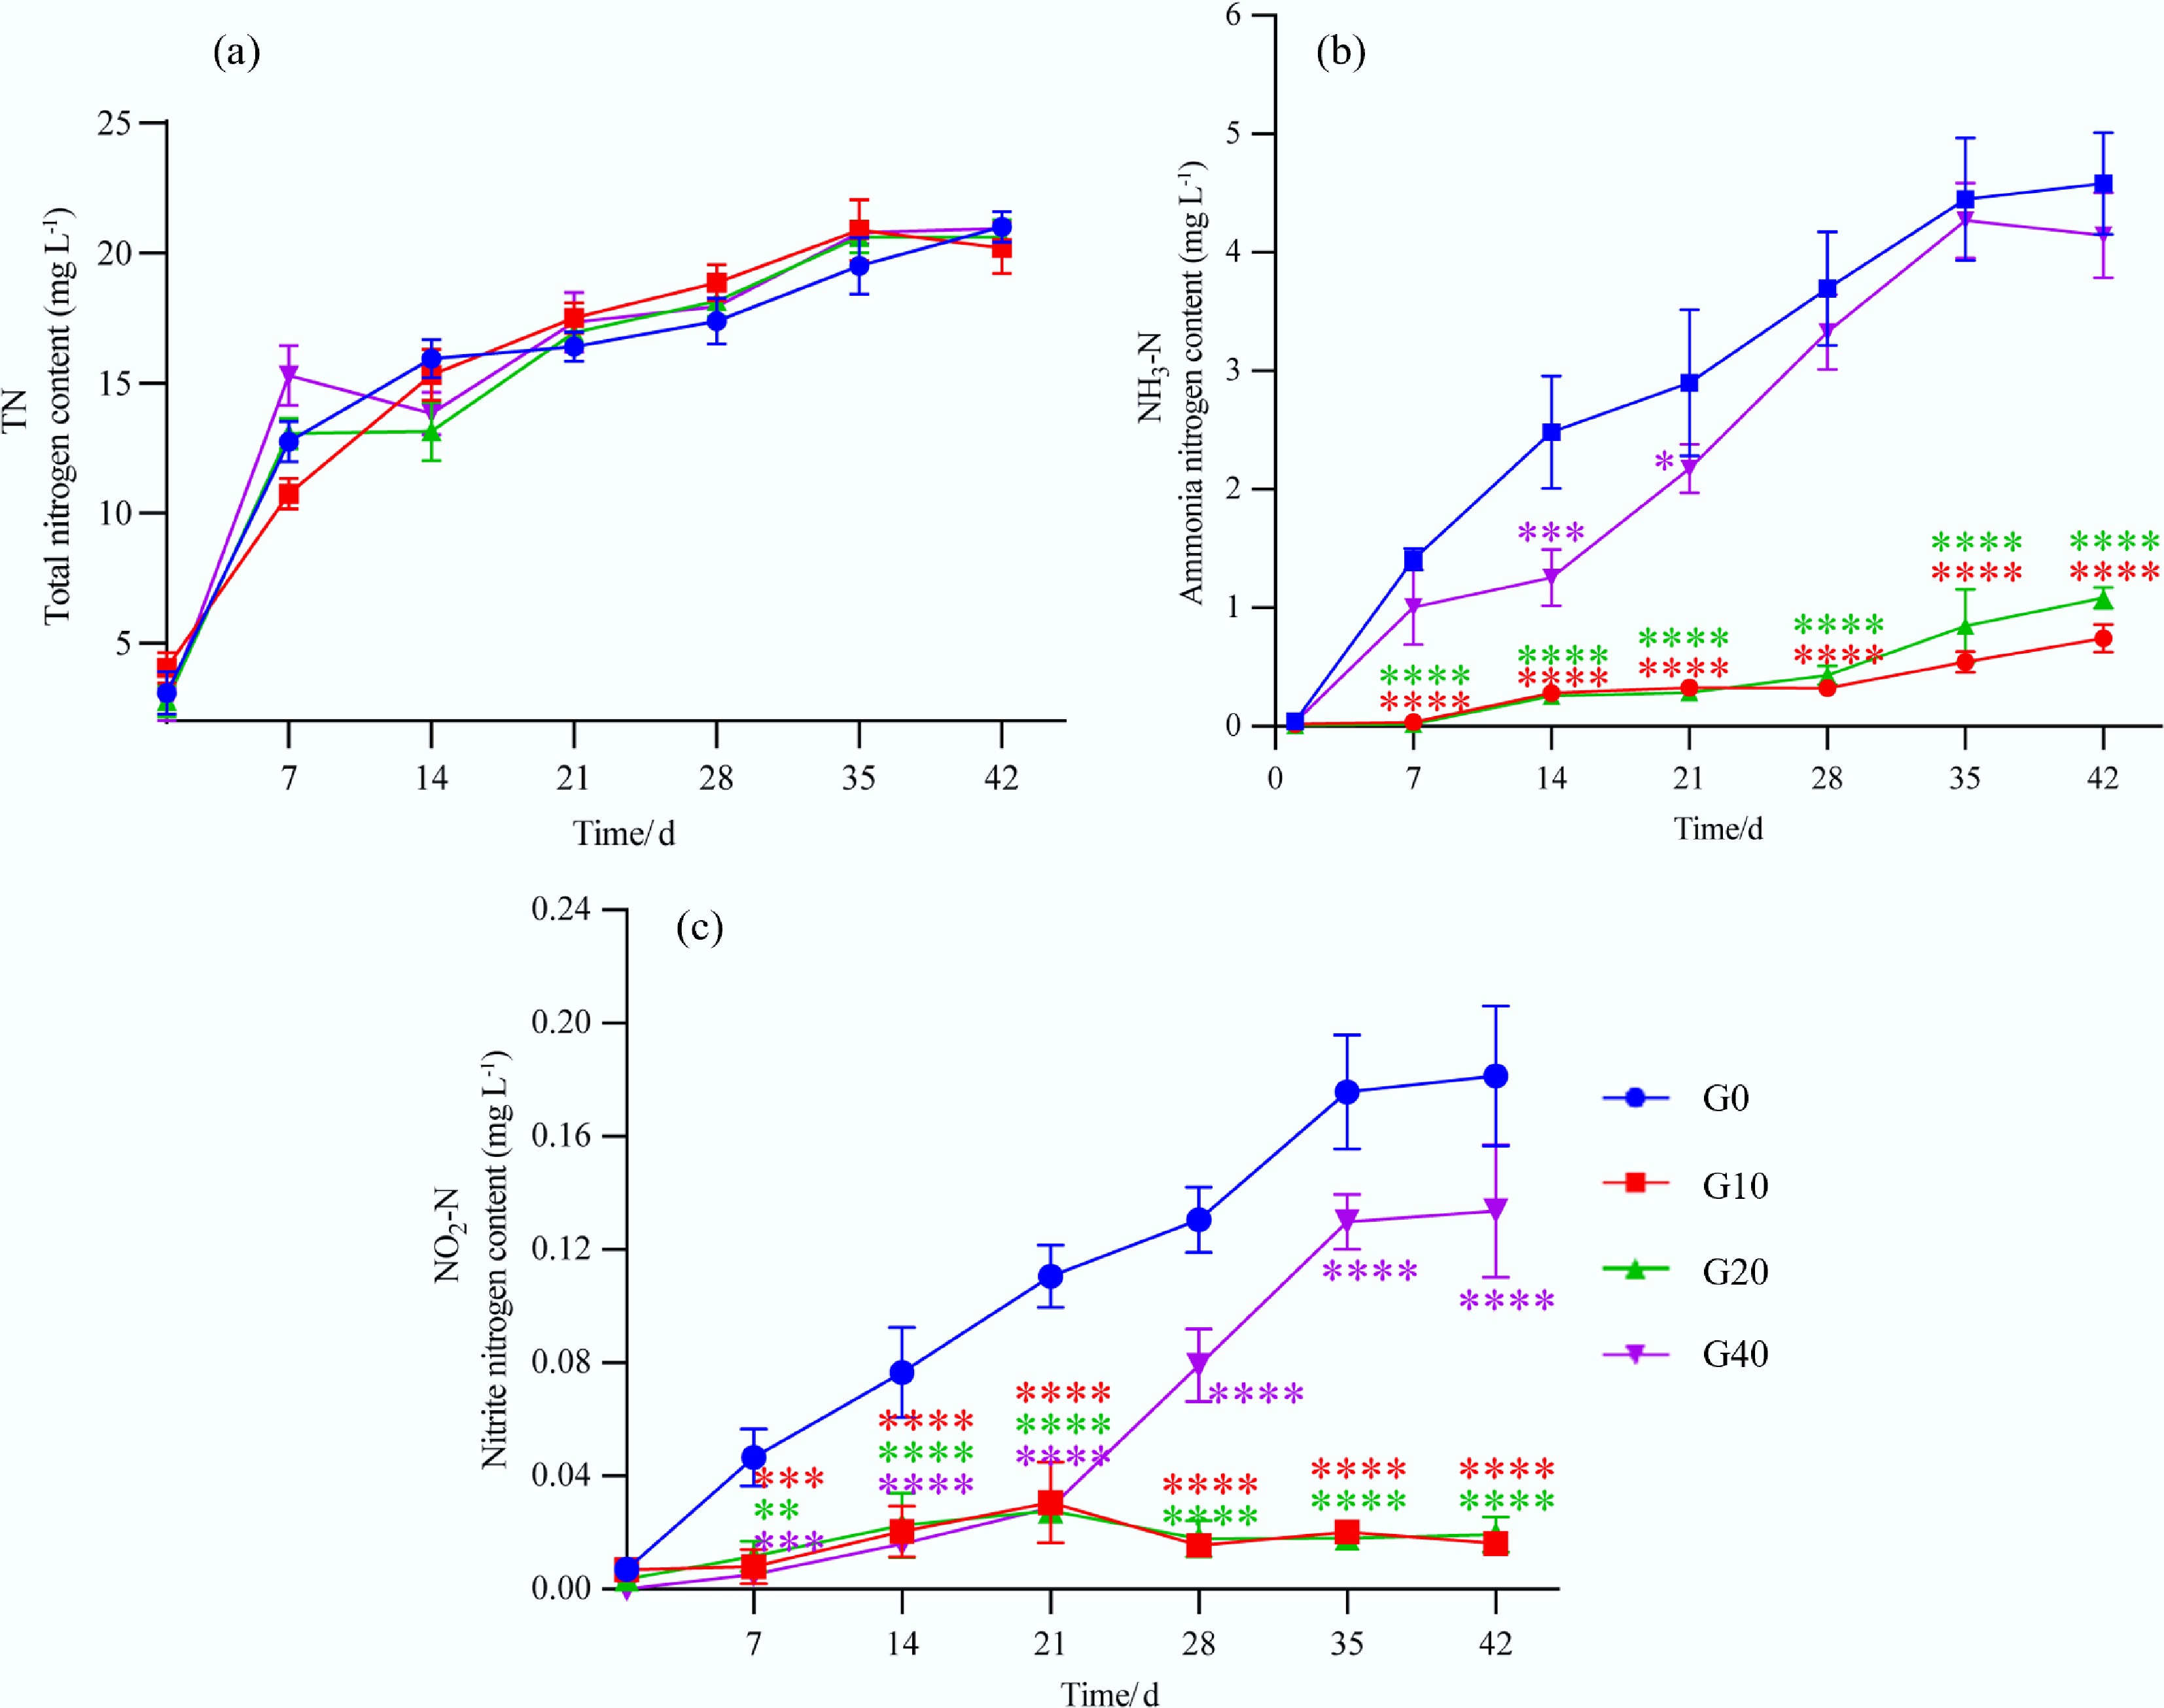
Figure 7.
Changes in (a) total nitrogen, (b) ammonia, and (c) nitrite of the aquaculture water for largemouth bass fed with different feed formulations (G0, G10, G20, and G40). (* represents the significant difference among the different treatments at p < 0.05, *** or **** represents the significant difference among the different treatments at p < 0.001).
-
Sample pH C % H % O % N % Cation exchange capacity
(cmol kg−1)Zeta potential
(MV)BET surface area
(m2 g−1)Micropore volume
(cm3 g−1)Total pore volume at
P/P0 = 0.985 (cm3 g−1)Biochar 10.15 72.4 2.70 14.99 1.51 22.80 −38.35 3.11 3.03E-04 5.06E-03 Table 1.
Physical and chemical properties of mulberry branch-derived biochar
-
Ingredient G0 G10 G20 G40 Microcrystalline cellulose 4.00 3.00 2.00 0.00 Mulberry branch-derived biochar 0.00 1.00 2.00 4.00 Fish meal 45.00 45.00 45.00 45.00 Soybean meal 16.00 16.00 16.00 16.00 Soybean protein concentrate 12.60 12.60 12.60 12.60 α-starch 12.50 12.50 12.50 12.50 Fish oil 2.00 2.00 2.00 2.00 Soybean oil 3.50 3.50 3.50 3.50 Lecithin 1.00 1.00 1.00 1.00 Vitamin C phosphate ester 0.30 0.30 0.30 0.30 Vitamin premixa 0.10 0.10 0.10 0.10 Mineral premixb 0.50 0.50 0.50 0.50 Ca(H2PO4)2 1.50 1.50 1.50 1.50 Choline chloride 0.50 0.50 0.50 0.50 Betaine 0.50 0.50 0.50 0.50 Total 100.00 100.00 100.00 100.00 a Vitamin premix (composition kg−1): VA 3,200,000 IU, VD 1,600,000 IU, VB12 0.016 g, VB1 4 g, VK 4 g, VB6 4.8 g, VB2 8 g, VE 16 g, biotin 0.064 g, folic acid 1.28 g, calcium pantothenate 16 g, nicotinic acid 28 g, inositol 40 g. b Mineral premix (composition kg−1): NaSeO3 0.004 g, Met-Co 0.25 g, FeSO4·H2O 1 g, Met-Cu 1.5 g, ZnSO4·H2O 10 g, MgSO4·H2O 12 g, Ca( IO3) 29 g, KCl 36 g. Table 2.
Ingredients of the experimental diets (DM basis) %
-
Nutrient level G0 G10 G20 G40 Crude protein 45.81 45.83 45.80 45.79 Crude lipid 9.25 9.21 9.30 9.32 Ash 10.46 10.42 10.40 10.48 Moisture 7.12 7.09 7.10 7.13 Table 3.
Nutritional levels of the experimental diets (DM basis)%
-
Items Groups Standard error of the
mean (SEM)p-value Polynomial contrasts G0 G10 G20 G40 Linear Quadratic IBW (g) 3.310 3.300 3.310 3.30 0.012 0.864 0.721 0.676 FBW (g) 34.27 34.53 34.04 33.97 1.618 0.190 0.319 0.110 WGR (%) 936.47 945.99 927.38 920.31 12.300 0.188 0.340 0.098 SGR (%/d) 5.57 5.58 5.54 5.53 0.037 0.182 0.316 0.097 FC 0.77 0.77 0.78 0.78 0.016 0.195 0.334 0.201 SR (%) 96.23 96.29 95.99 95.89 1.600 0.168 0.539 0.183 CF (g cm−3) 3.52b 3.66b 3.26a 3.17a 0.095 0.022 0.035 0.181 VSI (%) 7.56 7.61 7.56 7.55 0.170 0.901 0.468 0.954 HSI (%) 2.41 2.51 2.26 2.17 0.142 0.129 0.053 0.355 FI (g/fish) 24.11 23.99 24.51 24.61 1.312 0.172 0.309 0.092 Values in the same row with different superscript letters are significantly different (p < 0.05). The same as below. WGR: weight gain ratio; SGR: specific growth rate; FC: feed conversion ratio; VSI: viscerosomatic index; HSI: hepatosomatic index; CF: condition factor; SR: survival rate; FI: feed intake. Table 4.
The growth performance of largemouth bass fed with different feed formulations
-
Item Groups Standard error of the
mean (SEM)p-value Polynomial contrasts G0 G10 G20 G40 Linear Quadratic Lipase (U g−1 prot) 11.38ab 14.92b 10.77a 10.96a 2.850 0.028 0.584 0.030 Trypsin (U mg−1 prot) 994.73a 1,199.37ab 1,284.25b 1,123.25ab 290.270 0.025 0.277 0.234 α-Amylase (U mg−1 prot) 41.42a 45.27ab 50.46bc 64.64c 7.330 0.016 0.013 0.890 Values in the same row with different superscript letters are significantly different (p < 0.05). Table 5.
Activity of digestive enzymes in largemouth bass fed with different feed formulations of G0, G10, G20, and G40
-
Item Groups Standard error of the
mean (SEM)p-value Polynomial contrasts G0 G10 G20 G40 Linear Quadratic Cat 1.01 1.28 1.33 1.00 0.218 0.352 0.955 0.090 Sod 0.98a 2.17b 1.80b 0.86a 0.254 0.002 0.390 0.000 IL-1β 1.02 0.95 1.19 1.24 0.271 0.695 0.336 0.756 TNF-α 1.09a 0.71a 1.03a 1.91b 0.287 0.016 0.016 0.014 IL-10 0.97a 1.91b 1.40ab 0.84a 0.278 0.018 0.334 0.005 TGF-β1 1.04 1.11 1.30 0.99 0.345 0.819 0.981 0.458 ZO-1 1.07 1.50 1.41 0.83 0.275 0.130 0.372 0.032 Occludin 0.98a 1.86c 1.67bc 1.13ab 0.248 0.020 0.743 0.003 Values in the same row with different superscript letters are significantly different (p < 0.05). Table 6.
The expression levels of genes related to intestinal antioxidant, inflammation, and tight junction proteins in largemouth bass fed with different feed formulations of G0, G10, G20, and G40
-
Item Groups Standard error of the
mean (SEM)p-value Polynomial contrasts G0 G10 G20 G40 Linear Quadratic Average read counts 65,065.50 61,368.75 61,463.25 62,560.25 4,057.936 0.783 0.574 0.420 Coverage index 99.97 99.97 99.97 99.97 0.063 0.237 0.077 0.418 Chao1 index 1,212.81a 2,529.88b 2,531.41b 2,877.57b 317.670 0.035 0.547 0.191 Ace index 1,220.11a 2,539.09b 2,537.61b 2,884.75b 361.250 0.023 0.076 0.416 Shannon index 5.31 5.94 5.78 5.65 0.840 0.633 0.276 0.726 Simpson index 0.85 0.91 0.88 0.90 0.078 0.871 0.636 0.765 Values in the same row with different superscript letters are significantly different (p < 0.05). Table 7.
The bacterial diversity indexes in the intestine of largemouth bass fed with different feed formulations of G0, G10, G20, and G40
Figures
(7)
Tables
(7)