


-
Biochar refers to a carbon-dense solid material produced through the thermal conversion of biomass under oxygen-restricted conditions[1]. Owing to its well-developed pore structure, high specific surface area, and abundant surface functional groups, biochar has been widely applied as an effective soil amendment for pollution remediation[2−4]. Over recent decades, biochar has attracted increasing attention as a soil-conditioning additive due to its capacity to improve nutrient utilization, enhance buffering capacity, and mitigate greenhouse gas (GHG) emissions, thereby highlighting its potential for restoring soil agronomic productivity[5].
More recently, biochar has been explored as a functional dietary supplement in livestock production, with accumulating evidence indicating its beneficial effects on growth performance and digestive health when incorporated into animal feed[6]. For instance, dietary supplementation with biochar has been reported to improve both egg yield and quality in laying hens, which may be attributed to its enrichment in essential minerals, such as calcium, potassium, and magnesium[7]. In addition, biochar supplementation has been shown to reduce the abundance of pathogenic bacteria, including Campylobacter hepaticus and Gallibacterium anatis, in hens, likely as a result of its adsorption capacity[8]. In aquaculture systems, striped catfish (Pangasius hypophthalmus) receiving a diet supplemented with 2% biochar exhibited significant improvements in body weight, survival rate, feed conversion ratio (FCR), and specific growth rate (SGR)[9].
Biochar applied as a feed additive is typically derived from a range of biomass resources, including rice straw[10,11] and woody residues[7,12,13]. Variations in biomass feedstock give rise to substantial differences in the physicochemical properties of the resulting biochar. Specifically, feedstock selection strongly influences key characteristics of biochar, such as ash content, specific surface area, and C/N ratio, which collectively determine its effectiveness as a feed additive in livestock production. For instance, woody biochar generally exhibits greater surface area and microporosity than biochar derived from rice plants, a contrast largely associated with the elevated ash content of rice-based biochar, which restricts micropore development, and consequently reduces surface area[14]. The well-developed pore structure and large surface area of biochar may promote the proliferation of methanotrophic microorganisms in the rumen, thereby facilitating anaerobic methane oxidation[15]. Consequently, biochar derived from different biomass sources should be systematically evaluated to assess their suitability and performance as feed additives.
Beyond its effects on animal growth performance and digestive health, biochar used as a feed additive has also been reported to contribute to the removal of environmental pollutants[16]. Previous studies have demonstrated that dietary biochar supplementation may stimulate the enrichment of methane-oxidizing microbial communities, thereby reducing methane production in the rumen[17]. Joseph et al. investigated the effects of dietary biochar supplementation in cattle on subsequent soil fertility. Their results indicated that feeding cattle a mixture of high-temperature wood biochar and molasses could potentially improve soil physicochemical properties[12]. The presence of the biochar additive was associated with increased concentrations of available phosphorus (P) and nitrogen (N) in soil[12]. However, most studies focus on the effects of biochar as a feed additive on soil and atmospheric environments, with few studies examining its effects on water environments, especially on aquaculture water quality. Excellent water quality is often crucial for fish appetite, activity, and overall health[16].
Largemouth bass (Micropterus salmoides), commonly referred to as California bass or black bass, is widely regarded as a high-value aquaculture species in China due to its fast growth rate, strong disease resistance, desirable flesh quality, and favorable taste[18]. In 2022, the total production of largemouth bass in China reached 802,486 tonnes, representing a 14.30% increase compared with the previous year[19]. Guangdong Province accounted for 382,190 tonnes of largemouth bass production in 2022, corresponding to 47.59% of the national total[20]. However, intensive largemouth bass aquaculture practices may lead to considerable challenges, including impaired growth performance, health disorders, and water pollution. A significant proportion of nutrients from traditional feeds is not absorbed by fish and enters the water, leading to water quality deterioration and eutrophication. Therefore, it is necessary to formulate a cost-effective and eco-friendly diet for the sustainable ecological aquaculture of largemouth bass. The high-value utilization of natural organic biomass—biochar—through its potential use as an aquaculture feed additive to develop functional compound feed with biochar represents an effective solution to these challenges.
In this study, biochar was produced from mulberry branch waste, as mulberry trees (Morus alba L.) are widely planted near fish ponds in southern China. The mulberry branch-derived biochar was provided as a feed additive to largemouth bass. The objective of this study was to assess the effects of mulberry branch-derived biochar on: (1) growth performance; (2) intestinal health; and (3) aquaculture water quality.
-
Mulberry branch-derived biochar was prepared following the procedure described in our previous studies[21]. Briefly, mulberry branches were milled to pass through a 2-mm sieve and subsequently pyrolyzed at 550 °C in a biomass carbonization furnace under oxygen-limited conditions. After pyrolysis, the resulting biochar was allowed to cool in a steel container, then sieved through a #200 mesh (< 75 µm), and stored in sealed plastic bags prior to use. The basic physicochemical properties of the mulberry branch–derived biochar are summarized in Table 1.
Table 1. Physical and chemical properties of mulberry branch-derived biochar
Sample pH C % H % O % N % Cation exchange capacity
(cmol kg−1)Zeta potential
(MV)BET surface area
(m2 g−1)Micropore volume
(cm3 g−1)Total pore volume at
P/P0 = 0.985 (cm3 g−1)Biochar 10.15 72.4 2.70 14.99 1.51 22.80 −38.35 3.11 3.03E-04 5.06E-03 The experimental diets were formulated with fish meal, soybean meal, and soy protein concentrate serving as the principal protein sources, while fish oil, soybean oil, and lecithin were used as the main lipid sources. Four dietary treatments containing different levels of mulberry branch-derived biochar (0, 10, 20, and 40 g kg−1) were prepared and designated as G0, G10, G20, and G40, respectively. The selected biochar inclusion levels were determined with reference to a previous study conducted on gilthead seabream (Sparus aurata)[22]. All feed ingredients were finely ground and passed through a 60-mesh sieve, after which micro-ingredients were incorporated using a stepwise dilution approach. After thorough mixing, the feed was processed into pelletized puffed feed using a small-scale extruder (Huaqiang Extrusion Machinery Model T52, Guangdong, China), producing pellets of 1.5 mm in diameter (extrusion temperature 110 °C). After extrusion, the pellets were coated with oil, dried at 55 °C, allowed to cool naturally, and subsequently stored in sealed bags at −20 °C until further use. The feed formulation and nutritional levels are presented in Tables 2 and 3.
Table 2. Ingredients of the experimental diets (DM basis) %
Ingredient G0 G10 G20 G40 Microcrystalline cellulose 4.00 3.00 2.00 0.00 Mulberry branch-derived biochar 0.00 1.00 2.00 4.00 Fish meal 45.00 45.00 45.00 45.00 Soybean meal 16.00 16.00 16.00 16.00 Soybean protein concentrate 12.60 12.60 12.60 12.60 α-starch 12.50 12.50 12.50 12.50 Fish oil 2.00 2.00 2.00 2.00 Soybean oil 3.50 3.50 3.50 3.50 Lecithin 1.00 1.00 1.00 1.00 Vitamin C phosphate ester 0.30 0.30 0.30 0.30 Vitamin premixa 0.10 0.10 0.10 0.10 Mineral premixb 0.50 0.50 0.50 0.50 Ca(H2PO4)2 1.50 1.50 1.50 1.50 Choline chloride 0.50 0.50 0.50 0.50 Betaine 0.50 0.50 0.50 0.50 Total 100.00 100.00 100.00 100.00 a Vitamin premix (composition kg−1): VA 3,200,000 IU, VD 1,600,000 IU, VB12 0.016 g, VB1 4 g, VK 4 g, VB6 4.8 g, VB2 8 g, VE 16 g, biotin 0.064 g, folic acid 1.28 g, calcium pantothenate 16 g, nicotinic acid 28 g, inositol 40 g. b Mineral premix (composition kg−1): NaSeO3 0.004 g, Met-Co 0.25 g, FeSO4·H2O 1 g, Met-Cu 1.5 g, ZnSO4·H2O 10 g, MgSO4·H2O 12 g, Ca( IO3) 29 g, KCl 36 g. Table 3. Nutritional levels of the experimental diets (DM basis)%
Nutrient level G0 G10 G20 G40 Crude protein 45.81 45.83 45.80 45.79 Crude lipid 9.25 9.21 9.30 9.32 Ash 10.46 10.42 10.40 10.48 Moisture 7.12 7.09 7.10 7.13 Feeding experiment
-
The tested fish were provided by the Sanshui Baijin Aquaculture Seed Company in Foshan City (China). They were fed with a temporary diet for a one-week acclimatization period. A total of 480 healthy largemouth bass (average weight 3.31 ± 0.01 g) were selected and randomly assigned to four experimental groups with four replicates per group (30 fish per replicate). The four groups were fed the respective feed formulations shown in Table 2. The feeding trial was carried out indoors at the Aquaculture Research Laboratory of the Animal Science Research Institute, Guangdong Academy of Agricultural Sciences (Guangdong, China), with each treatment group maintained in an independent recirculating aquaculture system. Each system comprised four experimental tanks and one filtration tank, with an independent water system per group. The experimental tanks had a total volume of 200 L (80 cm in diameter and 70 cm in height), with an effective water volume of 150 L, and a water inflow rate of 1.5 L min−1. Fish were fed to apparent satiation twice daily at 09:00 and 18:00. The experiment was conducted under natural lighting conditions, and waste and feces were removed from each group separately.
Sample collection
-
At the 42-d trial end, feeding was stopped for 24 h prior to sampling. Subsequently, fish from each experimental group were counted and weighed. Eight fish were randomly selected from each replicate group to measure body length and body weight. After dissection on ice, the visceral mass and liver weight were measured to calculate CF, viscerosomatic index (VSI), and hepatosomatic index (HSI). Three fish from each tank were randomly selected, and the entire intestine was collected and stored at −80 °C for subsequent analysis of intestinal digestive enzyme activity. For intestinal histomorphological analysis, the mid-intestine from three fish per tank was excised and fixed in a 4% formaldehyde solution. For intestinal microbiota analysis, the entire intestine from an additional three fish per tank were collected. All samples described above were collected on the same sampling day.
Water samples (500 mL) were collected on days 1, 7, 14, 21, 28, 35, and 42 at a depth of 30 cm below the water surface at the center of each tank. These samples were analyzed for ammonia, total nitrogen, and nitrite content.
Assessment parameters
Calculation of growth performance and morphological indices
-
$ \text{Weight gain ratio}\ (\rm{WGR},\text{%})=100\times\dfrac{[\rm{FBW}\ (\rm{g})-\rm{IBW}\ (\rm{g})]}{\rm{IBW\ }(\rm{g})} $ $ \begin{split} \text{Specific growth rate } & (\rm{SGR},\text{%}/\rm{day})= \\ &100\times \dfrac{[\text{Ln FBW}\ (\rm{g})-\text{Ln IBW}\ (\rm{g})]}{\text{Number of days in the experiment}\ (\rm{d})} \end{split} $ $ \begin{split} & \text{Feed conversion ratio}\; (\rm{FC})= \\ &\dfrac{\text{Feed intake}\ (\rm{g})}{[\text{Final weight}\ (\rm{g})\ +\text{ Weight of dead fish}\ (\rm{g})-\text{Initial weight}\ (\rm{g})]} \end{split} $ $ \text{Viscerosomatic index}\; (\rm{VSI},\text{%})=100\times\dfrac{\text{Weight of viscera}\ (\rm{g})}{\rm{FBW\ }(\rm{g})} $ $ \text{Hepatosomatic index}\ (\rm{HSI},{\text{%}}) \ =100\times\dfrac{\text{Weight of Hepatopancrea}\ (\rm{g})}{\rm{FBW}\ (\rm{g})} $ $ \text{Condition factor}\ (\rm{CF},\text{ g cm}^{-3})=100\times\dfrac{\rm{FBW}\ (\rm{g})}{\text{Body length}\ (\rm{cm})^3} $ $ \text{Survival rate}\; (\rm{SR},\text{%})=100\times\dfrac{\text{Number of fish at the end}}{\text{Initial number of fish}} $ $ \begin{gathered}\text{Feed intake }(\rm{FI},\rm{\ g}/\rm{fish})=\text{Feed consumed}\ (\rm{g})/ \\ (\text{Final fish number}+\text{Initial fish number})/2\end{gathered} $ IBW and FBW represent the initial average body weight and final average body weight of the experimental fish, respectively.
Intestinal tissue morphology observation
-
The intestine was separated from the visceral mass, and a middle segment of approximately 1.0 cm was chosen. Following fixation in 4% paraformaldehyde for 24 h, intestinal samples were trimmed, dehydrated, embedded in paraffin, sectioned, stained with hematoxylin and eosin (H&E), and mounted for histological examination. Histological images were captured using an optical microscope (PANNORAMIC DESK/MIDI/250/1000, 3DHISTECH, Hungary) and an upright bright-field microscope (Eclipse Ci-L, Nikon, Japan) for morphological and pathological evaluations. The evaluated morphological parameters included villus height, villus width, and thickness of the muscular layer.
Intestinal digestive enzyme assay
-
The activities of trypsin (A080-2-2), lipase (A054-2-1), and amylase (C016-1-1) in the intestine were determined using commercial assay kits (Nanjing Jiancheng Bioengineering Institute, Nanjing, China).
Intestinal gene expression
-
Total RNA was extracted from intestinal samples using TRIzol reagent (Thermo Fisher Scientific, Waltham, MA, USA), and RNA quality and concentration were subsequently assessed. Following cDNA synthesis using the HiScript RT SuperMix qRT-PCR kit (Vazyme, Nanjing, China), quantitative real-time PCR was conducted in a 20 µL reaction system comprising 10.0 µL of 2× Taq Pro Universal SYBR qRT-PCR MasterMix, 1.0 µL of cDNA template, 0.8 µL of PCR primers (10 µM), and 8.2 µL of ddH2O. The qRT-PCR amplification program was set to run at 95 °C for 30 s, followed by 40 cycles of 10 s at 95 °C, and 30 s at 60 °C. Genes expression levels were determined using the 2−ΔΔCᴛ method[23]. The primer sequences are shown in Supplementary Table S1.
Analysis of intestinal microbiota
-
Total genomic DNA of the intestinal microbial community was extracted using a NucleoSpin 96 Soil DNA kit (Macherey-Nagel, Germany) following the manufacturer's instructions. Primers targeting the V3–V4 hypervariable region of the bacterial 16S rRNA gene were used for PCR amplification of gut microbiota DNA. The primer sequences were as follows: forward primer F (ACTCCTACGGGGGGCAGCA), and reverse primer R (GGACTACHVGGGTWTCTAAT). The PCR amplification was conducted utilizing an ABI GeneAmp® 9700 thermal cycler, following this sequence: 95 °C for 3 min; followed by 27 cycles of 30 s at 95 °C, 30 s at 95 °C, and 30 s at 72 °C; concluded with a final extension at 72 °C for 10 min, after which samples were maintained at 4 °C. Purification of PCR products was carried out with a DNA gel recovery and purification kit (PCR Clean-Up Kit, YUHUA, China), and the quantification was performed using a Qubit 4.0 fluorometer (Thermo Fisher Scientific, USA). A sequencing library was generated from purified PCR products using the NEXTFLEX® Rapid DNA-Seq Kit. Following the ligation of adapters, magnetic beads were utilized to eliminate self-ligated fragments, and subsequently, PCR amplification was performed to enrich the templates of the library. The final library was obtained through magnetic bead purification. High-throughput sequencing was carried out on an Illumina PE300/PE250 platform (Shanghai Meiji Biopharmaceutical Technology Co., Ltd.).
Water quality parameter determination
-
Total nitrogen content was analyzed using the phenol disulfonic acid spectrophotometric method[24]. Ammonia content was measured using the Nessler reagent colorimetric method[25]. The determination of nitrite content was carried out using a spectrophotometric method[26].
Data processing
-
All experimental data were analyzed using SPSS 22.0 software, and one-way analysis of variance (ANOVA) was performed. Duncan's multiple range test was applied when homogeneity of variance was satisfied, whereas Dunnett's T3 test was employed when the assumption of homogeneity was violated. The polynomial comparison method was used to analyze the linear and quadratic relationship between the concentration of mulberry branch derived-biochar added to feed, with p < 0.05 as the discriminant criterion for significant differences. The linear contrast was applied to assess whether the indicators exhibited a monotonic trend, while the quadratic contrast was used to detect non-linear response patterns such as peaks or inflection points. This method can more effectively reveal the underlying trends in the data, offering an advantage over mere multiple comparisons, and aids in defining the optimal dosage of biochar and its potential threshold. Statistical power analysis was performed using G*Power 3.1 software to evaluate sample size sensitivity and ensure the robustness of the statistical results.
-
Growth performance parameters of largemouth bass fed diets containing different levels of biochar are summarized in Table 4. The G10 group (1% biochar) exhibited the highest values for WGR, SGR, SR, CF, VSI, and HSI, and the lowest value for FI among all treatments. These results indicate that dietary biochar supplementation may improve feed utilization efficiency, thereby promoting the growth performance of aquatic animals. This phenomenon has been observed in studies on juvenile Japanese flounder (Paralichythys olivaceus), striped catfish (Pangasius hypophthalmus), and juvenile Nile tilapia (Oreochromis niloticus)[27−29]. In the present study, dietary inclusion of 1% biochar (G10) resulted in a slight improvement in the growth performance of largemouth bass. These findings suggest that an appropriate inclusion level of mulberry branch–derived biochar may exert a beneficial effect on the growth performance of largemouth bass. In addition, the results in Table 4 also show that the CF significantly decreased in 2% and 4% biochar addition treatment (p < 0.05).
Table 4. The growth performance of largemouth bass fed with different feed formulations
Items Groups Standard error of the
mean (SEM)p-value Polynomial contrasts G0 G10 G20 G40 Linear Quadratic IBW (g) 3.310 3.300 3.310 3.30 0.012 0.864 0.721 0.676 FBW (g) 34.27 34.53 34.04 33.97 1.618 0.190 0.319 0.110 WGR (%) 936.47 945.99 927.38 920.31 12.300 0.188 0.340 0.098 SGR (%/d) 5.57 5.58 5.54 5.53 0.037 0.182 0.316 0.097 FC 0.77 0.77 0.78 0.78 0.016 0.195 0.334 0.201 SR (%) 96.23 96.29 95.99 95.89 1.600 0.168 0.539 0.183 CF (g cm−3) 3.52b 3.66b 3.26a 3.17a 0.095 0.022 0.035 0.181 VSI (%) 7.56 7.61 7.56 7.55 0.170 0.901 0.468 0.954 HSI (%) 2.41 2.51 2.26 2.17 0.142 0.129 0.053 0.355 FI (g/fish) 24.11 23.99 24.51 24.61 1.312 0.172 0.309 0.092 Values in the same row with different superscript letters are significantly different (p < 0.05). The same as below. WGR: weight gain ratio; SGR: specific growth rate; FC: feed conversion ratio; VSI: viscerosomatic index; HSI: hepatosomatic index; CF: condition factor; SR: survival rate; FI: feed intake. Effect of mulberry branch-derived biochar on intestinal tissue morphology and digestive enzymes of largemouth bass
-
The intestine serves as the primary site for nutrient digestion and absorption and is therefore essential for animal growth and development[30]. Previous studies found that the unique porous structure of biochar stimulated the development of intestinal villi, enhancing the intestinal digestive capacity and absorption efficiency[31]. The intestinal histomorphological characteristics of largemouth bass observed in this study are presented in Supplementary Table S2 and Supplementary Fig. S1. Dietary supplementation with mulberry branch–derived biochar tended to increase intestinal villus height, villus width, and muscle layer thickness in largemouth bass. Compared with the control group (G0), fish receiving different levels of biochar exhibited higher villus length, villus width, and muscle layer thickness; however, these differences were not statistically significant (p > 0.05). Similar trends have also been reported in loaches (Paramisgurnus dabryanus) and Nile tilapia (Oreochromis niloticus)[32,33].
Intestinal digestive enzymes, including amylase, trypsin, and lipase, are important indicators of nutrient digestion capacity, as their activities are positively associated with feed digestion efficiency[34]. Currently, research on the impact of biochar supplementation in feed on the activity of animal intestinal digestive enzymes is still in its infancy. Few studies showed that biochar positively affects the digestibility of feed, as seen in species like catla[35], steers[36], dairy ewes[37], and big sturgeon (Huso huso)[38]. As shown in Table 5, dietary mulberry branch–derived biochar supplementation increased intestinal amylase and trypsin activities in largemouth bass. Specifically, fish in the G20 and G40 groups exhibited significantly higher intestinal trypsin and amylase activities compared with the control group (p < 0.05).
Table 5. Activity of digestive enzymes in largemouth bass fed with different feed formulations of G0, G10, G20, and G40
Item Groups Standard error of the
mean (SEM)p-value Polynomial contrasts G0 G10 G20 G40 Linear Quadratic Lipase (U g−1 prot) 11.38ab 14.92b 10.77a 10.96a 2.850 0.028 0.584 0.030 Trypsin (U mg−1 prot) 994.73a 1,199.37ab 1,284.25b 1,123.25ab 290.270 0.025 0.277 0.234 α-Amylase (U mg−1 prot) 41.42a 45.27ab 50.46bc 64.64c 7.330 0.016 0.013 0.890 Values in the same row with different superscript letters are significantly different (p < 0.05). Effect of mulberry branch-derived biochar on intestinal gene expression of largemouth bass
-
The expression levels of genes associated with intestinal antioxidant capacity, inflammatory responses, and tight junction proteins in largemouth bass are summarized in Table 6. Compared with the control group, sod and Occludin expression levels were significantly upregulated in the G10 and G20 groups (p < 0.05), whereas TNF-α expression was significantly elevated in the G40 group (p < 0.05). Additionally, IL-10 expression was significantly increased in the G10 group (p < 0.05). No substantial variations in the expression levels of IL-1β, ZO-1, cat, and TGF-β1 were noted among groups (p > 0.05).
Table 6. The expression levels of genes related to intestinal antioxidant, inflammation, and tight junction proteins in largemouth bass fed with different feed formulations of G0, G10, G20, and G40
Item Groups Standard error of the
mean (SEM)p-value Polynomial contrasts G0 G10 G20 G40 Linear Quadratic Cat 1.01 1.28 1.33 1.00 0.218 0.352 0.955 0.090 Sod 0.98a 2.17b 1.80b 0.86a 0.254 0.002 0.390 0.000 IL-1β 1.02 0.95 1.19 1.24 0.271 0.695 0.336 0.756 TNF-α 1.09a 0.71a 1.03a 1.91b 0.287 0.016 0.016 0.014 IL-10 0.97a 1.91b 1.40ab 0.84a 0.278 0.018 0.334 0.005 TGF-β1 1.04 1.11 1.30 0.99 0.345 0.819 0.981 0.458 ZO-1 1.07 1.50 1.41 0.83 0.275 0.130 0.372 0.032 Occludin 0.98a 1.86c 1.67bc 1.13ab 0.248 0.020 0.743 0.003 Values in the same row with different superscript letters are significantly different (p < 0.05). Effect of mulberry branch-derived biochar on intestinal microbiota of largemouth bass
Analysis of the diversity of intestinal microbiota
-
The intestinal microbiota is essential for maintaining intestinal motility, nutrient digestion and absorption, defense against pathogenic invasion, nutrient exchange, and immune regulation[33]. A Venn diagram was used to compare the number of operational taxonomic units (OTUs) in the intestinal microbiota of largemouth bass with and without dietary biochar supplementation (Supplementary Fig. S2). As shown in Supplementary Fig. S2, fish fed biochar-supplemented diets exhibited a markedly higher number of OTUs in their intestinal microbiota compared with the control group. Moreover, OTU numbers tended to increase with increasing dietary biochar inclusion levels. Unique OTUs accounted for 80.0%, 83.6%, 83.4%, and 83.5% of the totals in G0, G10, G20, and G40, respectively. The shared numbers of OTUs accounted for 5.1%, 2.4%, 2.3%, and 2.0% of the total in G0, G10, G20, and G40, respectively. This indicated biochar may enhance the attachment ability of microorganisms and increase the growth of specific microorganisms.
Moreover, alpha and beta diversity analyses were performed to quantify the change in diversity to support the observed differences in the number of OTUs. The rarefaction curves are shown in Fig. 1. The average read counts per sample and alpha diversity indices are presented in Table 7. All the treatments had similar values in the indices of Coverage, Shannon, and Simpson (Table 7). In contrast, both Chao1 and Ace indices were significantly higher in the biochar-supplemented groups (G10, G20, and G40) than in the control group (G0) (p < 0.05), indicating that biochar supplementation significantly increased bacterial richness in the largemouth bass intestine. Beta diversity analysis compares the microbial community differences in species diversity among different groups. The differences in microbial community structure can be explained by beta diversity analysis. PCoA based on the Bray–Curtis distance matrix was performed to visualize intergroup differences in microbial community structure (Fig. 2). As illustrated in Fig. 2, the first and second principal coordinates explained 65.72% and 23.24% of the total variation, respectively. Microbial communities in the G0, G10, and G20 groups exhibited relatively compact distributions with high similarity, whereas those in the G40 group were more dispersed, indicating greater variability and pronounced differences in community composition. This demonstrated that high biochar levels may introduce environmental heterogeneity in the intestines, affecting microbial colonization patterns. Generally, reduced diversity of gut microbiota might lead to decreased stability of the bacterial community and increased disease risk in the host[39]. A previous study proved that continuous administration of 0.1% body-weight straw biochar for five days in rats increased the abundance of cecal microbial communities and reduced bacteroidota by 57.03% since the rich porous structure of biochar provides an ideal environment for microbial growth, and its consumption can alter the gut microbiota[40]. Consistent with these findings, the Venn diagram together with alpha- and beta-diversity analyses in the present study demonstrated that dietary mulberry branch–derived biochar significantly enhanced intestinal microbial richness and diversity.
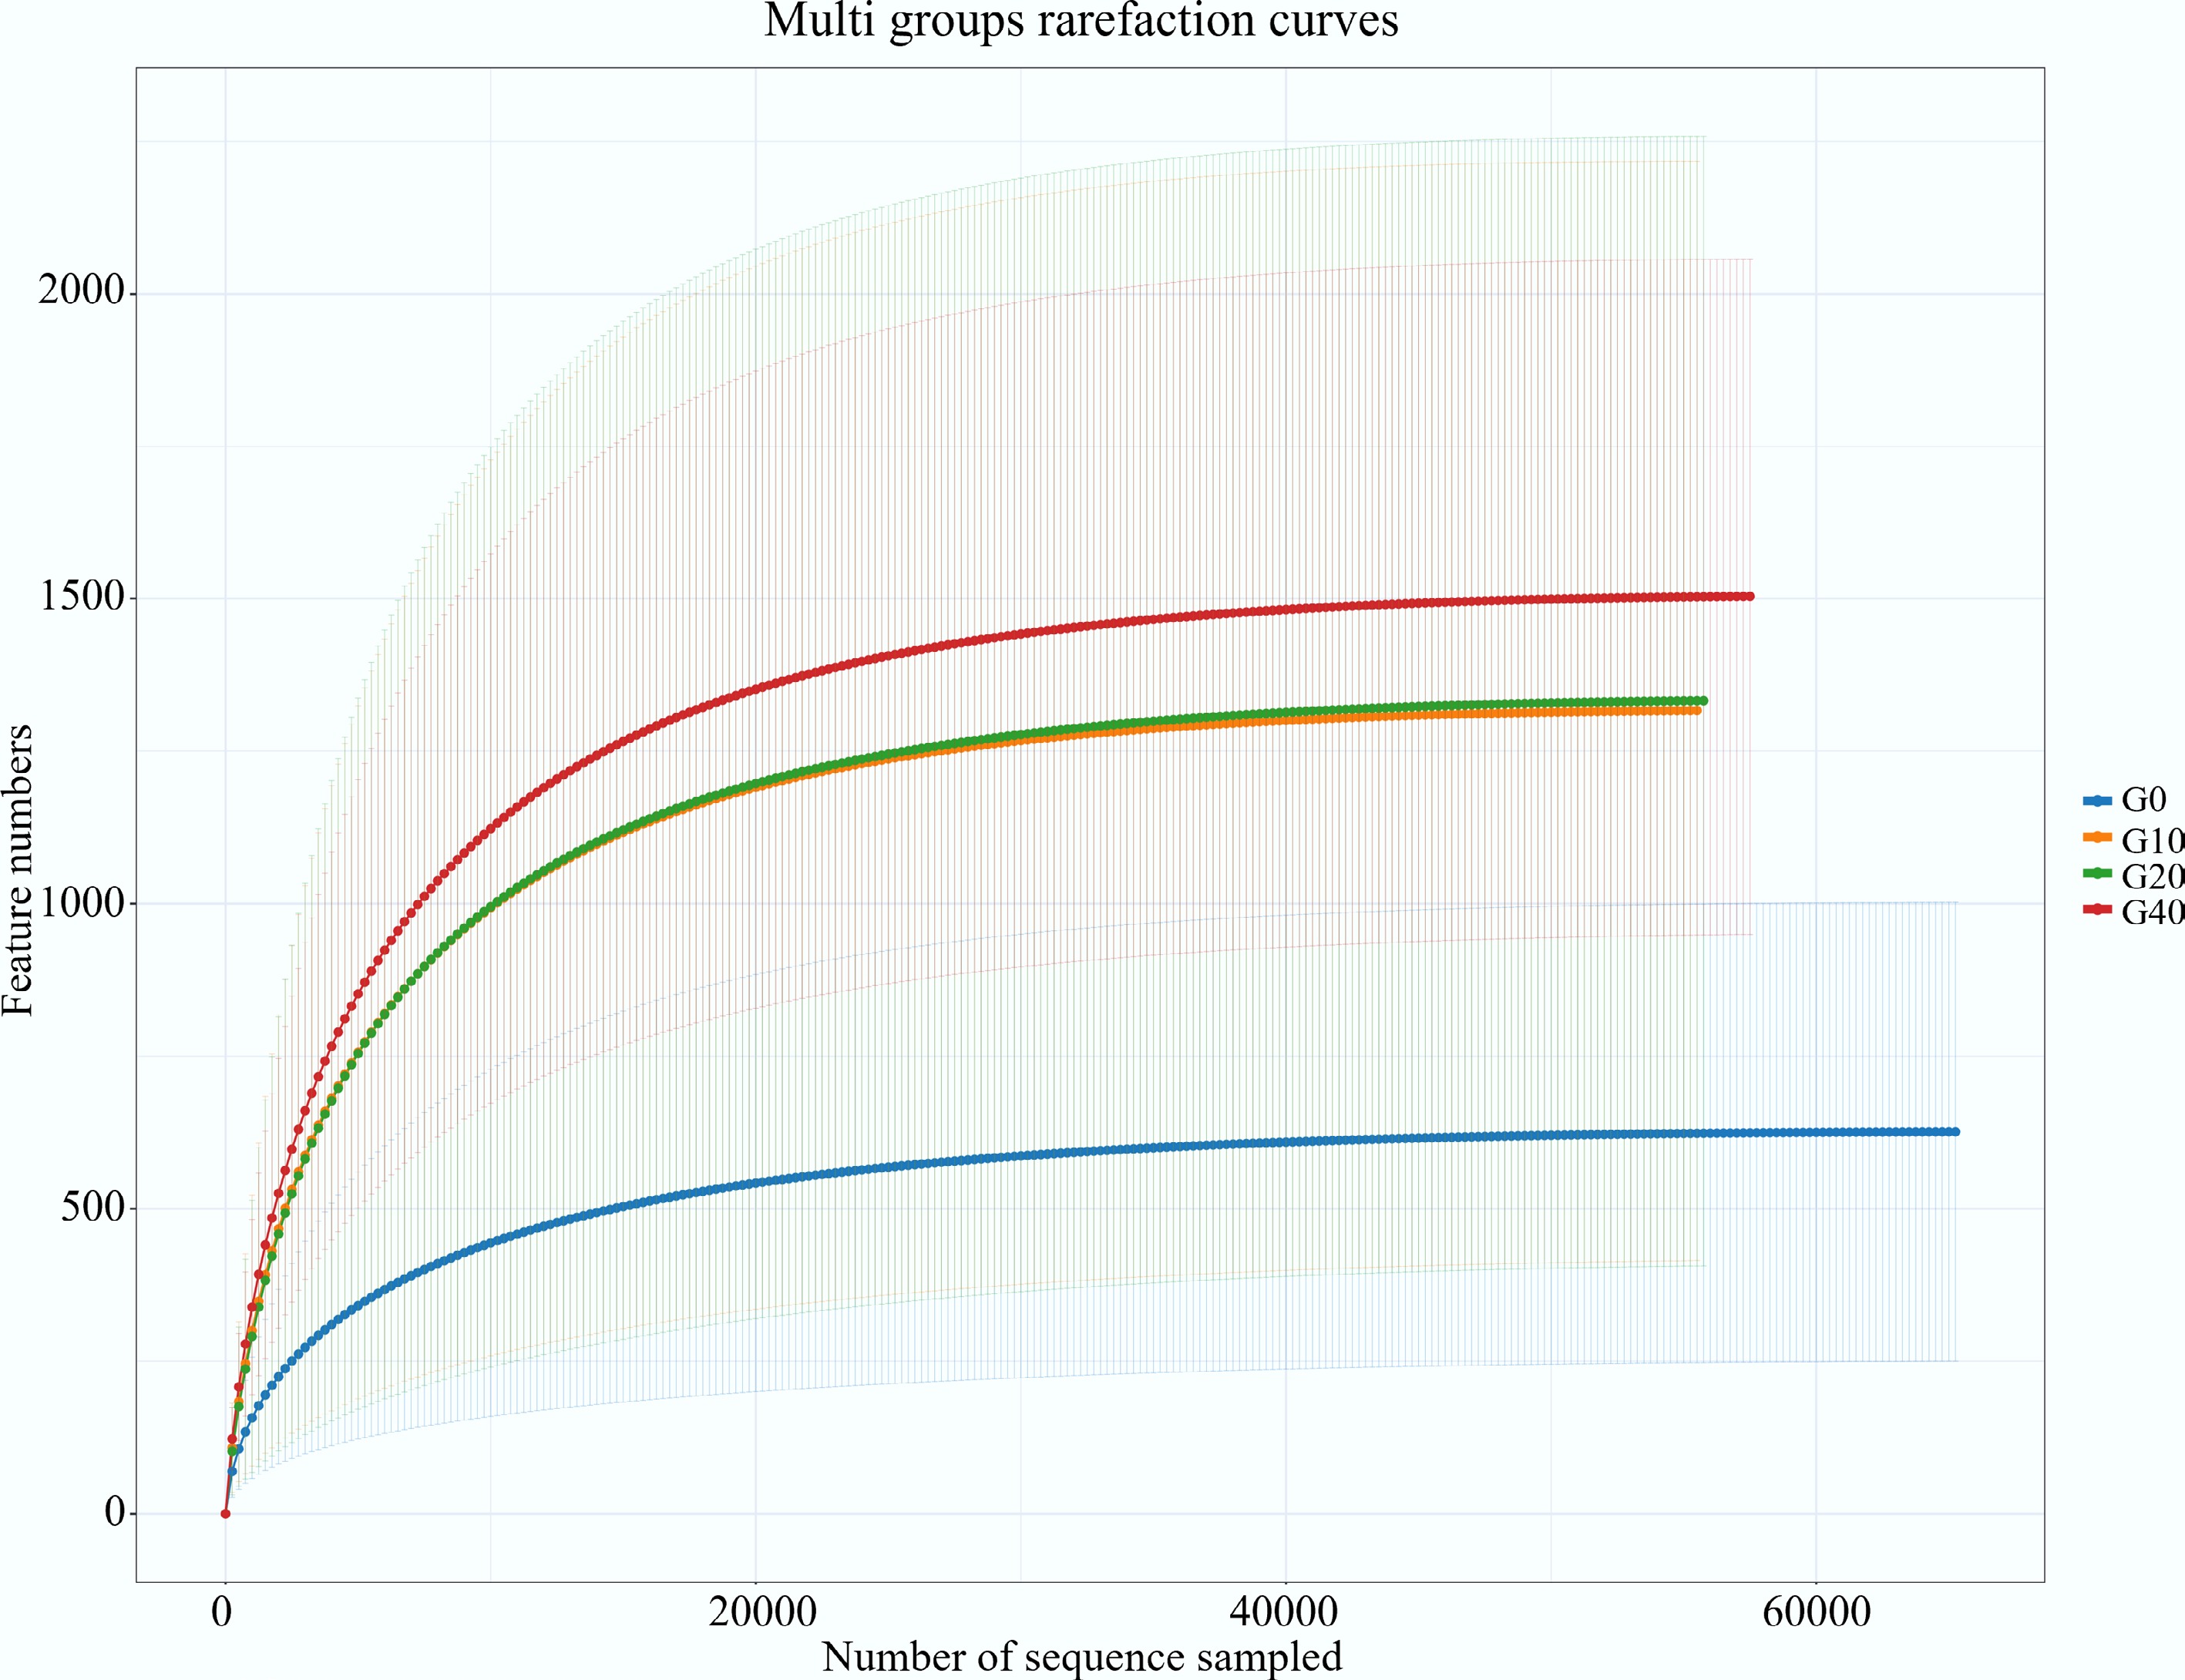
Figure 1.
Rarefaction curves of intestinal microbiota of largemouth bass fed with different feed formulations (G0, G10, G20, and G40).
Table 7. The bacterial diversity indexes in the intestine of largemouth bass fed with different feed formulations of G0, G10, G20, and G40
Item Groups Standard error of the
mean (SEM)p-value Polynomial contrasts G0 G10 G20 G40 Linear Quadratic Average read counts 65,065.50 61,368.75 61,463.25 62,560.25 4,057.936 0.783 0.574 0.420 Coverage index 99.97 99.97 99.97 99.97 0.063 0.237 0.077 0.418 Chao1 index 1,212.81a 2,529.88b 2,531.41b 2,877.57b 317.670 0.035 0.547 0.191 Ace index 1,220.11a 2,539.09b 2,537.61b 2,884.75b 361.250 0.023 0.076 0.416 Shannon index 5.31 5.94 5.78 5.65 0.840 0.633 0.276 0.726 Simpson index 0.85 0.91 0.88 0.90 0.078 0.871 0.636 0.765 Values in the same row with different superscript letters are significantly different (p < 0.05). 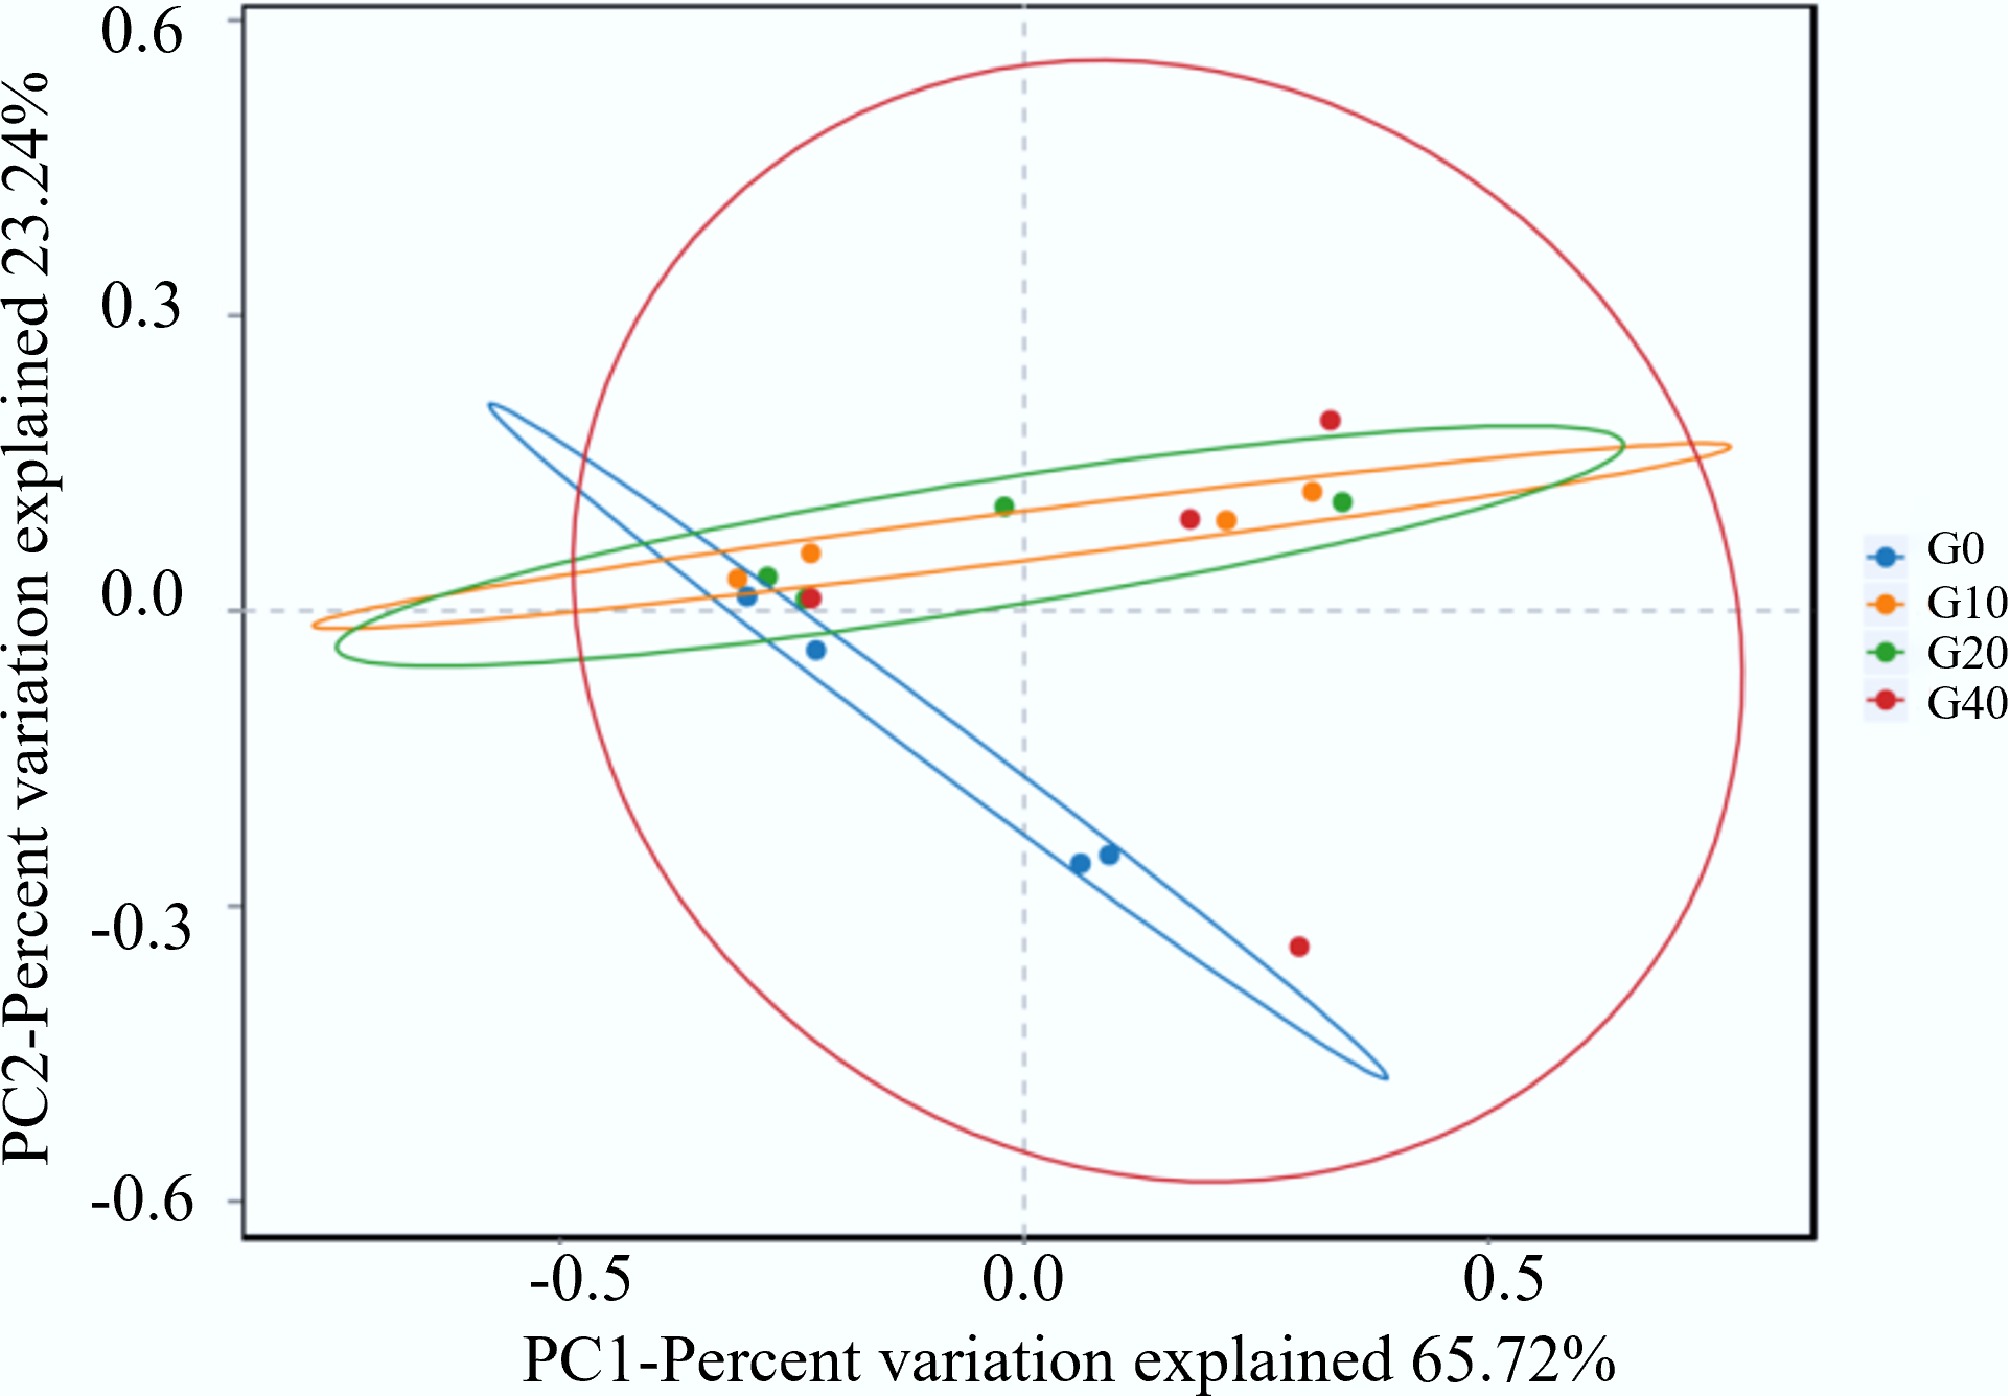
Figure 2.
Beta diversity of largemouth bass gut microbiota.
Analysis of species composition of intestinal microbiota
-
The relative abundance of the intestinal microbiota of largemouth bass at the phylum level is illustrated in Fig. 3. Five phyla, including Proteobacteria, Firmicutes, Bacteroidota, Actinobacteriota, and Acidobacteriota, collectively account for over 90% of the intestinal microbiota in each group. Proteobacteria represented the dominant phylum in the largemouth bass intestine, accounting for 41.7%–63.2% of the total OTUs across all groups. Compared with the control group (G0), the relative abundance of Proteobacteria was significantly lower in the G40 group (p < 0.05). Meanwhile, Proteobacteria, Firmicutes, and Bacteroidota were the three dominant bacterial groups in the control group (94.4%), whereas Proteobacteria, Firmicutes, and Actinobacteriota dominated in the groups supplemented with biochar (78.1%–86.7%). Actinobacteriota in the intestines of largemouth bass were 4.62-, 3.95-, and 5.62-fold higher in G10, G20, and G40, respectively, compared to G0. This implied that biochar has a selective effect on gut bacterial composition. Actinobacteriota are known for their roles in nutrient metabolism, production of bioactive compounds, and immune modulation[41]. Their enrichment may contribute to improved gut health, immune responses, or metabolic functions in largemouth bass.
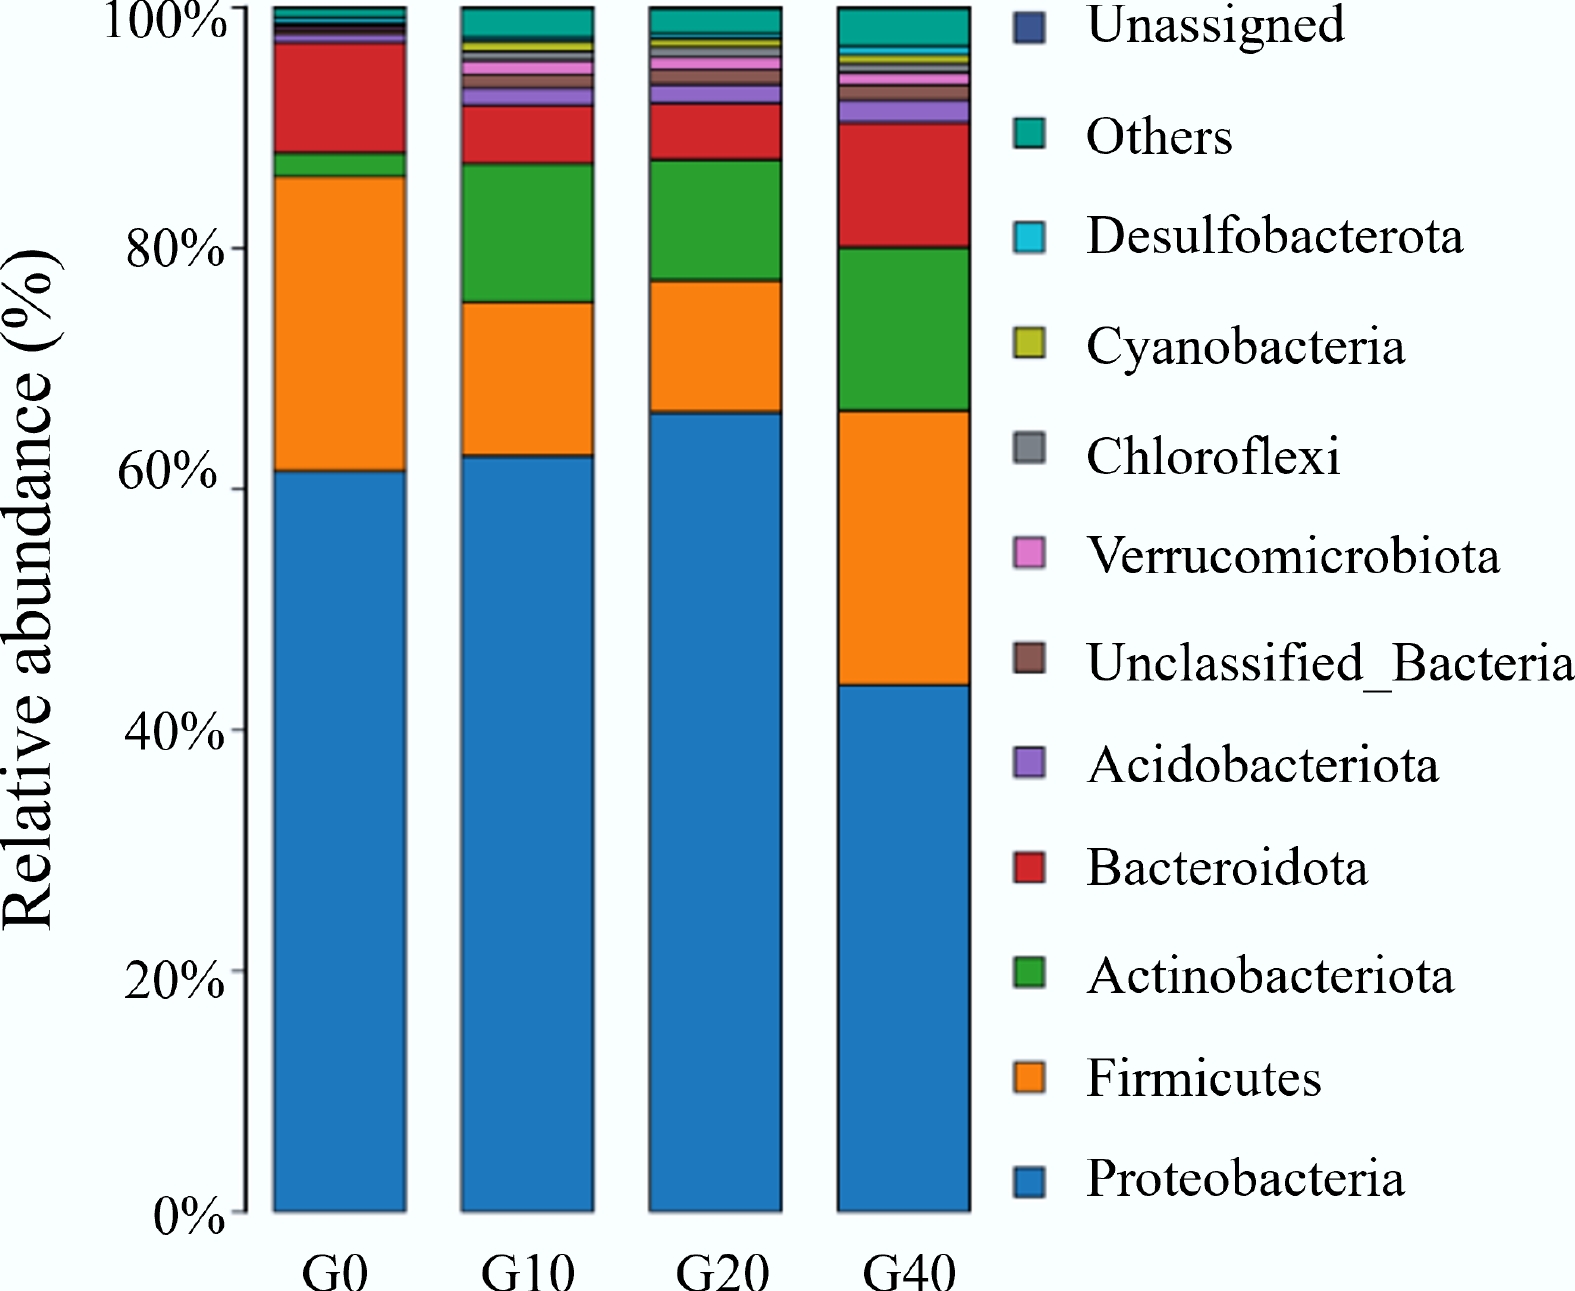
Figure 3.
Relative abundance at phylum levels of the intestinal microbiota of largemouth bass fed with different feed formulations (G0, G10, G20, and G40).
The Firmicutes/Bacteroidetes (F : B) ratio is related to the amount of energy absorbed from food[42]. As shown in Fig. 4, the F : B value of the mulberry branch-derived biochar addition groups was lower than in the control group (p < 0.05). This observation is consistent with the experiment of rats administered with 0.1% straw biochar[39]. It is indicated that the feed supplementation of mulberry branch-derived biochar may promote energy absorption and improve the fat metabolism of largemouth bass.
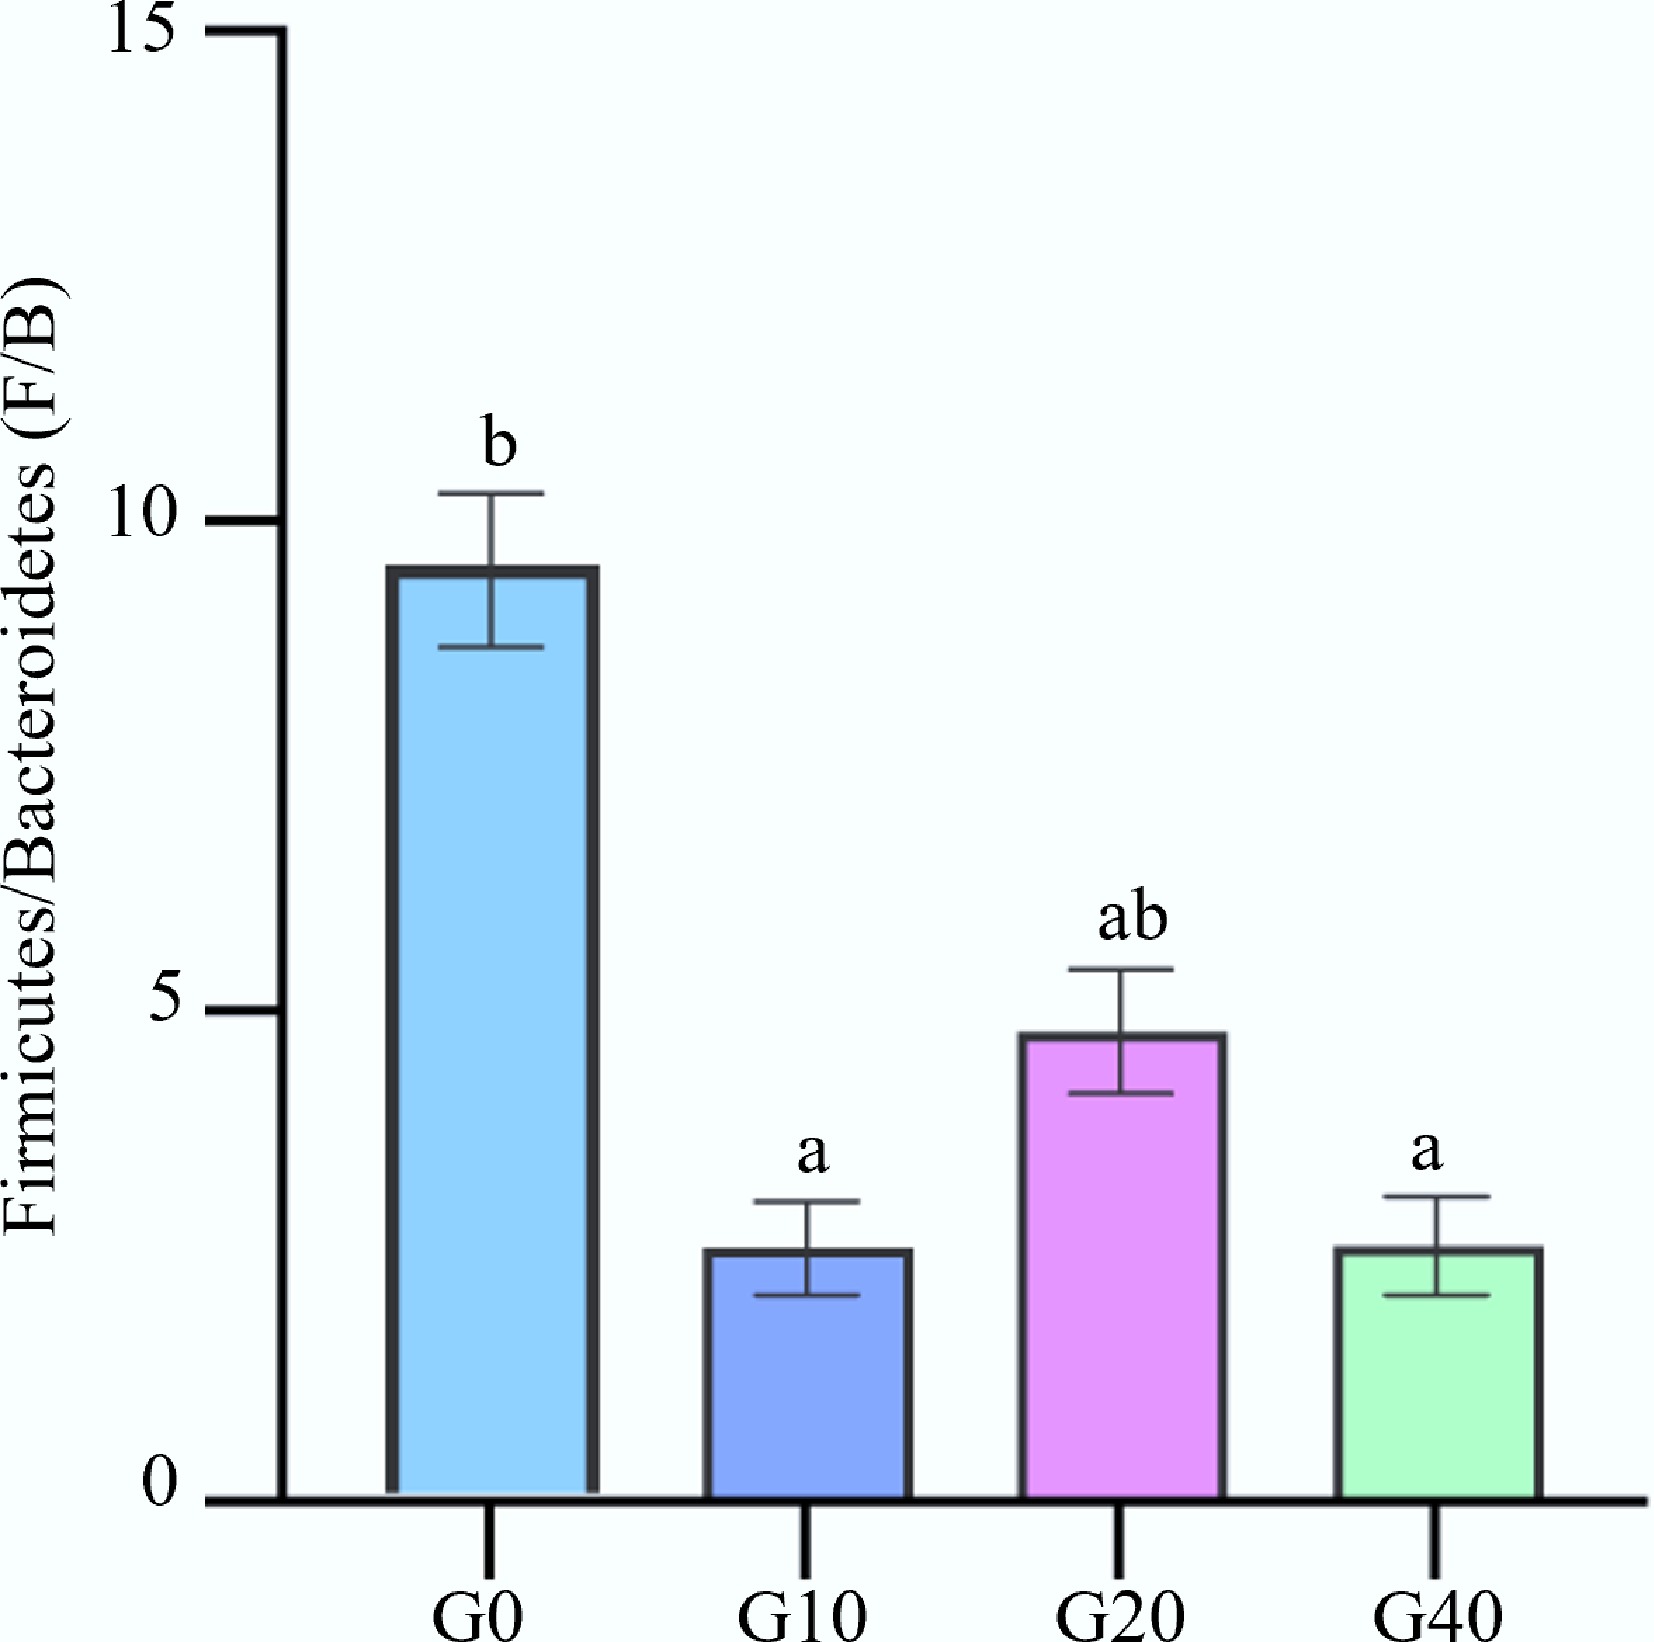
Figure 4.
Effect of biochar addition on Firmicutes/Bacteroidetes values (F : B). Values within the same row sharing a common superscript letter are not significantly different (p > 0.05), while values with different superscript letters differ significantly (p < 0.05).
The relative abundance of the intestinal microbiota at genus levels is illustrated in Fig. 5. As shown in Fig. 5, the dominant bacterial groups at the genus level detected were Plesiomonas, Klebsiella, Aeromonas, Bacteroides, Lactobacillus, Mycoplasma, unclassified Enterobacterales, unclassified Microbacteriaceae, unclassified Bacteria, and unclassified Peptostreptococcaceae. Compared with the control group, the relative abundance of Plesiomonas and Mycoplasma significantly reduced in the G40 group. It was reported that the application of biochar to macrophages in vitro for 24 h resulted in a linear decrease in the expression levels of inflammatory cytokines TNF-α and IL-6 as the biochar level increased[43]. Biochar plays a role in alleviating inflammation, interacting with immune cells to modulate their activity. Plesiomonas, a conditionally pathogenic bacterium, is associated with diarrhea and enteritis[44]. Mycoplasma, which is frequently pathogenic in aquatic animals, can impair host immune function and exacerbate disease progression[45]. In the present study, compared with the control group, the relative abundance of Plesiomonas and Mycoplasma significantly decreased in the groups supplemented with mulberry branch-derived biochar. These findings indicate that mulberry branch–derived biochar may improve intestinal microbiota structure by reducing the relative abundance of pathogenic bacteria, alleviating inflammatory responses in vivo, and decreasing microbial stimulation of the intestinal environment.
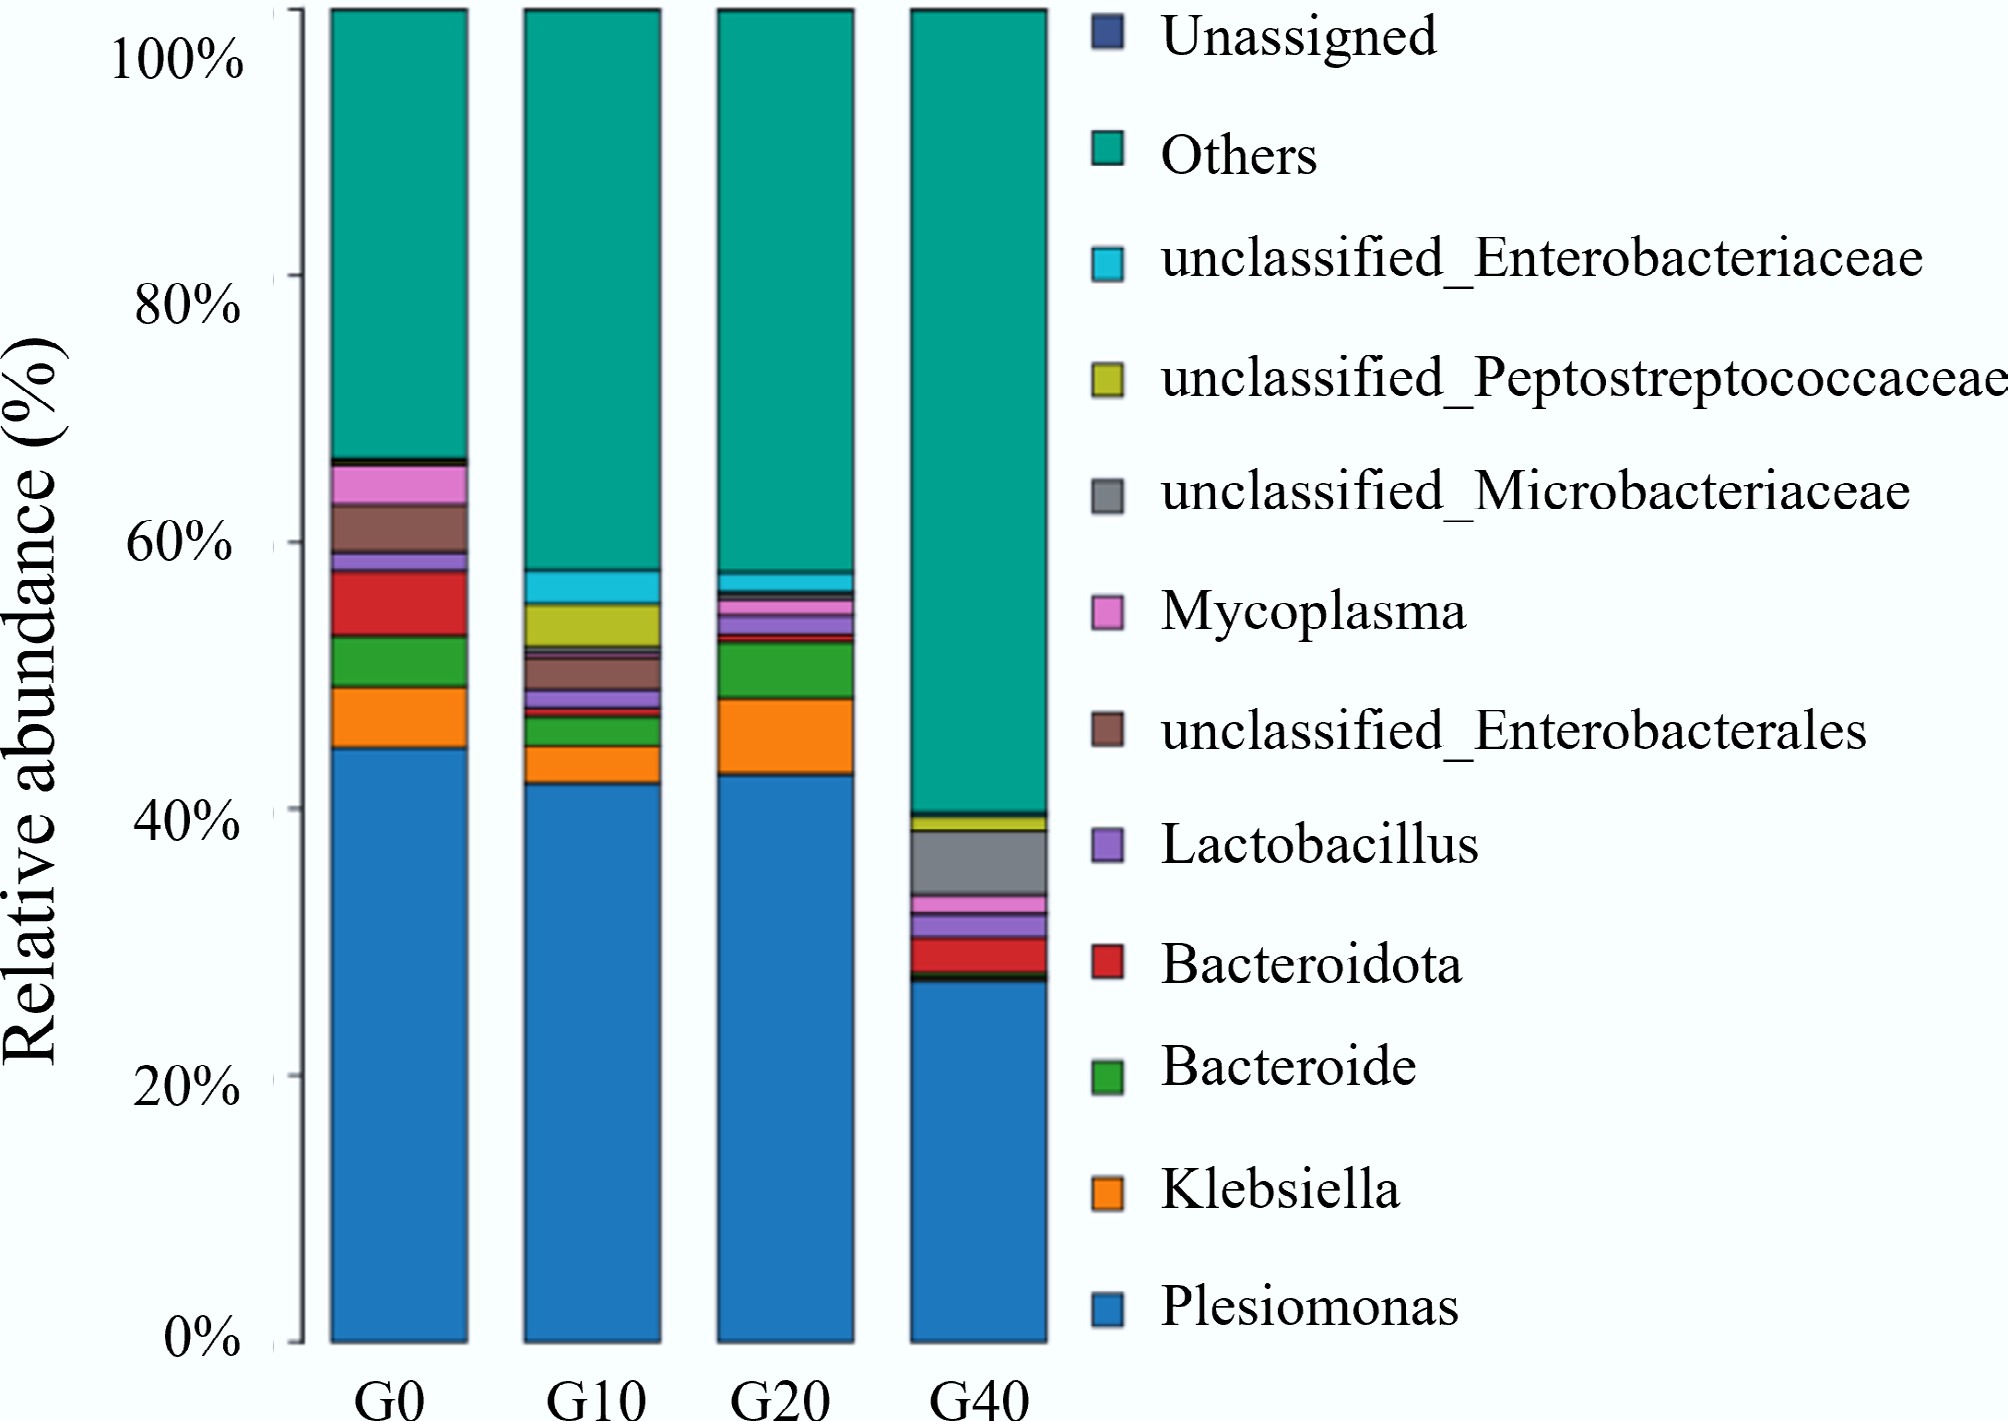
Figure 5.
Relative abundance at genus levels of the intestinal microbiota of largemouth bass fed with different feed formulations (G0, G10, G20, and G40).
KEGG functional prediction of gut microbiota
-
Based on the observed differences in growth performance as well as antioxidant and anti-inflammatory capacities, the G10 group and the control group were selected for comparative analysis of predicted gut microbiota functions (Fig. 6). As illustrated in Fig. 6, predicted functional pathways related to xenobiotics biodegradation and metabolism, carbohydrate metabolism, global and overview maps, and amino acid metabolism were significantly enriched in the G10 group (p < 0.05). In contrast, functional pathways associated with cell motility, signal transduction, and membrane transport were significantly more abundant in the control group (p < 0.05).
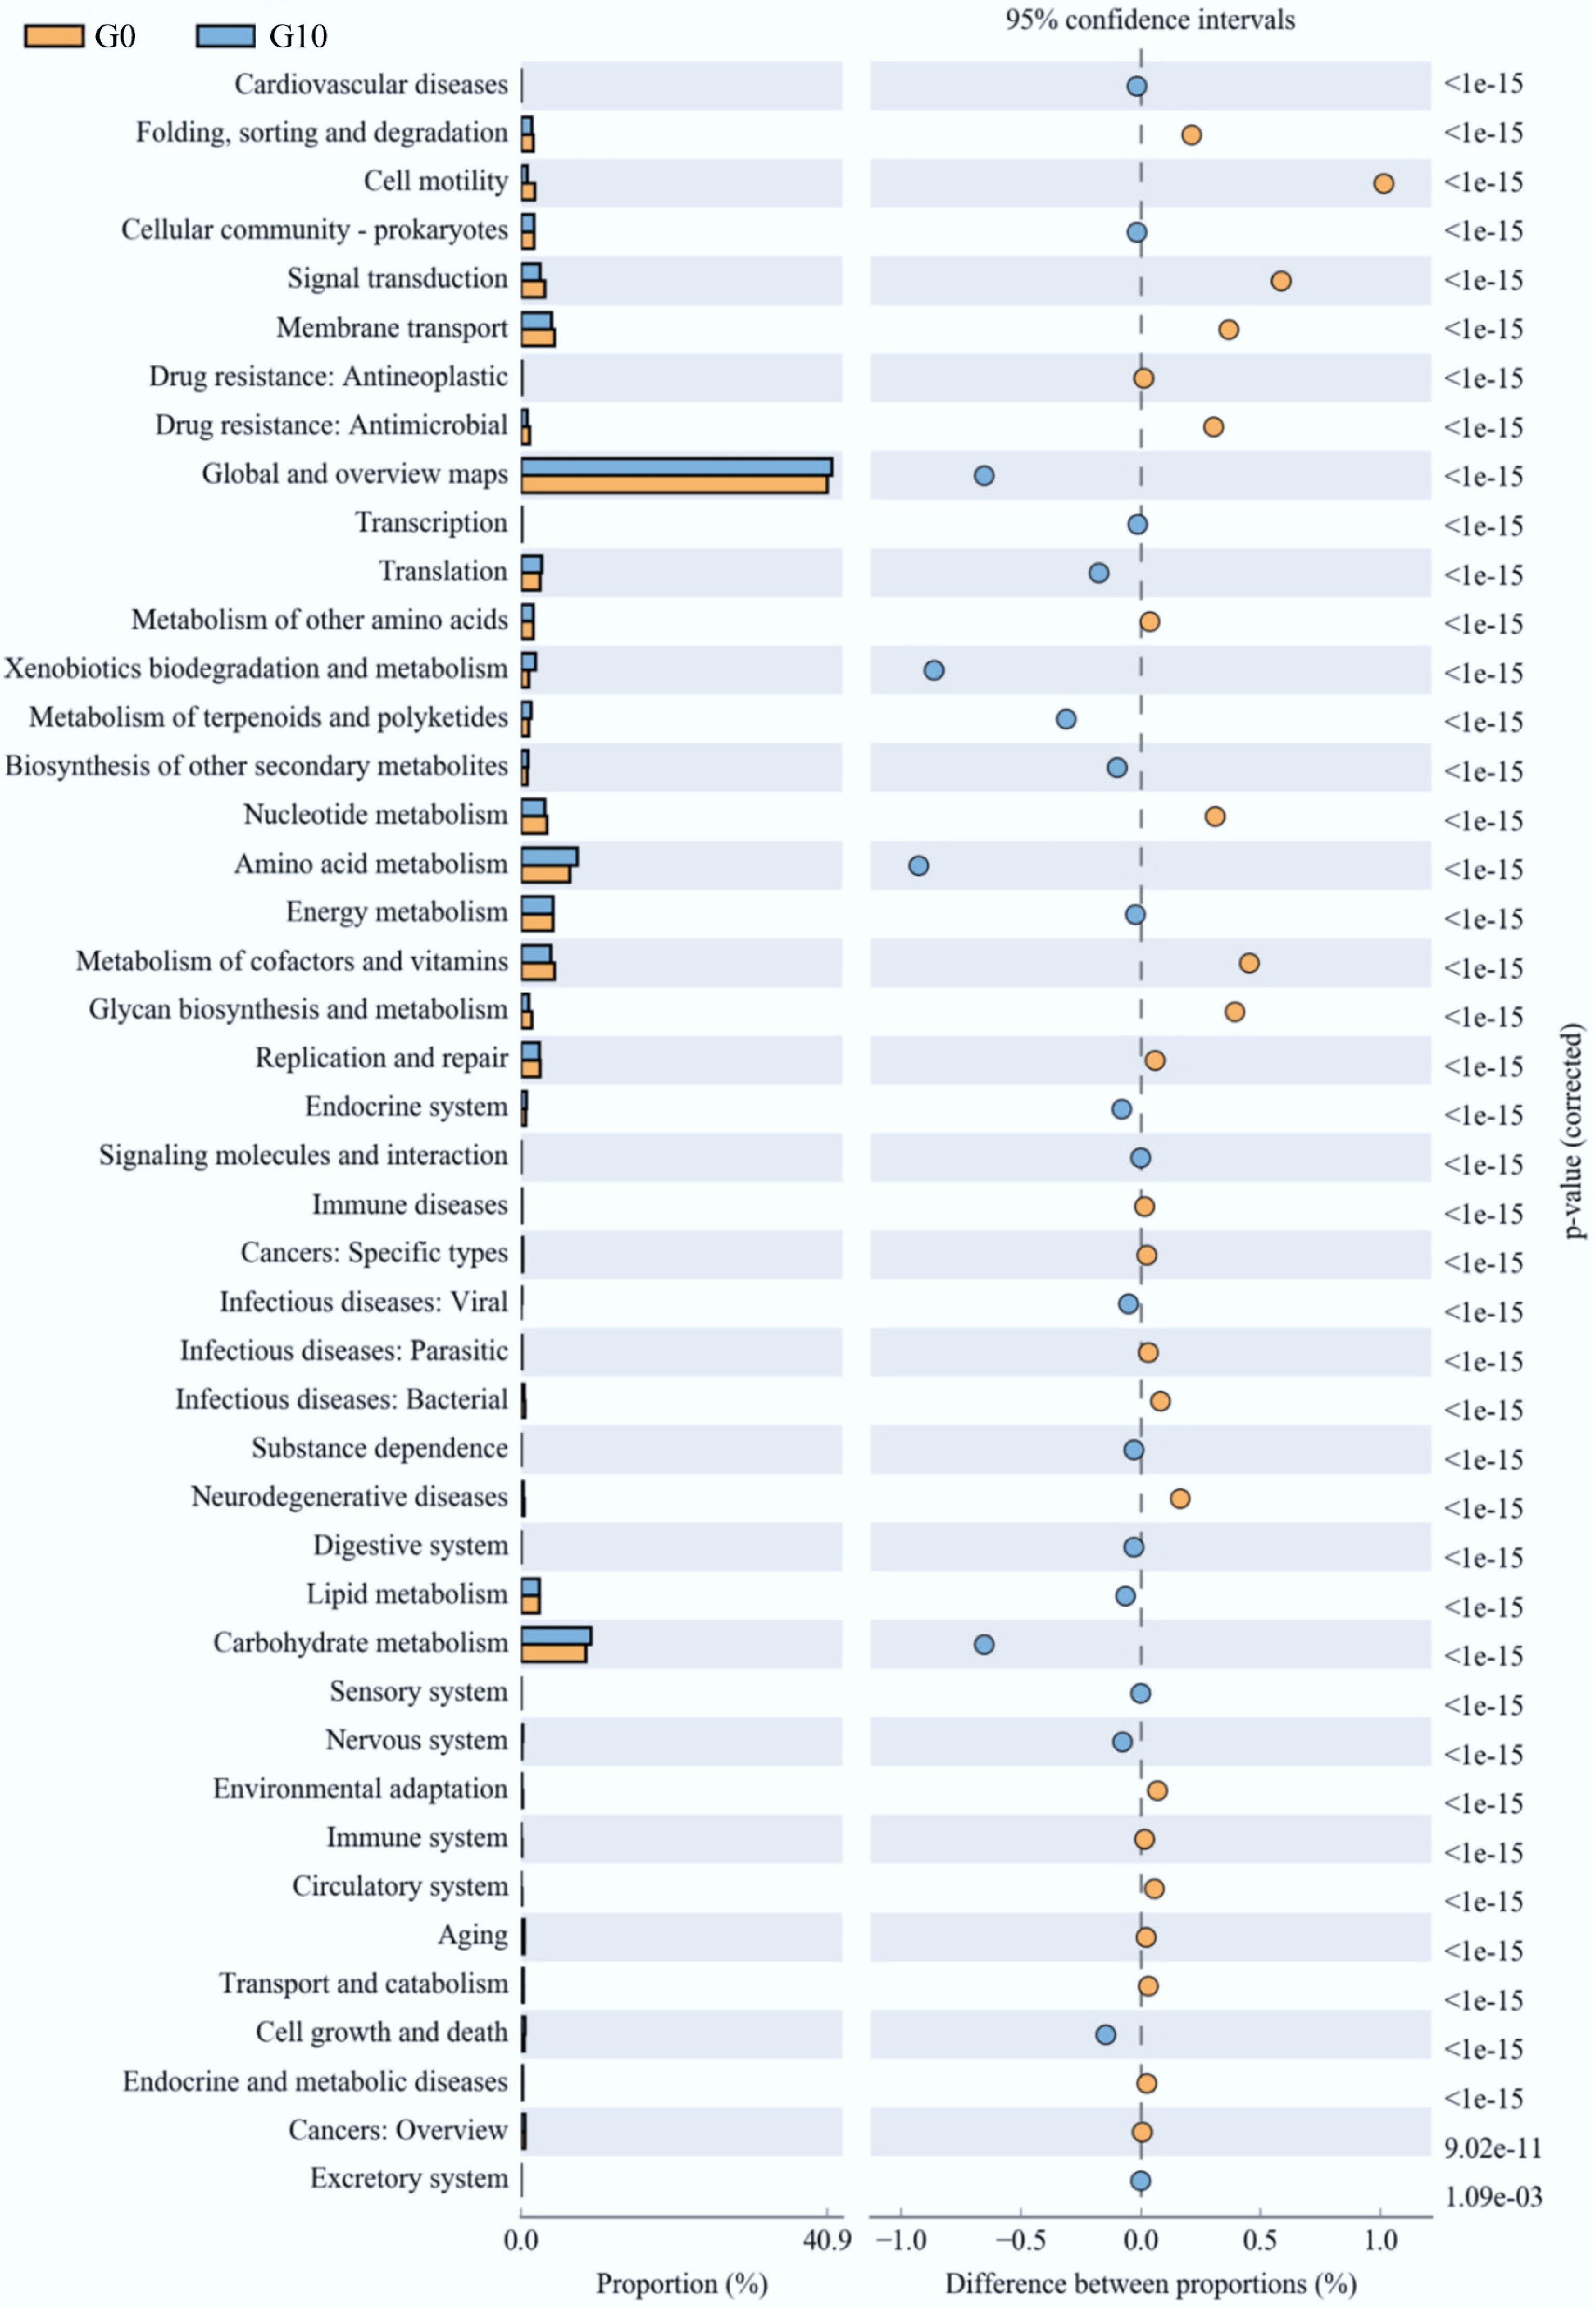
Figure 6.
Functional prediction of gut microbiota in the G0 and G10 groups.
Effect of biochar on aquaculture water quality
-
Total nitrogen (TN), ammonia nitrogen (NH3-N), and nitrite nitrogen (NO2-N) concentrations are key indicators used to evaluate aquaculture water quality. Ammonia nitrogen, in particular, is a crucial pollutant in aquaculture systems[43]. Its decomposition into nitrite releases acidic substances. These lower the water pH, posing a threat to the aquatic environment and becoming a key pollution stressor in aquaculture. In intensive aquaculture, excess NH3-N and NO2-N produced from the decomposition of uneaten feed, feces, and organic waste can significantly reduce fish feeding activity and even cause mass mortality[46]. Therefore, NH3-N, NO2-N, and TN concentrations were monitored across different treatment groups to assess the effectiveness of biochar as a dietary additive.
As shown in Fig. 7a, TN concentrations in the aquaculture water of all groups increased gradually throughout the cultivation period. This was attributed to continuous fish excretion, feed decomposition, and microbial activity. By day 42, no statistically significant differences in TN concentration were observed among the groups (p > 0.05). These results indicate that biochar supplementation did not significantly affect overall nitrogen accumulation in the aquaculture water.
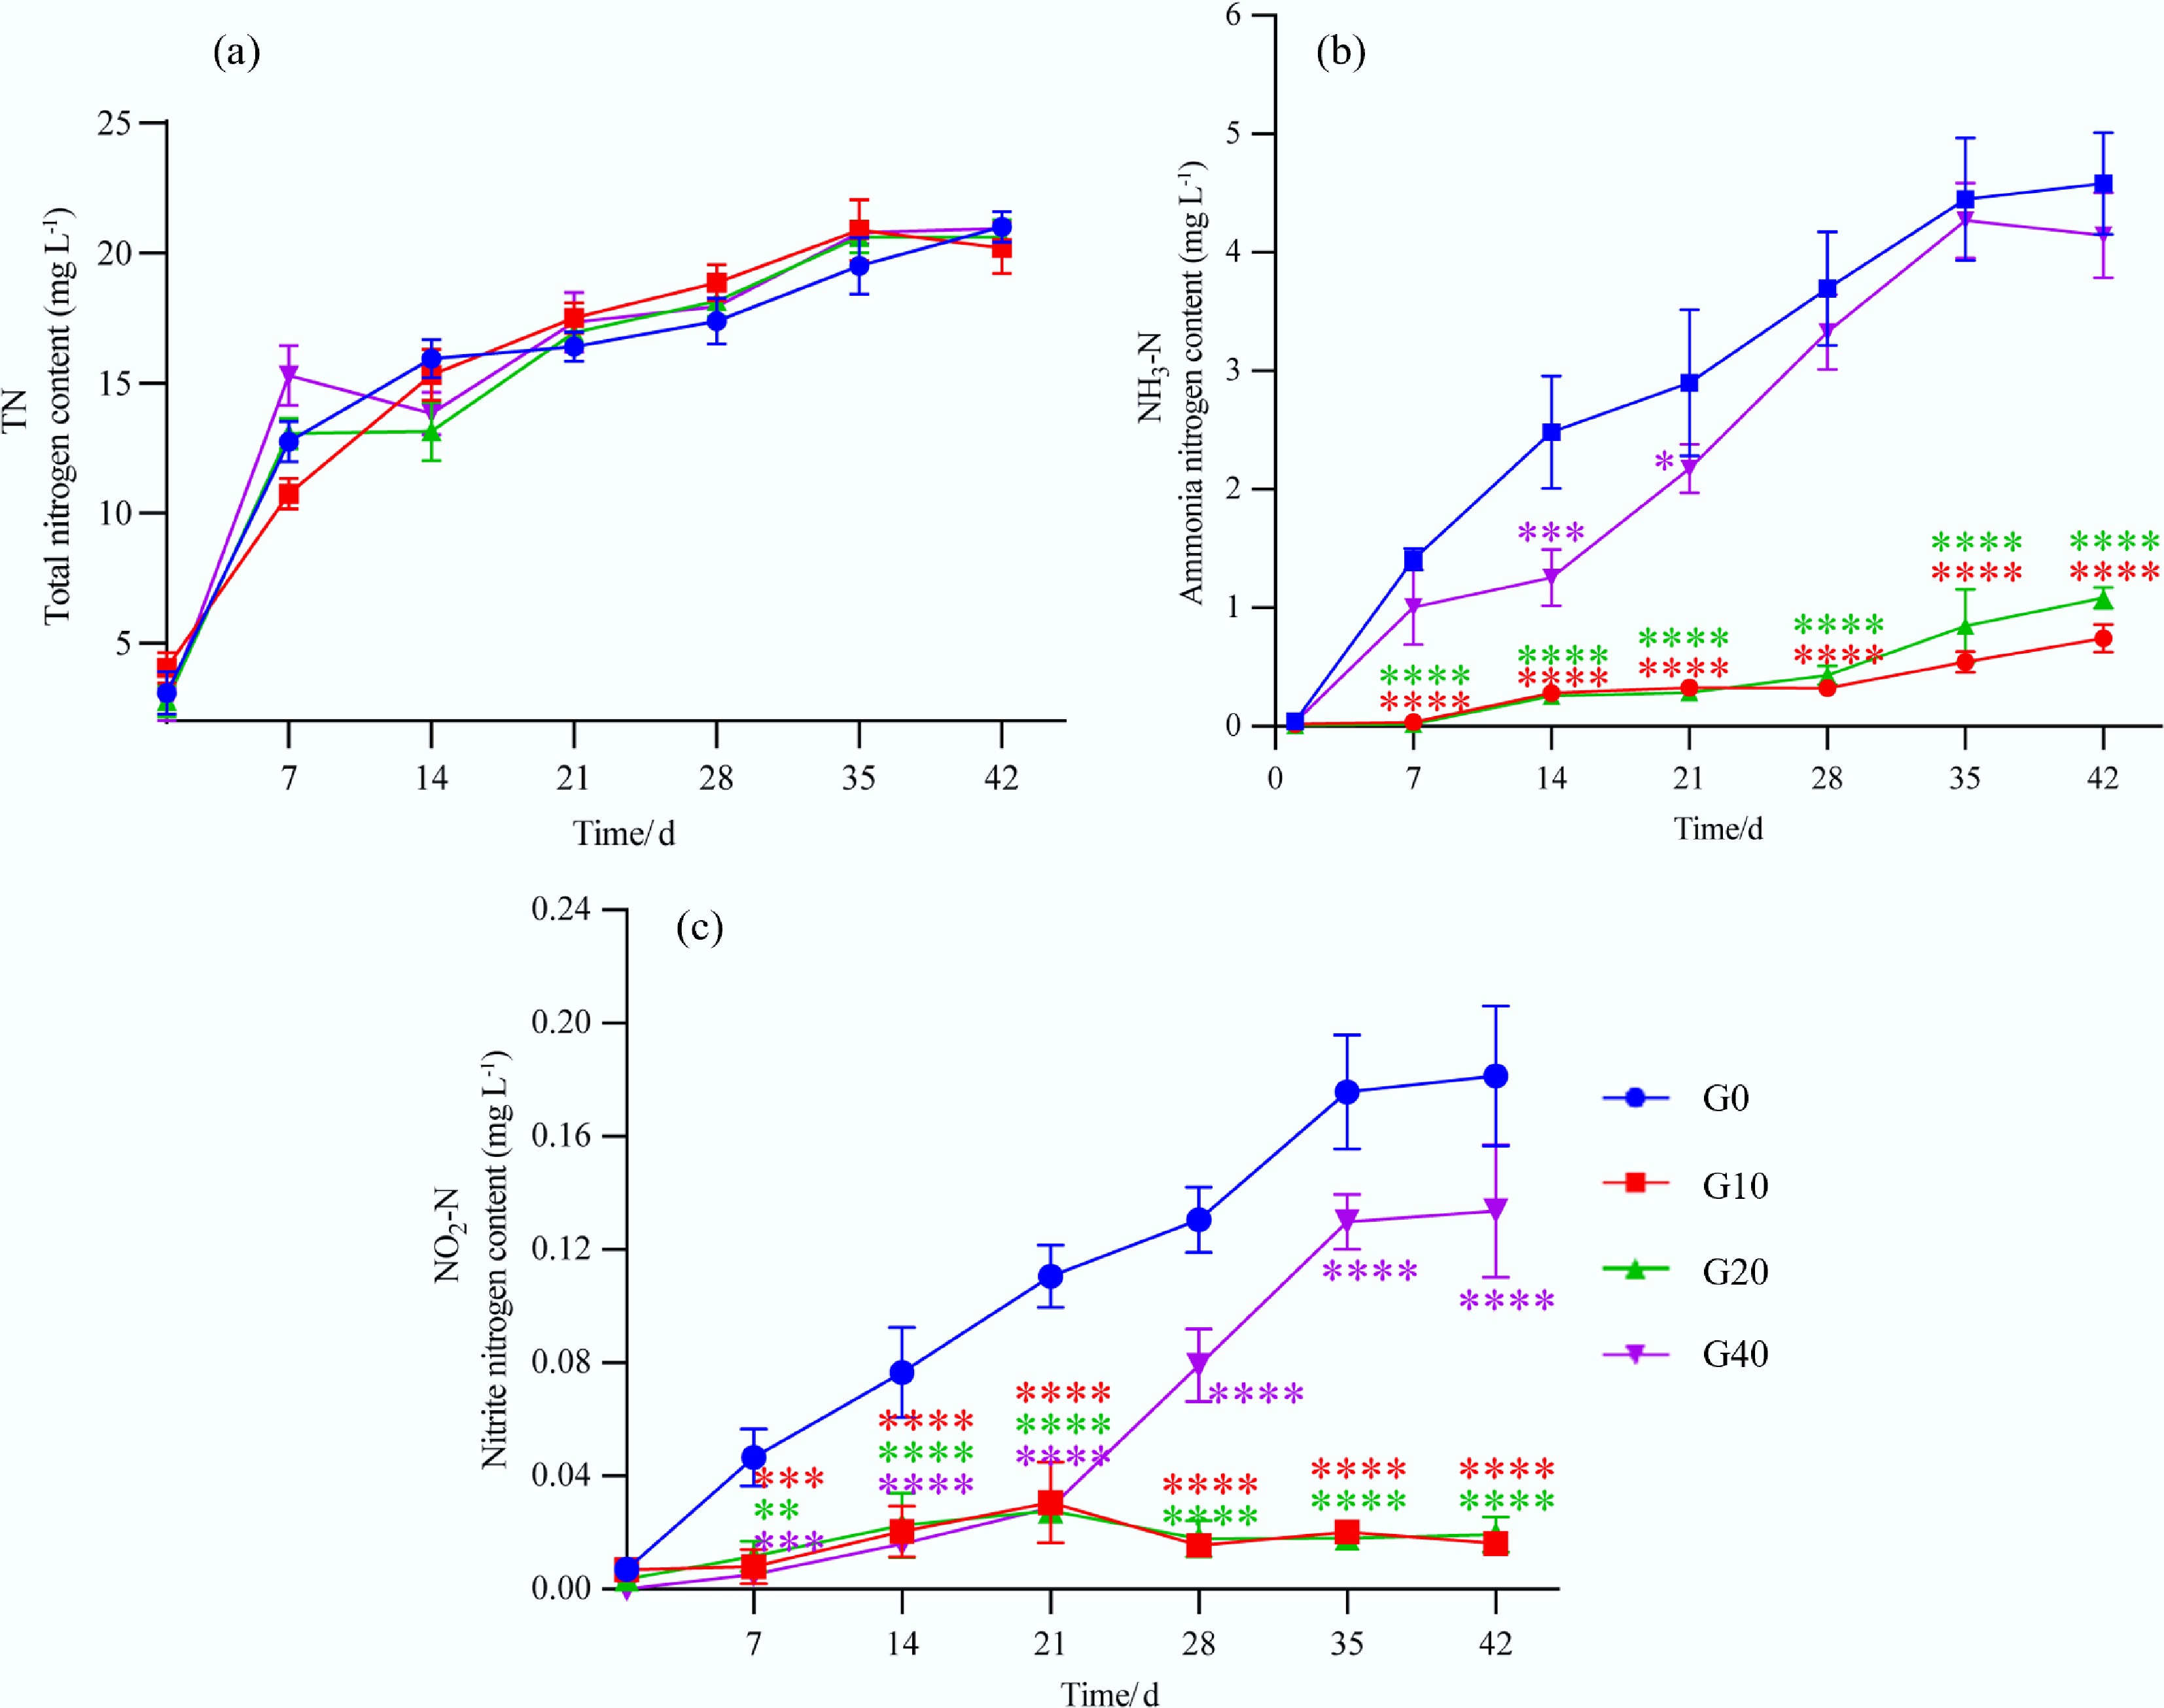
Figure 7.
Changes in (a) total nitrogen, (b) ammonia, and (c) nitrite of the aquaculture water for largemouth bass fed with different feed formulations (G0, G10, G20, and G40). (* represents the significant difference among the different treatments at p < 0.05, *** or **** represents the significant difference among the different treatments at p < 0.001).
The NH3-N content in the aquaculture water of all groups also increased over time. However, NH3-N concentrations in the G10 and G20 groups were significantly lower than those in the control group (G0) (p < 0.05; Fig. 7b). By day 42, compared to the G0 group, the NH3-N content was reduced by 60.7% and 49.3%, respectively, for the G10 and G20. Meanwhile, the concentration of nitrite nitrogen (NO2-N) in the aquaculture water of the G0 and G40 groups showed a gradual increasing trend over time, while in the G10 and G20 groups, it fluctuated (Fig. 7c). At corresponding sampling times, NO2-N concentrations in the biochar-supplemented groups were significantly lower than those in the G0 group (p < 0.05). By day 42, NO2-N concentrations in the biochar-treated groups decreased by 24.66% (G40) to 91.78% (G10) relative to the control group.
-
The incorporation of mulberry branch-derived biochar into feed markedly influenced the intestinal physiology of Micropterus salmoides, supporting its potential as a functional feed additive. Enhanced digestive enzyme activities, particularly trypsin and amylase in the G20 and G40 groups, suggest that biochar's high surface area and microporous structure (3.11 m2 g−1) may adsorb anti-nutritional factors such as phytates or microbial toxins, thereby relieving enzymatic inhibition[31]. In addition, the alkaline nature of biochar (pH 10.15) may create a more favorable intestinal pH environment for enzymatic function[14]. The inorganic elements (Si, Ca, K, etc.) and trace elements (Mn, Zn, Cu, etc.) in biochar are mainly in the form of oxides and mineral salts, which are important basic components of biochar and also help to improve the buffering capacity of the anaerobic digestion system[47]. Interestingly, lipase activity was highest in the G10 group but declined significantly in the G20 and G40 groups. This pattern may be attributed to the excessive adsorption of lipids by high-dose biochar, reducing substrate availability, or to microbiota-mediated shifts in lipid metabolism[35]. These findings reveal a functional threshold—once this critical point is exceeded, the adsorption properties of biochar may influence carbohydrate metabolism, thereby affecting lipid digestion efficiency[48]. Concurrently, biochar modulated the intestinal microbiota composition and diversity. The significant increases in Chao1 and ACE indices indicate that biochar provided a structural niche for microbial colonization, supporting beneficial taxa such as Actinobacteriota, which are known to contribute to nutrient assimilation and immune regulation[41]. The reduced Firmicutes/Bacteroidetes (F : B) ratio observed in biochar-fed groups suggests more efficient energy extraction and reduced fat deposition, consistent with findings in rodent models[40]. Moreover, the abundance of pathogenic genera such as Plesiomonas and Mycoplasma declined significantly in the G10 and G20 groups. This may reflect biochar's capacity to sequester bacterial toxins or quorum-sensing molecules that facilitate pathogen colonization. The reduction in inflammatory markers TNF-α and IL-6, reported in macrophage models, also support the anti-inflammatory potential of biochar, which could help stabilize mucosal immunity and enhance barrier function[49].
Dose-dependent responses and potential toxicity
-
Despite the benefits conferred by low to moderate biochar inclusion levels, a dose-dependent response was evident. The condition factor (CF), calculated as the ratio of body weight to the cube of body length, is a morphometric index that reflects the plumpness or leanness of fish. It serves as a crucial indicator for assessing growth performance and nutritional status, and is widely used to evaluate the effectiveness of feed formulations. Fish in the G10 group exhibited the most favorable physiological outcomes, including the highest lipase activity and improved condition factor (CF) and hepatosomatic index (HSI), likely reflecting enhanced nutrient uptake and gut microbiome balance. These results are in agreement with previous studies in Pangasius hypophthalmus, where biochar at 2% dietary inclusion improved growth without inducing toxicity[9]. In contrast, the G40 group displayed signs of physiological stress and functional impairment. Notably, CF and lipase activity declined significantly, possibly due to excessive nutrient adsorption, particularly of lipids and vitamins, by the higher dose of biochar. This may have resulted in metabolic imbalances and impaired energy allocation. Similar findings have been reported in poultry, where high-dose biochar reduced feed palatability and nutrient bioavailability[50]. Furthermore, the microbial community structure in the G40 group became more dispersed (PCoA). Research has confirmed that an increase in beta diversity dispersion can induce gut microbiota dysbiosis and alter the abundance of specific bacteria, leading to intestinal toxicity[51]. This finding aligns with the observed upregulation of intestinal inflammatory factors and histomorphological damage in the G40 group of the present study. This dysbiosis may also compromise host microbe symbiosis and increase disease susceptibility, underscoring the importance of optimizing biochar dosage for aquaculture applications[39].
Biochar's role in water quality improvement
-
Beyond host physiological effects, biochar also demonstrated water-purifying capabilities. Although the ammonia nitrogen (NH3-N) and nitrite nitrogen (NO2−-N) levels were significantly reduced in the G10 and G20 groups, the mechanism requires experimental validation. Existing research suggests that biochar's high cation exchange capacity (22.80 cmol kg−1) and microporosity facilitate the direct adsorption of nitrogenous waste products[52]. Additionally, the biochar's alkaline pH may further promote ammonia volatilization, both of which are potential contributing factors. Biochar also appeared to enhance microbial nitrification pathways, as evidenced by improved water quality and the inferred enrichment of nitrifying bacteria (e.g., Nitrosomonas, Nitrobacter)[53]. These findings align with previous studies in catfish, where bamboo-derived biochar reduced NH3-N concentrations by 30%[9]. Remarkably, the mulberry-derived biochar used in this study achieved up to 60.7% reduction in the G10 group, likely due to its superior surface characteristics. Interestingly, the lack of a significant reduction in total nitrogen (TN) suggests that biochar primarily modulates intermediate nitrogen species (NH3, NO2−) rather than total nitrogen cycling. Enhanced nutrient absorption by fish may also contribute indirectly to reduced nitrogen excretion, further stabilizing the aquatic environment[52].
-
This study evaluated the application potential of mulberry branch–derived biochar as a dietary additive for improving intestinal health and aquaculture water quality in largemouth bass (Micropterus salmoides). Under the experimental conditions of this study, dietary supplementation with 10 g kg−1 mulberry branch–derived biochar did not result in a statistically significant change in the growth performance of largemouth bass. Dietary inclusion of 10 or 20 g kg−1 mulberry branch biochar improved intestinal tissue morphology, significantly upregulated the expression of antioxidant- and anti-inflammatory–related genes, enhanced the richness and diversity of intestinal microbiota, and reduced the relative abundance of potential pathogenic bacteria in largemouth bass. In addition, biochar supplementation effectively reduced ammonia nitrogen and nitrite nitrogen concentrations in the aquaculture water, thereby improving overall water quality. Collectively, these findings suggest that dietary supplementation with 10 g kg−1 mulberry branch–derived biochar represents a promising feed additive for largemouth bass aquaculture. This biochar not only maintains the physiological health of the fish but also promotes a more sustainable and environmentally friendly aquaculture model by enhancing water quality and fostering a healthier farming environment.
The authors would like to thank the staff of the Department of Aquaculture, Academy of Zoology, Guangdong Academy of Agricultural Sciences for their technical support.
-
It accompanies this paper at: https://doi.org/10.48130/bchax-0026-0010.
-
The authors confirm their contributions to the paper as follows: Bing Chen, Junru Hu, Kai Peng: conceptualization, investigation, methodology, formal analysis, writing − original draft; Wen Huang, Jinhong Li, Mulian Wei: conceptualization, resources; Zhihua Zeng, Dongxu Xing: funding acquisition, supervision; Bing Fu, Junming Cao, Hongxia Zhao: analysis, writing − review and editing; Xiang Li, Hailong Wang: data curation, writing − review and editing. All authors reviewed the results and approved the final version of the manuscript.
-
The datasets generated during and/or analyzed during the current study are available from the corresponding author on reasonable request.
-
This research was funded by the High-level Guangdong Agricultural Science and Technology Demonstration City Construction Fund City Institute Cooperation Project (2220060000054, 2220060000050); Guangdong Academy of Agricultural Sciences Aquatic Research Center Project (XT202304).
-
The authors declare that they have no known competing financial interests or personal relationships that could have appeared to influence the work reported in this paper.
-
# Authors contributed equally: Bing Chen, Junru Hu, Kai Peng
Full list of author information is available at the end of the article. - The supplementary files can be downloaded from here.
- Copyright: © 2026 by the author(s). Published by Maximum Academic Press, Fayetteville, GA. This article is an open access article distributed under Creative Commons Attribution License (CC BY 4.0), visit https://creativecommons.org/licenses/by/4.0/.
-
About this article
Cite this article
Chen B, Hu J, Peng K, Huang W, Li J, et al. 2026. Dietary mulberry branch biochar improves intestinal health and water quality in largemouth bass (Micropterus salmoides) aquaculture. Biochar X 2: e014 doi: 10.48130/bchax-0026-0010 

Dietary mulberry branch biochar improves intestinal health and water quality in largemouth bass (Micropterus salmoides) aquaculture
- Received: 31 December 2025
- Revised: 15 February 2026
- Accepted: 24 February 2026
- Published online: 01 May 2026
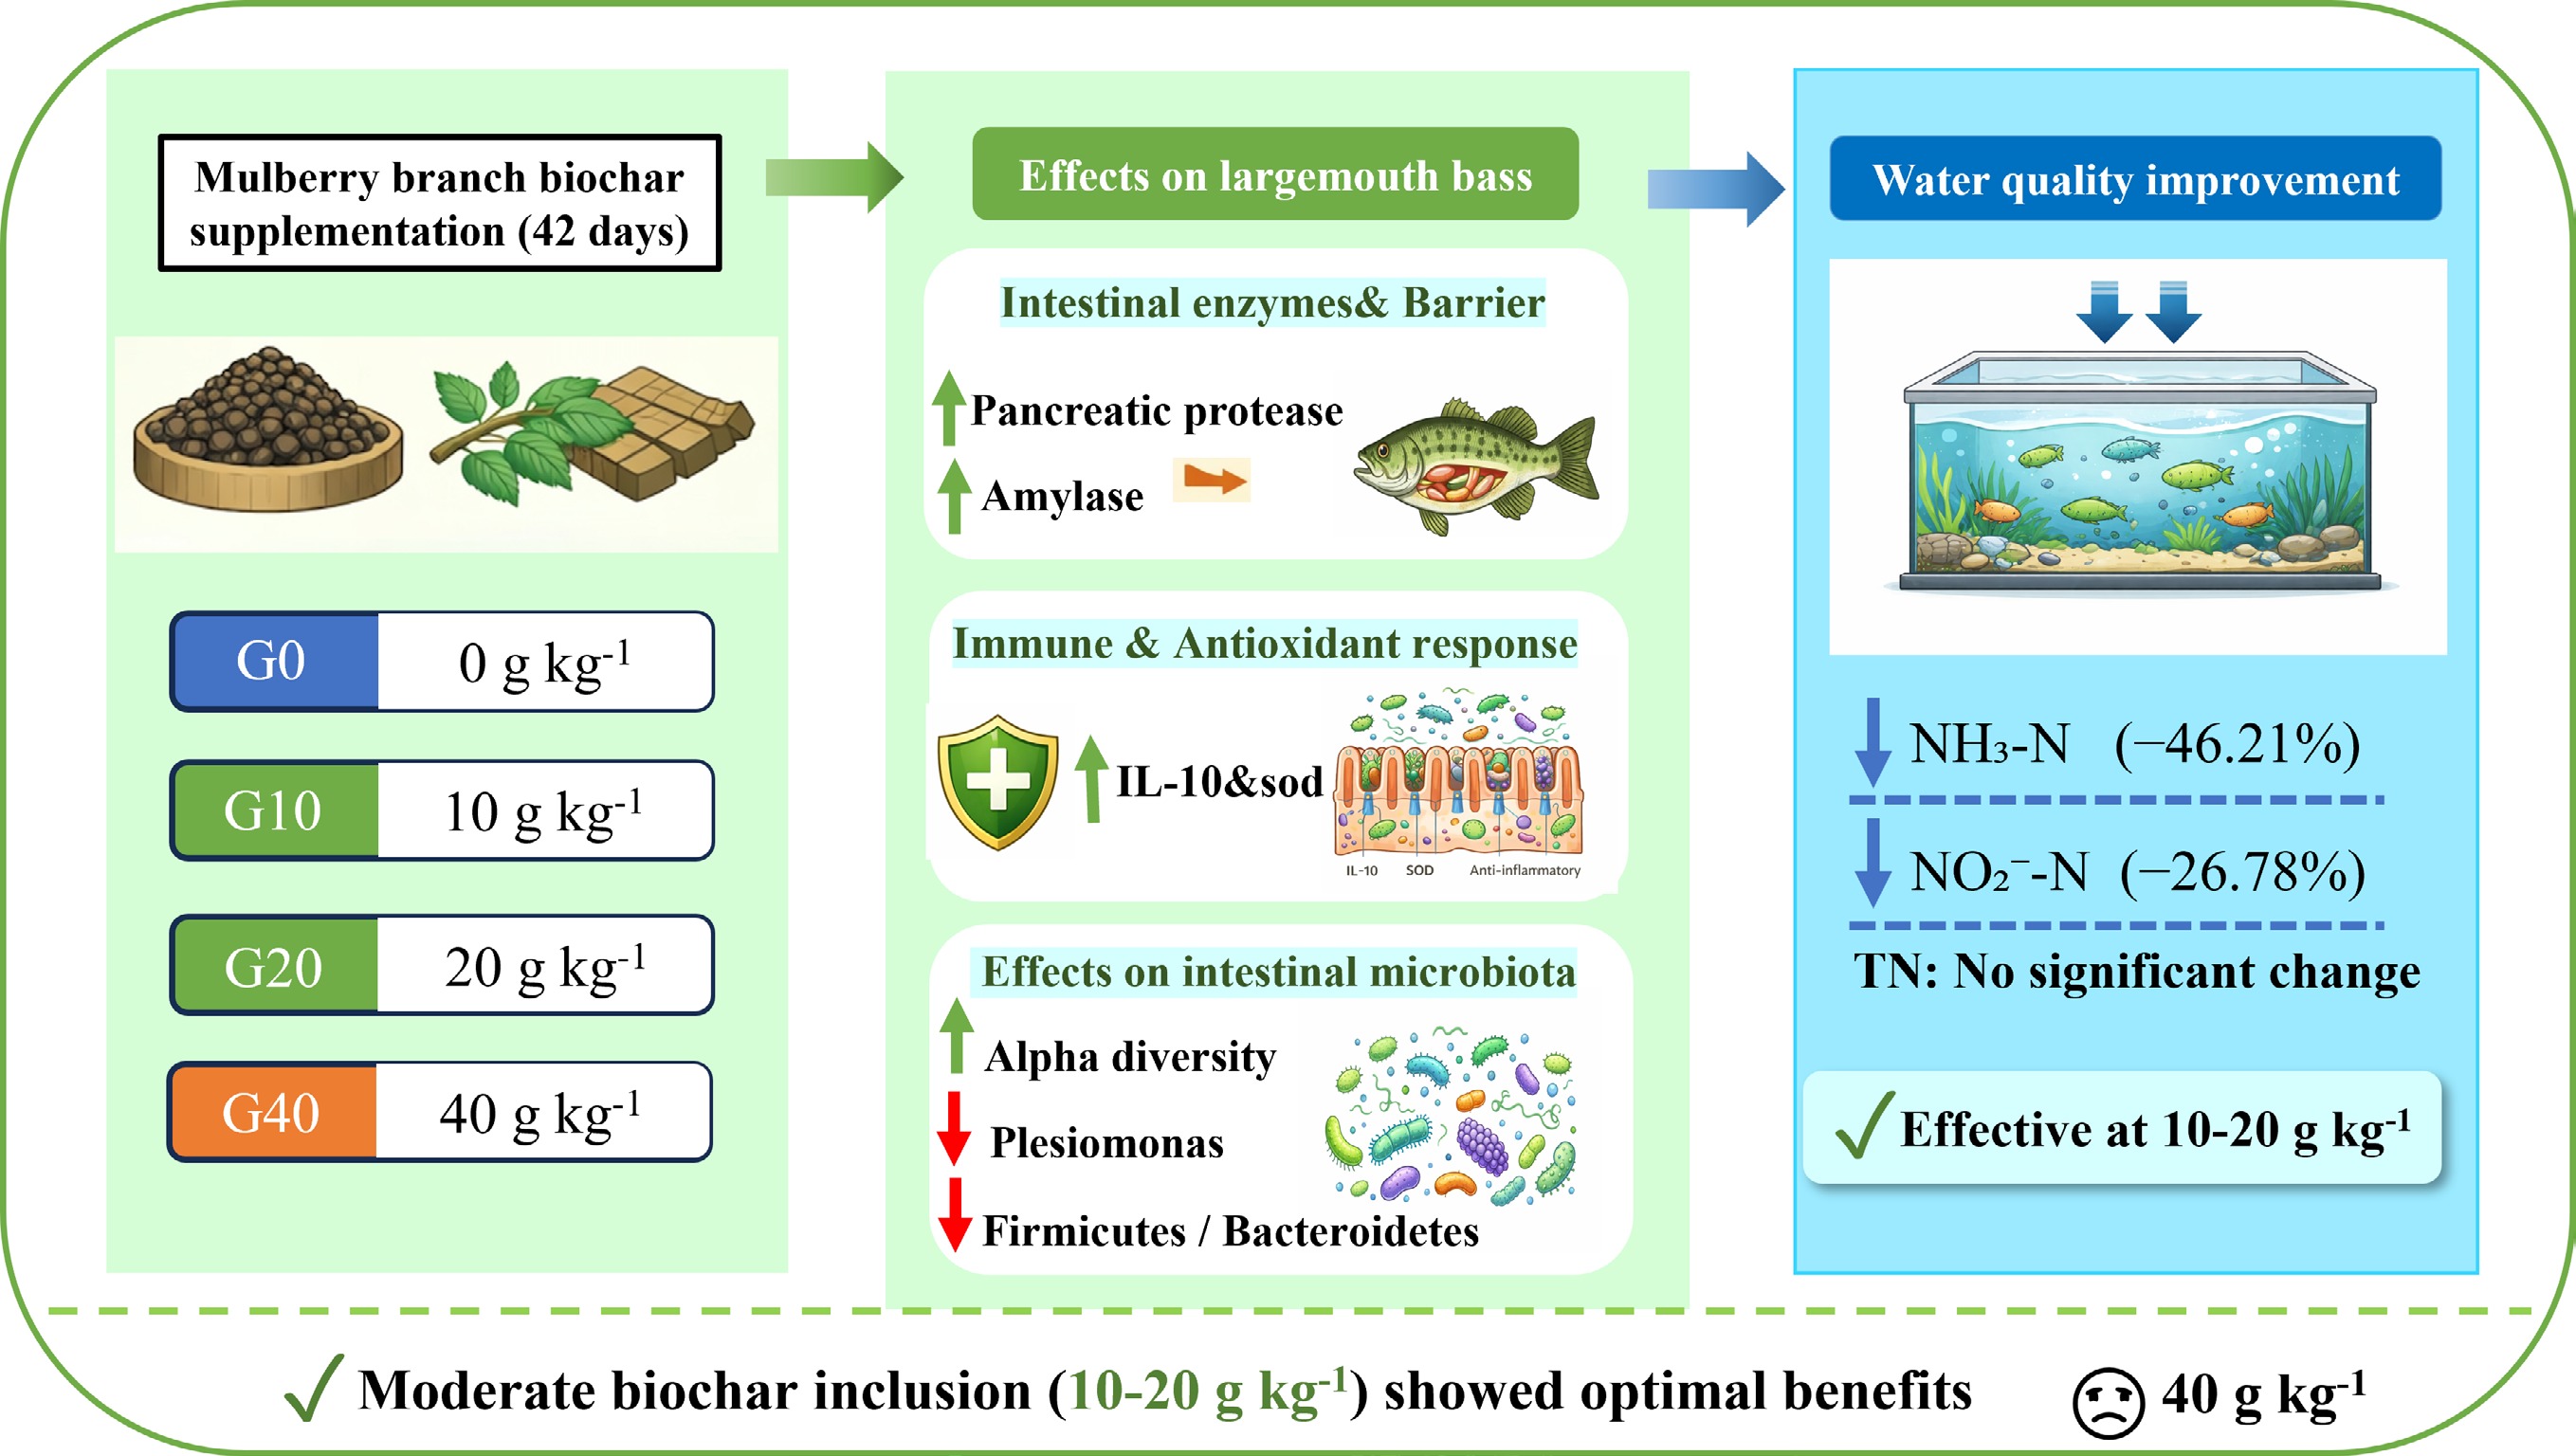
Abstract: This work evaluated the impacts of dietary mulberry branch-derived biochar on the growth performance, intestinal health, and aquaculture water quality in largemouth bass (Micropterus salmoides). M. salmoides (initial weight: 3.31 ± 0.01 g) were randomly distributed into four dietary treatments containing 0, 10, 20, and 40 g kg−1 biochar, each with four replicates (30 fish per replicate), and were fed for 42 d. No significant differences in growth performance were observed among the biochar-supplemented groups (p > 0.05). However, intestinal digestive enzyme activity, including pancreatic protease and amylase, was significantly enhanced in fish fed 20 and 40 g kg−1 biochar, compared with the control group (p < 0.05). The relative expression levels of IL-10, sod, and Occludin were significantly upregulated in the 10 g kg−1 biochar groups compared with the control (p < 0.05). Additionally, biochar supplementation enhanced intestinal microbiota diversity and abundance, with significantly higher Chao1 and Ace indexes in the 10, 20, and 40 g kg−1 groups, compared with the control (p < 0.05). Principal coordinate analysis (PCoA) revealed greater variation in microbial community structure in the 40 g kg−1 group, indicating a pronounced shift in microbiota composition. The species composition results demonstrated a significant reduction in the Firmicutes/Bacteroidetes (F : B) ratio (p < 0.05), suggesting improved energy absorption and fat metabolism. The relative abundance of Plesiomonas and Mycoplasma decreased significantly, indicating that biochar has the potential to improve gut microbiota structure by reducing the presence of pathogenic bacteria. This effect, coupled with its ability to modulate inflammatory responses, may contribute to an overall improvement in the intestinal environment. In terms of water quality, supplementation with 10 and 20 g kg−1 biochar significantly reduced ammonia nitrogen and nitrite nitrogen levels (p < 0.05), with reductions of more than 46.21% and 26.78%, respectively. In contrast, total nitrogen levels were not significantly affected by biochar supplementation (p > 0.05). Overall, these results indicate that dietary inclusion of 10 or 20 g kg−1 mulberry branch biochar can improve intestinal digestive enzyme activity, anti-inflammatory capacity, and gut microbiota composition in largemouth bass, while simultaneously enhancing aquaculture water quality through the reduction of nitrogenous waste.