-
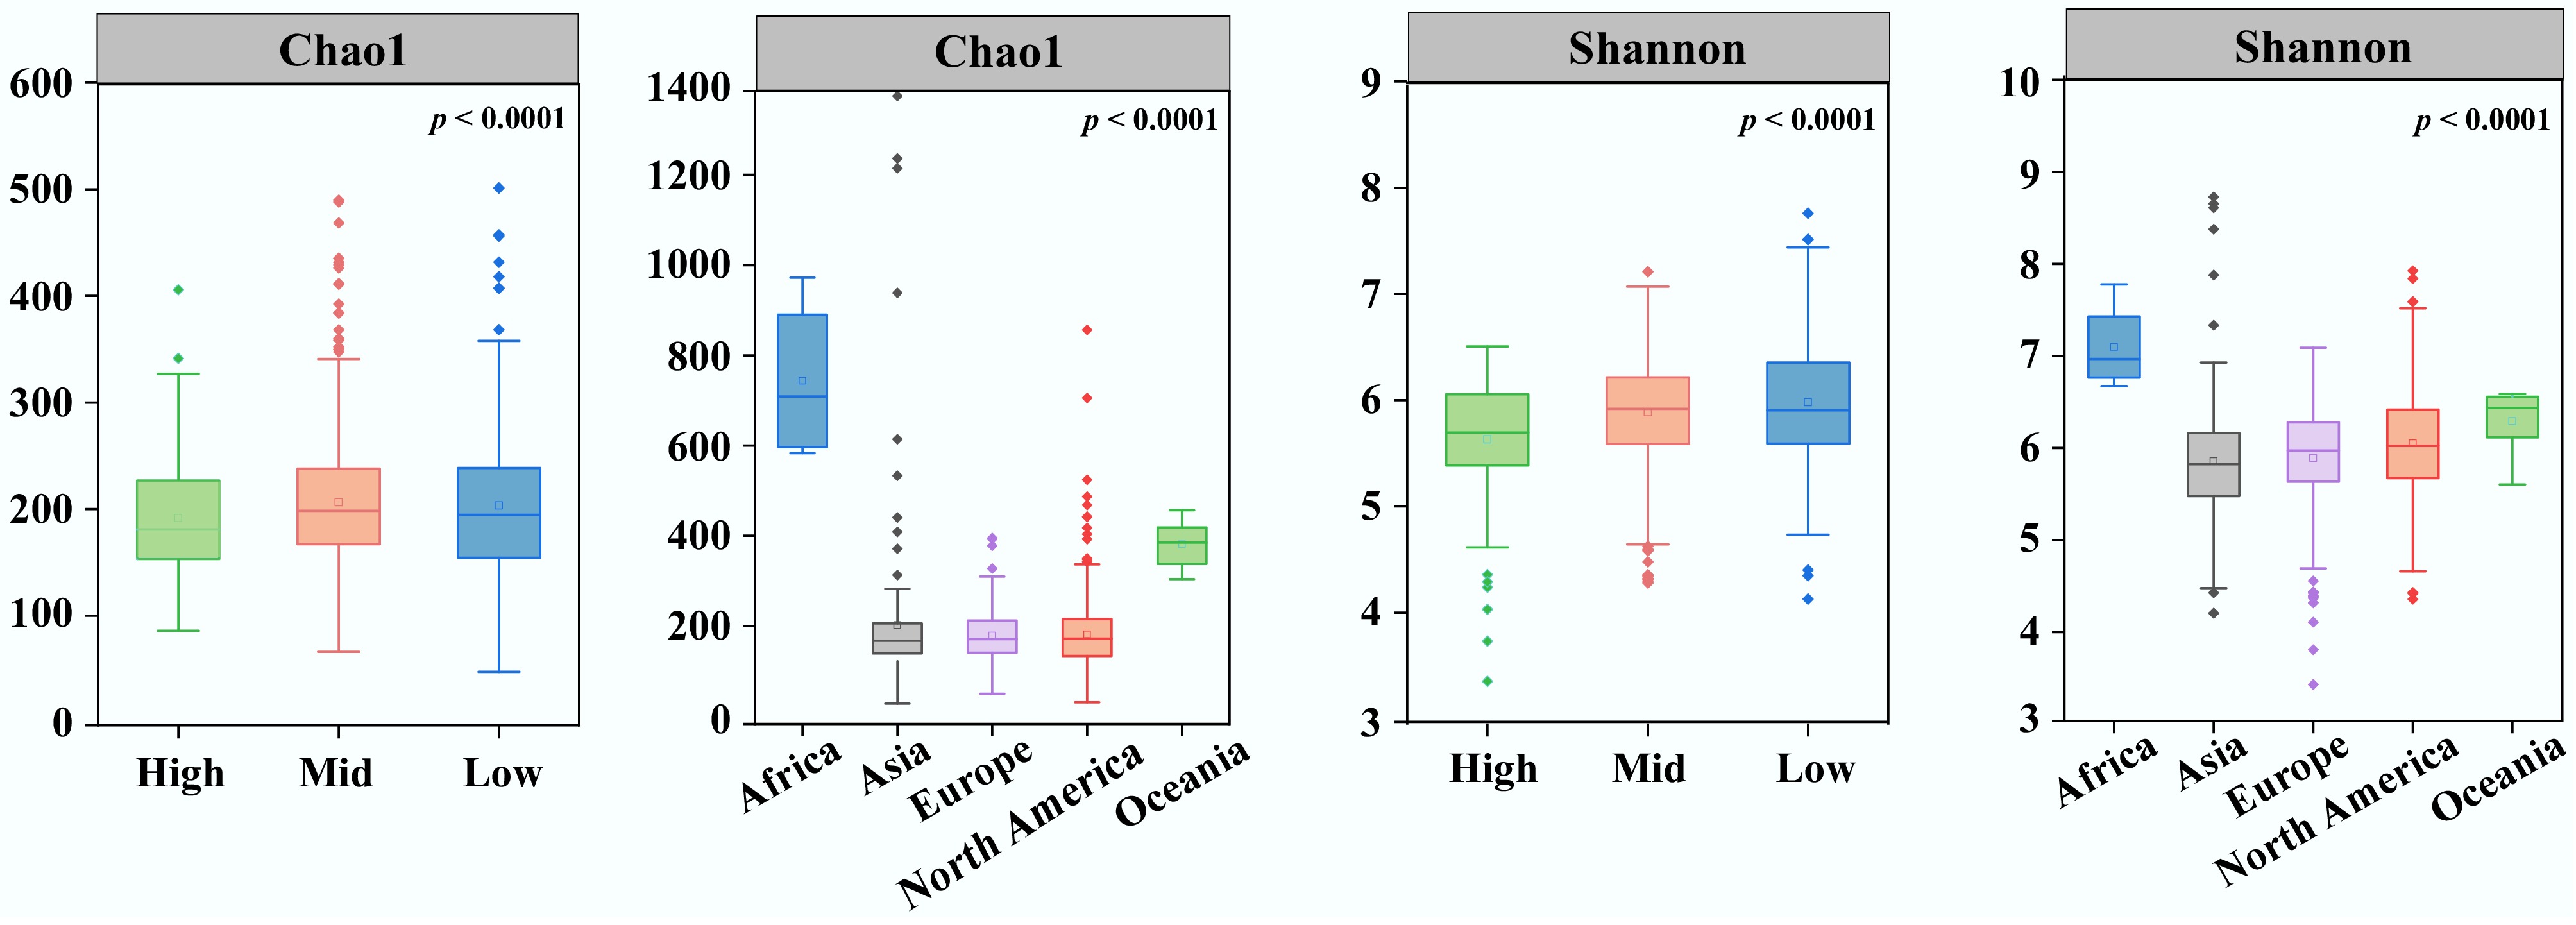
Figure 1.
Alpha diversity indices Chao1 and Shannon of port water from different latitudes and continents.
-
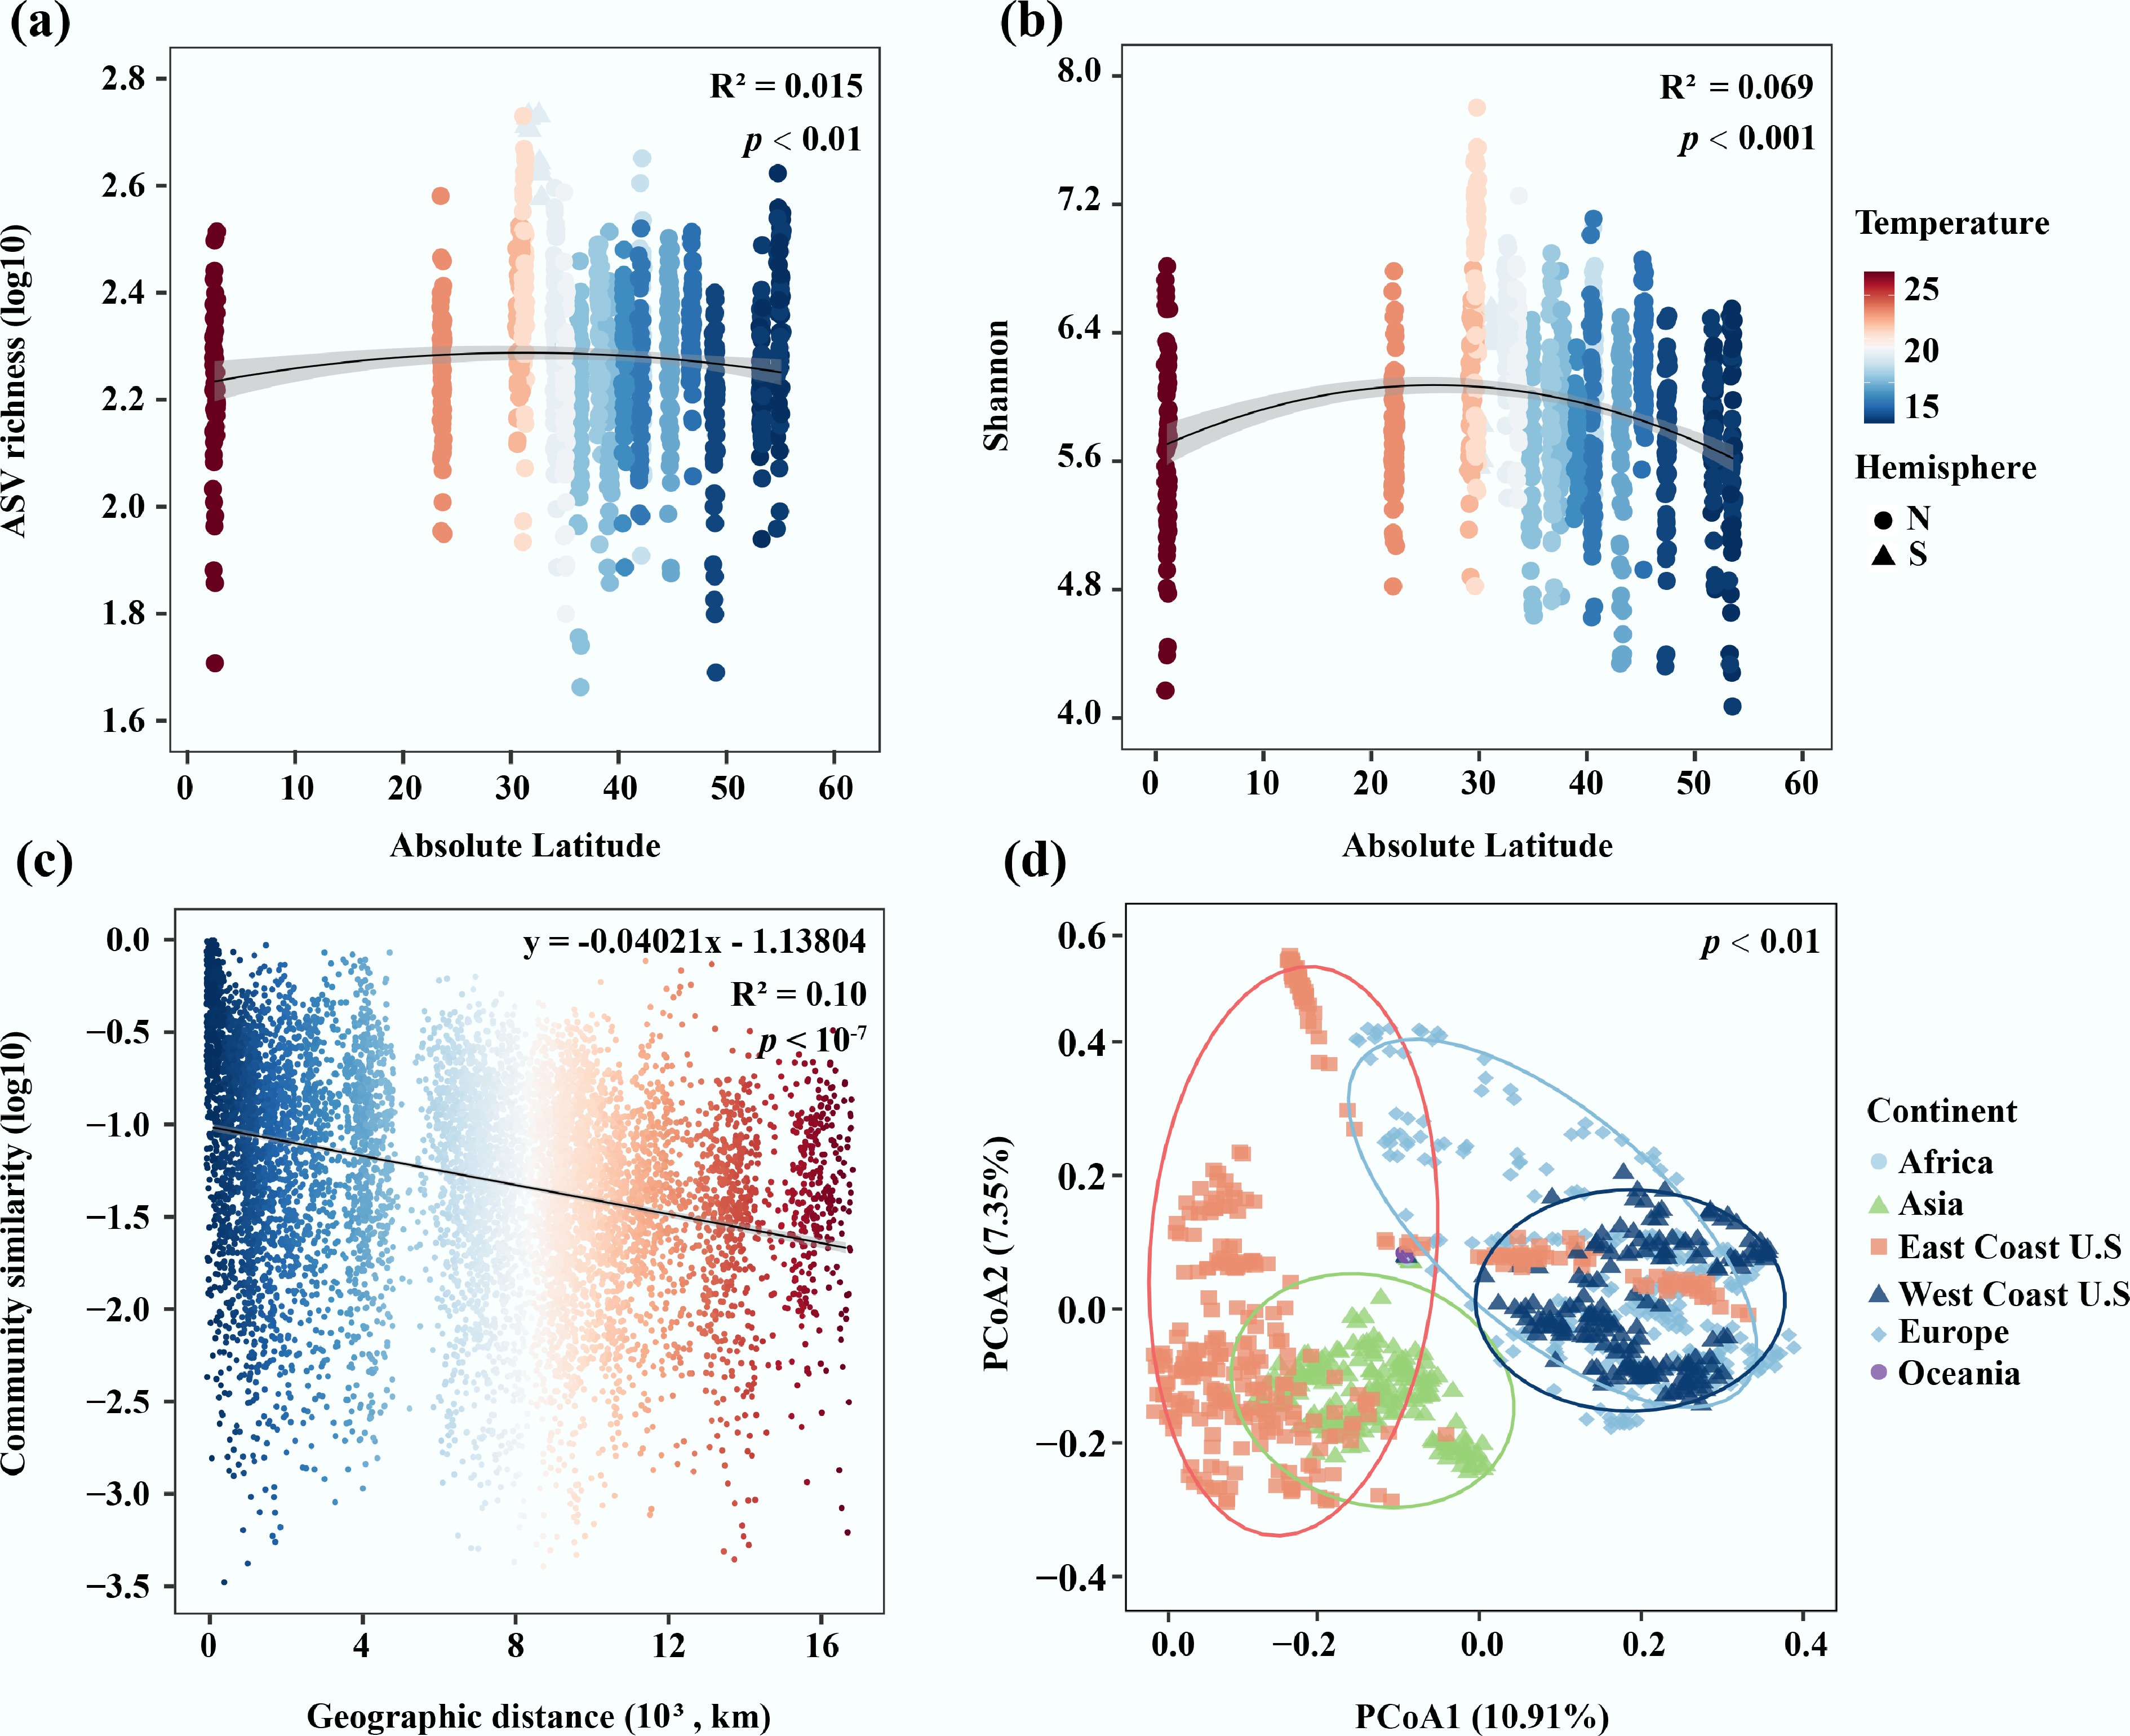
Figure 2.
(a) Relationship between ASV richness and absolute latitude in port water. (b) Relationship between Shannon index and absolute latitude in port water. (c) The DDRs based on Bray-Curtis similarity of port water bacterial community. (d) The β-diversity based on the Bray-Curtis distance of the bacterial community in port water.
-
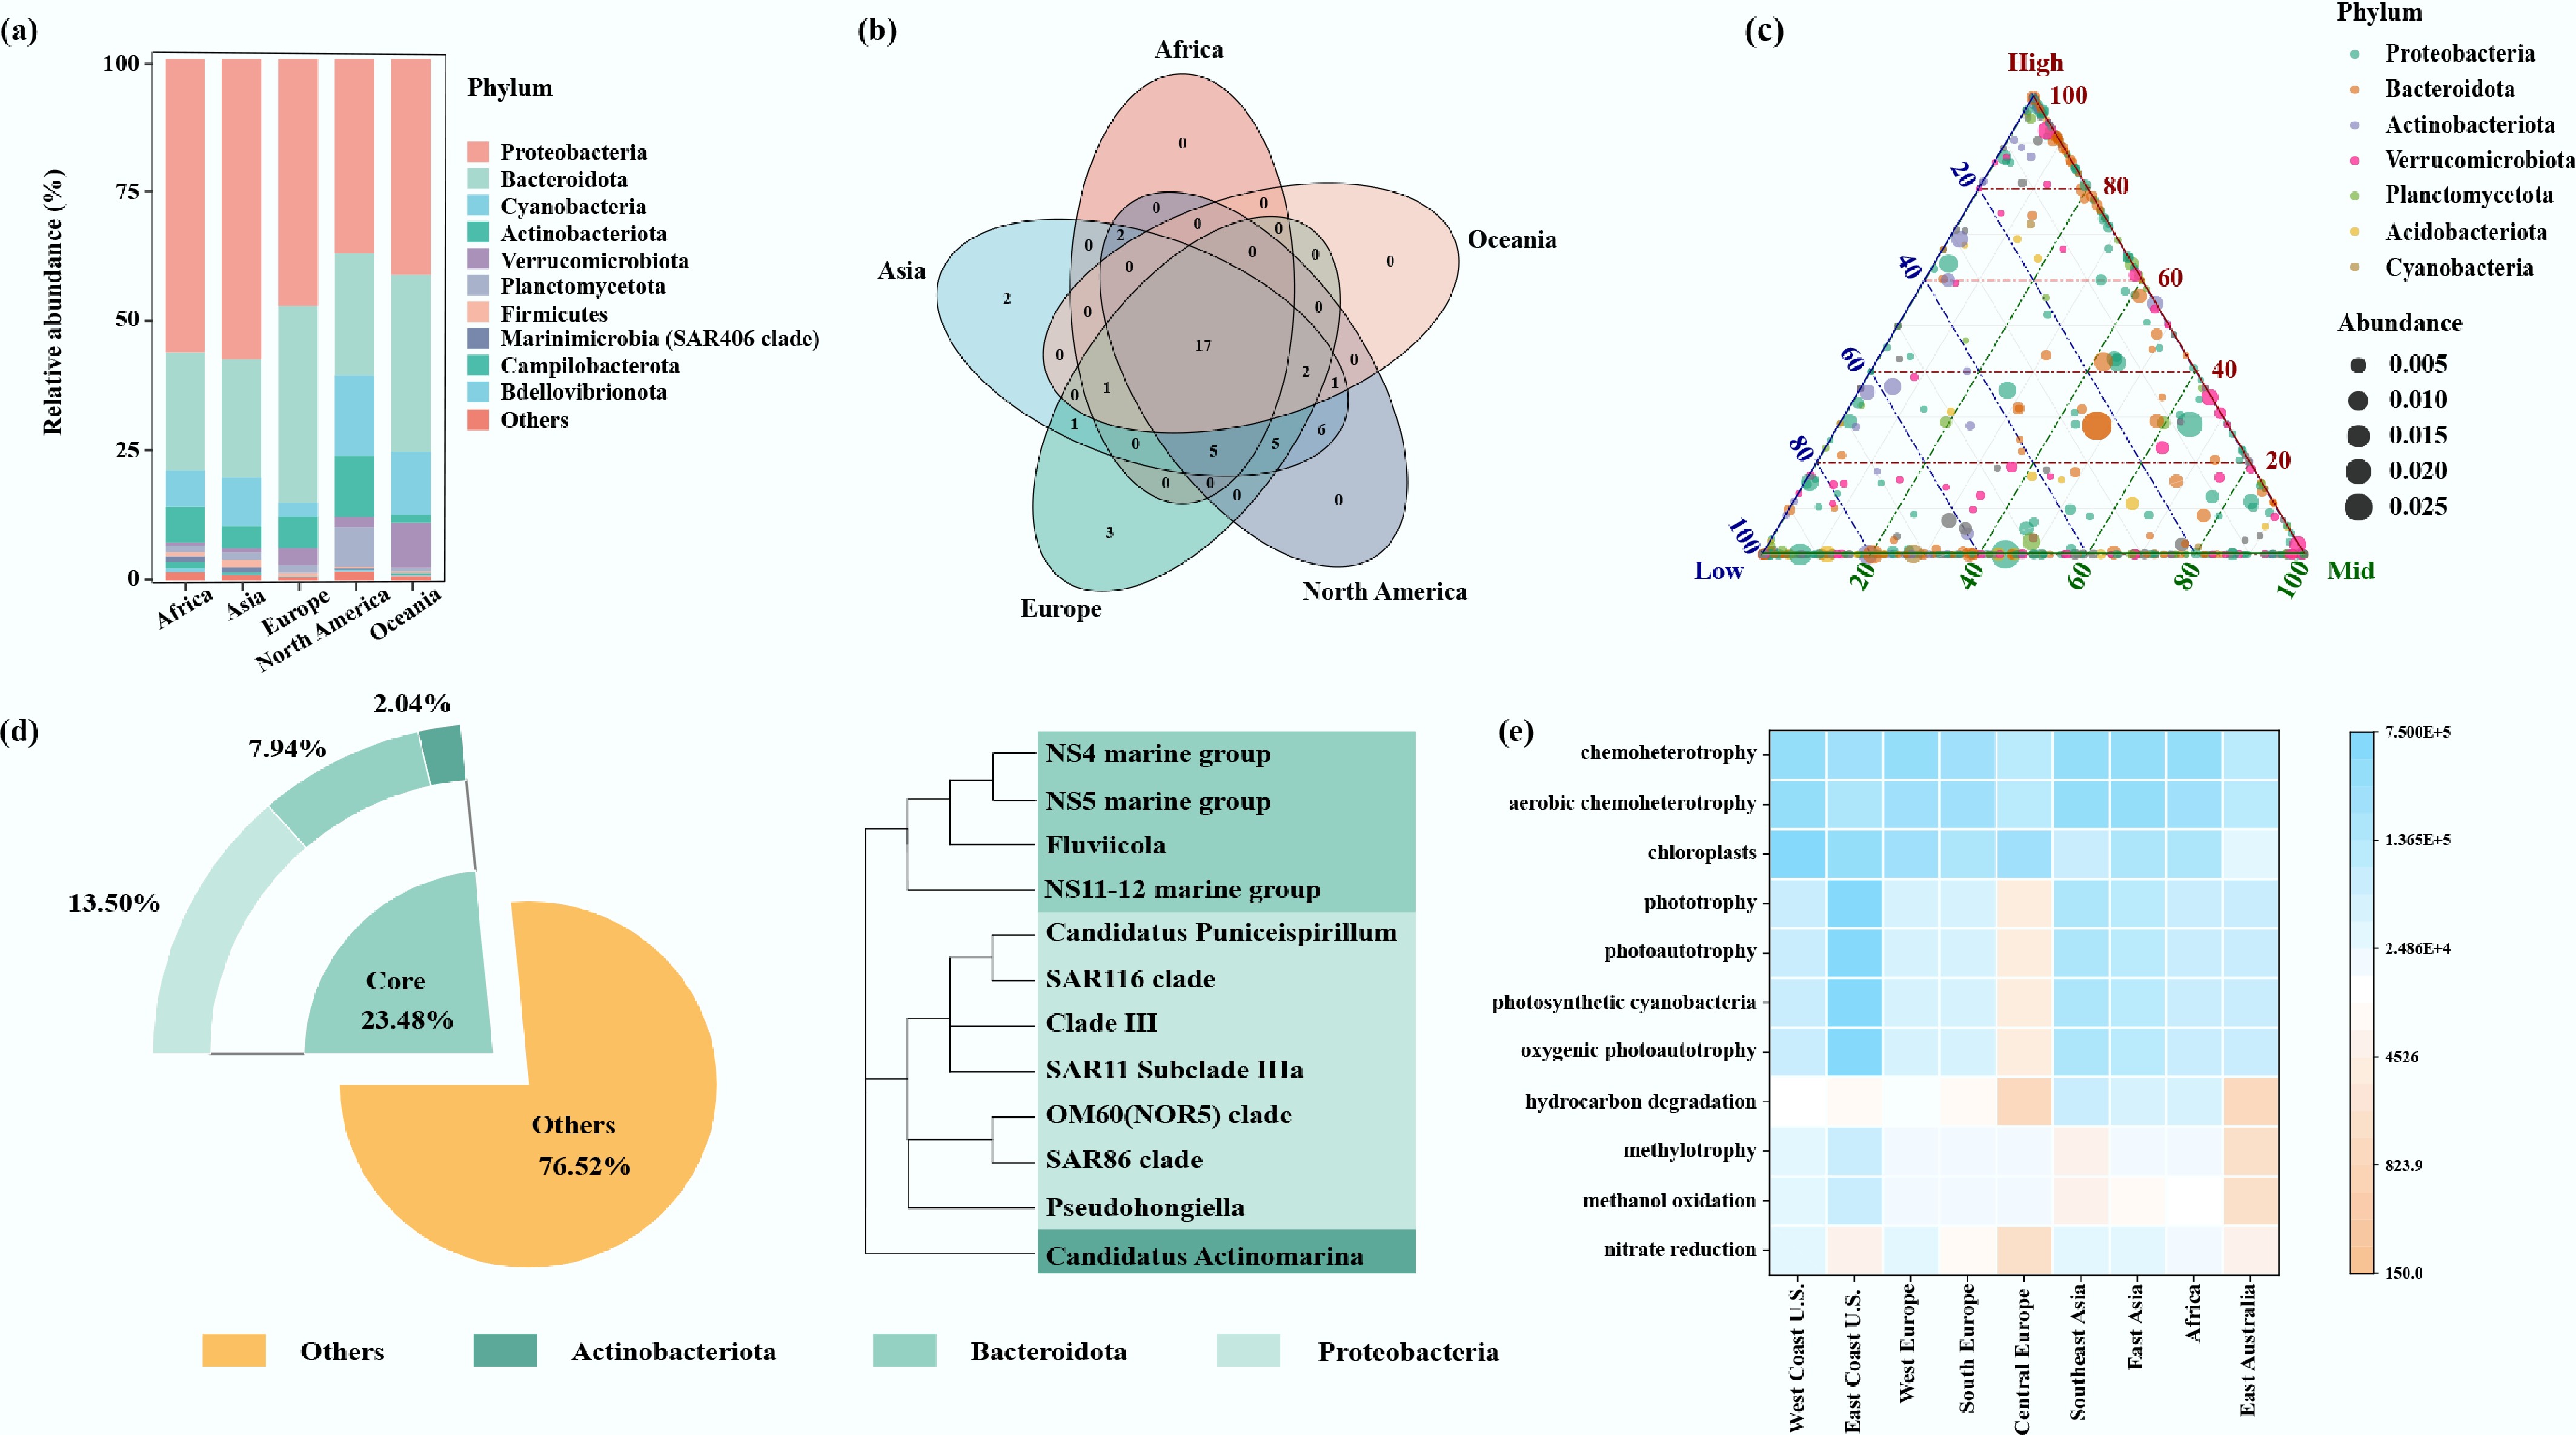
Figure 3.
(a) Relative abundances of the dominant phyla in port water. (b) Venn diagram of bacterial communities' interactions among different continents. (c) Ternary plots showing the distribution of dominant bacterial phyla across different latitudes. Each circle corresponds to one phylum, its position is determined by its relative abundance. (d) Relative abundance and phylogenetic tree of core ASVs in port water. (e) Heatmap of bacterial community functions in port water.
-
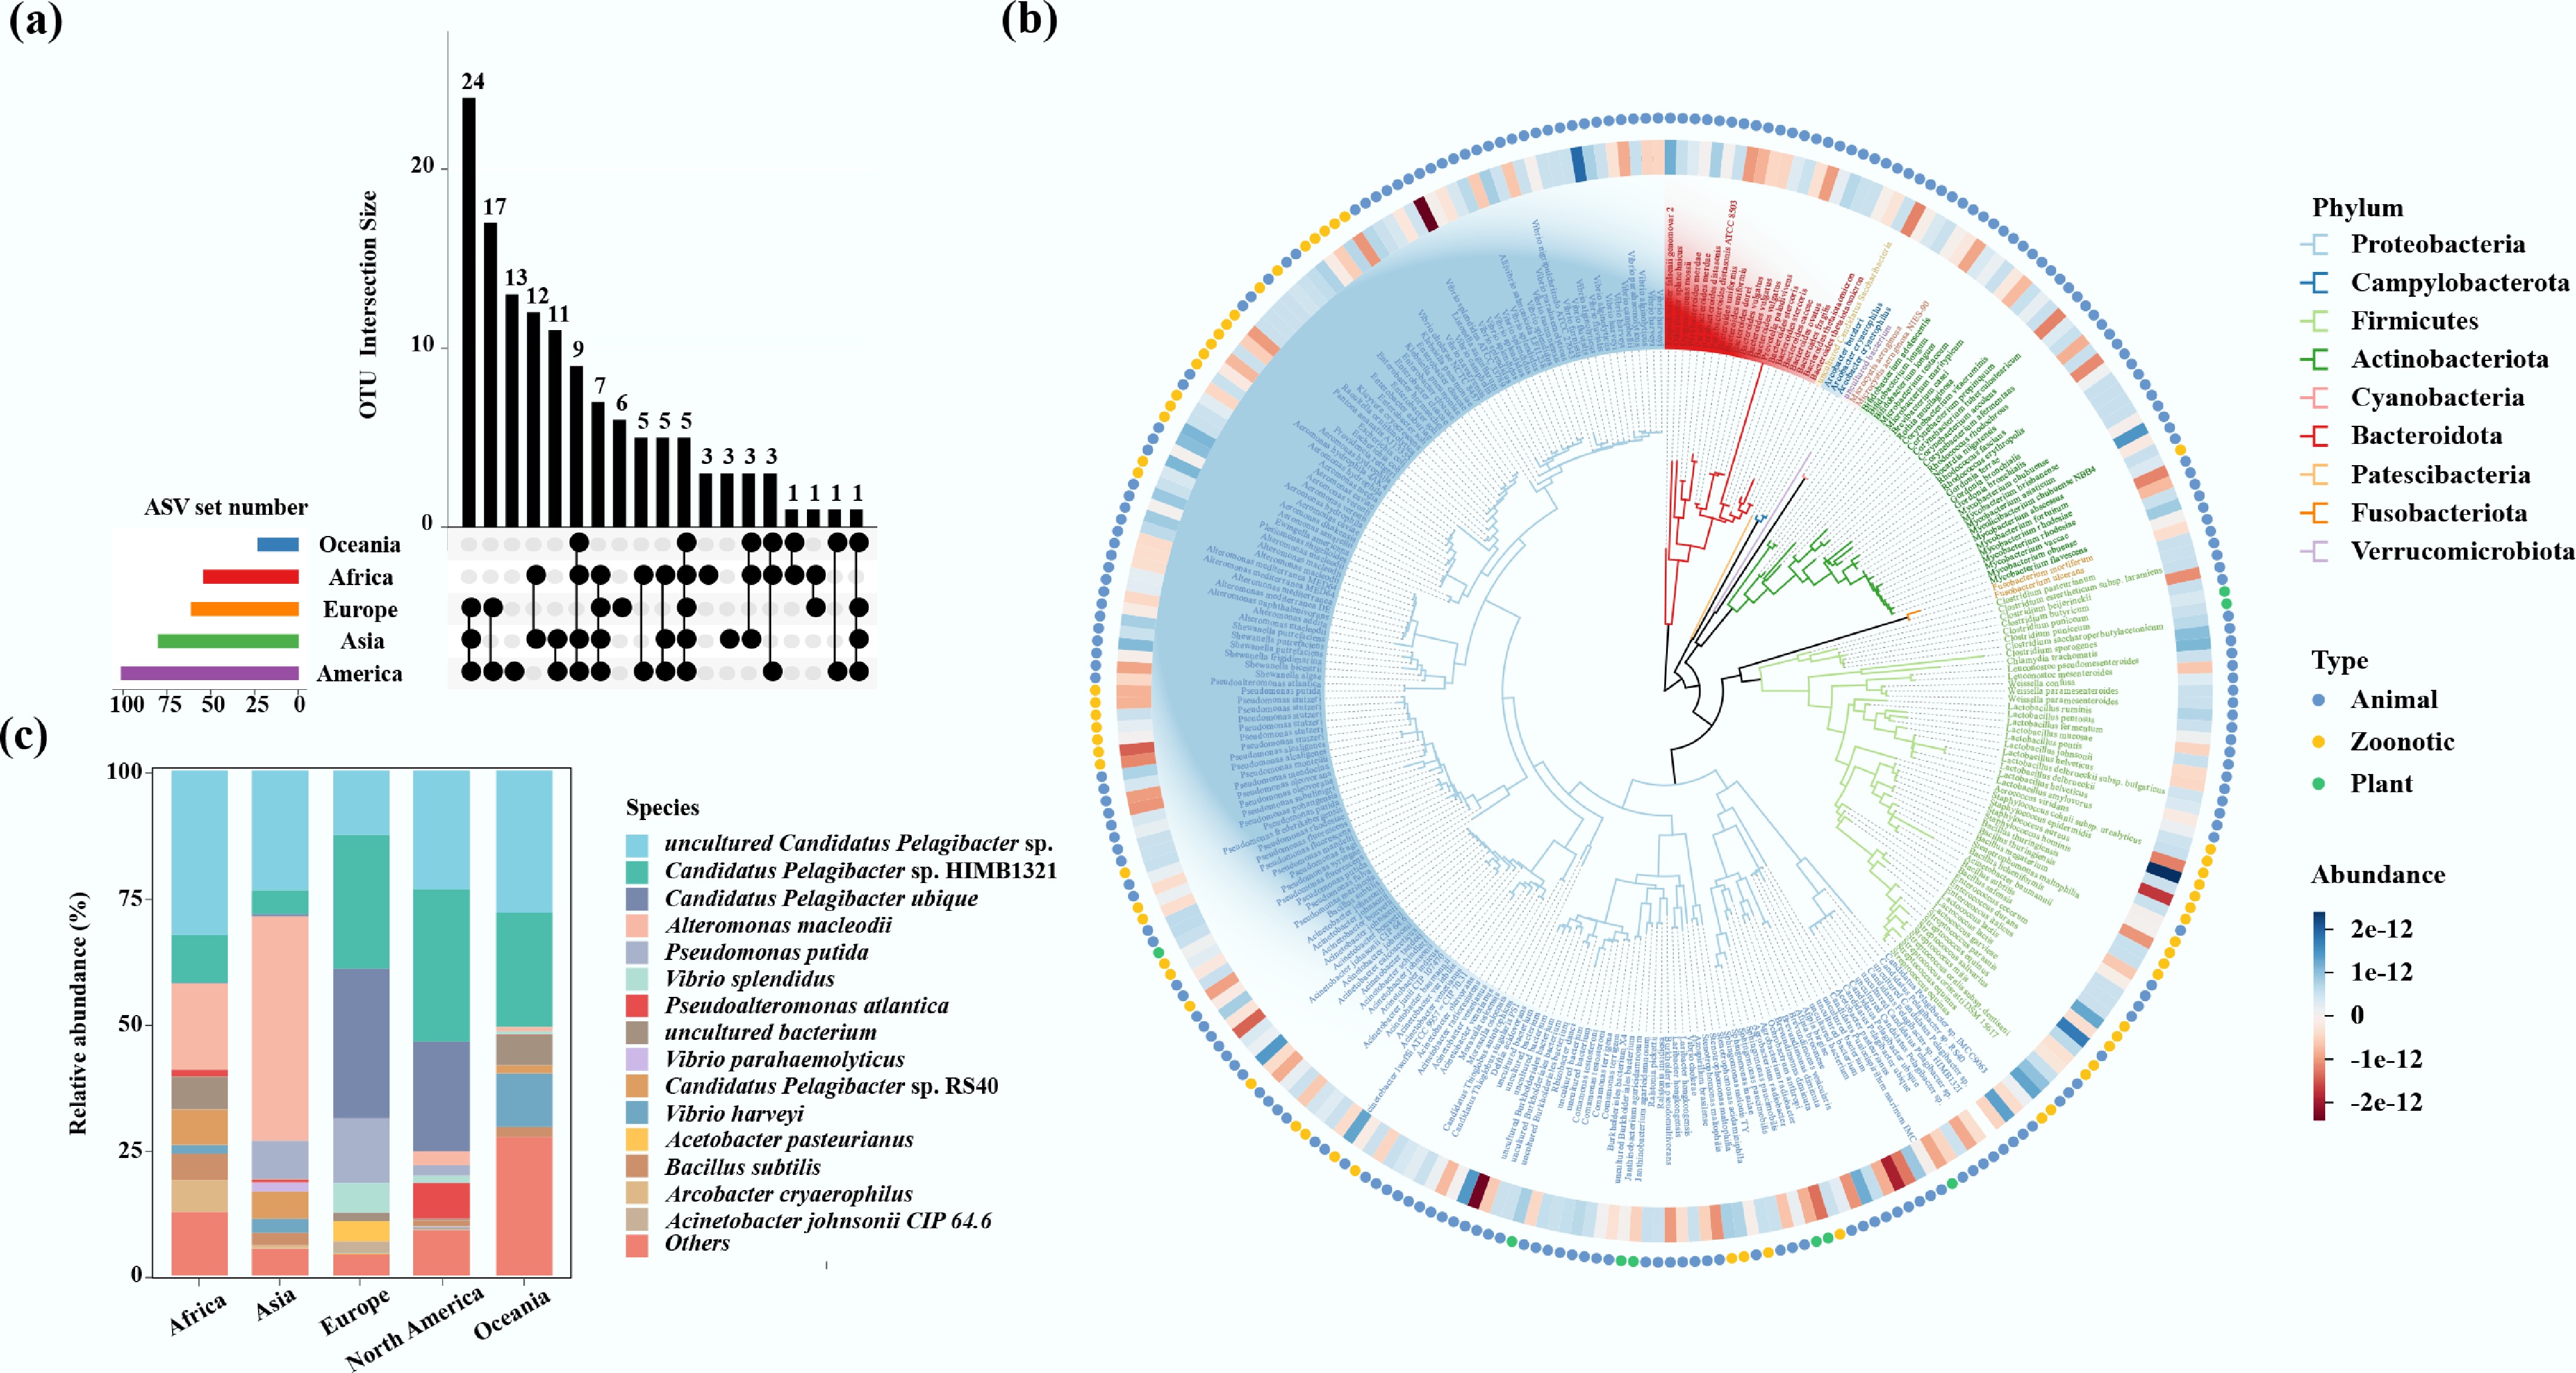
Figure 4.
(a) Upset plot of potential pathogenic bacteria among different continents. Overlapping regions between columns indicate the shared pathogens among continents. (b) The phylogenetic tree of potential pathogenic bacteria. (c) The pathogenic bacterial community composition in port water.
-
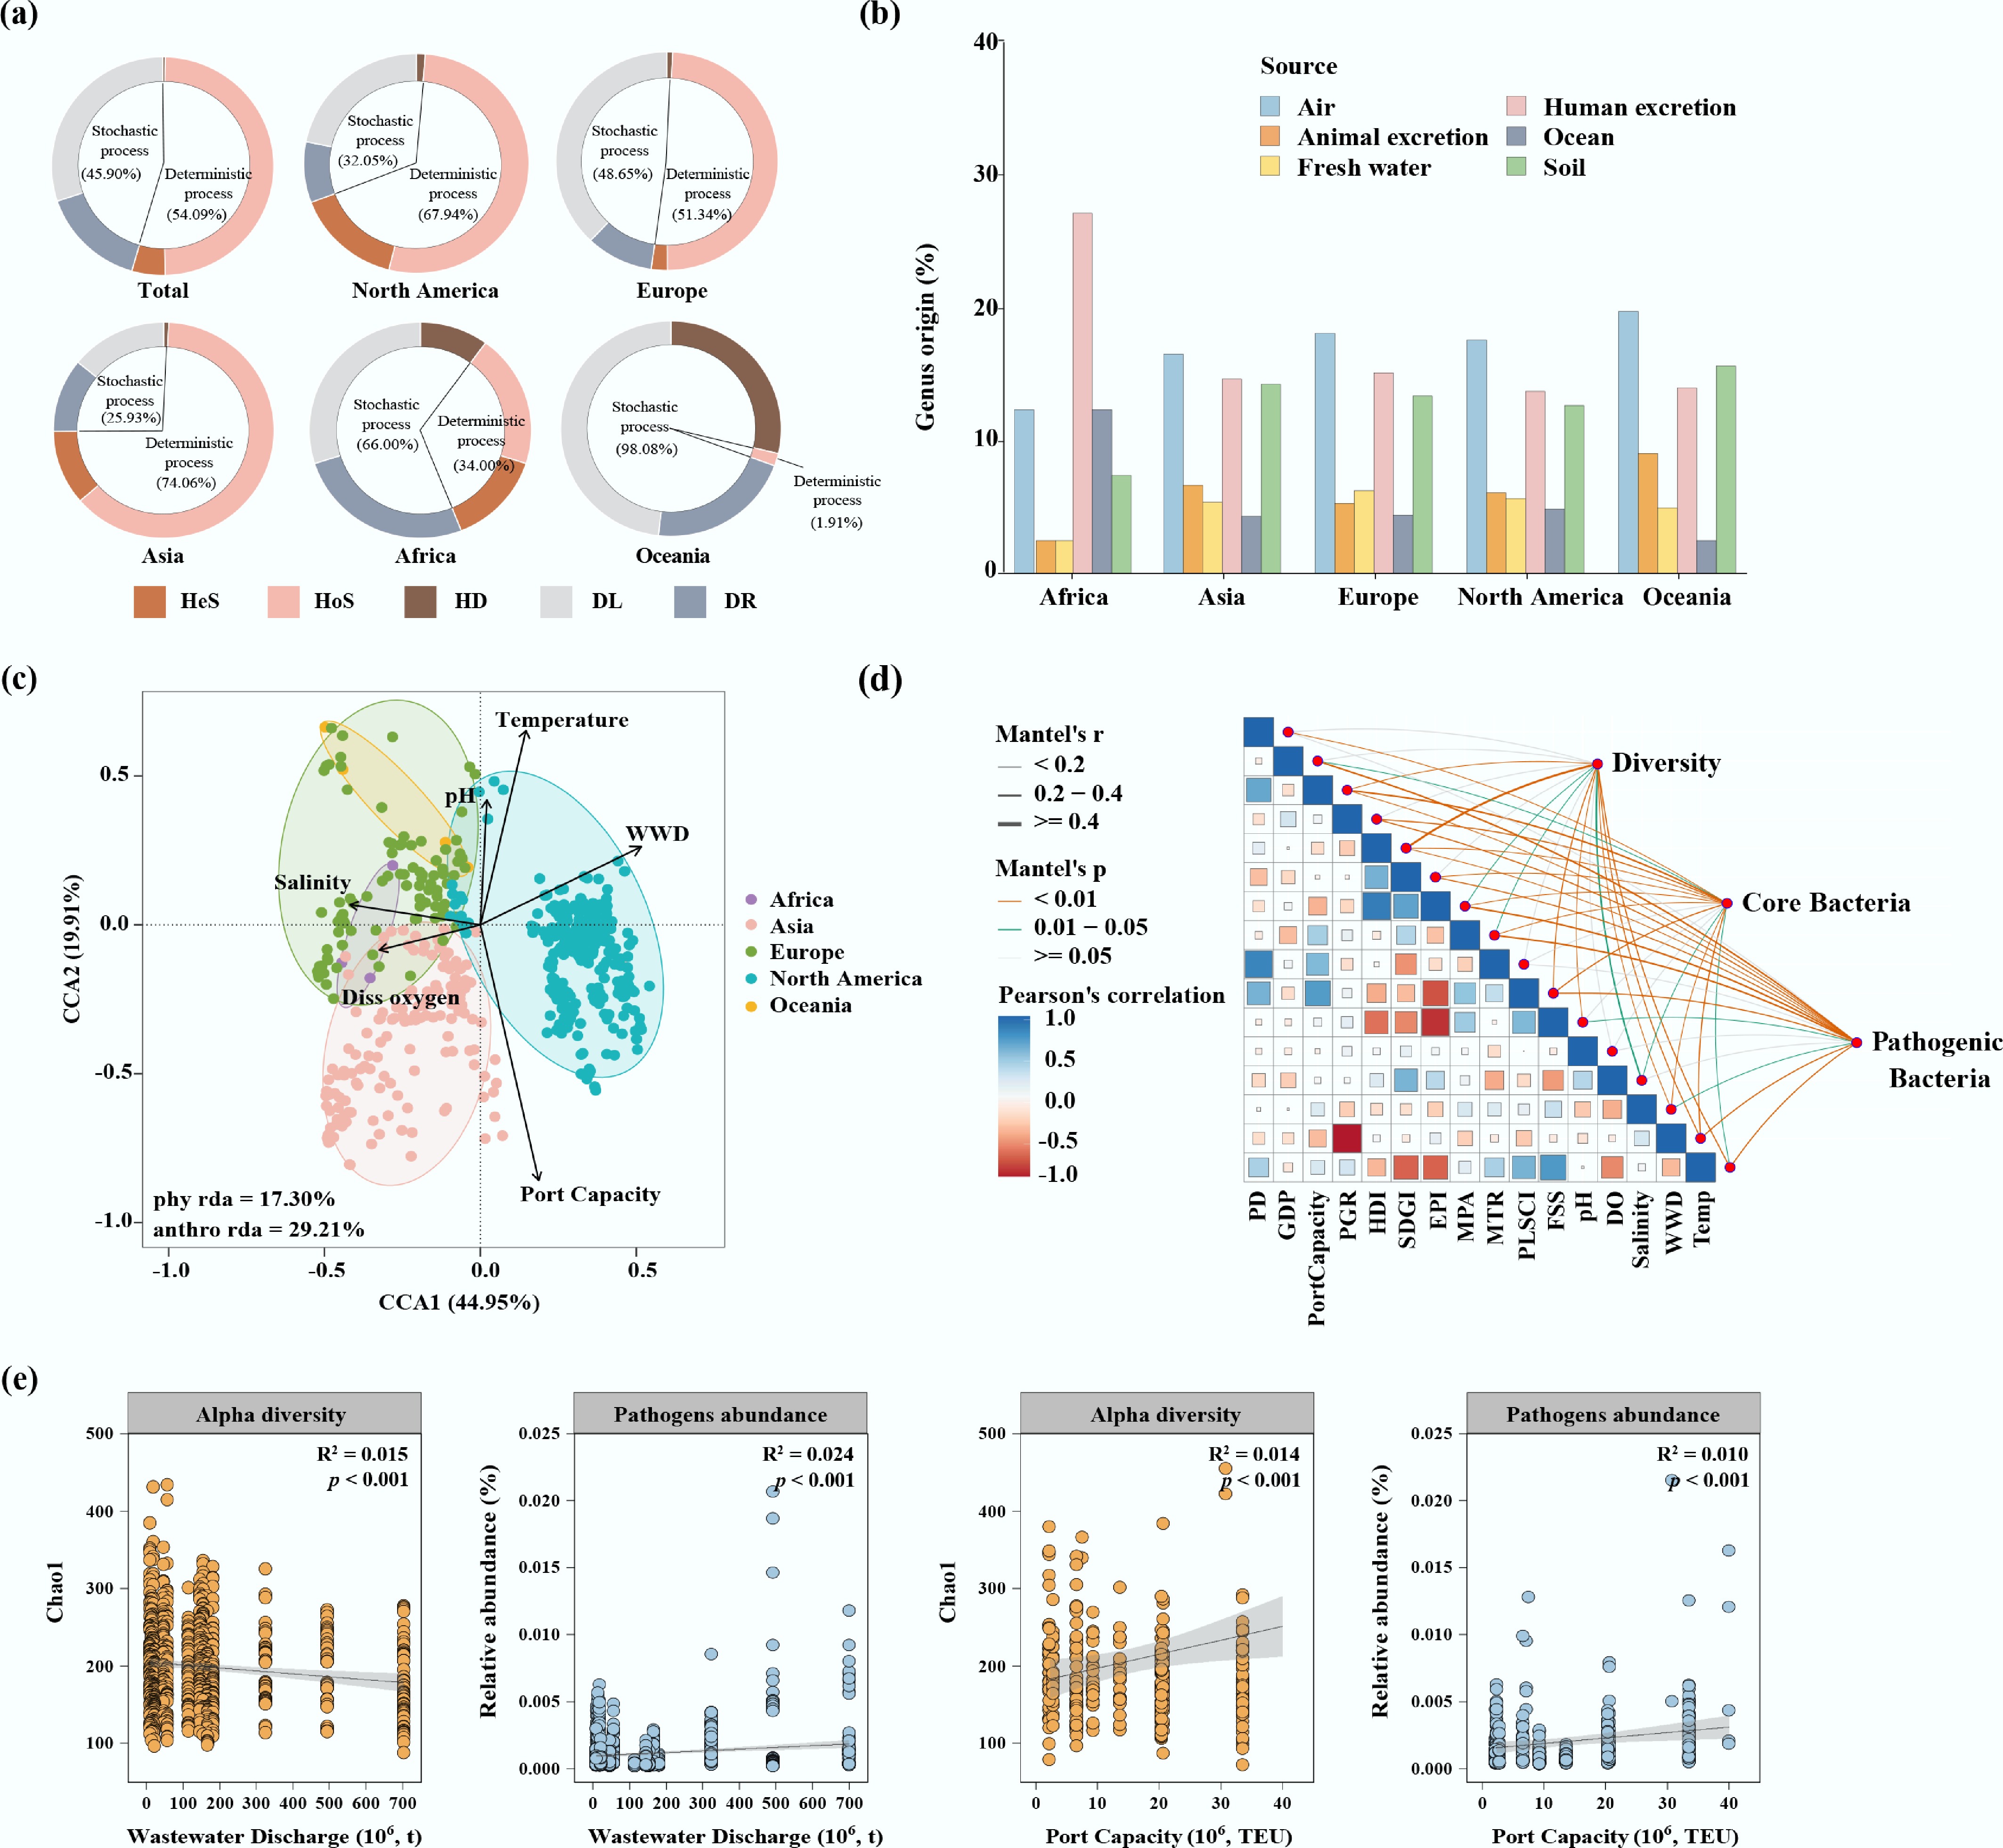
Figure 5.
(a) Assembly processes of the port water bacterial communities. (b) Contributions of various environments to port water bacterial communities determined by SourceTracker. (c) Canonical correspondence analysis (CCA) of environmental factors and anthropogenic factors on bacterial communities. (d) Relationships between port water bacterial communities and socioeconomic factors: population density (PD), gross domestic product (GDP), population growth rate (PGR), sustainable development goals index (SDGI), human development index (HDI), wastewater discharge (WWD), environmental performance index (EPI), dissolved oxygen (DO), port capacity, port liner shipping connectivity index (PLSCI), marine protected area (MPA), marine trophic index (MTI), fish stock status (FSS). (e) Linear relationships of wastewater discharge and port capacity with bacterial diversity and pathogen abundance in port water.
Figures
(5)
Tables
(0)