-
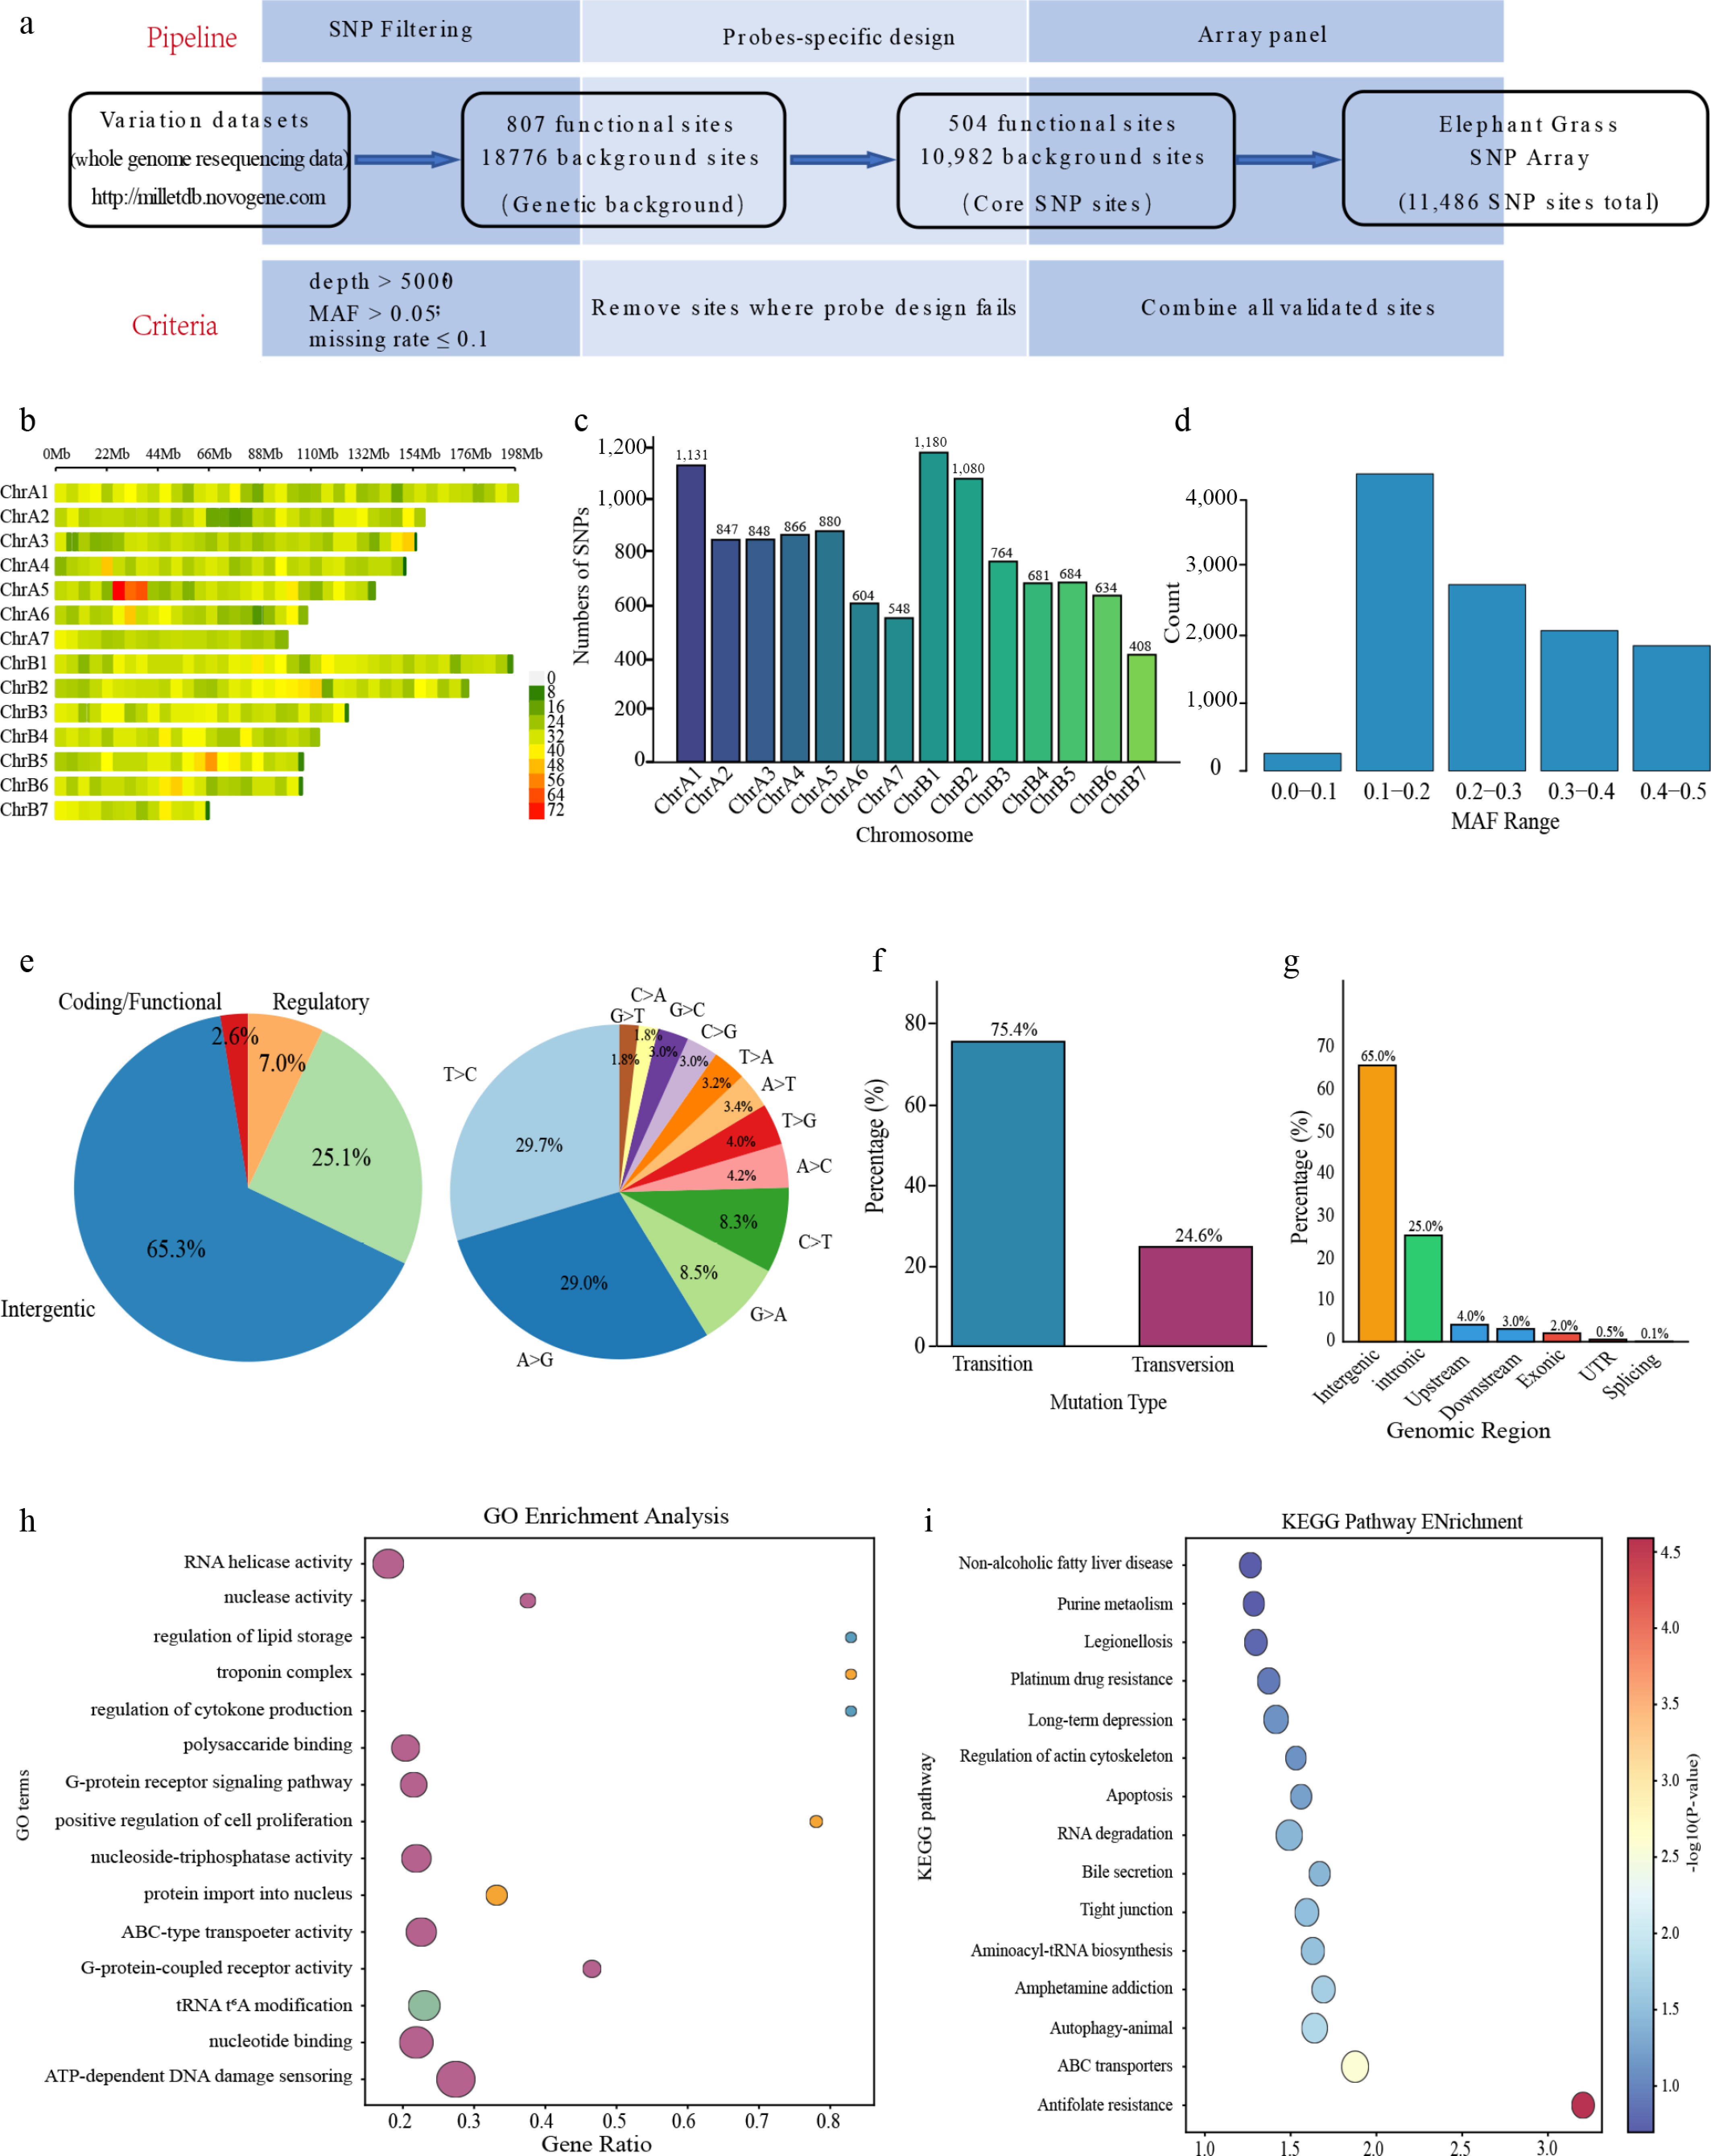
Figure 1.
Genome-wide SNP analysis based on the 10K liquid-phase array. (a) Schematic overview of the array's design and workflow. (b) Distribution of SNP loci across the 14 chromosomes. (c) Correlation between chromosome length and number of SNPs. (d) MAF distribution of the SNP set. (e) Spectrum of SNP mutation types. (f) Proportion of transition (Ts) and transversion (Tv) events. (g) Genomic annotation of SNP locations. (h) GO enrichment analysis of genes associated with SNPs. (i) KEGG pathway enrichment analysis.
-
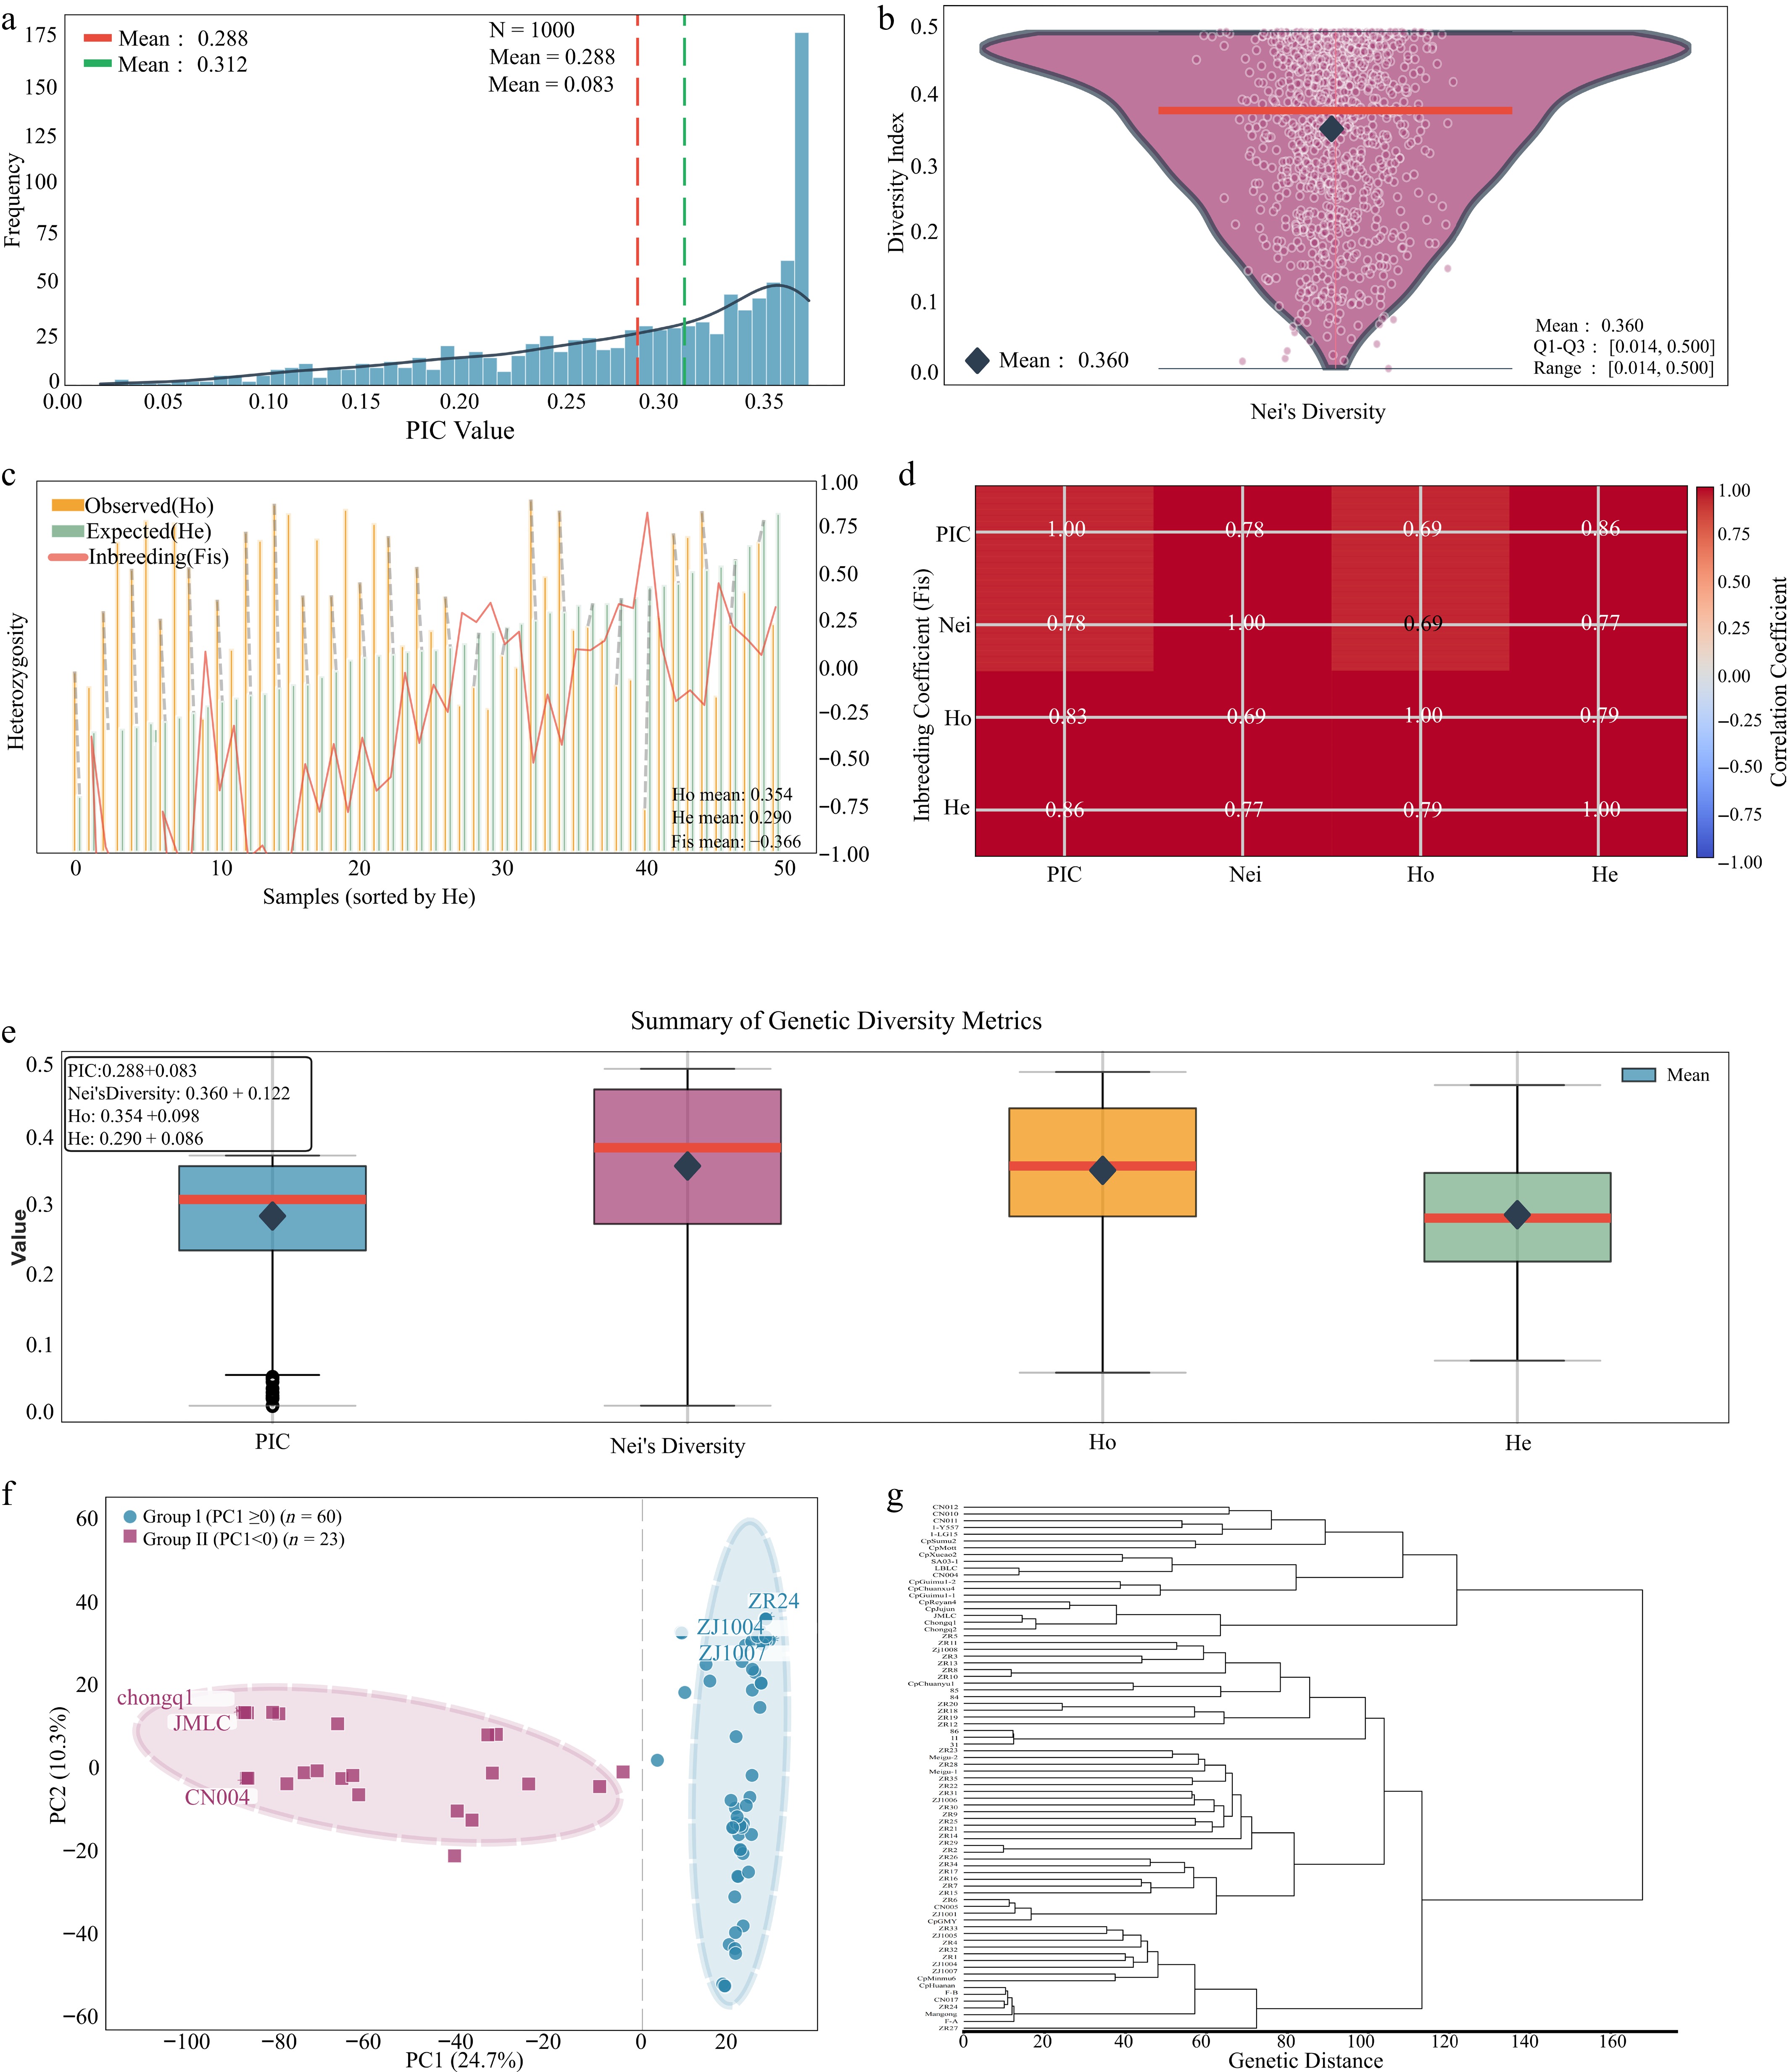
Figure 2.
Genetic diversity and population structure analysis. (a) PIC distribution. (b) Nei's GD. (c) Comparisons of Ho and He. (d) Inbreeding coefficient (Fis). (e) Correlation matrix among genetic indices (PIC, Nei's GD, Ho, and He). The color scale represents the Pearson correlation coefficients (r), with red indicating strong positive correlations and blue indicating weaker correlations. All correlations were statistically significant (p < 0.001). (f) PCA plot. (g) Phylogenetic tree.
-
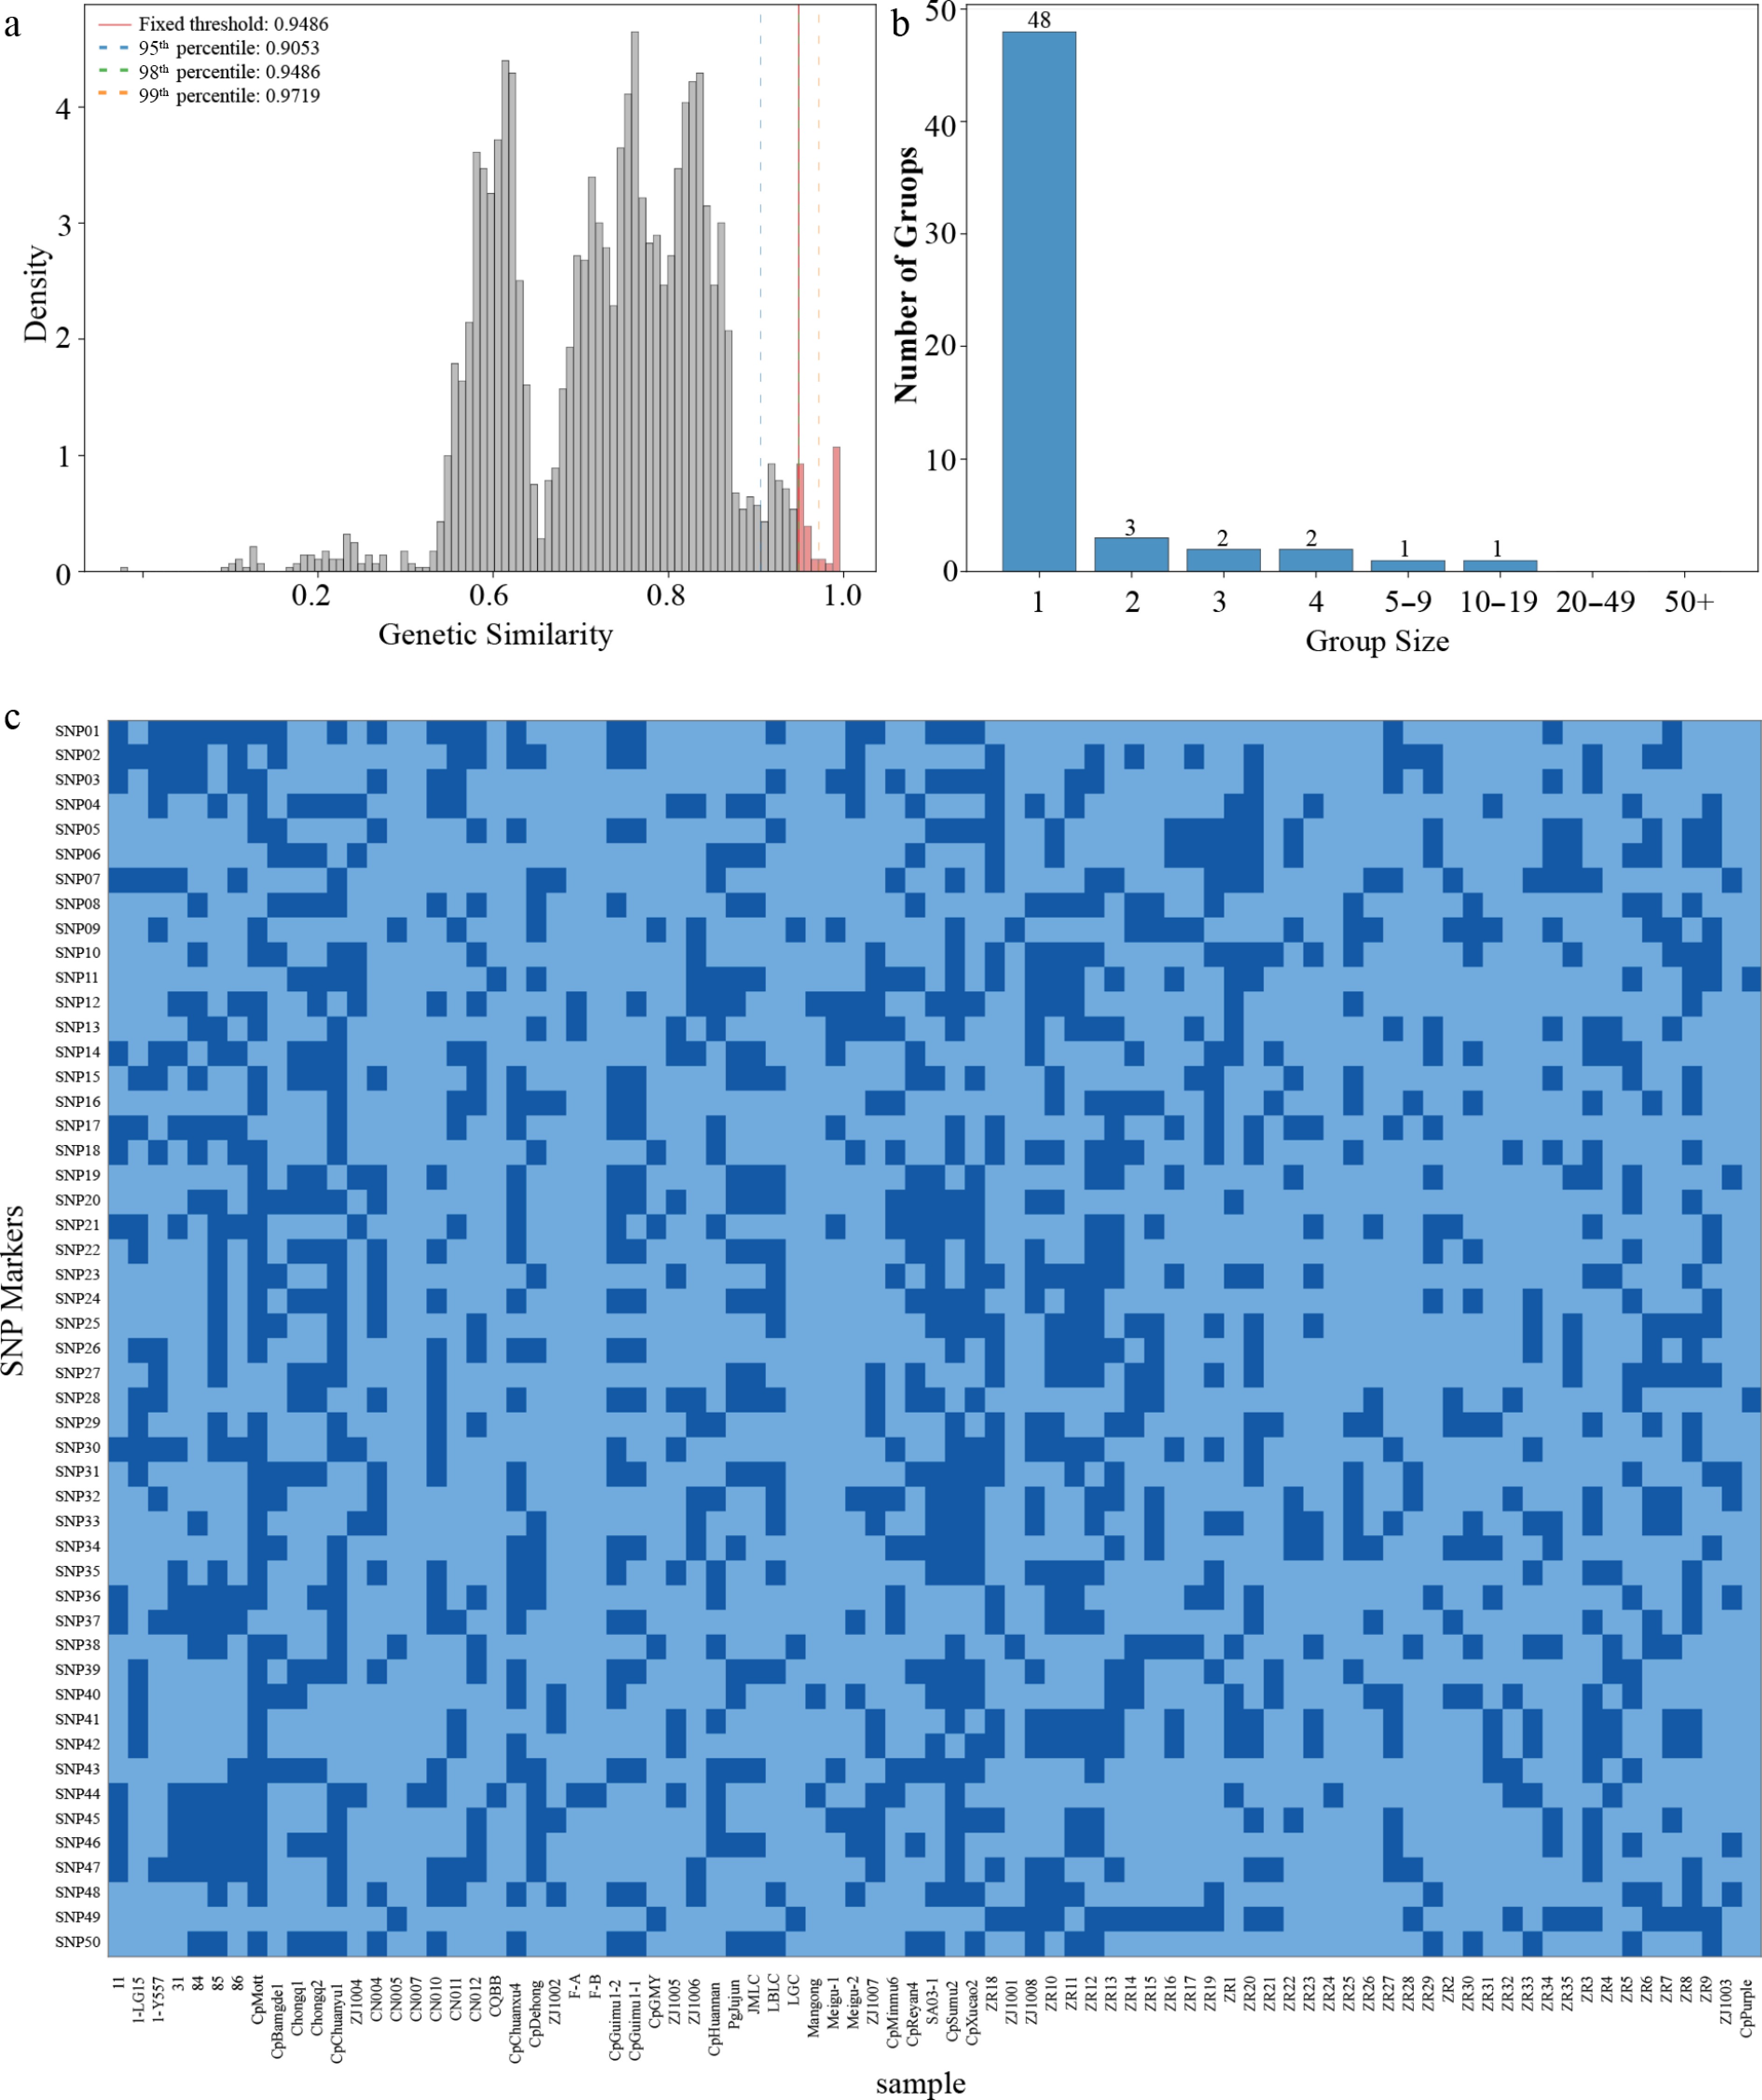
Figure 3.
Cultivar identification and fingerprint construction. (a) Distribution of genetic similarity coefficients. (b) Cultivar grouping under the GS ≥ 0.949 threshold. (c) Heatmap of 50 core SNP fingerprints.
-
Category Metric Value Notes Sample and design Samples with full quality control (QC) 83 Total 83 accessions were genotyped. Total SNPs on the array 11,486 504 functional + 10,982 background SNPs. Sequencing quality Average effective rate > 99.85% – Average Q30 > 94.79% – Average mapping rate 97.85% – Target capture Average SNP call rate > 97% – Average depth on the target > 200× – ≥10× coverage rate > 96% – Reproducibility Replicates' concordance 96.17% From prearray validation. Data integration Total samples in the final analysis 83 All passed genotype quality filters. Table 1.
Performance metrics of the custom 10K liquid-phase SNP array for genotyping Pennisetum germplasm.
Figures
(3)
Tables
(1)