-
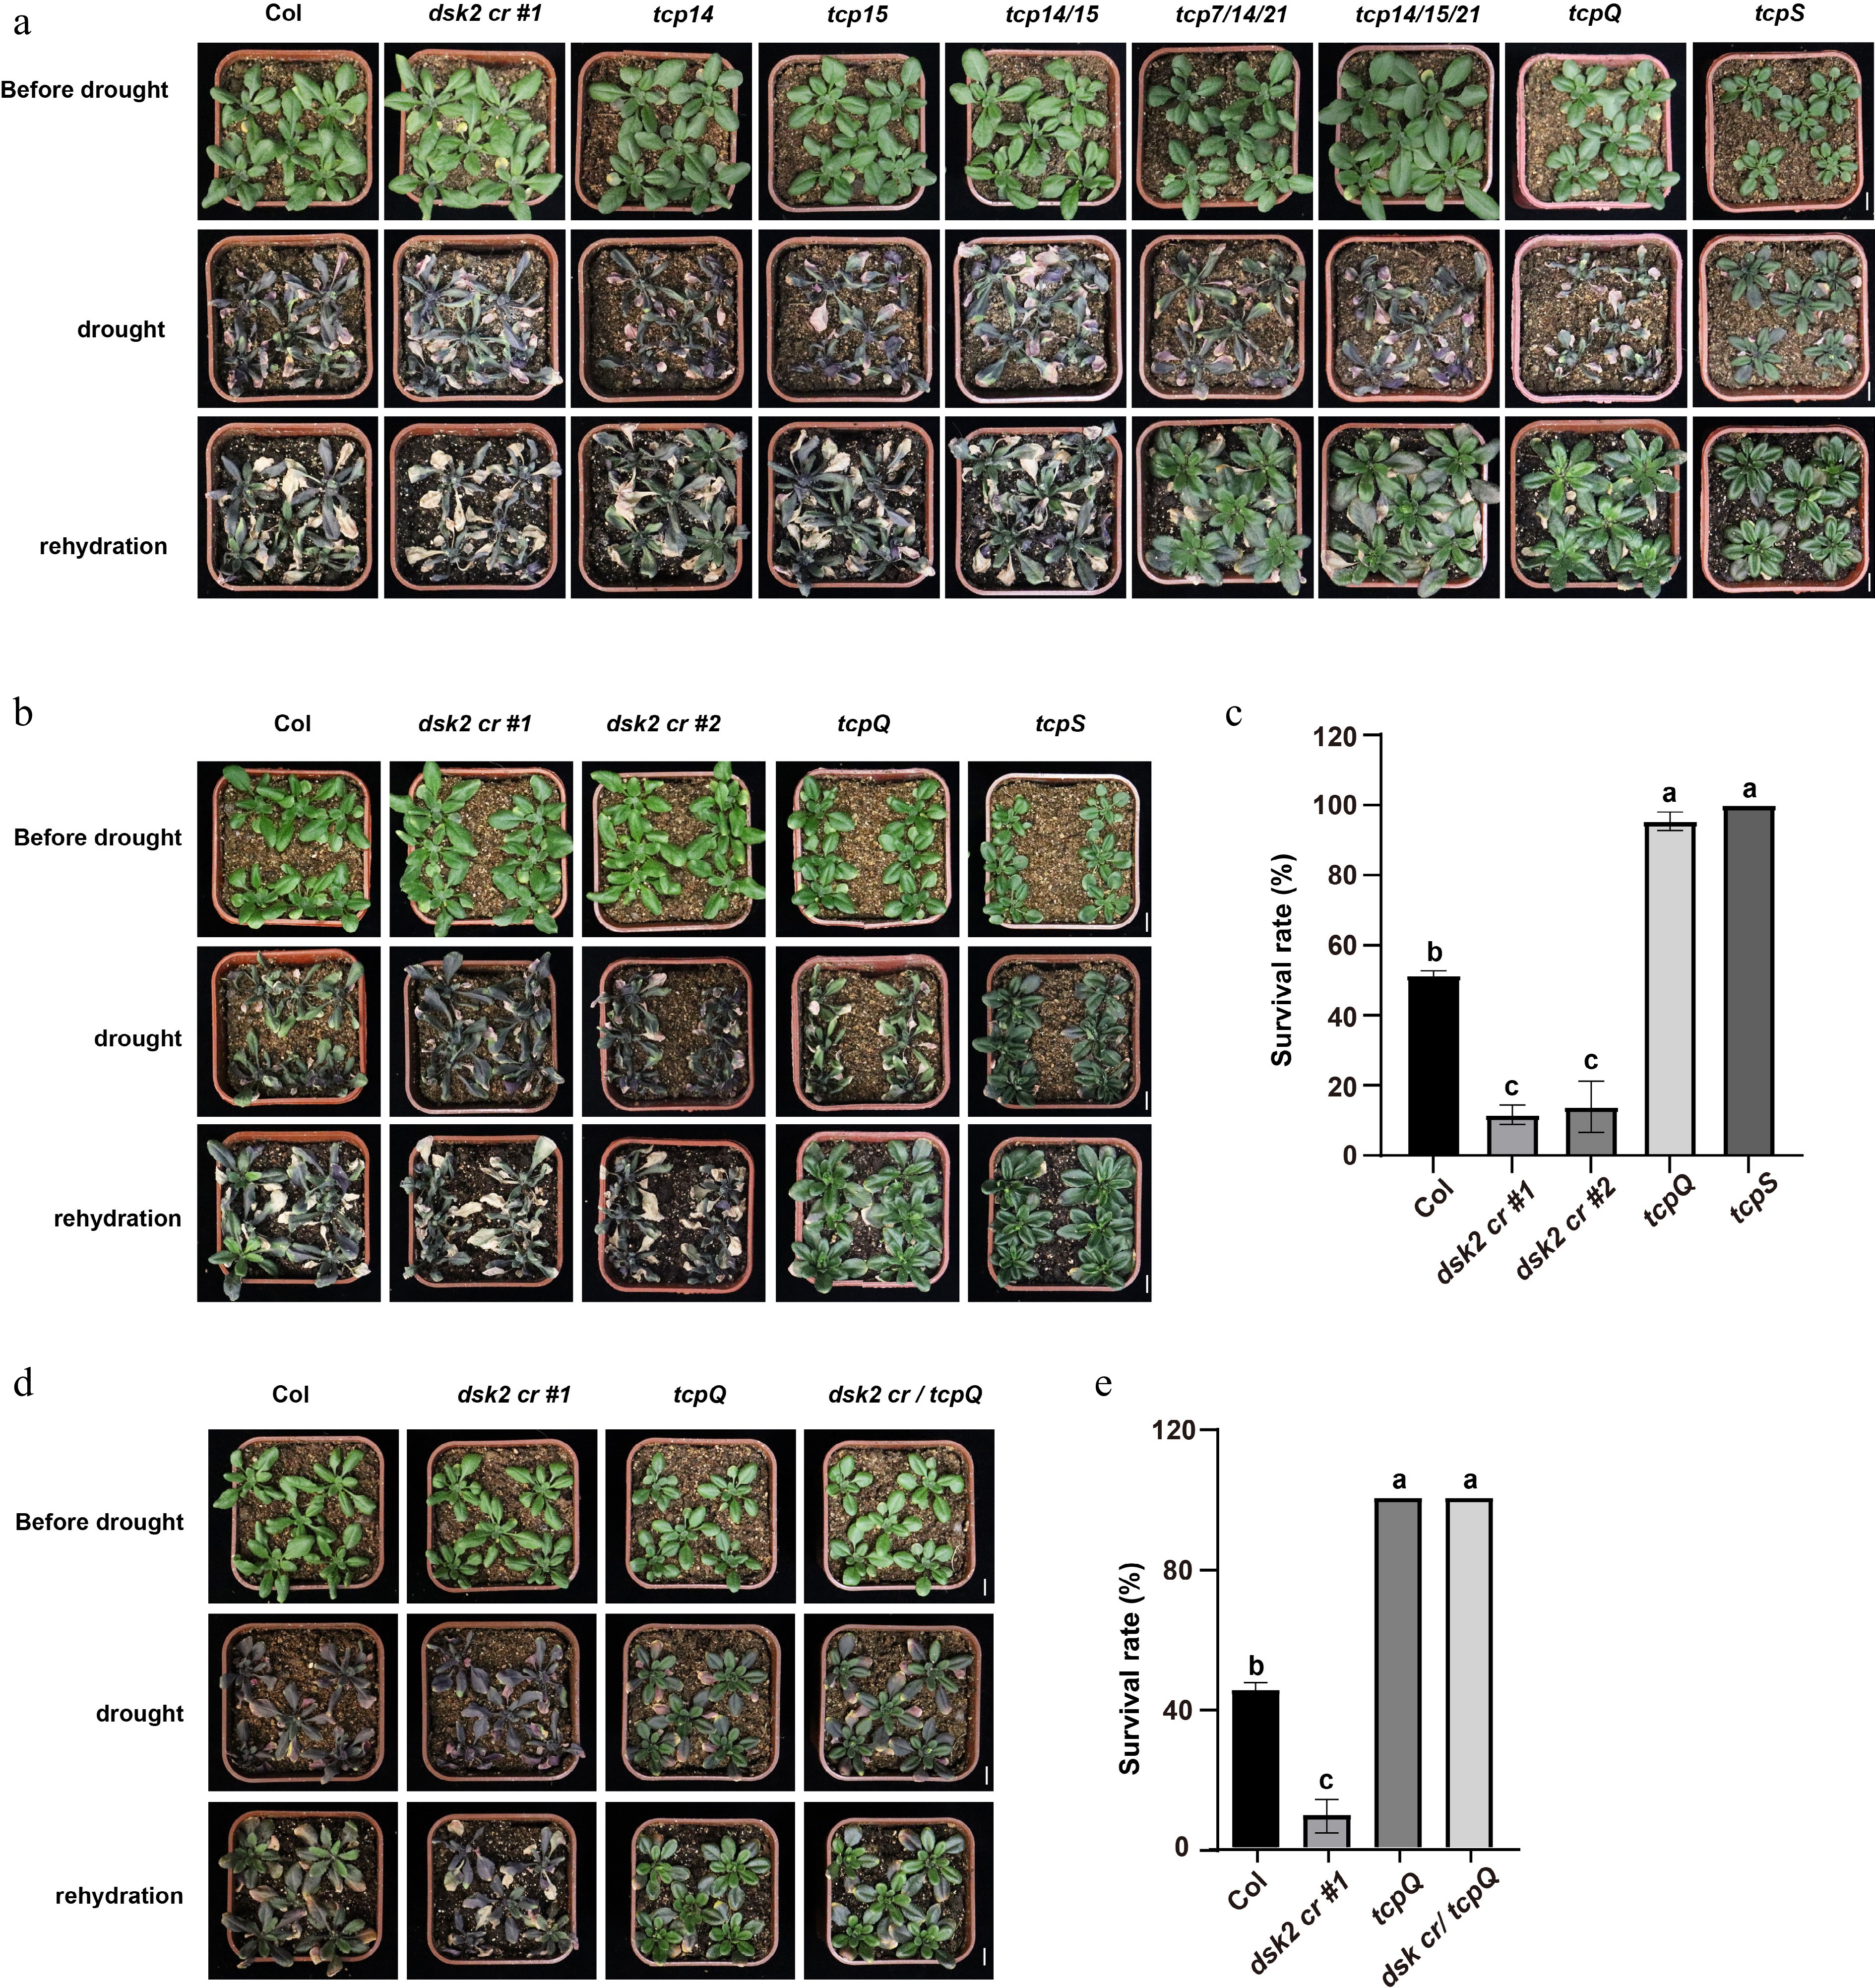
Figure 1.
Role of DSK2-TCP module in plant response to drought stress. (a) Images showing the phenotypes of each genotype before drought stress, after stress treatment, and following rehydration. Scale bars: 1 cm. (b) and (c) Phenotypes of Col, dsk2 cr #1, dsk2 cr #2, tcpQ, and tcpS after drought stress treatment. Plants producing normal leaves after the 2 d recovery period were considered survivors. (b) Representative images. Scale bars: 1 cm. (c) Quantification of survival rates. Data represent mean ± SEM (n = 3 biological replicates). Each replicate contained 10–12 independent plants. (d) and (e) Genetic analysis of DSK2 and TCPs. The dsk2 cr /tcpQ mutants were generated via CRISPR-Cas9 mutagenesis technology in the tcpQ background. (d) Representative images of phenotypes of Col, dsk2 cr #1, tcpQ, and dsk2 cr /tcpQ. Scale bars: 1 cm. (e) Survival rate of each genotype after drought stress. Data was shown as mean ± SEM of three biological replicates. Each replicate contained 6–7 independent plants of Col, dsk2 cr #1, and tcpQ, and 10 independent plants of dsk2 cr /tcpQ. In (c) and (e), the statistical significance was determined using one-way ANOVA (p < 0.05, ANOVA followed by Tukey's post hoc comparison test) analysis. Different letters denoted significant differences. Detailed information on the drought treatment protocol is provided in the Supplementary Text 1.
-
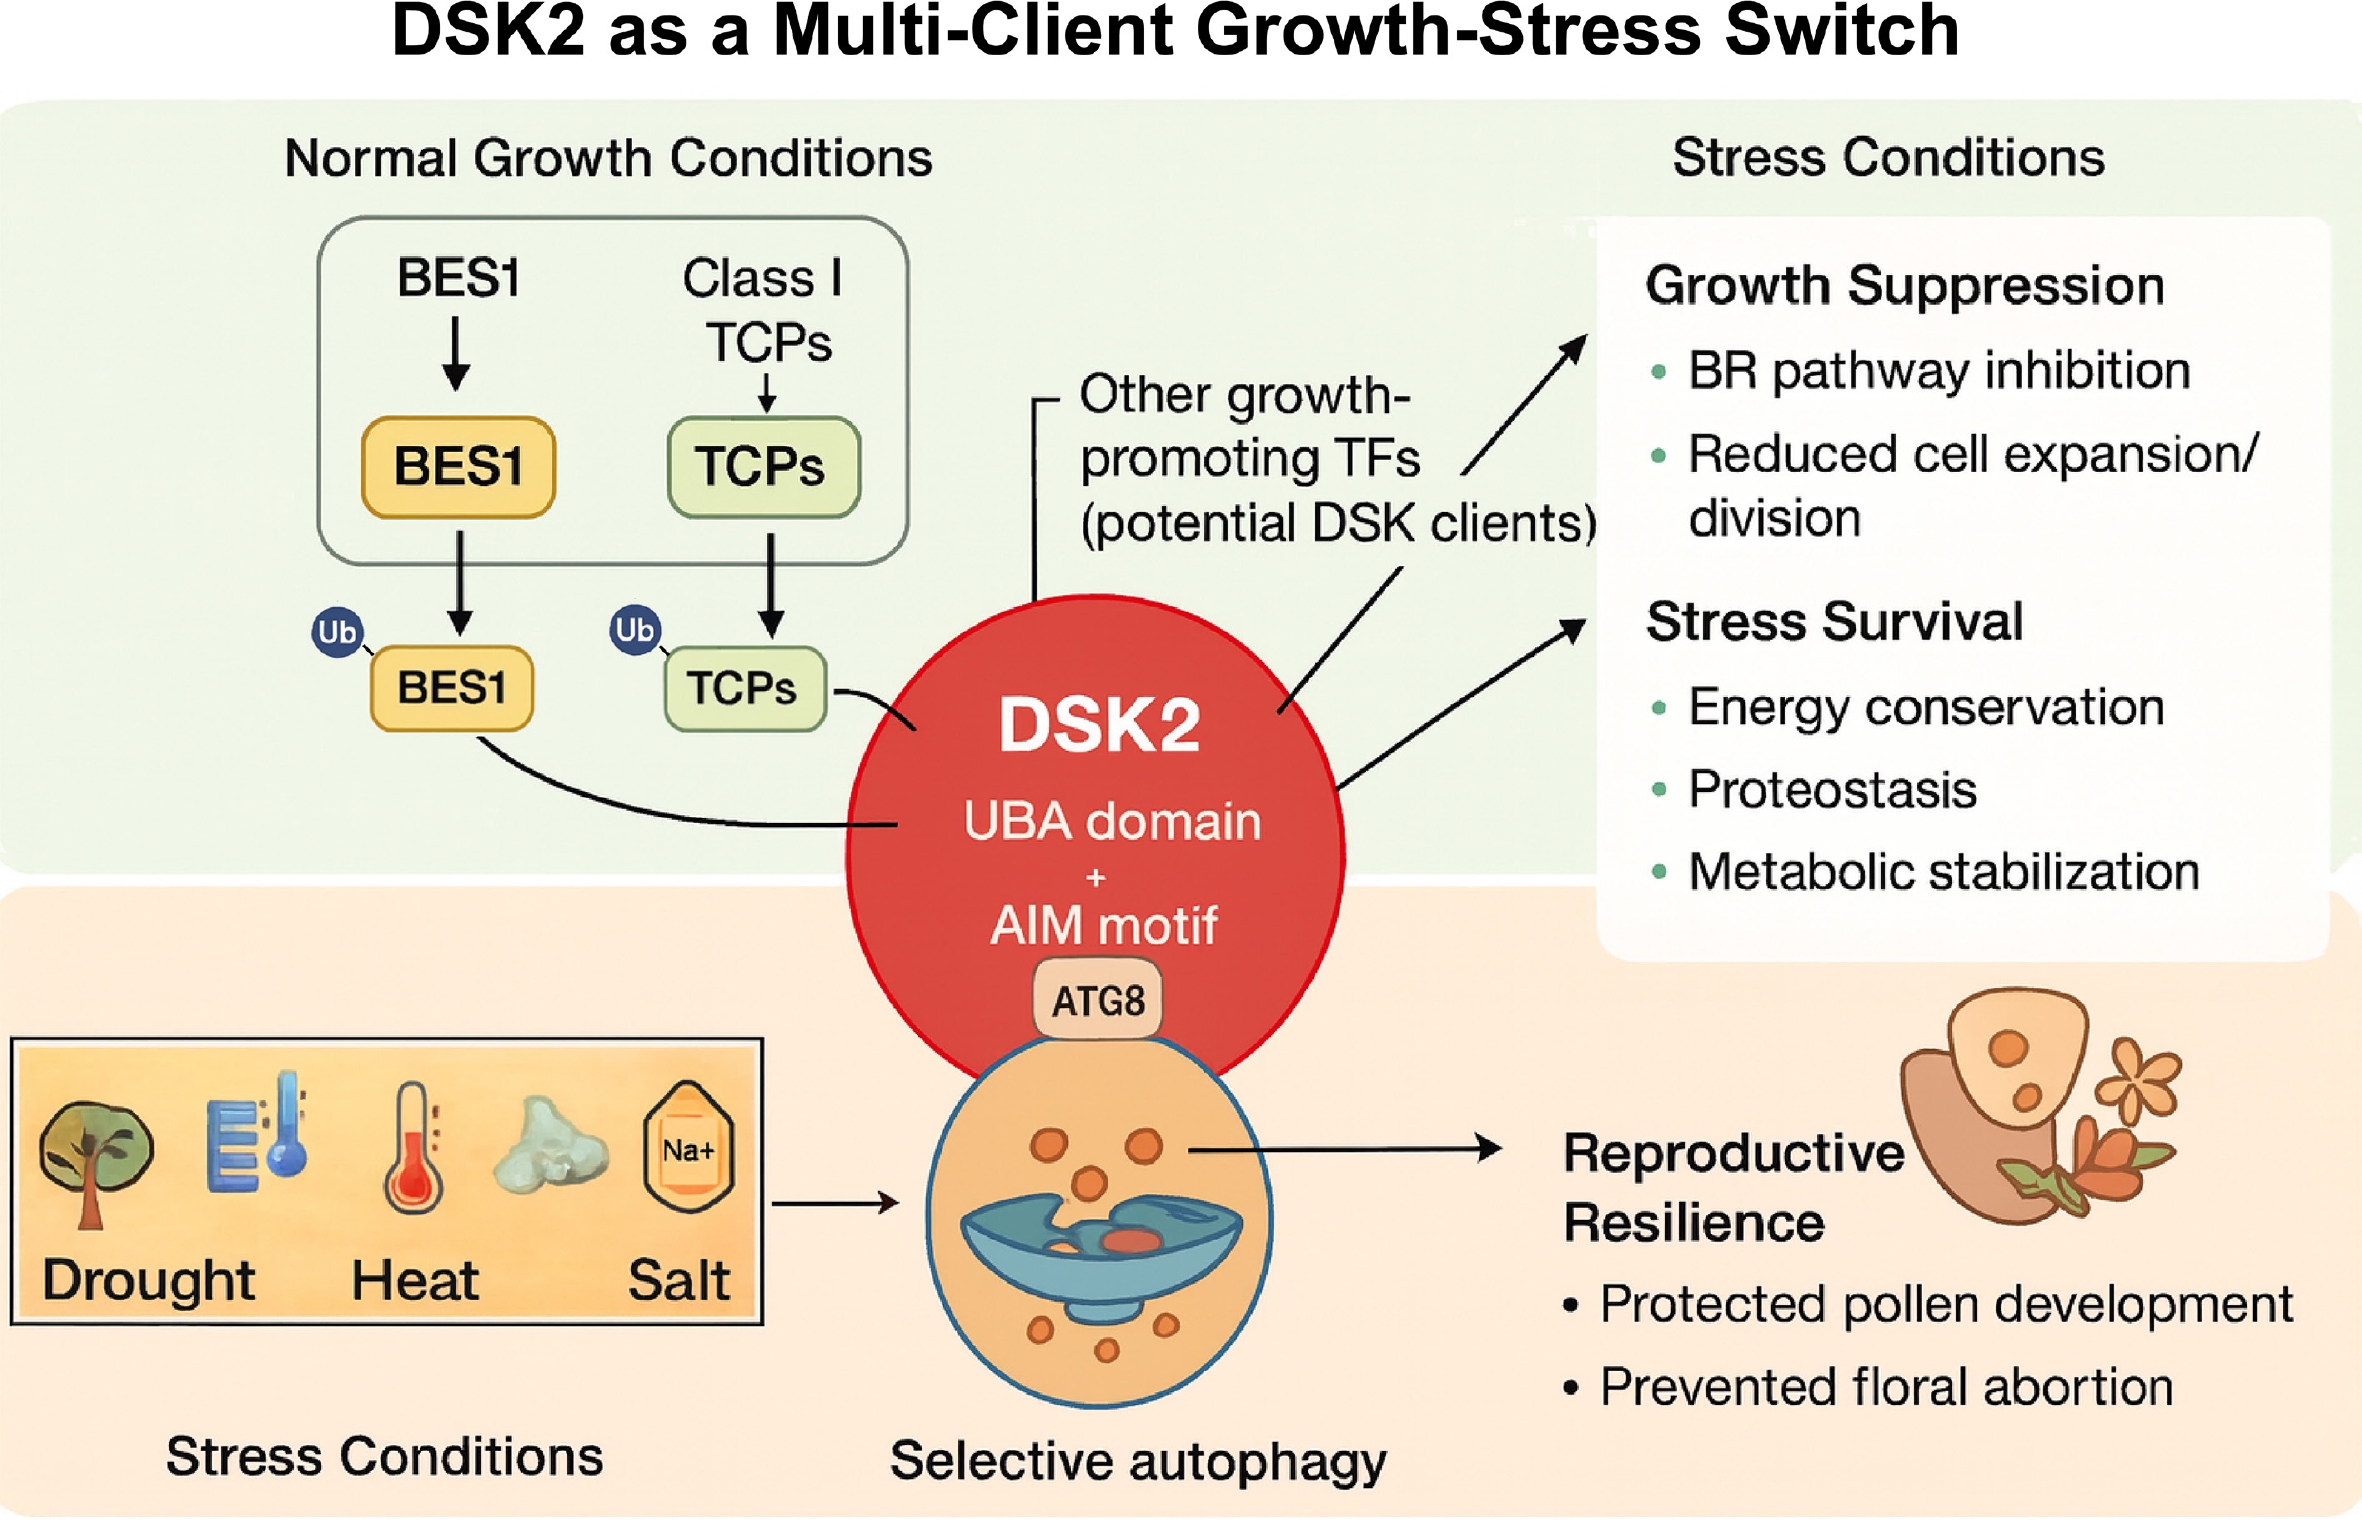
Figure 2.
A unified model of the DSK2 hub coordinating growth-to-stress transitions through multi-client degradation.
Figures
(2)
Tables
(0)