-
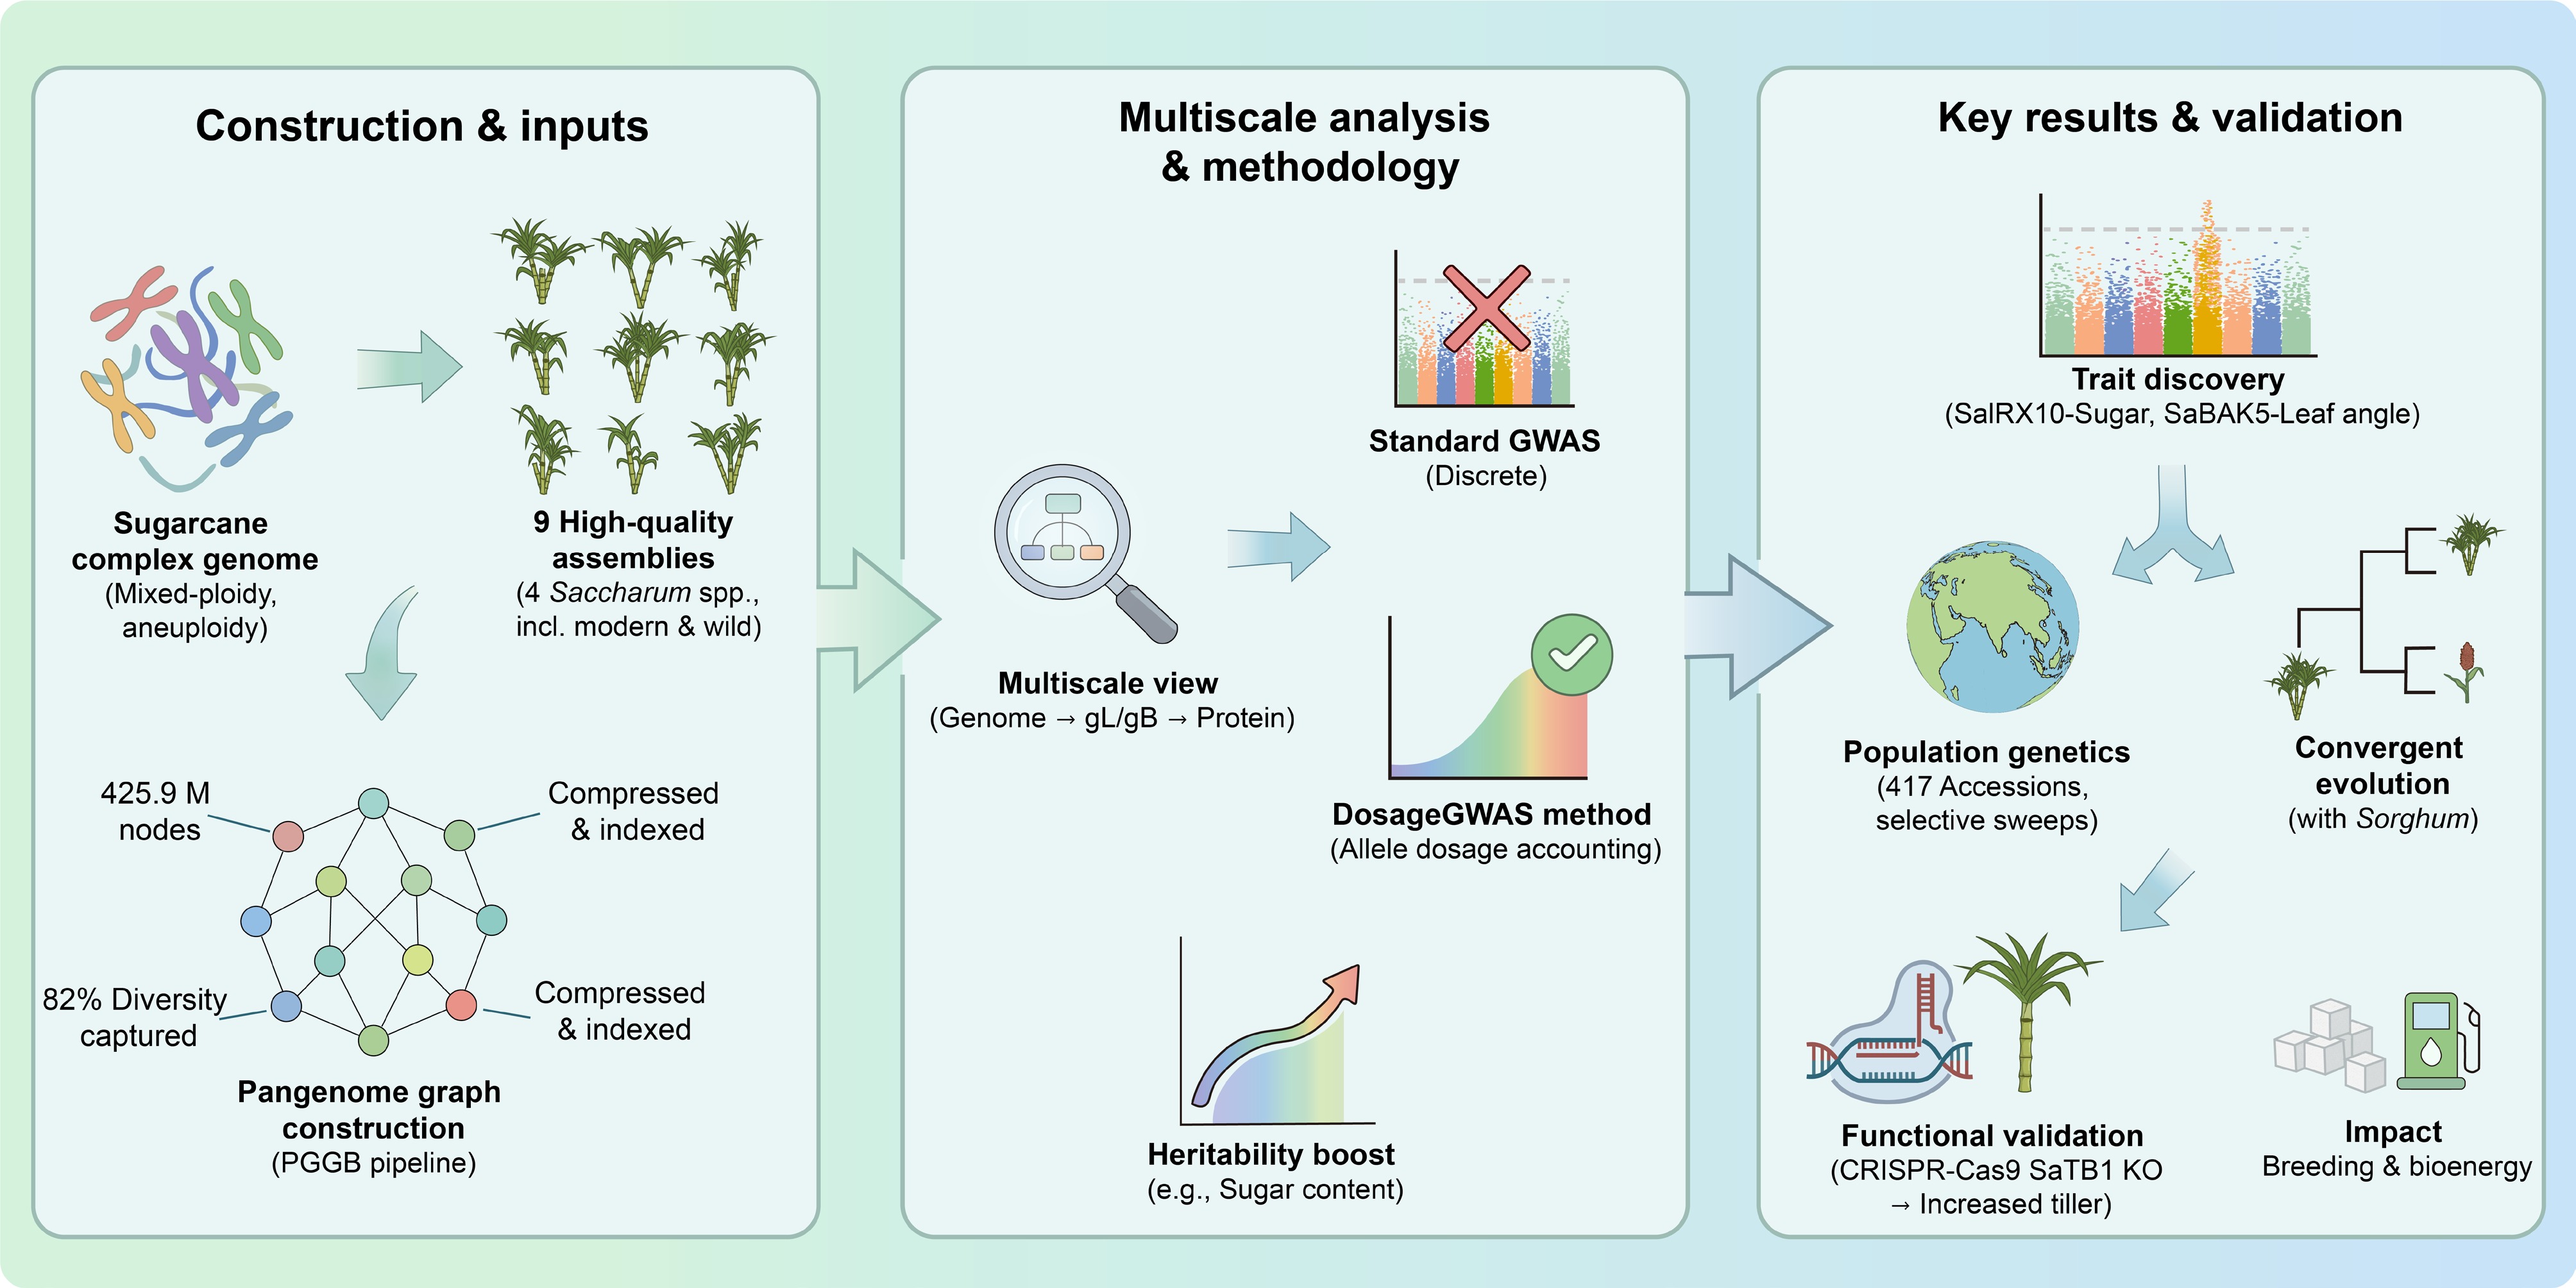
Figure 1.
Pipeline and main results of the pangenome graph of sugarcane genomics.
Figures
(1)
Tables
(0)
Figure 1.
Pipeline and main results of the pangenome graph of sugarcane genomics.