-
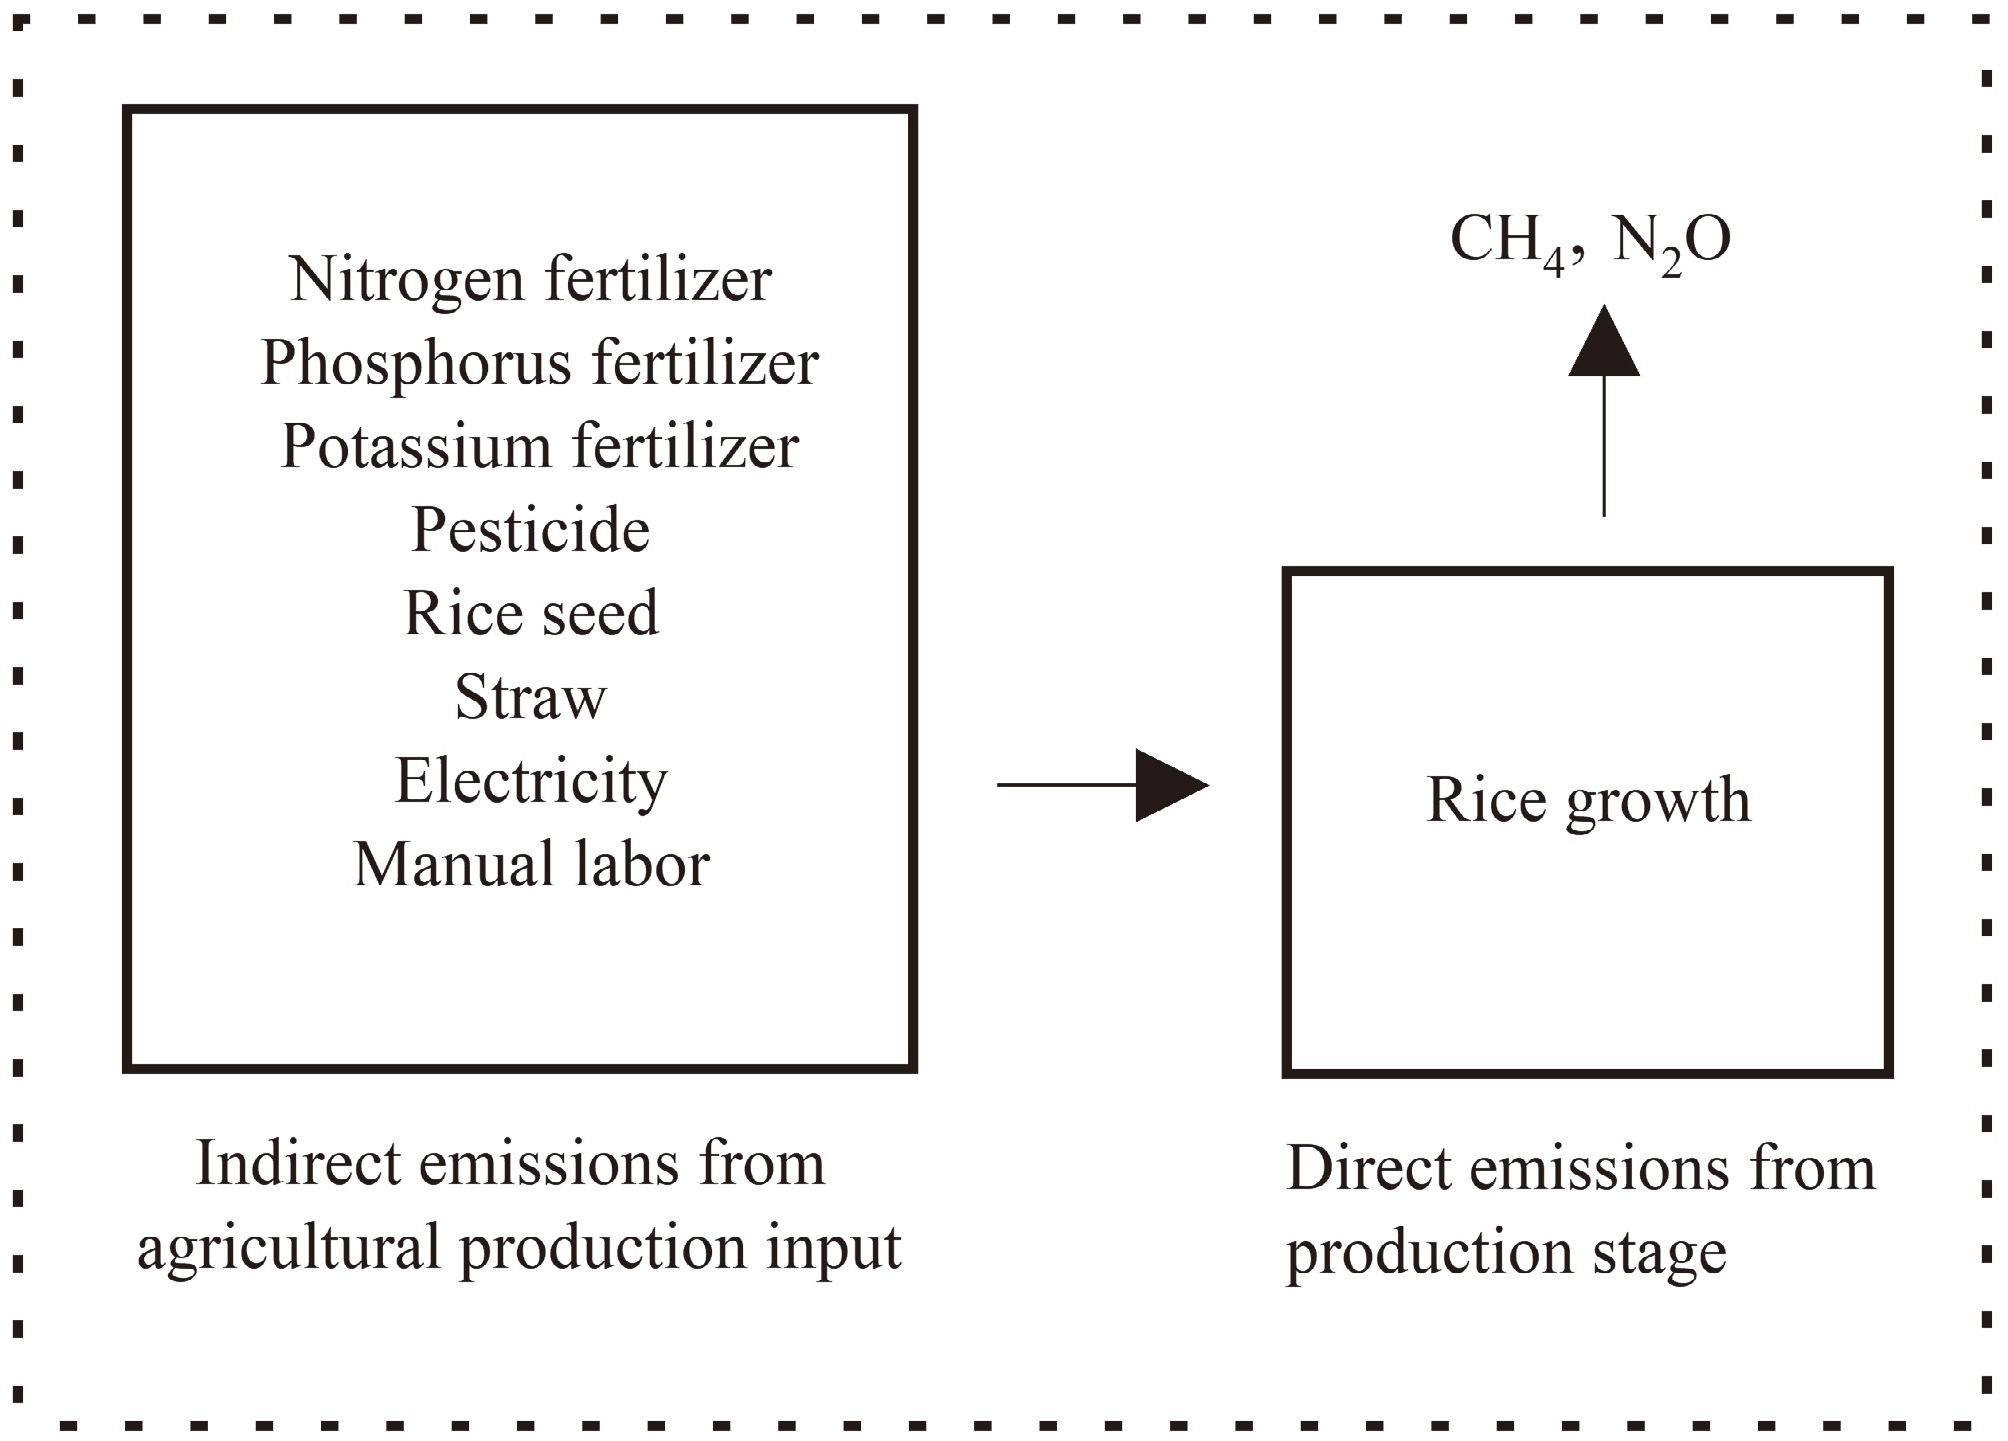
Figure 1.
Rice cultivation carbon footprint accounting boundary.
-
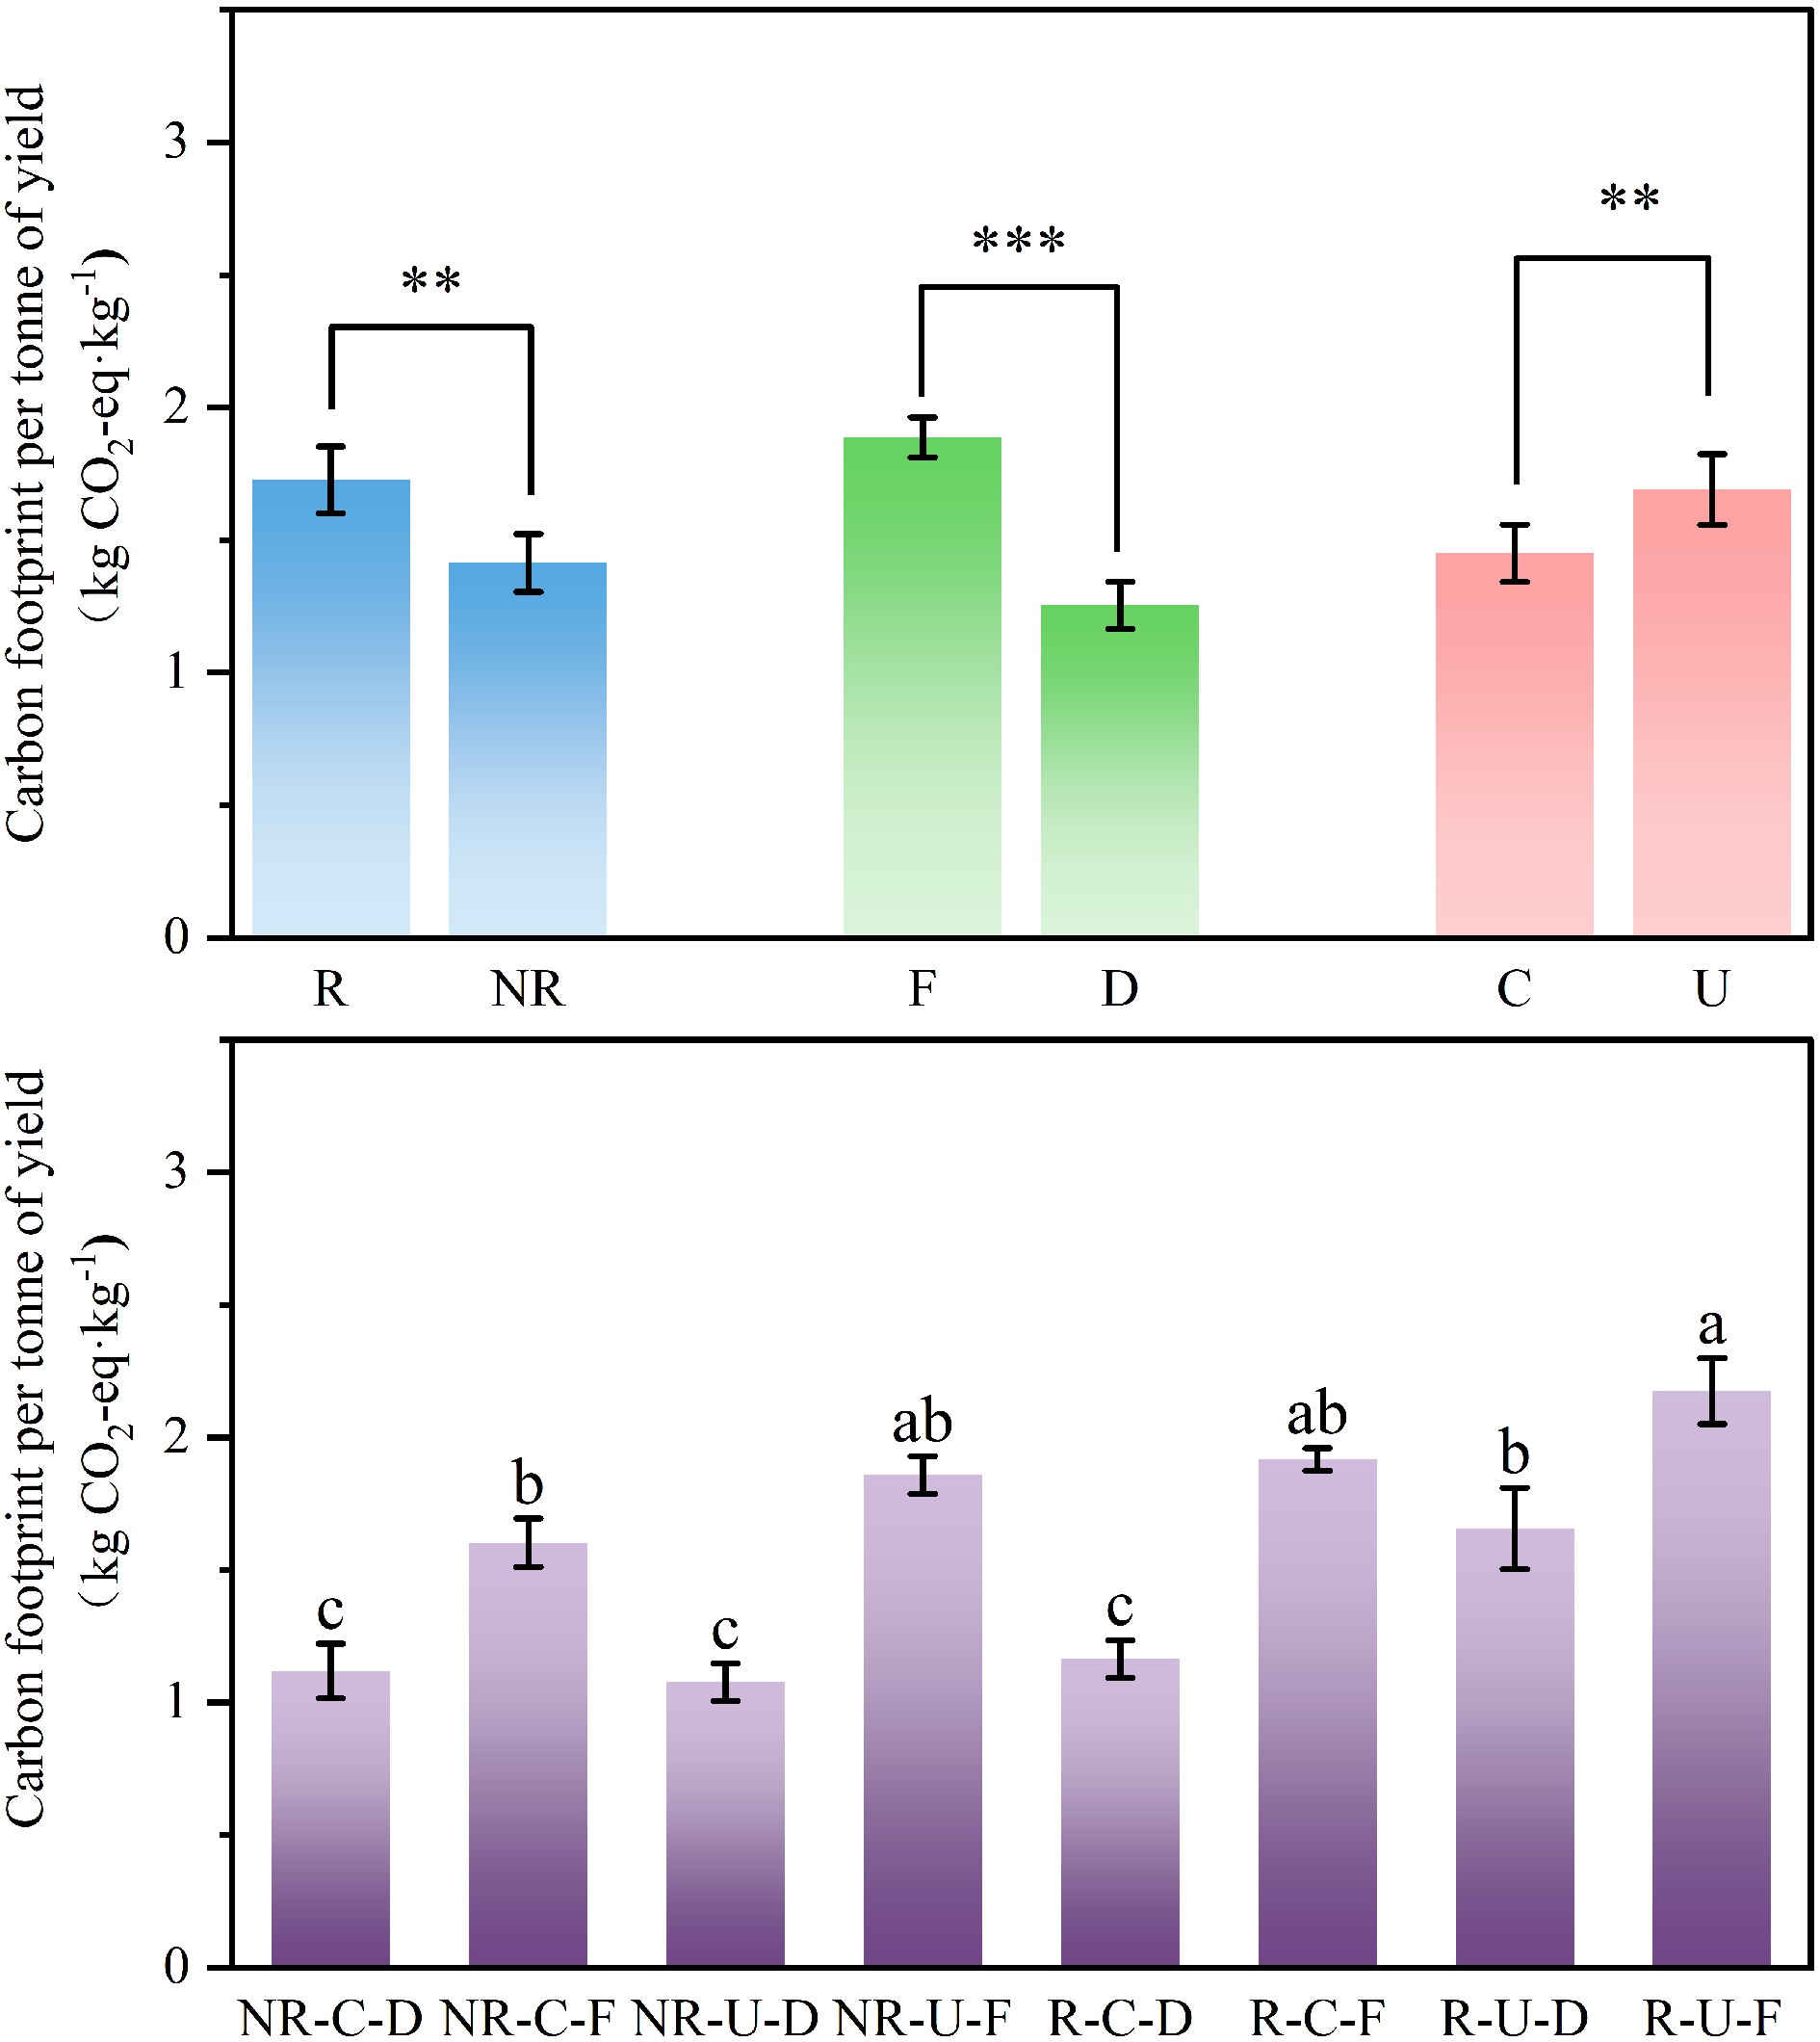
Figure 2.
Carbon footprint per unit yield as affected by different integrated paddy management. NR, no straw return; R, straw return; F, continuous flooding; D, alternate dry-wet irrigation; C, controlled-release nitrogen fertilizer; U, conventional nitrogen fertilizer; ** Significant at p < 0.01; *** Significant at p < 0.001; Different lowercase letters indicate significant differences among treatments (p < 0.05). Error bars represent the standard error (SE), n = 12 or 3.
-
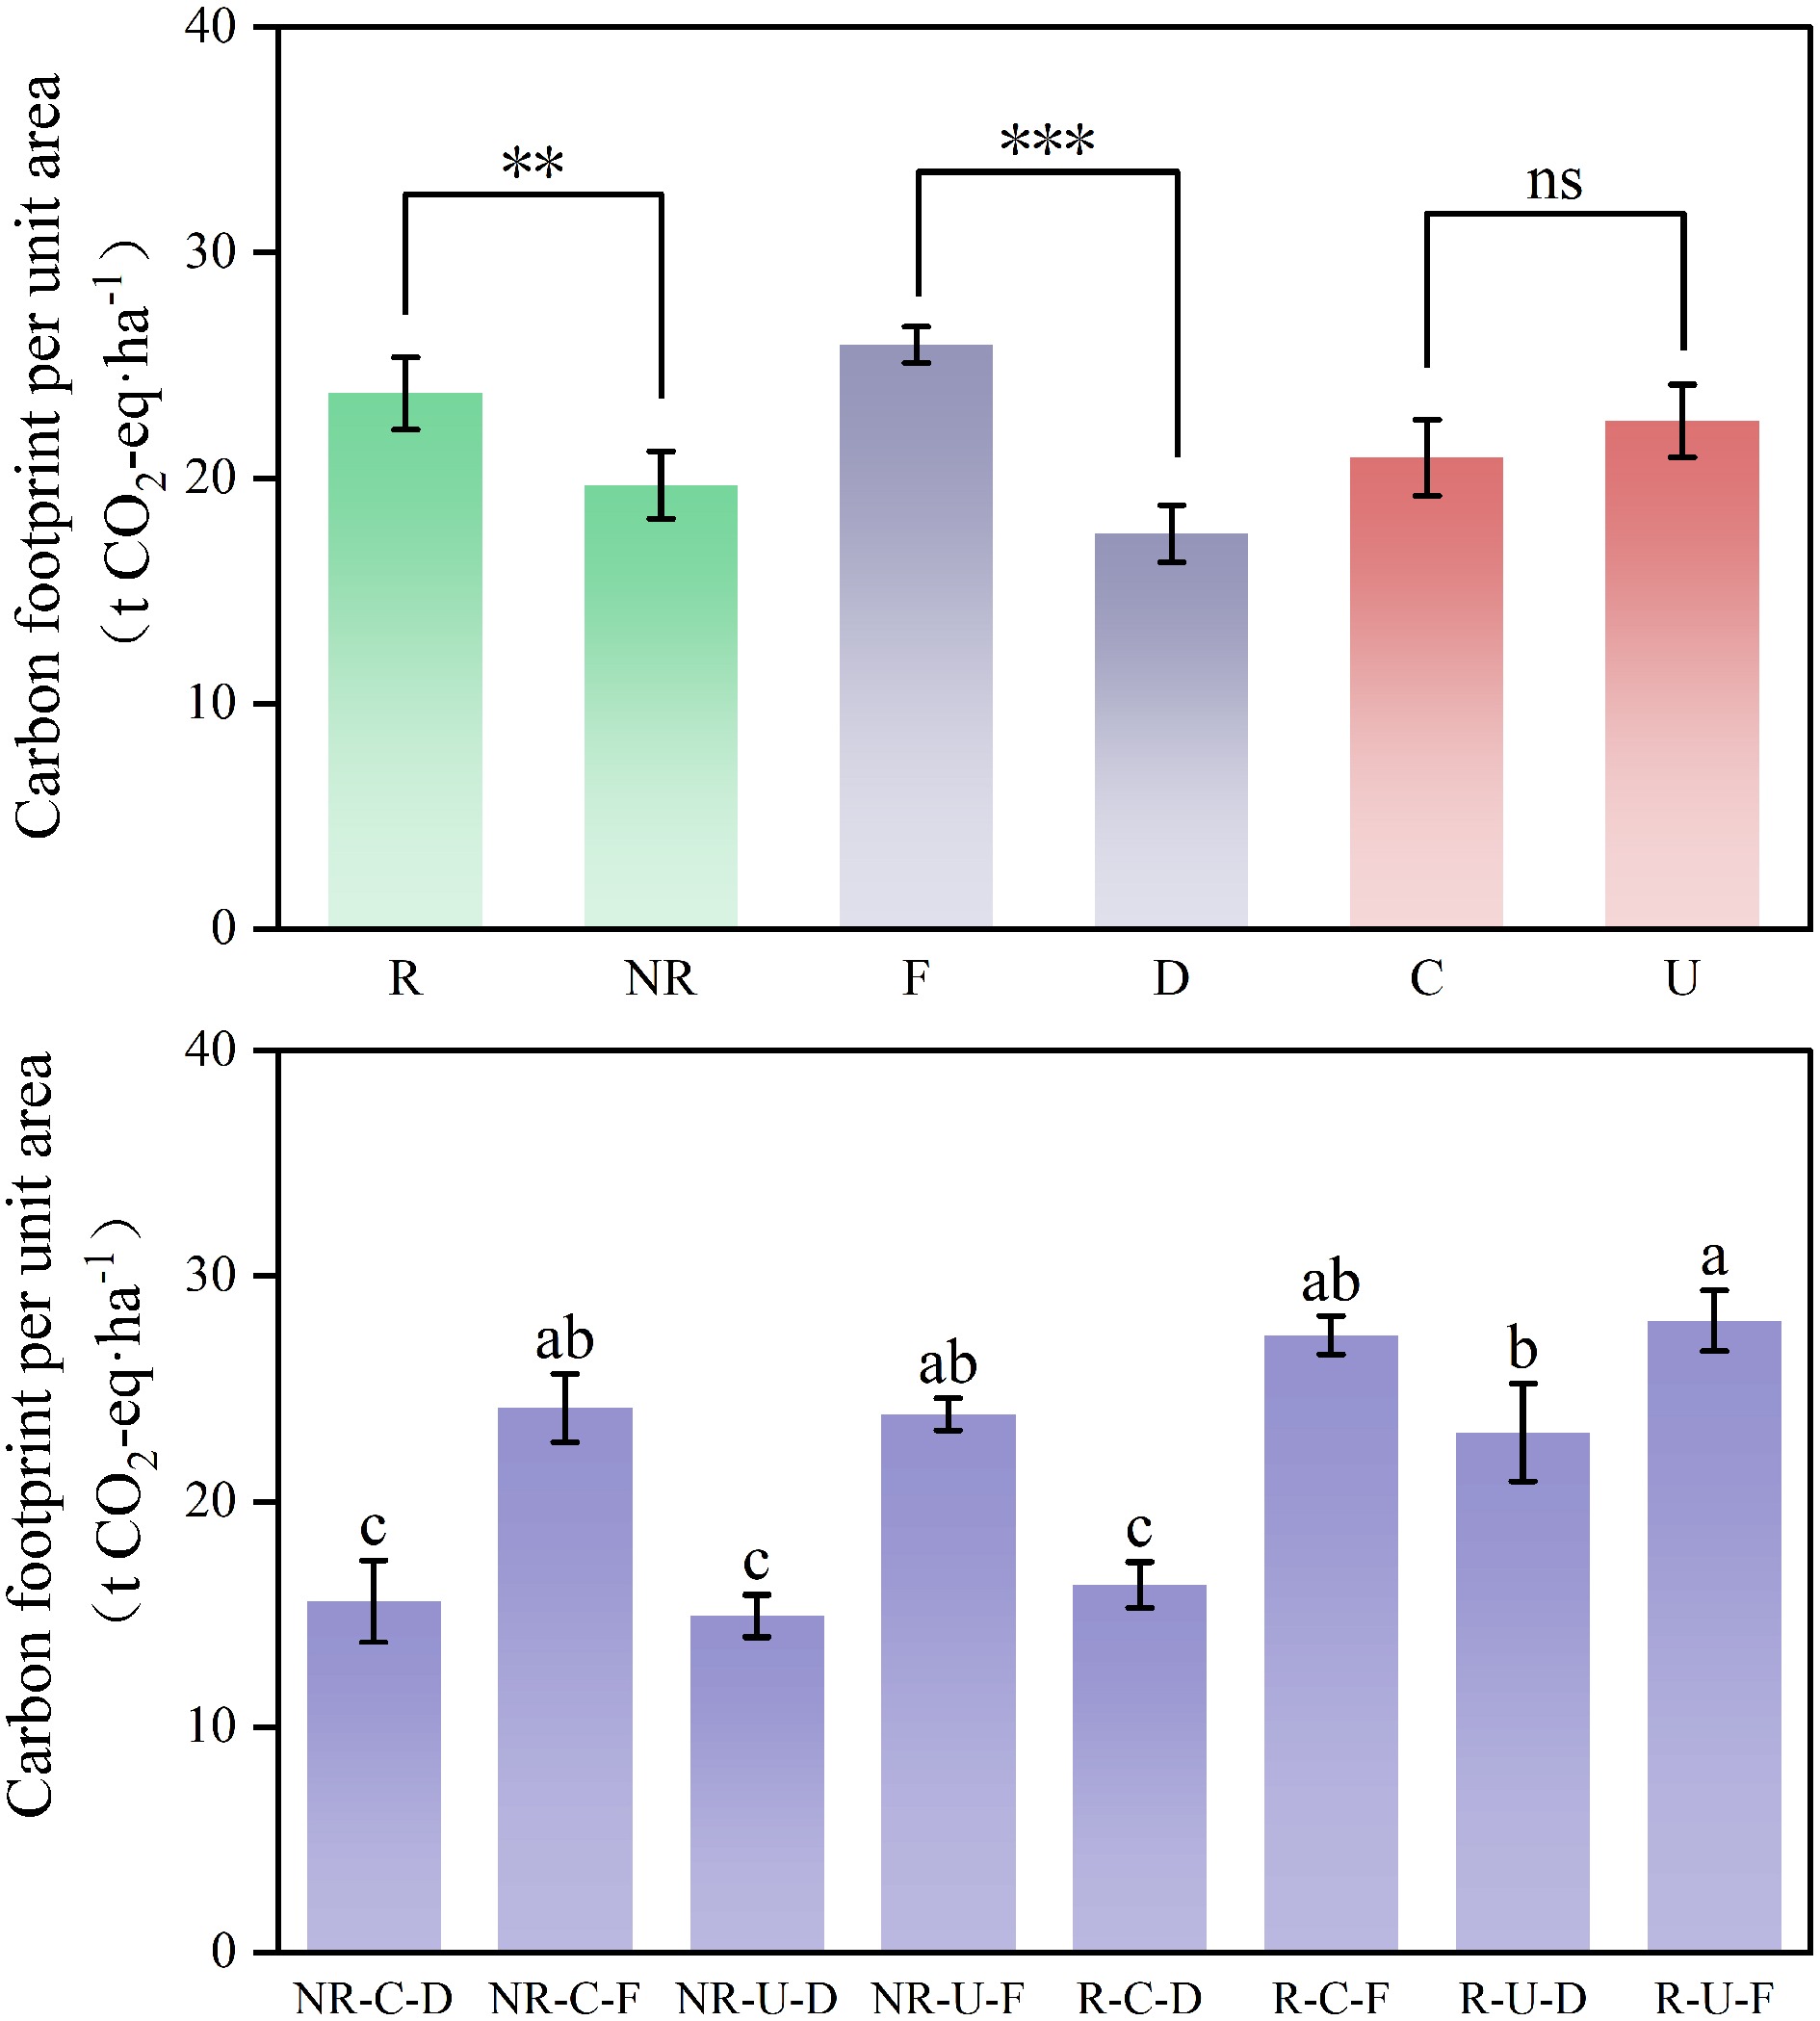
Figure 3.
Carbon footprint per unit area as affected by different integrated paddy management. NR, no straw return; R, straw return; F, continuous flooding; D, alternate dry-wet irrigation; C, controlled-release nitrogen fertilizer; U, conventional nitrogen fertilizer; ** Significant at p < 0.01; *** Significant at p < 0.001; ns, not significant (p > 0.05). Different lowercase letters indicate significant differences among treatments (p < 0.05). Error bars represent the standard error (SE), n = 12 or 3.
-
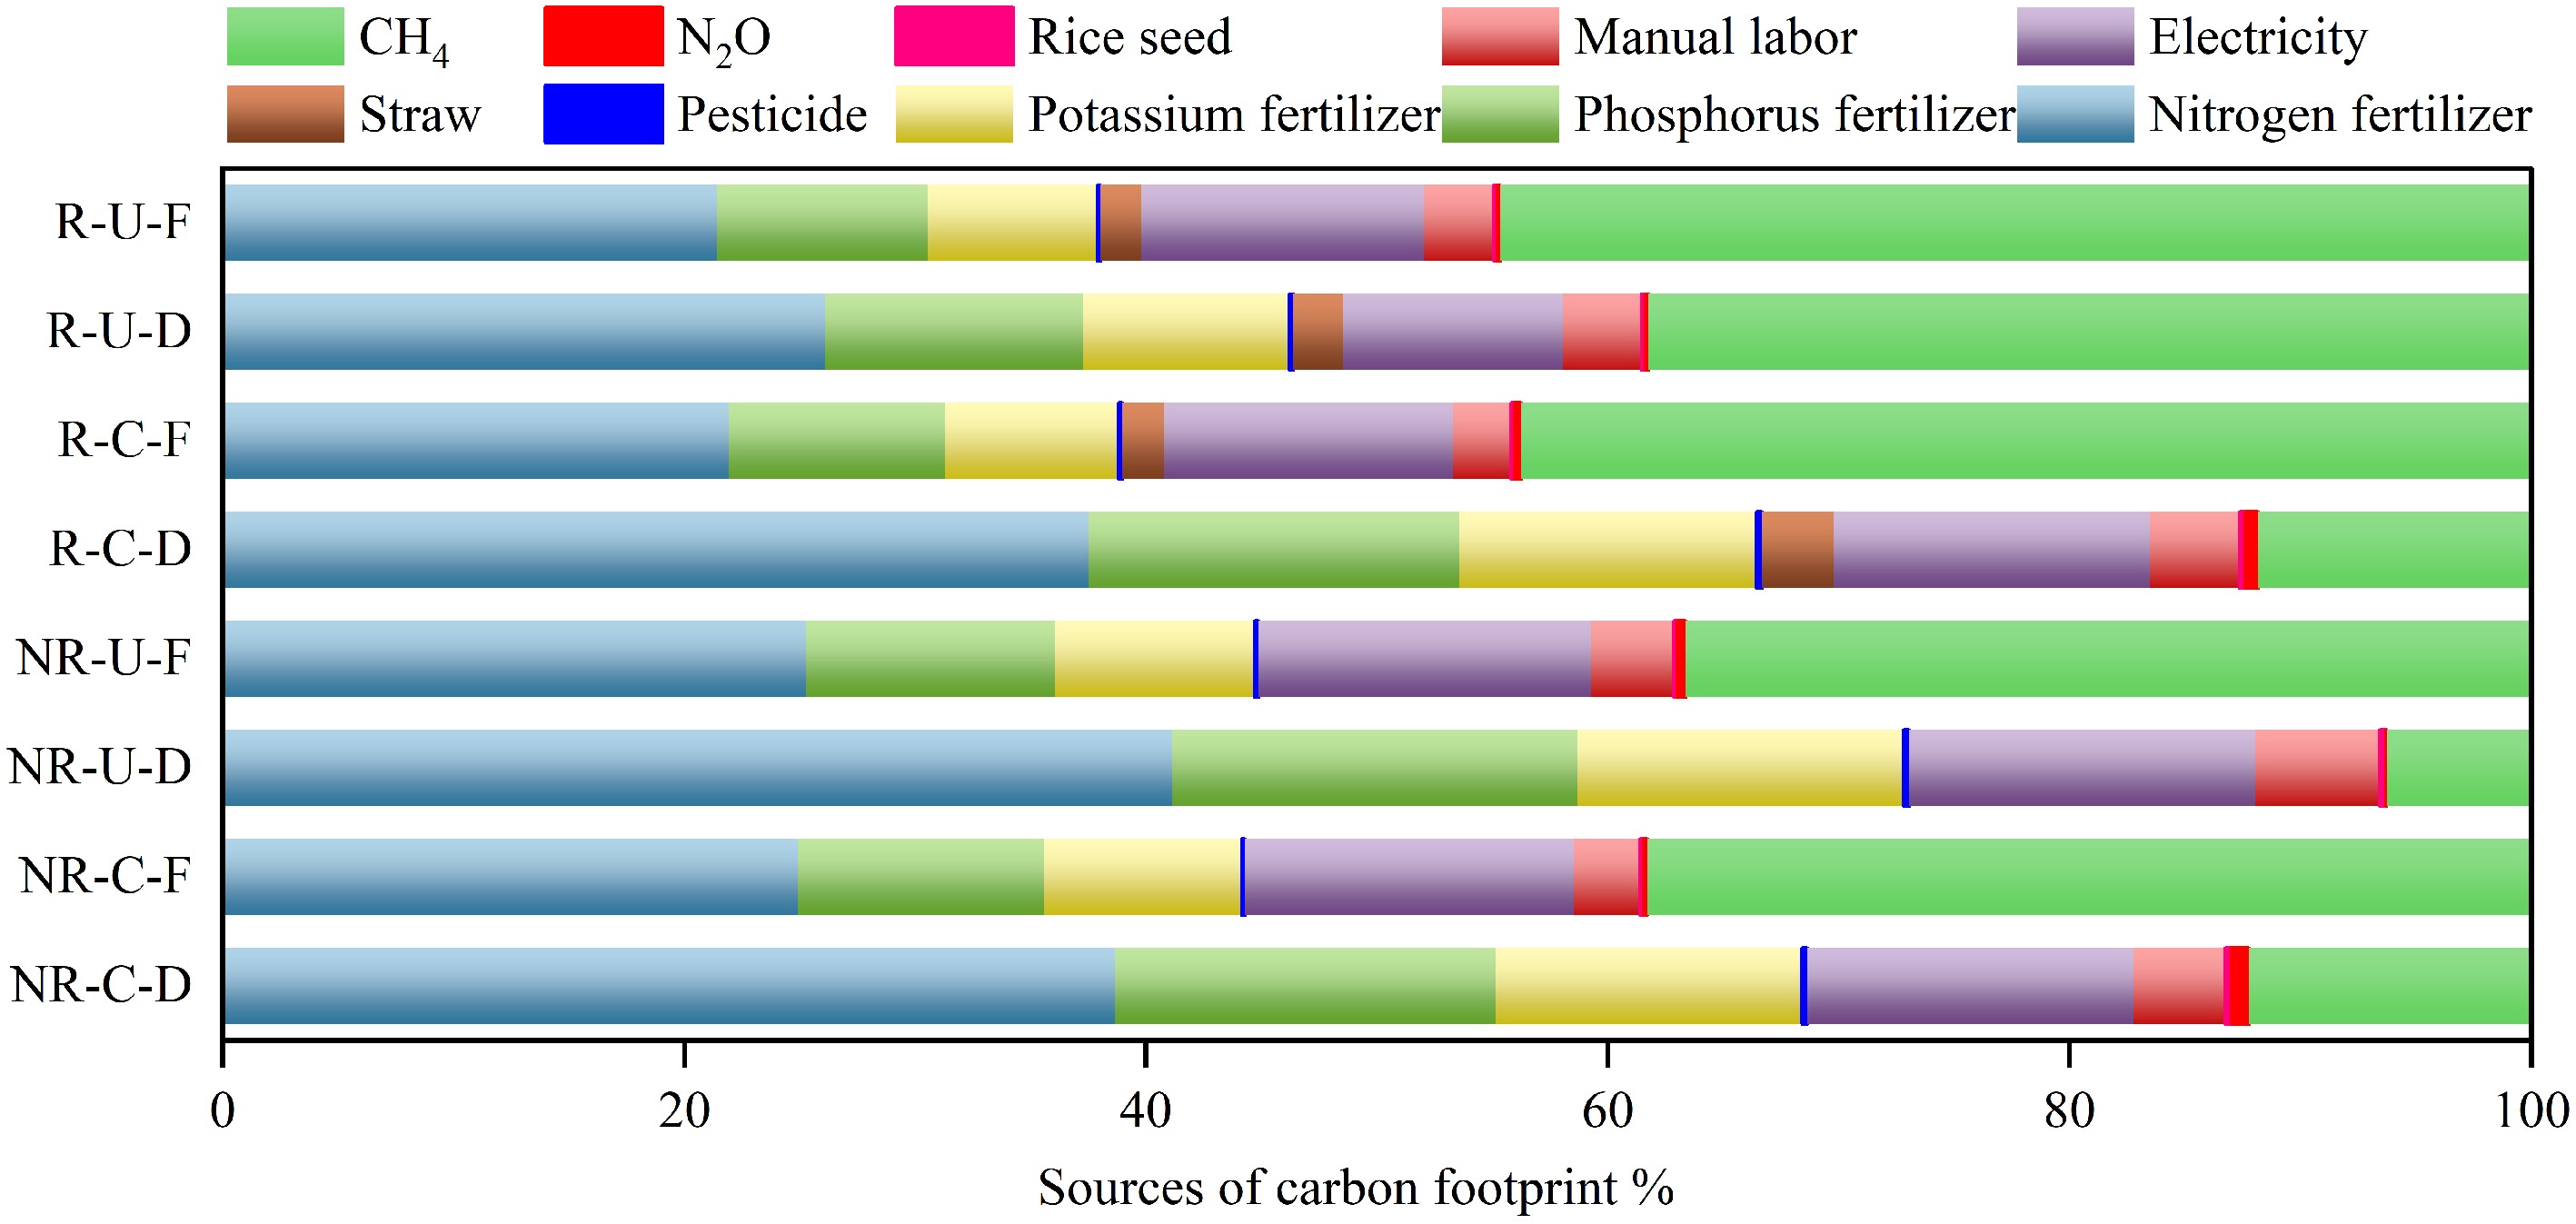
Figure 4.
Carbon footprint components as affected by different integrated paddy management.
-
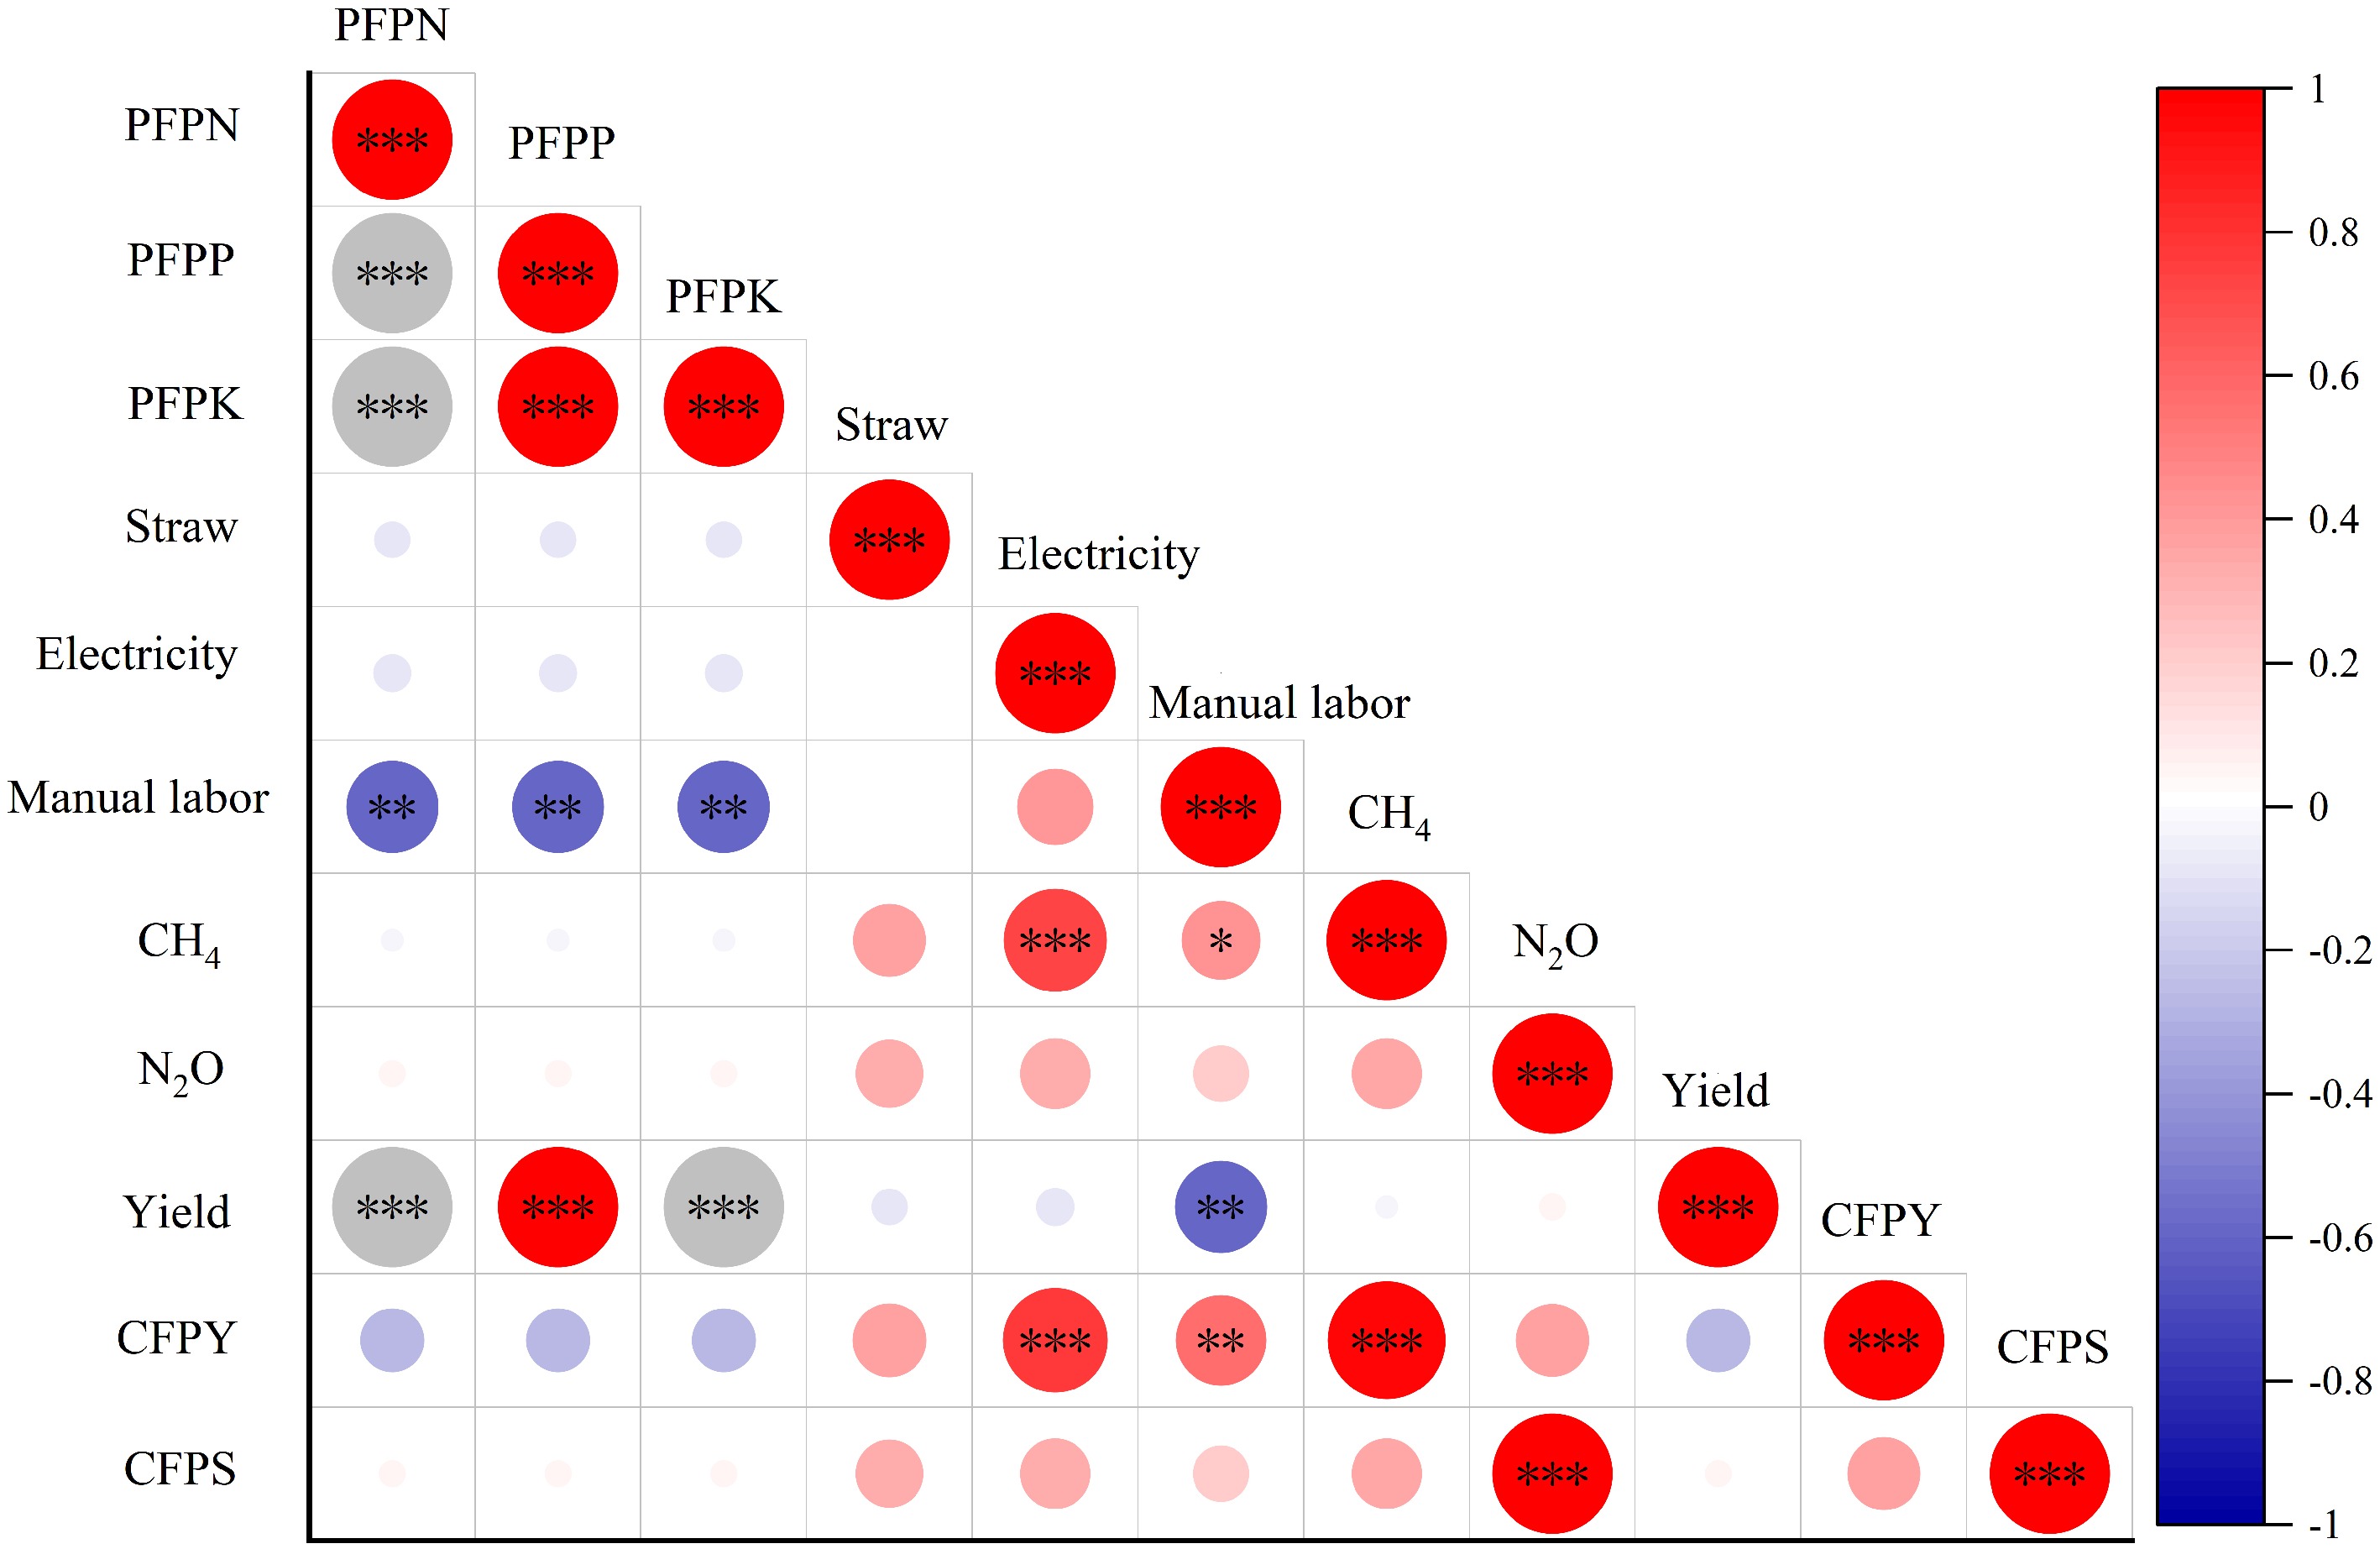
Figure 5.
Correlation analysis between the main driving factors and CFP. PFPN, partial factor productivity of nitrogen fertilizer; PFPP, partial factor productivity of phosphorus fertilizer; PFPK, partial factor productivity of potassium fertilizer; CH4, methane emissions; N2O, nitrous oxide emissions; CFPY, carbon footprint per unit yield; CFPS, carbon footprint per unit area. * Significant at p < 0.05; ** Significant at p < 0.01; *** Significant at p < 0.001.
-
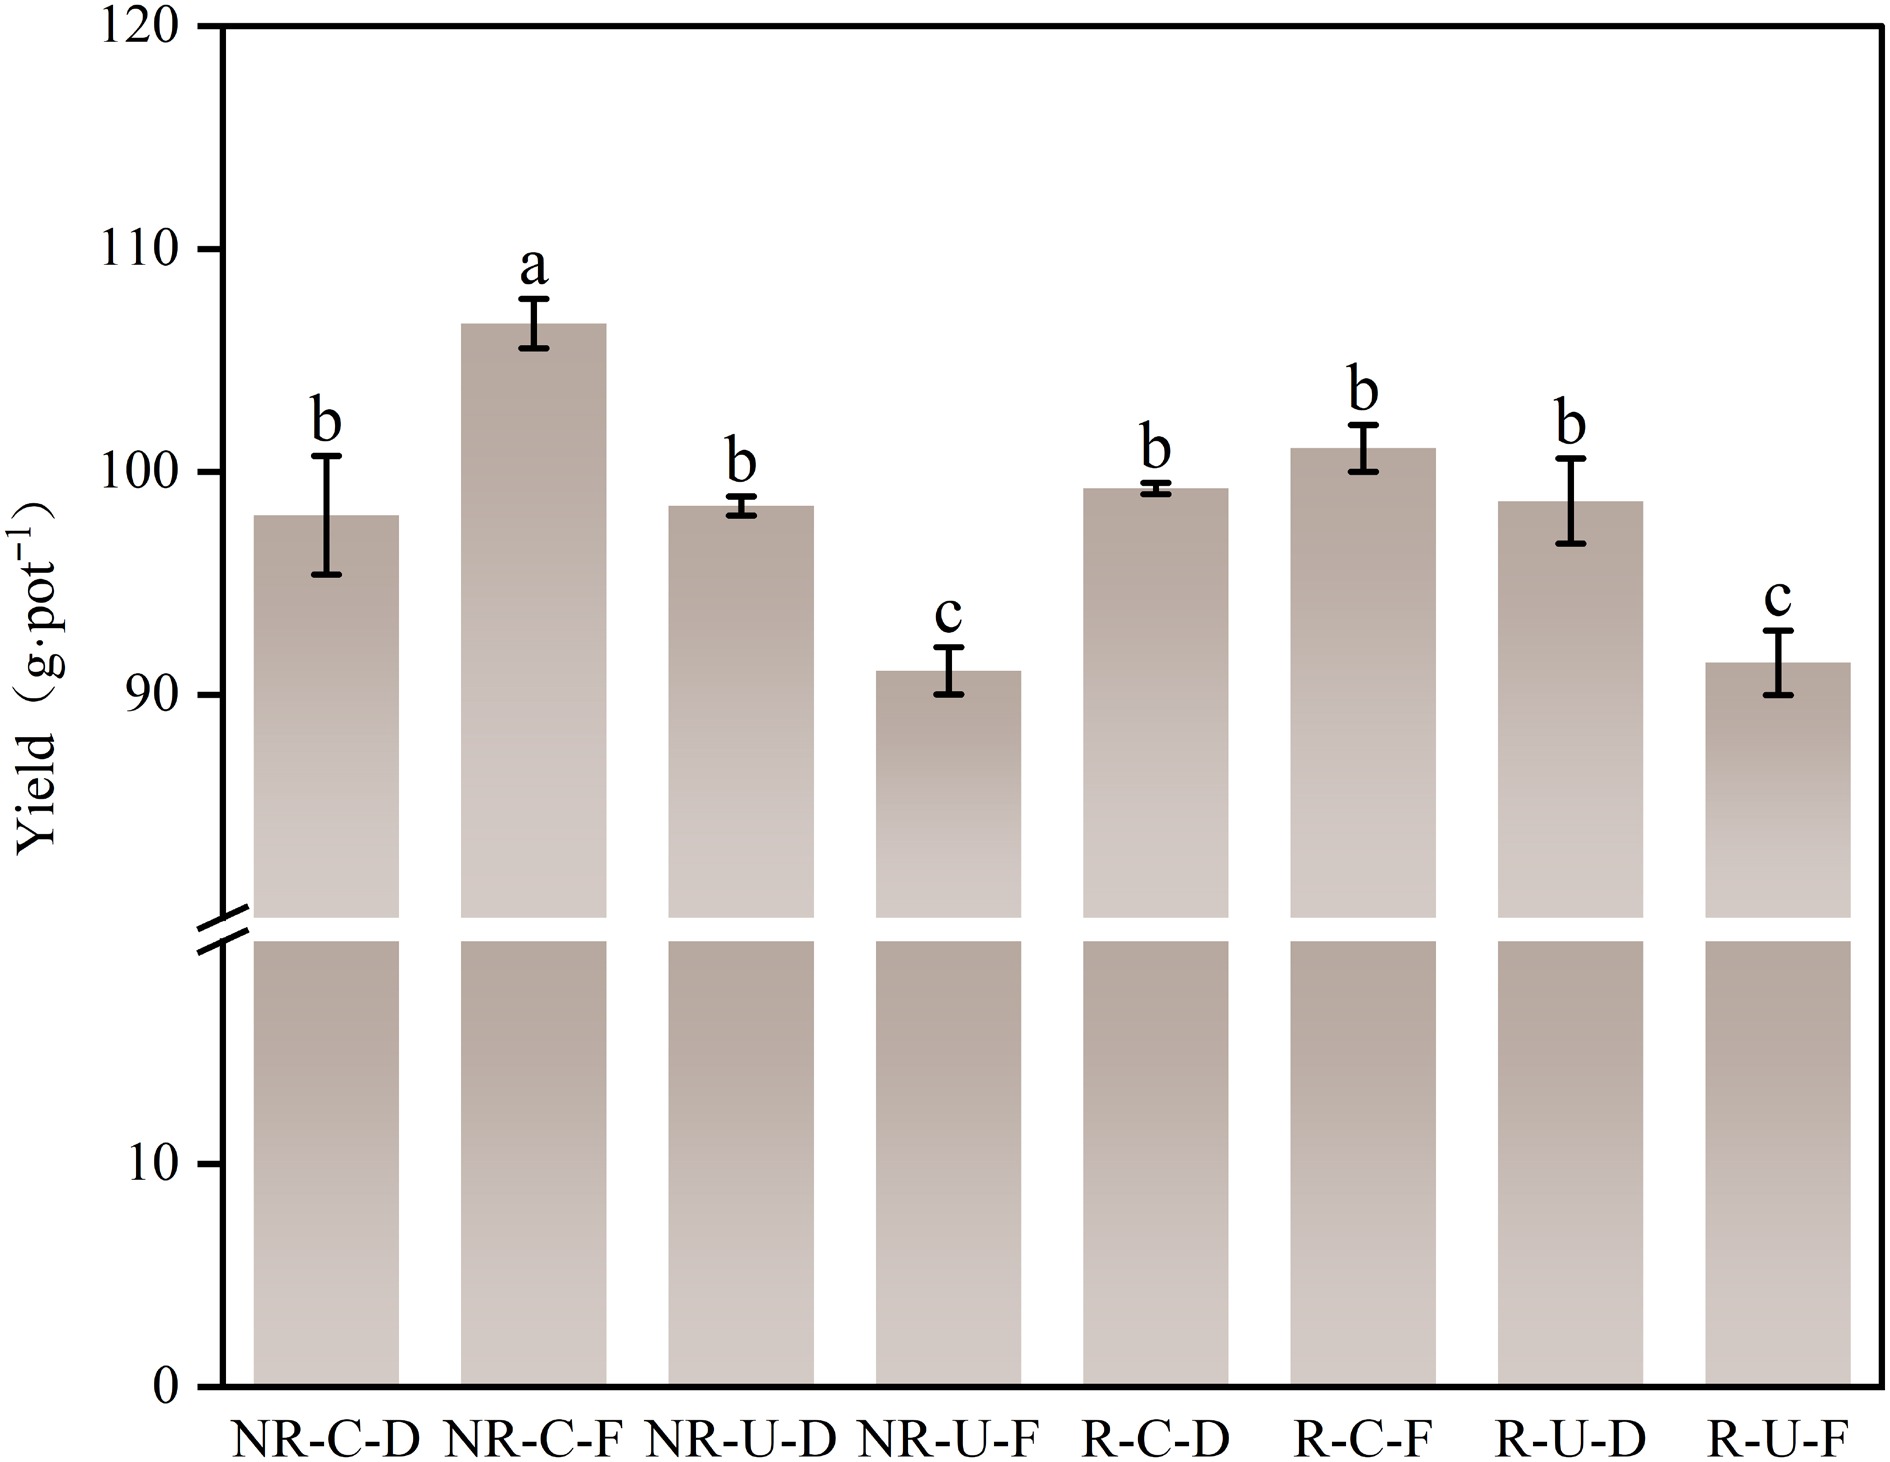
Figure 6.
Rice yield as affected by different integrated paddy management. Different lowercase letters indicate significant differences among treatments (p < 0.05). Error bars represent the standard error (SE), n = 3.
-
Project Emission factor Unit Source Nitrogen fertilizer 1.53 kg CO2-eq·kg−1N CLCDv0.7 Phosphorus fertilizer 1.63 kg CO2-eq·kg−1P2O5 CLCDv0.7 Potassium fertilizer 0.66 kg CO2-eq·kg−1K2O CLCDv0.7 Pesticide 16.61 kg CO2-eq·kg−1 CLCDv0.7 Rice seed 1.84 kg CO2-eq·kg−1 Ling et al.[25] Straw 0.08 kg CO2-eq·kg−1 CPCD Electricity 1.23 kg CO2-eq·kw h−1 CLCDv0.7 Manual labor 0.86 kg CO2-eq·d−1·person−1 Ling et al.[25] CH4 27.90 kg CO2-eq·kg−1 IPCC[26] N2O 273.00 kg CO2-eq·kg−1 IPCC[26] Table 1.
Greenhouse gas emission factors for agricultural inputs.
-
Straw
(S)Irrigation
(I)Fertilization
(F)S × I S × F I × F S × I × F CFPY 15.68** 63.65*** 8.96** 0.00 ns 2.97 ns 0.02 ns 2.84 ns CFPS 12.88** 54.72*** 2.06 ns 0.11 ns 3.48 ns 1.64 ns 2.09 ns Yield 0.59 ns 0.73 ns 25.95*** 1.79 ns 1.00 ns 25.32*** 1.94 ns * Significant at p < 0.05; ** Significant at p < 0.01; *** Significant at p < 0.001; ns, not significant (p > 0.05). Table 2.
ANOVA F-value analysis of the effects of straw, irrigation, and fertilizer treatments on CFPY, CFPS, and yield.
Figures
(6)
Tables
(2)