


-
Rice is one of the most important staple crops worldwide, serving as the primary food source for nearly half of the global population[1]. To ensure high yields, agronomic practices such as chemical fertilizer application and seasonal irrigation are widely employed in rice production. These practices not only enhance productivity but also exert substantial influence on the carbon footprint of rice production (CFP)[2−4]. Specifically, practices such as irrigation management, straw return, and fertilizer application differ in their embedded carbon costs and directly affect greenhouse gas (GHG) emissions from paddy fields, thereby altering the overall CFP intensity[5−7]. Therefore, optimizing agronomic management to reduce the CFP while maintaining rice yield is crucial for advancing green agricultural development.
Numerous studies have shown that irrigation management is a major agronomic factor influencing GHG emissions from paddy fields[8]. Continuous flooding irrigation promotes methanogenic activity and increases CH4 emissions, whereas intermittent irrigation methods, such as alternate dry-wet irrigation (AWD), suppress CH4 production by increasing soil redox potential[9]. However, these intermittent irrigation practices may also induce pulsed N2O emissions by promoting nitrification and denitrification under periodic wetting-drying cycles[10−12]. A meta-analysis by Minamikawa reported that, compared with continuous flooding, alternate dry-wet irrigation can reduce CH4 emissions by 31%~62%, but increase N2O emissions by 37%~445%[13]. Nonetheless, because CH4 dominates the global warming potential (GWP) of rice paddies, alternate dry-wet irrigation reduces overall GWP by 34%~56%. Furthermore, such irrigation practices substantially conserve water resources and reduce embedded carbon costs[14].
Beyond irrigation management, straw return, a common agricultural practice, significantly enhances CH4 emissions from paddy fields due to its decomposition, which provides abundant organic carbon substrates for soil microorganisms[15]. Furthermore, studies have shown that the combined application of straw and nitrogen fertilizer significantly increases N2O emissions by altering soil microbial activity and physicochemical properties[16]. Shen et al. demonstrated that straw return enhances methane emissions[17], further highlighting its critical role in shaping GHG fluxes. Fertilizer type also plays an essential role in influencing GHG emissions. Lan et al. showed that controlled-release fertilizers can reduce N2O emissions through gradual nutrient release and indirectly improve soil conditions, thereby suppressing CH4 generation[18].
Notably, irrigation, fertilization, and straw management not only have individual effects but also exhibit significant interactions. For instance, irrigation management influences both straw decomposition and fertilizer release[19,20]. Meanwhile, fertilizers with different nutrient-release characteristics modify the decomposition dynamics of crop residues[21]. Li et al. found that the combination of modified nitrogen fertilizers (controlled-release urea, inhibitor-containing urea) and alternate dry-wet irrigation constitutes a win-win strategy for increasing yield while reducing GHG emissions in rice production[22]. Another study indicated that replacing conventional urea with coated fertilizer can effectively reduce methane emissions resulting from straw incorporation[23]. Hao et al. further reported that intermittent irrigation can reduce CH4 emissions associated with organic nitrogen return[24].
The above indicates that the effects of irrigation management, straw return, fertilizer type, and their pairwise interactions on GHG emissions from paddies and CFP have been extensively studied. However, as a fundamental component of 'water-carbon-nitrogen' management, the third factor in any combination may significantly modulate both the direction and magnitude of the effect of the other two factors on CFP. The combined impact of irrigation management, straw return, and fertilizer type on the CFP remains unclear. In other words, does the combined application of these three practices result in a synergistic effect, where the whole is greater than the sum of its parts?
To address this question, this study employed a three-factor experimental design involving irrigation management, straw return, and nitrogen fertilizer type to quantify the CFP using life cycle assessment (LCA) across different treatment combinations and to identify the key influencing factors. The research aims to propose integrated irrigation-straw-fertilization management strategies that minimize the CFP in paddies, and elucidate the intrinsic mechanism of the three-factor synergistic effect on CFP.
-
The study was conducted from July to November 2024 in Fuzhuang Village, Nanjing City, China. The region has a subtropical humid climate, with an average annual rainfall of 1,106.5 mm and an average annual temperature of 15.4 °C. Topsoil (0~20 cm) from the surrounding plots was air-dried, sieved, thoroughly mixed, and placed into trialed pots (diameter 30 cm, height 30 cm), with 30 kg of soil per pot. The basic soil physicochemical properties were as follows: pH 5.93, organic matter 29.22 g·kg−1, total nitrogen 1.95 g·kg−1, available phosphorus 6.87 mg·kg−1, and available potassium 171.30 mg·kg−1. Nanjing 46, a conventional japonica rice, was used in the experiment, with two hills per pot and three plants per hill.
Experimental design
-
The experiment employed a three-factor design, with straw management (no straw return, NR; straw return, R) as factor I, water management (alternate dry-wet irrigation, D; continuous flooding, F) as factor II, and fertilizer type (controlled-release nitrogen fertilizer, C; conventional nitrogen fertilizer, U) as factor III. Eight treatments were established: NR-C-D, NR-C-F, NR-U-D, NR-U-F, R-C-D, R-C-F, R-U-D, and R-U-F, each with three replicates.
In the straw return (R) treatment, the straw application rate was calculated based on the total wheat straw input (average wheat yield of 4,500 kg ha−1 with a straw-grain ratio of 1.38) in the rice-wheat rotation system of the experimental area and converted according to pot surface area. The irrigation F treatment maintained a 3~5 cm water layer throughout the season except during midseason aeration and final drainage. For the irrigation D treatment, a 3~5 cm floodwater layer was maintained from transplanting to regreening, and fields were fully drained prior to harvest. During the intervening growth stages, an alternate dry-wet irrigation regime was implemented, with irrigation withheld until soil water potential at a depth of 15~20 cm declined to −10 to −15 kPa.
Conventional nitrogen fertilizer (urea, 464 g N kg−1) and controlled-release nitrogen fertilizer (polyurethane-coated urea, 446 g N kg−1) were both applied at 270 kg N ha−1. Conventional nitrogen fertilizer was applied in three splits: basal application before transplanting (35%), tillering stage (30%), and panicle initiation stage (35%). Controlled-release fertilizer was applied once as a basal application. All treatments received identical amounts of phosphorus (P2O5, 108 kg·ha−1) and potassium (K2O, 216 kg·ha−1), applied as basal fertilizers.
Sampling and determination
Yield
-
At rice maturity, plant samples from all pots were collected, fixed at 105 °C for 30 min, dried at 80 °C to constant weight, and converted to yield based on a standard moisture content of 13.5%.
GHG emissions
-
GHG emissions were measured using the static chamber method. The sampling chamber was an opaque PVC cylinder (diameter 32 cm, height 100 cm) wrapped in reflective material. Gas samples were collected on days 1, 4, and 7 within one week after each fertilization, every two days during mid-season aeration, and every ten days during other growth stages. Sampling was conducted between 08:00 and 10:00 AM on each collection day. Four gas samples were collected at 0, 10, 20, and 30 min after the chamber was closed. GHG concentrations were measured using an Agilent 7890B gas chromatograph. Seasonal cumulative GHG emissions were calculated by summing emissions between consecutive sampling intervals.
System boundary
-
This study applied the LCA methodology, referencing the ISO 14040 standard, to quantify carbon emissions throughout the rice production cycle using emission factors expressed in CO2-eq units. The accounting boundary included embedded emissions from agricultural inputs during rice cultivation, labor-related emissions, and direct GHG emissions. Embedded emissions from agricultural inputs included nitrogen fertilizer, phosphorus fertilizer, potassium fertilizer, rice seed, pesticide, straw, manual labor, and electricity consumption. The CFP system boundary is illustrated in Fig. 1.
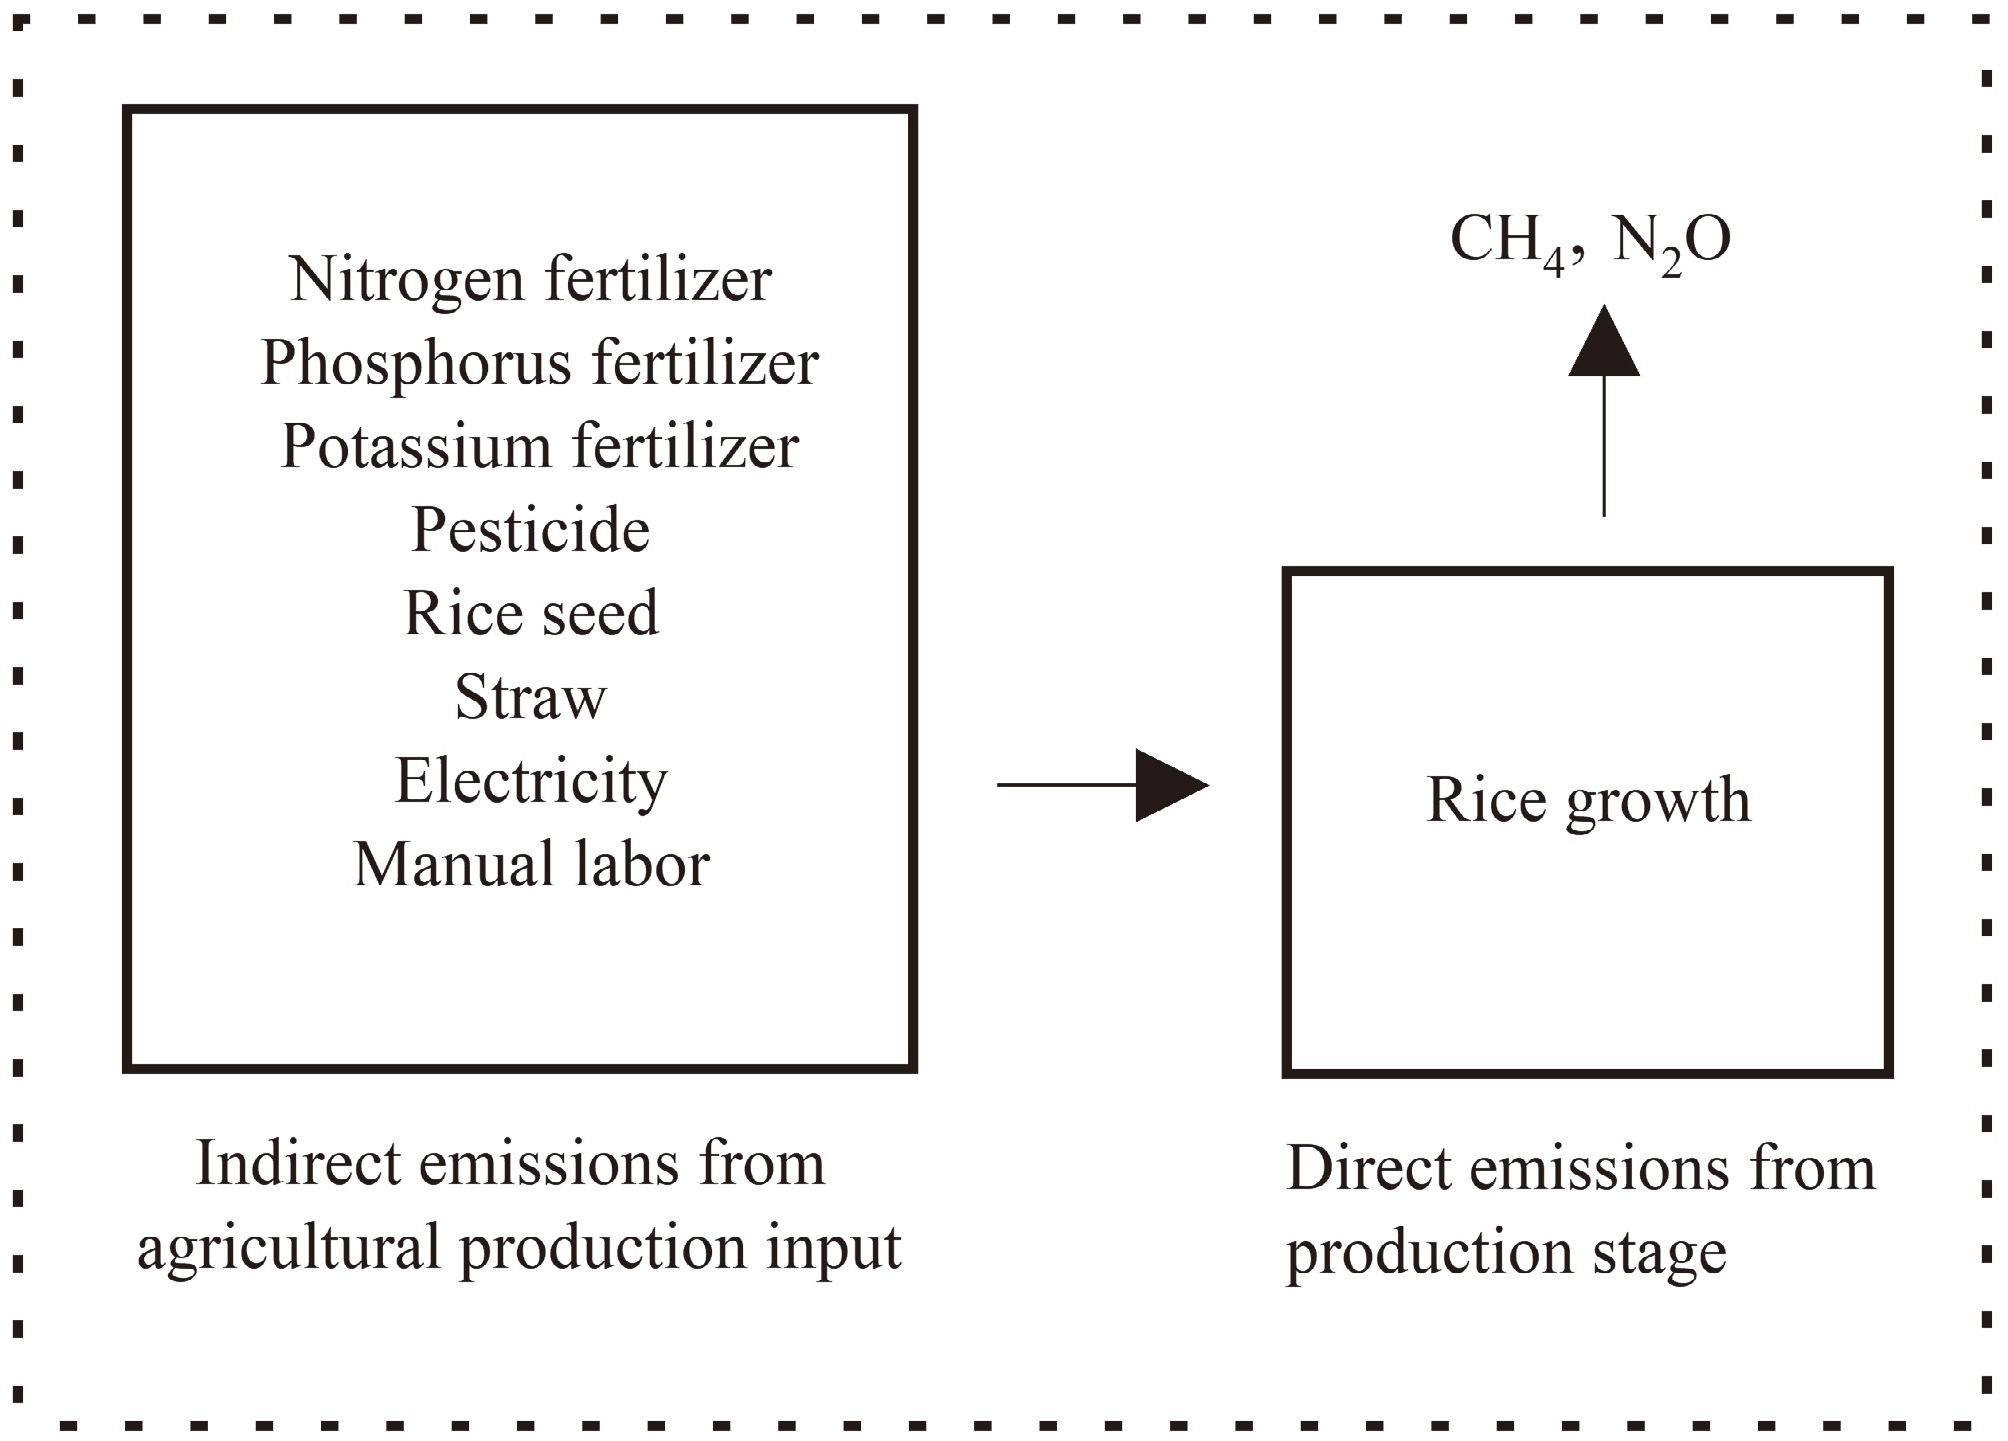
Figure 1.
Rice cultivation carbon footprint accounting boundary.
Calculation formula
-
Within the boundary, the CFP was calculated according to the following formula:
$ {\mathrm{CFPY}}= \dfrac{\displaystyle\sum \limits_{i=1}^{n}\delta \mathrm{i}\cdot \text{mi}}{\mathrm{W}} $ $ {\mathrm{CFPS}}= \dfrac{\displaystyle\sum \limits_{i=1}^{n}\delta \mathrm{i}\cdot \text{mi}}{\mathrm{S}} $ In the formula: CFPY: Carbon footprint per unit yield (kg CO2-eq kg−1); CFPS: Carbon footprint per unit area (t CO2-eq ha−1); n: Types and quantities of agricultural inputs; δi: Input quantity of the i-th agricultural input (kg·ha−1 or kwh·ha−1); mi: Emission factor for the i-th type agricultural input, listed in Table 1; W: Rice yield (kg·pot−1); S: Cultivated area (ha−1).
Table 1. Greenhouse gas emission factors for agricultural inputs.
Project Emission factor Unit Source Nitrogen fertilizer 1.53 kg CO2-eq·kg−1N CLCDv0.7 Phosphorus fertilizer 1.63 kg CO2-eq·kg−1P2O5 CLCDv0.7 Potassium fertilizer 0.66 kg CO2-eq·kg−1K2O CLCDv0.7 Pesticide 16.61 kg CO2-eq·kg−1 CLCDv0.7 Rice seed 1.84 kg CO2-eq·kg−1 Ling et al.[25] Straw 0.08 kg CO2-eq·kg−1 CPCD Electricity 1.23 kg CO2-eq·kw h−1 CLCDv0.7 Manual labor 0.86 kg CO2-eq·d−1·person−1 Ling et al.[25] CH4 27.90 kg CO2-eq·kg−1 IPCC[26] N2O 273.00 kg CO2-eq·kg−1 IPCC[26] Statistical analysis
-
Data processing was conducted using Excel 2019. A three-way ANOVA was used to analyze the main effects and interaction effects of the three factors. Duncan's test was used to determine significant differences among treatment means. Figures were produced using Origin software.
-
The results indicated that CFPY was remarkably affected by different agronomic practices, with their interactions not being significant (Table 2). Compared with the straw return and fertilizer U treatments, straw NR and fertilizer C treatments each contributed to a significant reduction in CFPY (p < 0.01) (Fig. 2). Compared with the irrigation F treatment, the irrigation D treatment also notably decreased CFPY (p < 0.001). Consequently, the R-U-F treatment exhibited the highest CFPY (2.17 kg CO2-eq·kg−1). Moreover, under NR conditions, the CFPYs of the irrigation D treatments were significantly lower than those of the F treatments, with comparable effects observed across both fertilizer types. Under R conditions, only the combination of fertilizer C with irrigation D resulted in a significantly lower CFPY than all other treatments. Overall, the CFPYs of the NR-C-D, NR-U-D, and R-C-D treatments were comparable, and significantly lower than those of the other treatments.
Table 2. ANOVA F-value analysis of the effects of straw, irrigation, and fertilizer treatments on CFPY, CFPS, and yield.
Straw
(S)Irrigation
(I)Fertilization
(F)S × I S × F I × F S × I × F CFPY 15.68** 63.65*** 8.96** 0.00 ns 2.97 ns 0.02 ns 2.84 ns CFPS 12.88** 54.72*** 2.06 ns 0.11 ns 3.48 ns 1.64 ns 2.09 ns Yield 0.59 ns 0.73 ns 25.95*** 1.79 ns 1.00 ns 25.32*** 1.94 ns * Significant at p < 0.05; ** Significant at p < 0.01; *** Significant at p < 0.001; ns, not significant (p > 0.05). 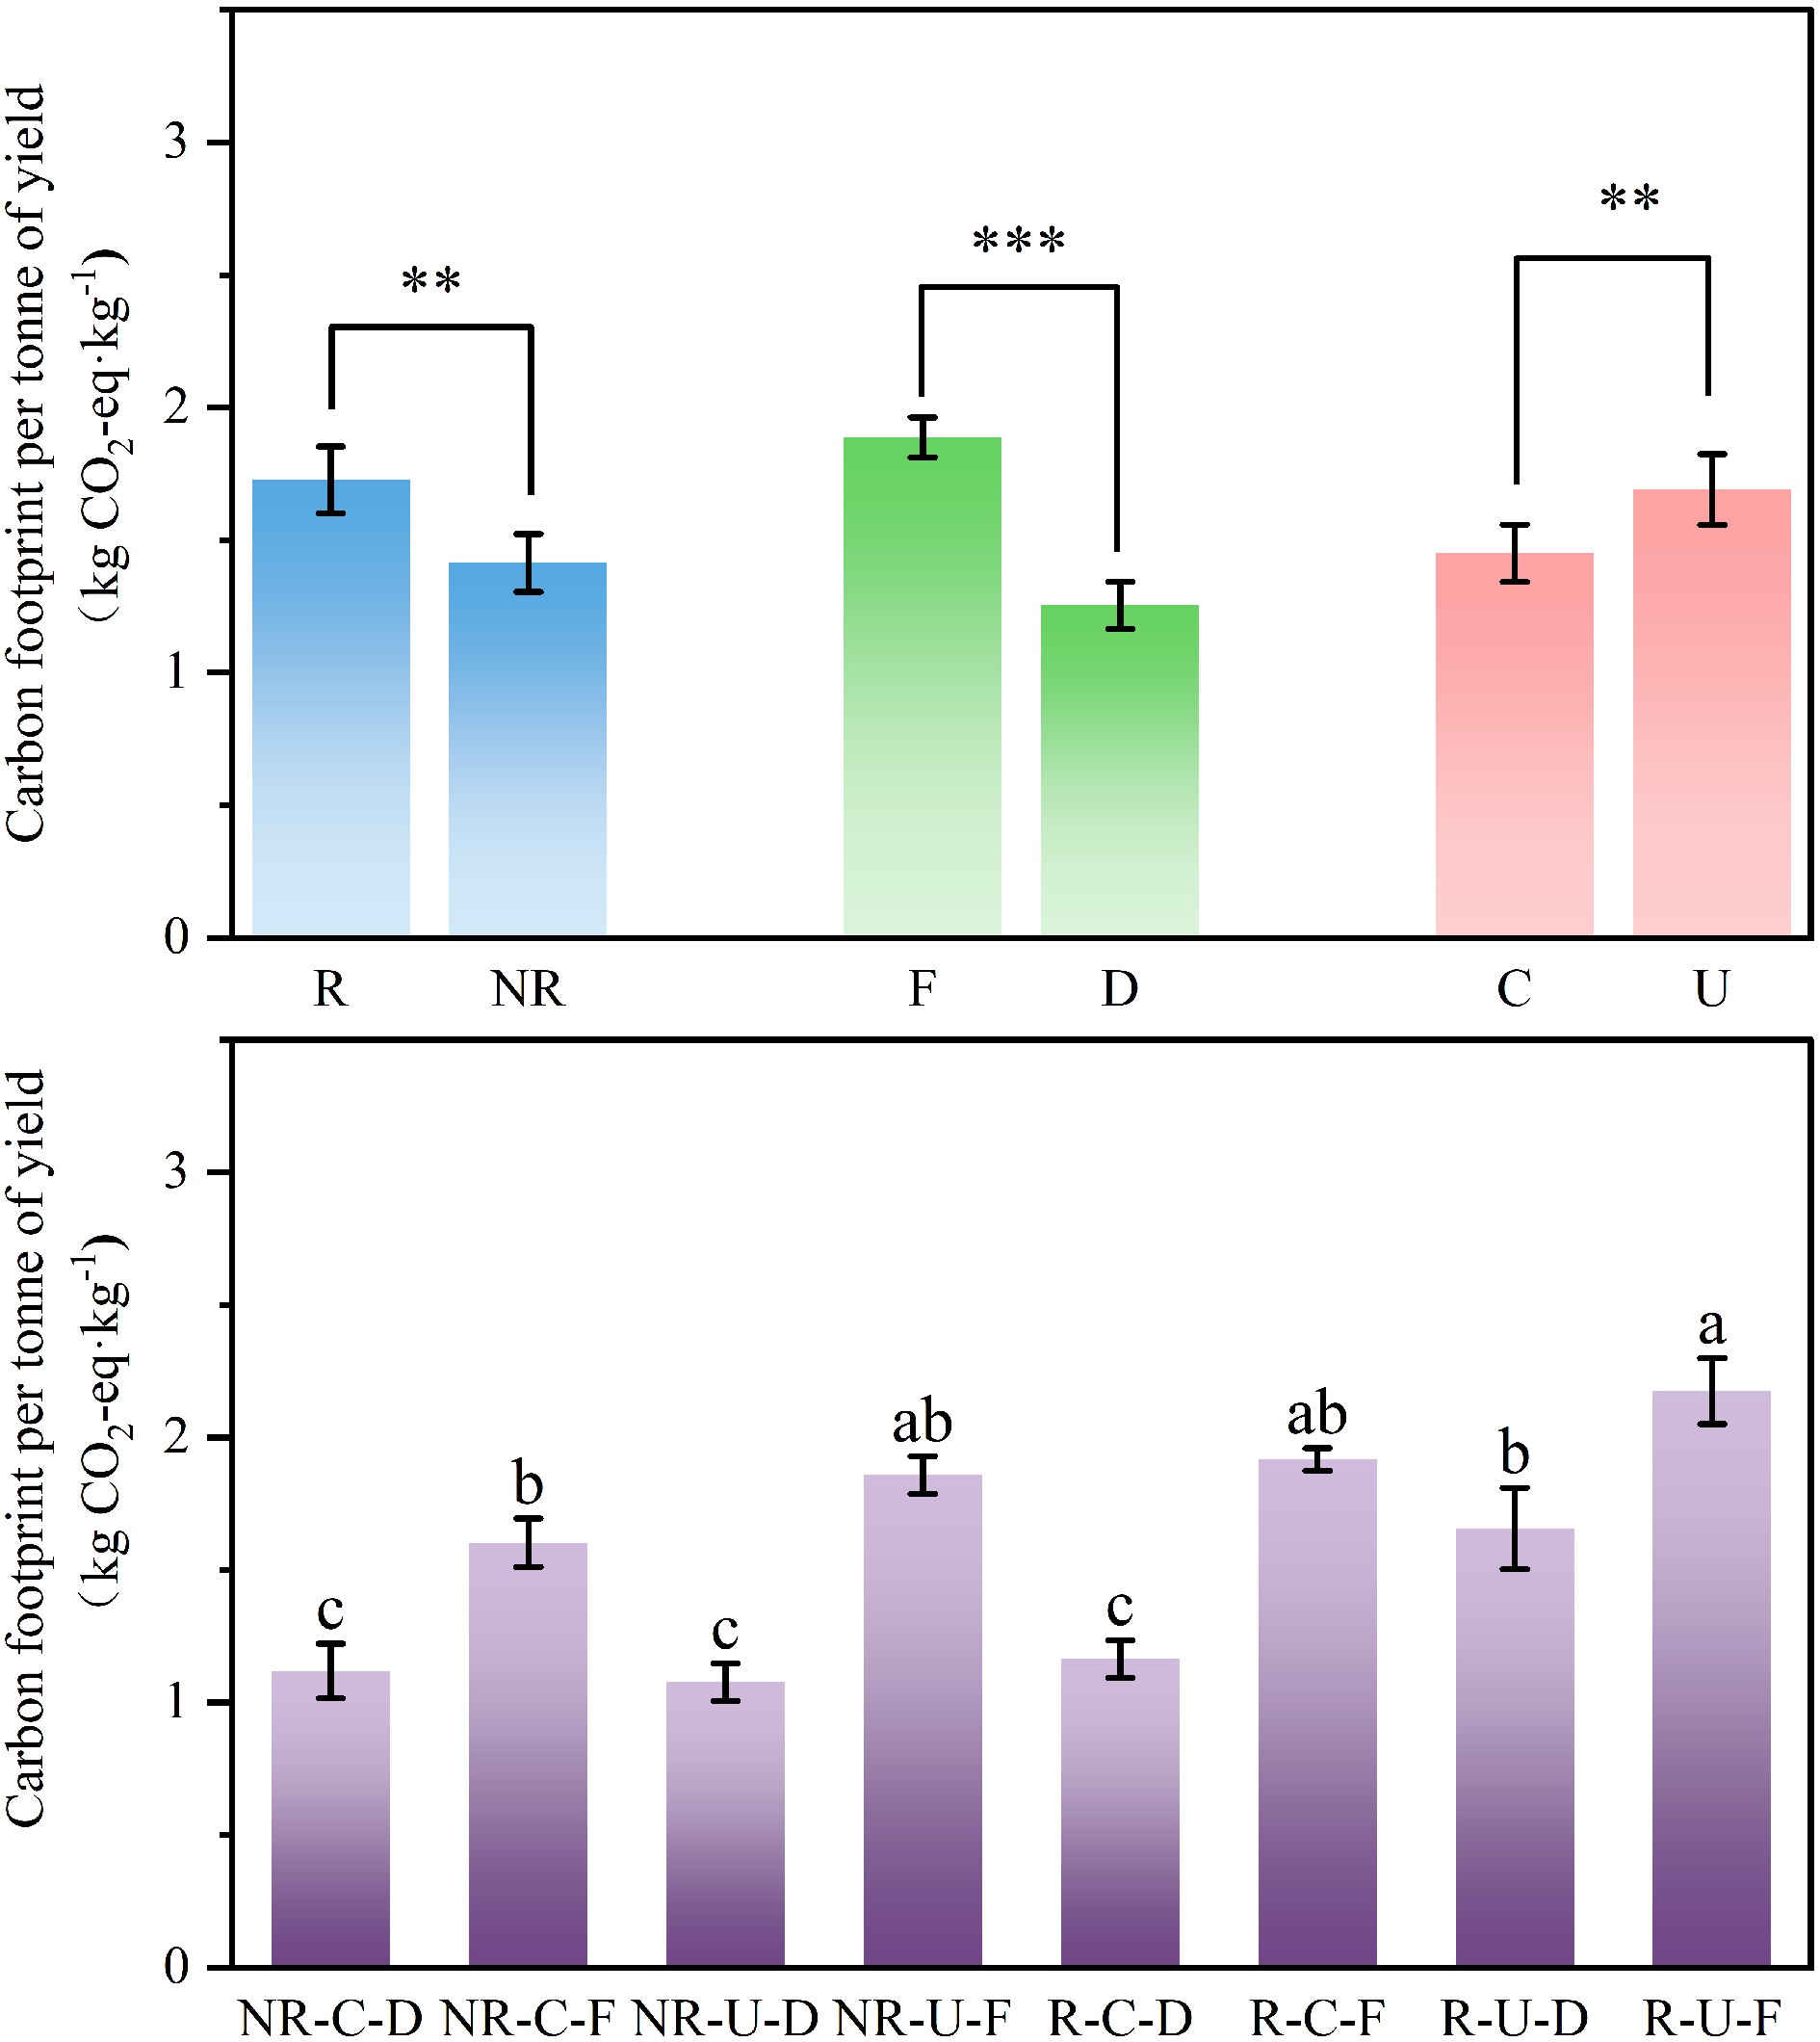
Figure 2.
Carbon footprint per unit yield as affected by different integrated paddy management. NR, no straw return; R, straw return; F, continuous flooding; D, alternate dry-wet irrigation; C, controlled-release nitrogen fertilizer; U, conventional nitrogen fertilizer; ** Significant at p < 0.01; *** Significant at p < 0.001; Different lowercase letters indicate significant differences among treatments (p < 0.05). Error bars represent the standard error (SE), n = 12 or 3.
Carbon footprint per unit area
-
Similar to CFPY, CFPS was notably affected by straw and irrigation management practices (Table 2). Straw return treatment significantly increased CFPS compared with the NR treatment (p < 0.01) (Fig. 3). Moreover, the irrigation D treatment significantly reduced CFPS relative to the F treatment (p < 0.001). Although the effect of fertilization on CFPS was not statistically significant, the fertilizer C treatment exhibited a tendency to reduce CFPS. No significant interaction effects were observed between the factors. Accordingly, the R-U-F treatment recorded the highest CFPS (28.08 t CO2-eq·ha−1). Under NR conditions, the CFPSs under irrigation D treatments were significantly lower than those under F treatments, regardless of fertilizer type. Under R conditions, the fertilizer C combined with irrigation D significantly reduced CFPS. Across all treatments, the NR-C-D, NR-U-D, and R-C-D treatments exhibited comparable CFPS values and were significantly lower than the other treatments.
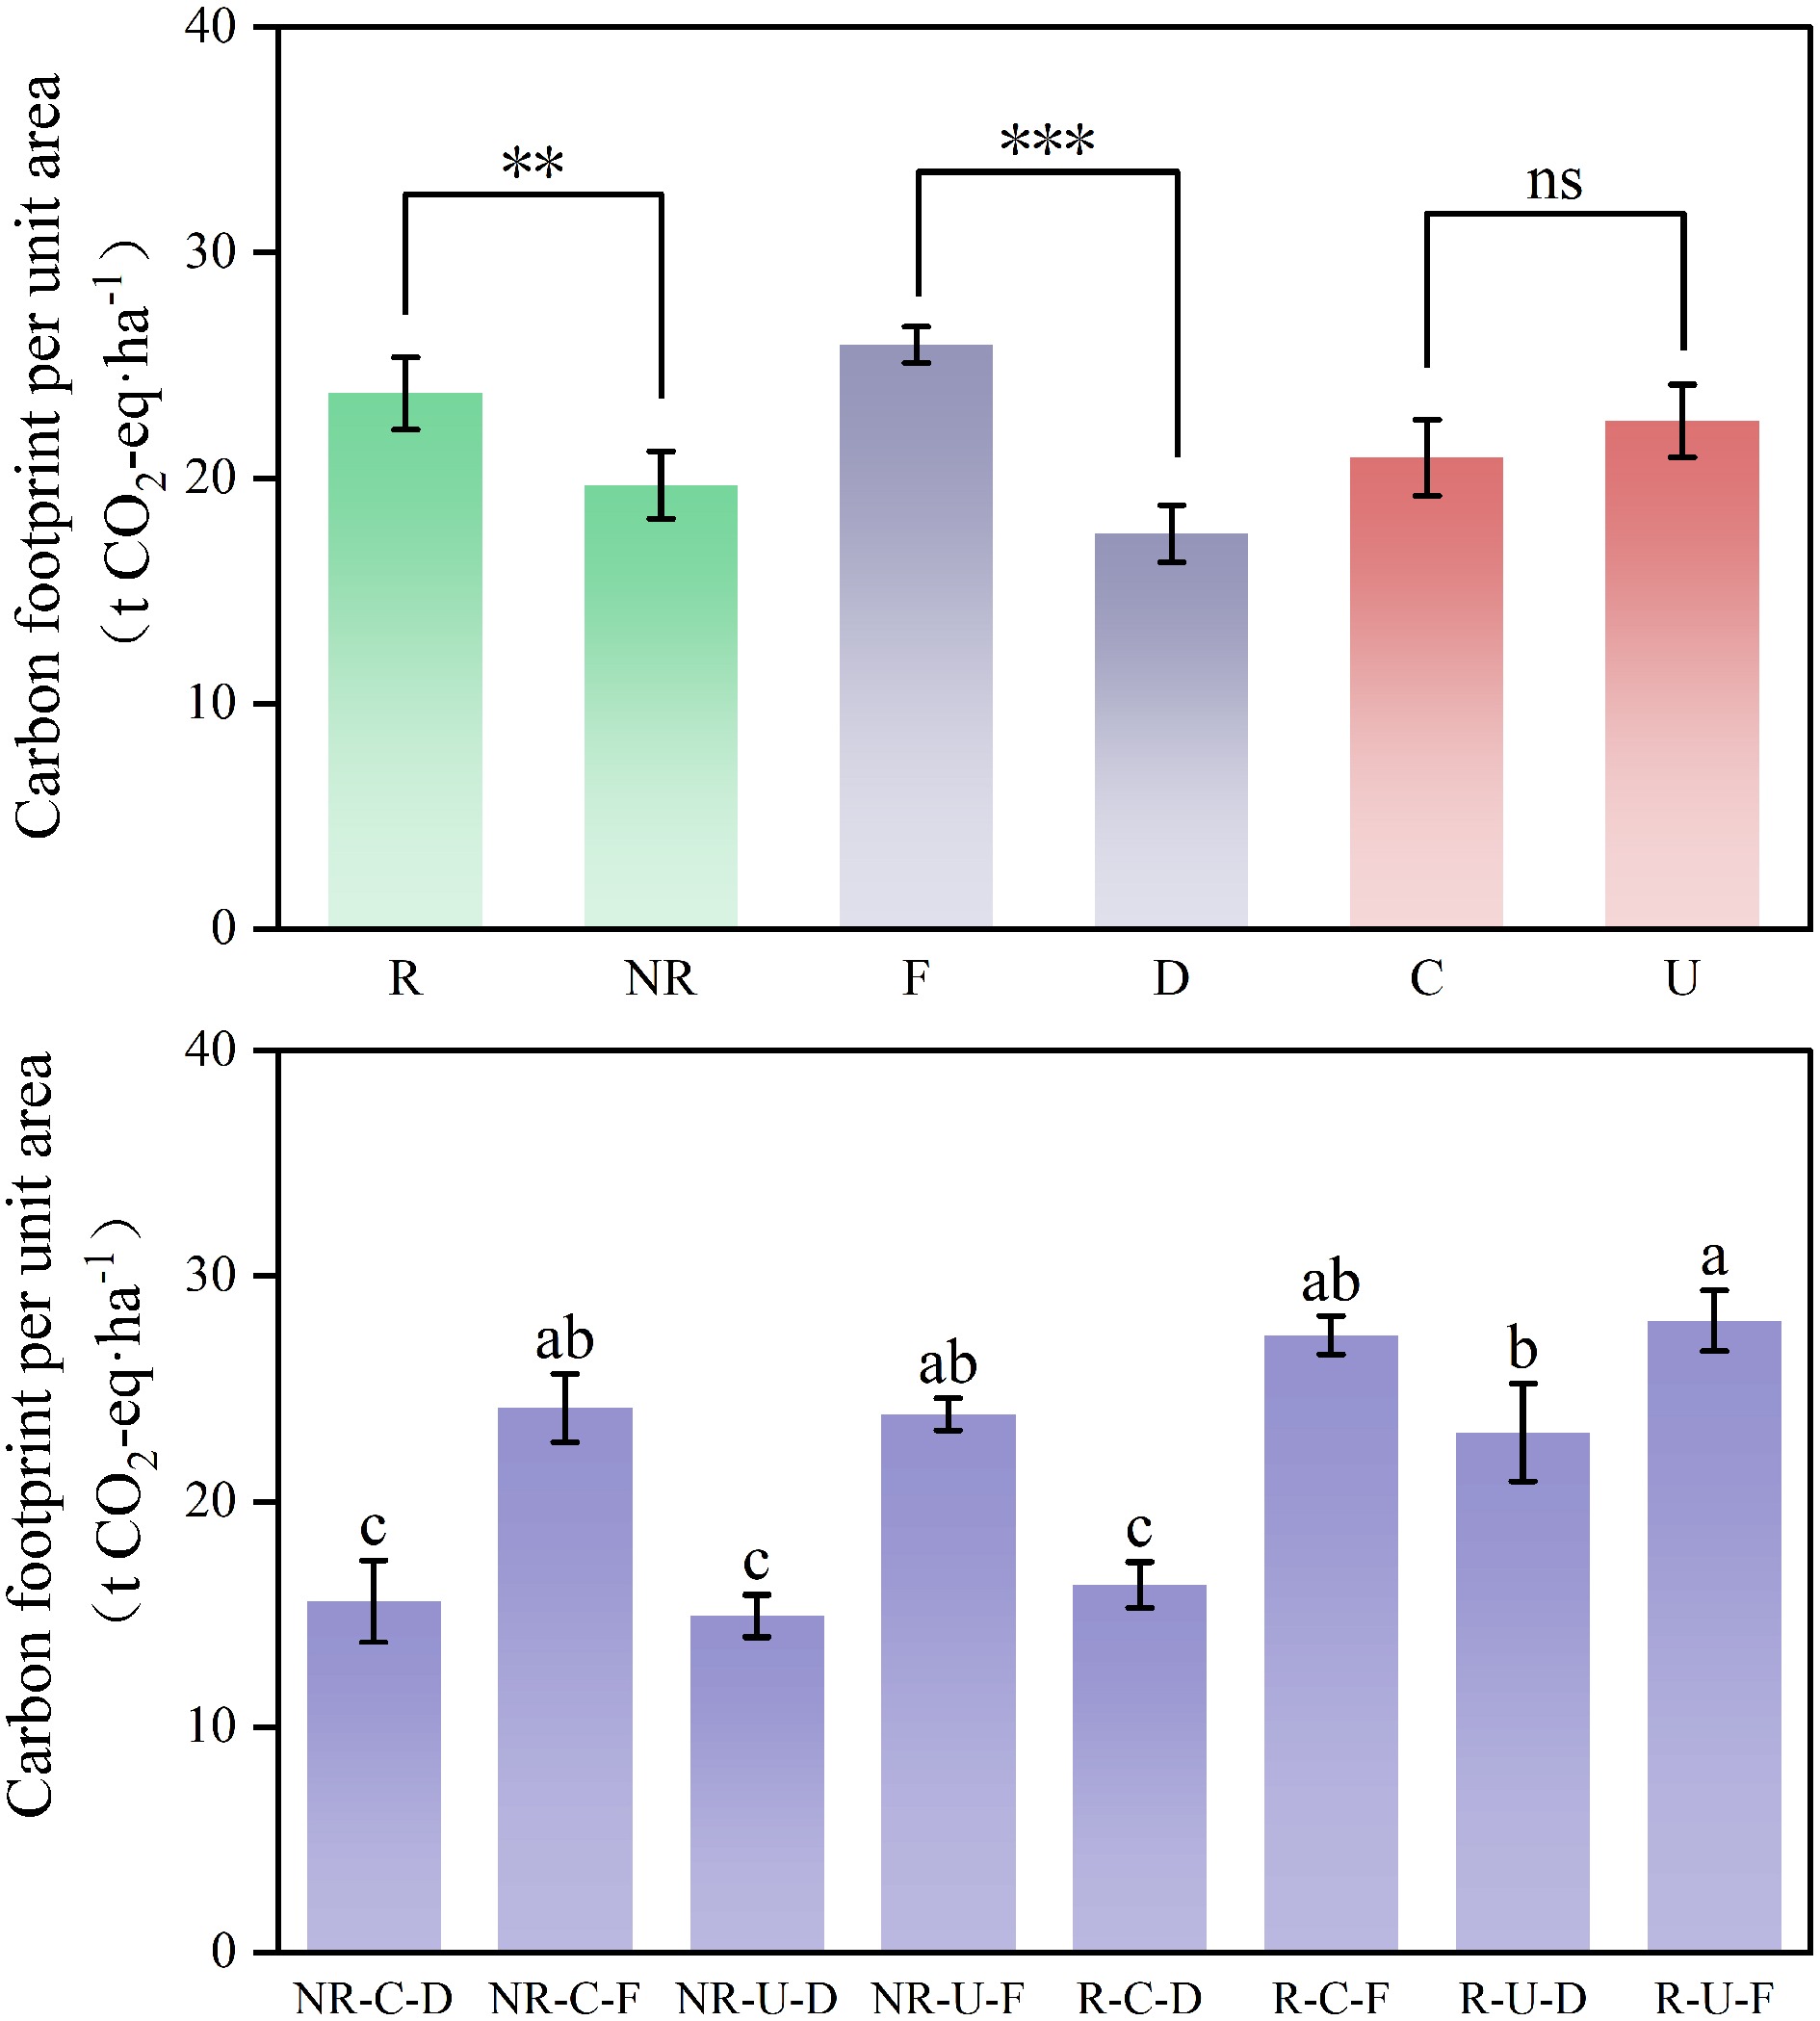
Figure 3.
Carbon footprint per unit area as affected by different integrated paddy management. NR, no straw return; R, straw return; F, continuous flooding; D, alternate dry-wet irrigation; C, controlled-release nitrogen fertilizer; U, conventional nitrogen fertilizer; ** Significant at p < 0.01; *** Significant at p < 0.001; ns, not significant (p > 0.05). Different lowercase letters indicate significant differences among treatments (p < 0.05). Error bars represent the standard error (SE), n = 12 or 3.
CFP composition
-
Figure 4 illustrates the impact of different agronomic practices and their combinations on CFP composition. Overall, embedded emissions from nitrogen fertilizer production were the primary contributor across all treatments, accounting for 21.4%~41.12% of total emissions. In contrast, the contribution of direct CH4 emissions (6.27%~44.67%) varied substantially, mainly driven by water management. Regardless of straw return, the irrigation F treatment resulted in notably high contributions of direct CH4 emissions, accounting for 44.67%, 43.76%, 36.62%, and 38.29% in the R-U-F, R-C-F, NR-U-F, and NR-C-F treatments, respectively. Notably, under straw return combined with irrigation D conditions, the fertilizer C treatment resulted in a relatively low contribution of CH4 emissions (11.81%), while the fertilizer U treatment showed a much higher contribution (38.25%). Contributions from other sources, such as electricity, phosphorus fertilizer, and potassium fertilizer, remained relatively stable with limited variation.
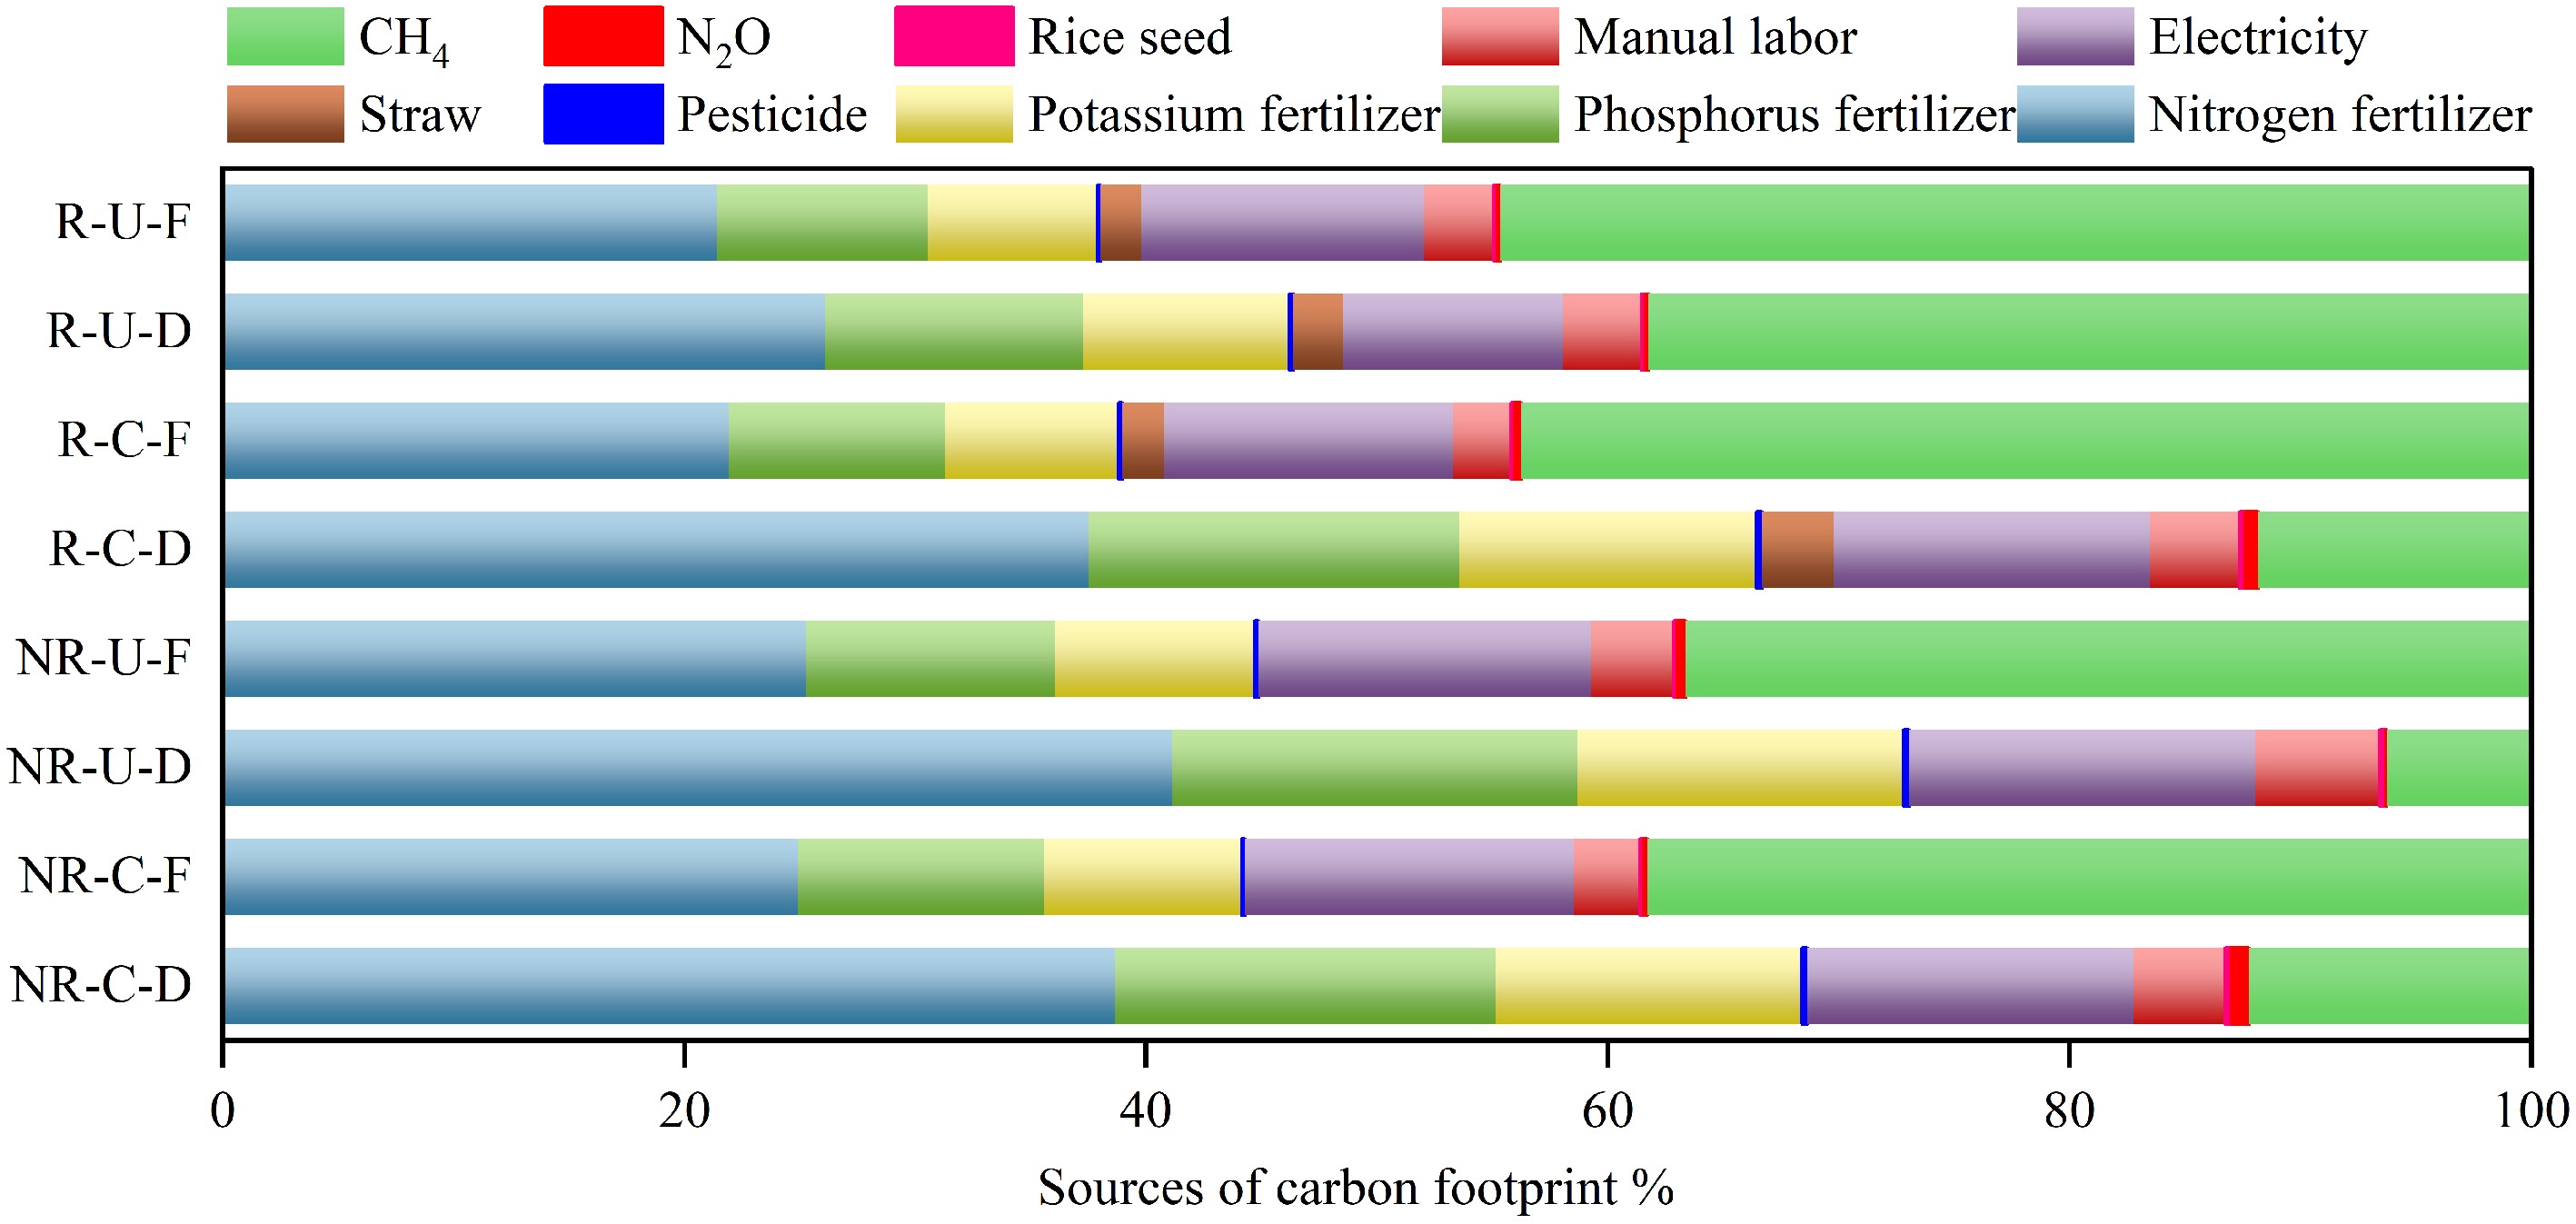
Figure 4.
Carbon footprint components as affected by different integrated paddy management.
Correlation analysis
-
The correlation analysis revealed distinct variations in the impact of different factors on CFP (Fig. 5). CFPY exhibited significant positive correlations with embedded emissions from electricity consumption and labor input, as well as direct CH4 emissions. Conversely, CFPS only demonstrated a significant positive correlation with direct N2O emissions. Notably, although fertilizer productivity (PFPN, partial factor productivity of nitrogen; PFPP, partial factor productivity of phosphorus; PFPK, partial factor productivity of potassium) showed negative but statistically non-significant correlations with CFPY, the consistent direction of association warrants attention.
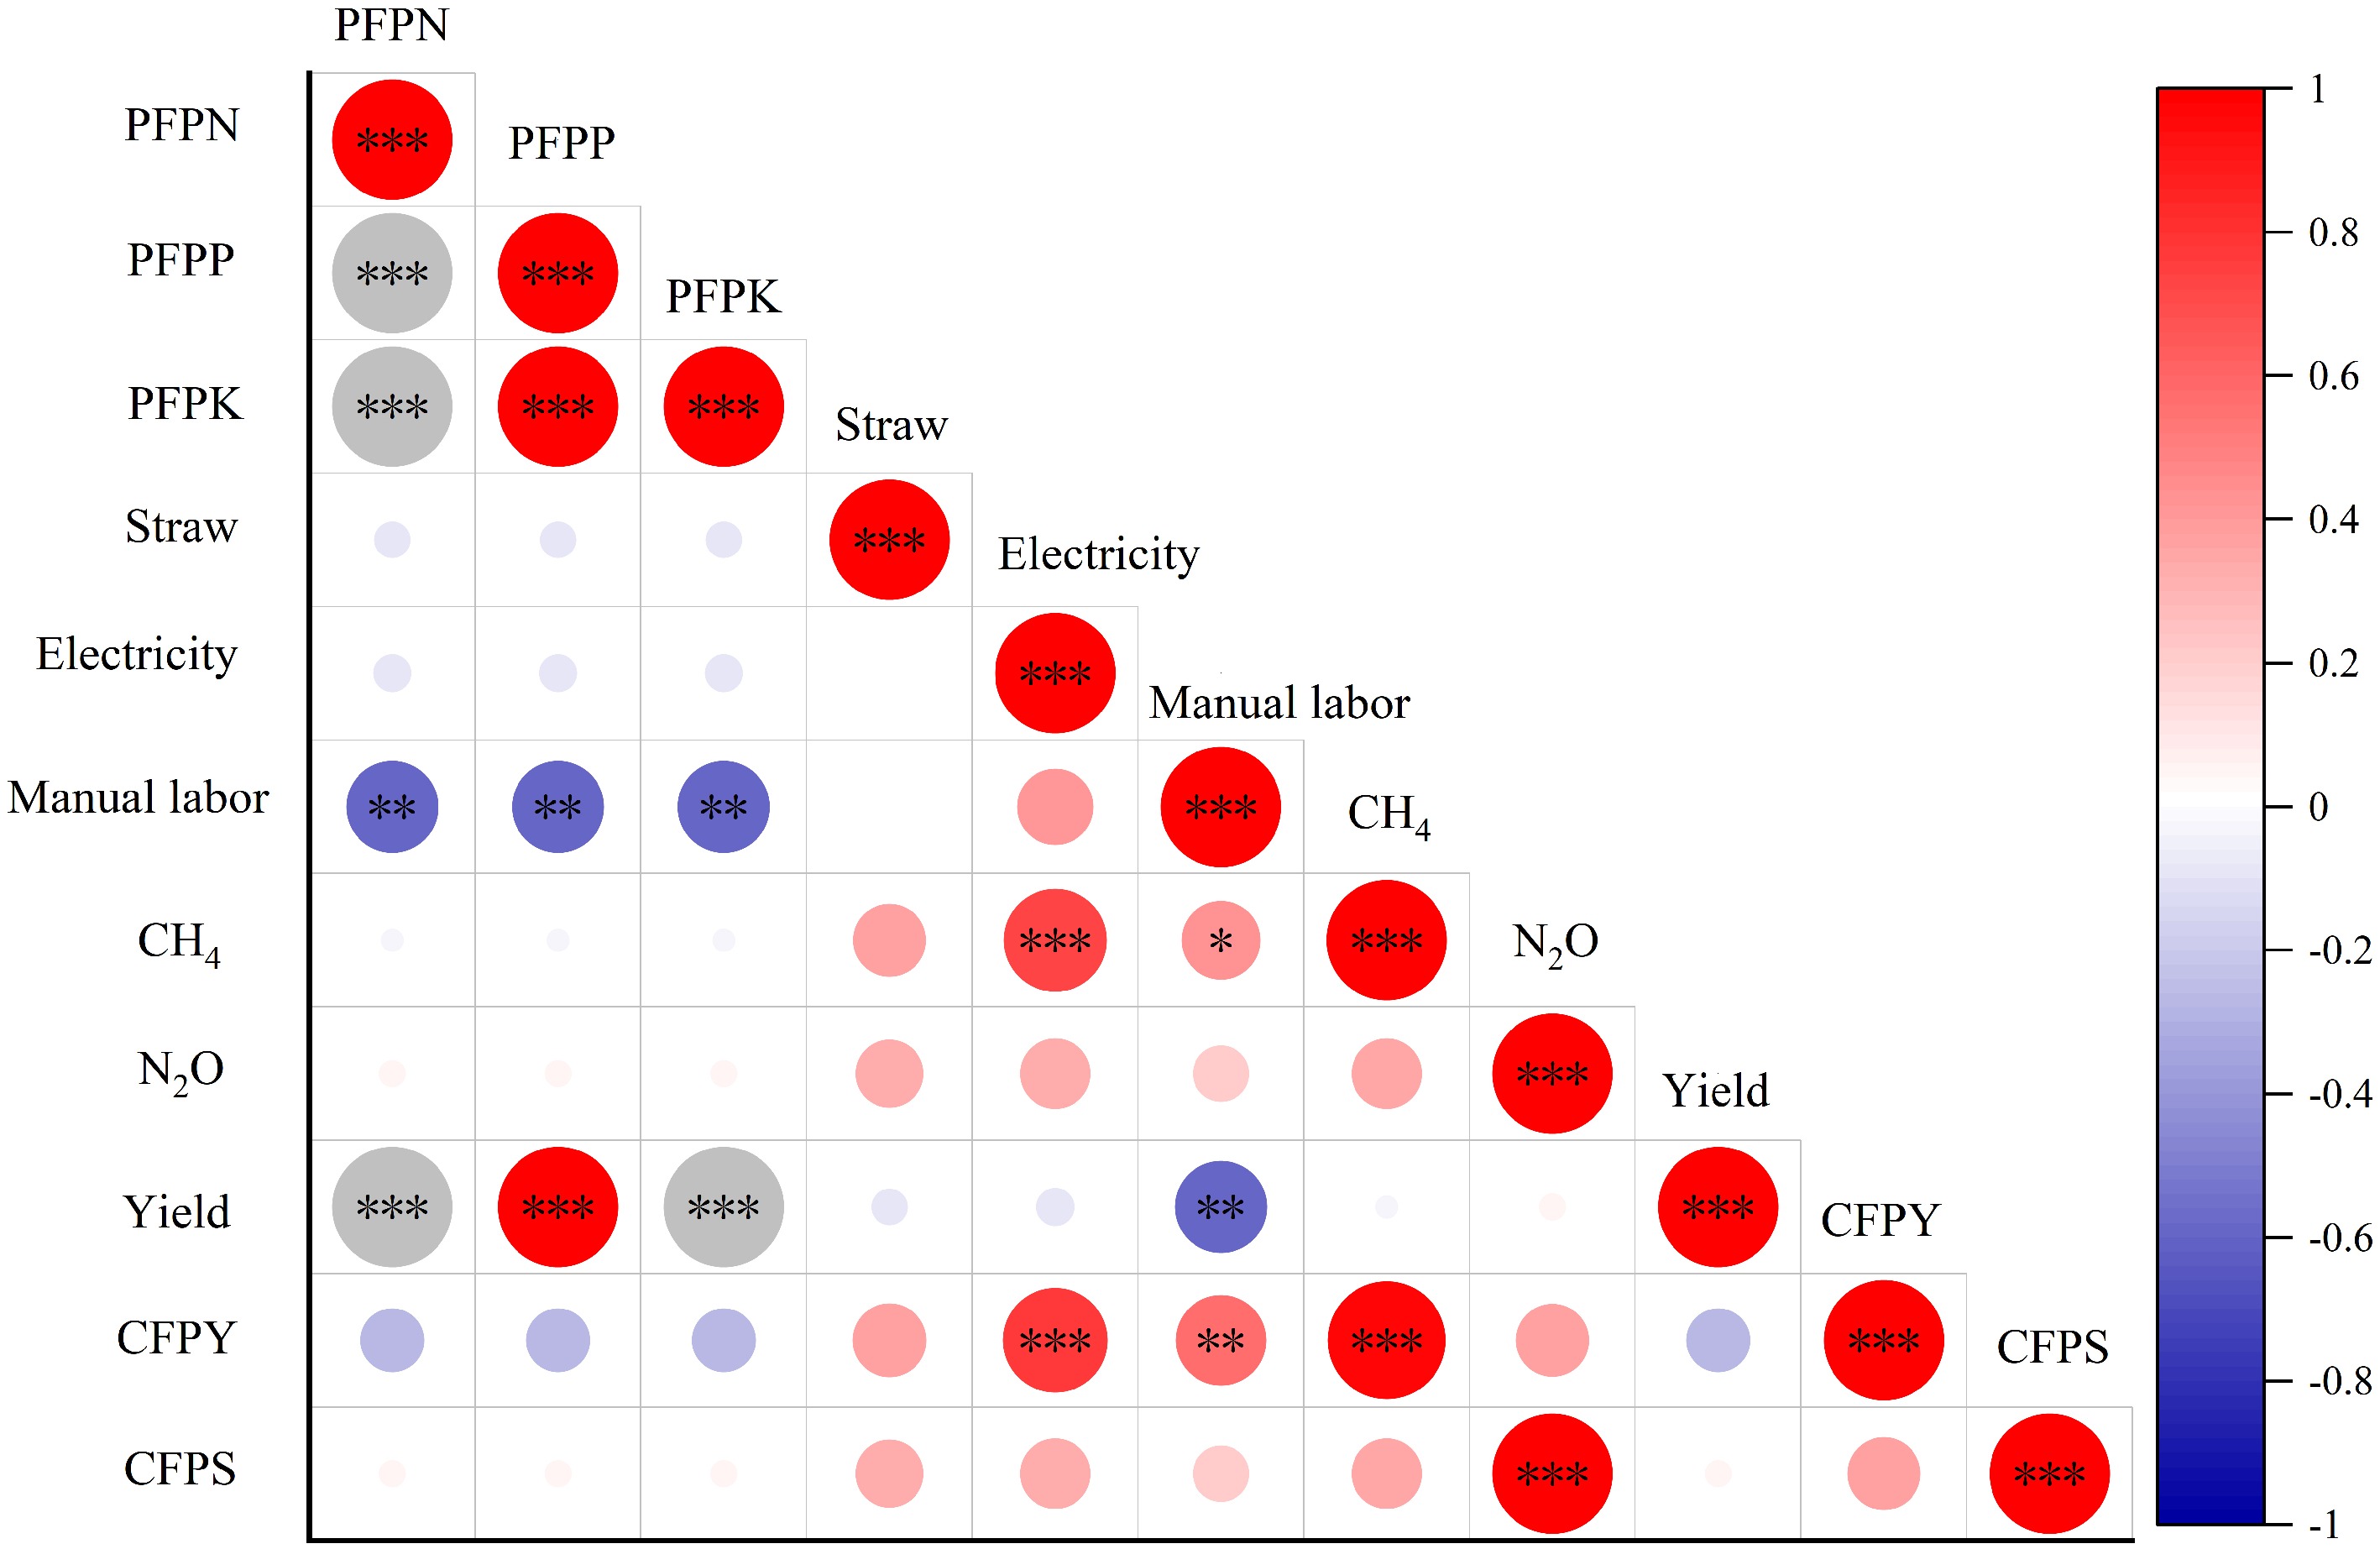
Figure 5.
Correlation analysis between the main driving factors and CFP. PFPN, partial factor productivity of nitrogen fertilizer; PFPP, partial factor productivity of phosphorus fertilizer; PFPK, partial factor productivity of potassium fertilizer; CH4, methane emissions; N2O, nitrous oxide emissions; CFPY, carbon footprint per unit yield; CFPS, carbon footprint per unit area. * Significant at p < 0.05; ** Significant at p < 0.01; *** Significant at p < 0.001.
Rice yield
-
The results showed that only fertilization management had a significant main effect on rice yield (p < 0.001), but its interaction with irrigation was also significant (p < 0.001) (Table 2). Specifically, under fertilizer U application, yield under irrigation D treatment exceeded that under F treatment, whereas yields were comparable between irrigation regimes under fertilizer C application (Fig. 6). Under continuous flooding, yield under the fertilizer C treatment was significantly higher than under the U treatment, whereas yields under both treatments did not differ significantly under irrigation D conditions. Moreover, the combined treatment of fertilizer U with irrigation F produced significantly lower yields than the other treatments. Among all treatments, NR-C-F produced the highest yield, significantly surpassing the other treatments. These findings indicate that fertilizer type is a critical determinant of rice yield; however, its effect is modulated by irrigation strategies.
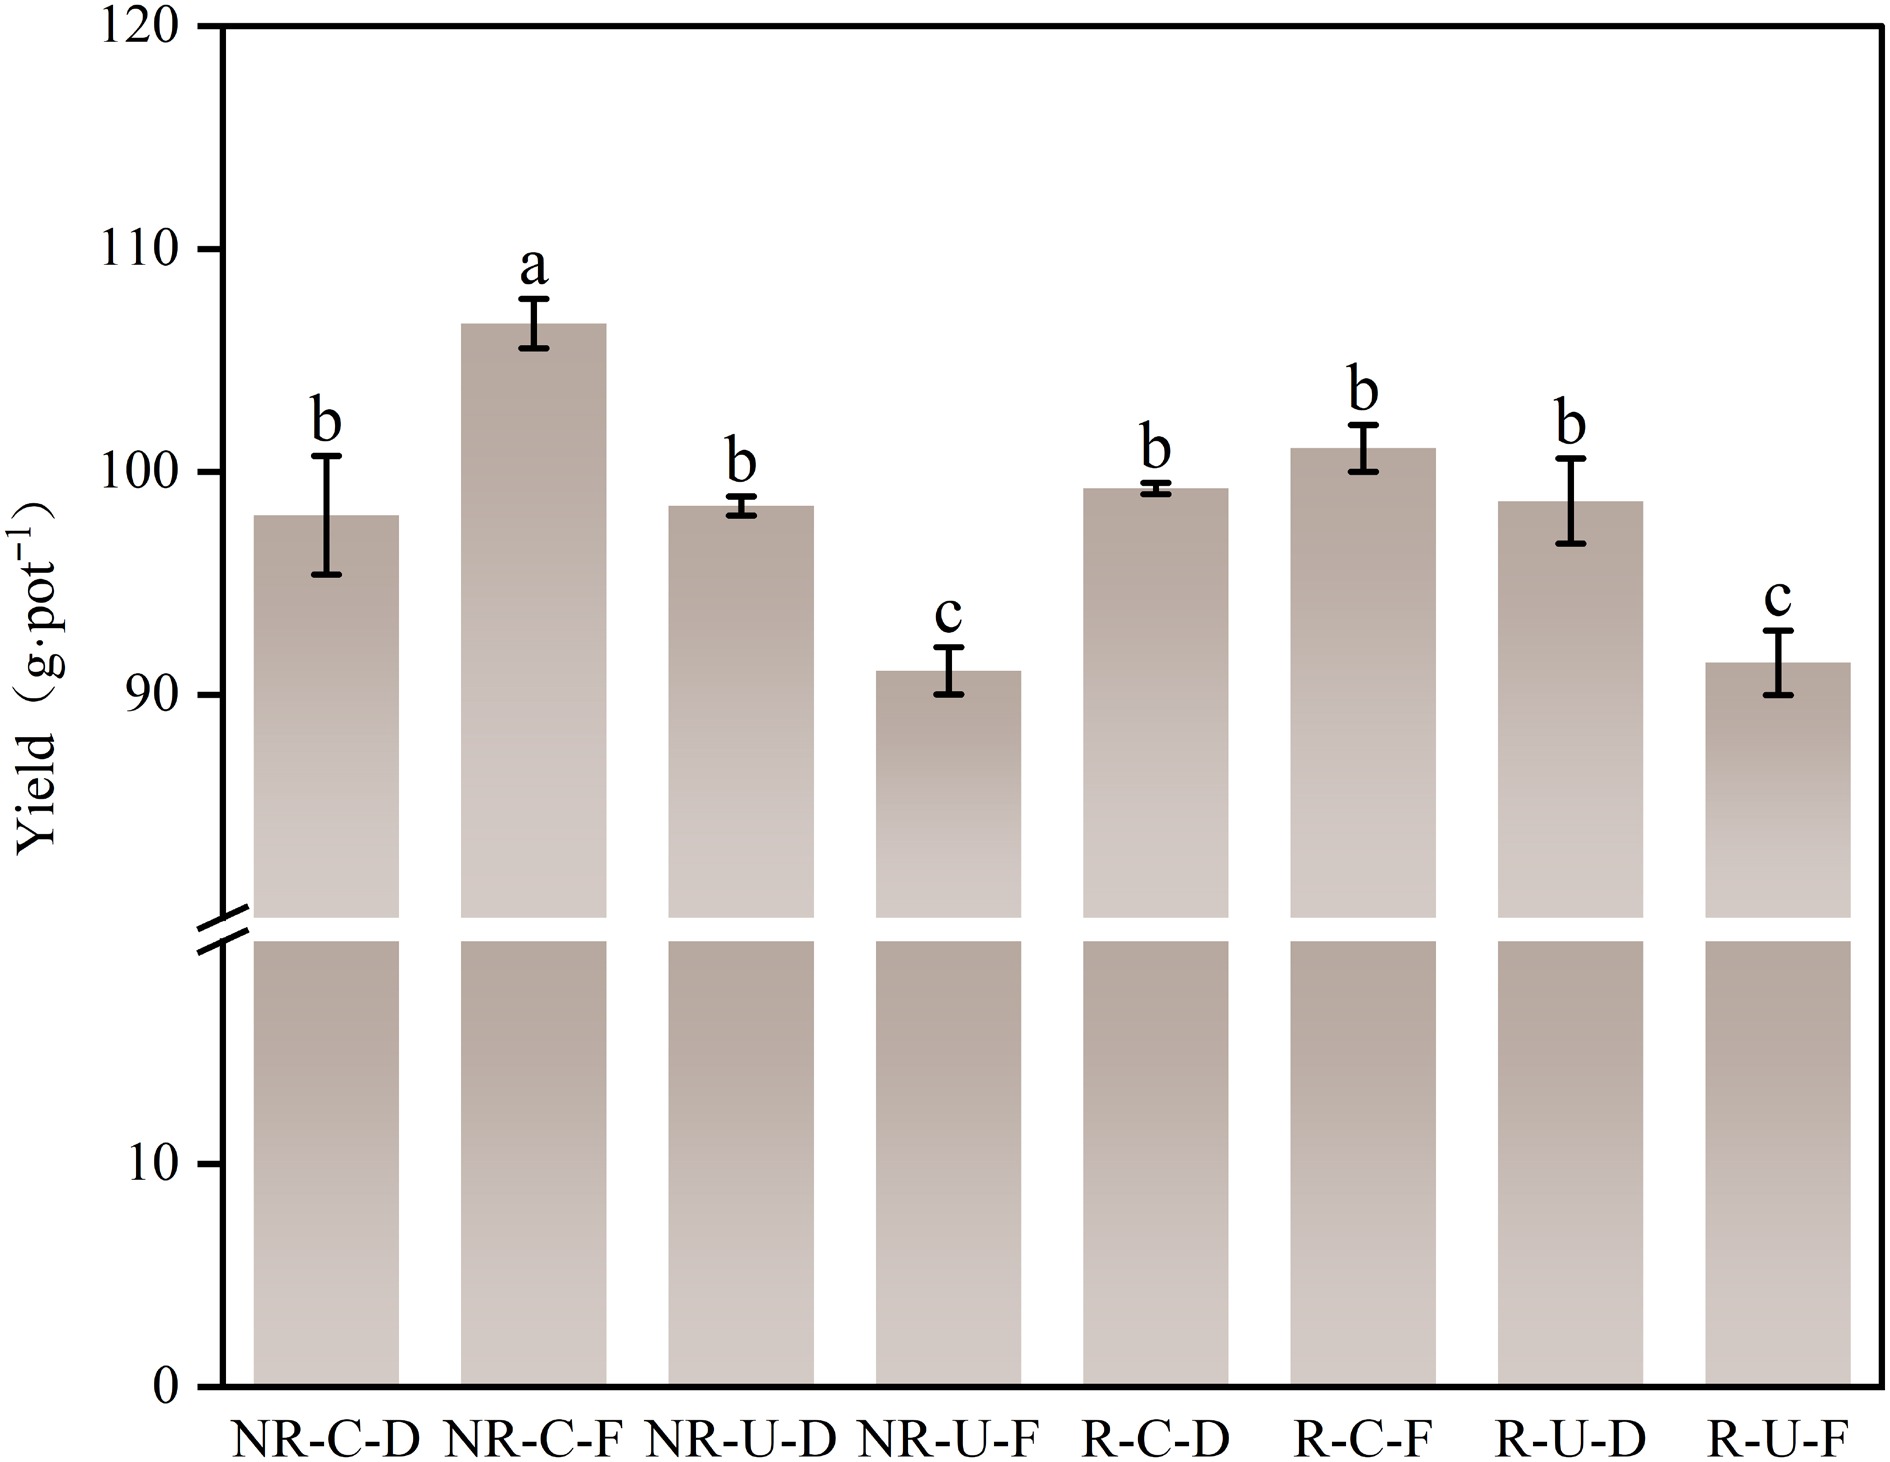
Figure 6.
Rice yield as affected by different integrated paddy management. Different lowercase letters indicate significant differences among treatments (p < 0.05). Error bars represent the standard error (SE), n = 3.
-
The results showed that both straw return and irrigation F treatments significantly increased CFPY and CFPS, with fertilizer U treatment yielding higher values than fertilizer C. This finding is consistent with previous studies[27−31]. For example, Zhao et al. reported that non-flooded irrigation is most effective in reducing GWP in paddies, whereas conventional nitrogen fertilizer increases GWP more substantially than controlled-release fertilizer[32]. Notably, the NR-C-D, NR-U-D, and R-C-D treatments exhibited comparable CFPY and CFPS values, all significantly lower than the other treatments. This suggests that integrated irrigation-straw-fertilization management effectively reduces CFP. Specifically, when straw is not returned, alternate dry-wet irrigation alone can reduce CFP. Conversely, when straw is incorporated, applying controlled-release fertilizer in combination with alternate dry-wet irrigation also achieves low CFP.
This study further found that CFP composition varied markedly across agronomic practices. Under irrigation D and no straw return conditions, CFP was primarily driven by embedded emissions from nitrogen fertilizer production. Under irrigation F and straw return conditions, however, direct CH4 emissions also contributed substantially. Results highlight that nitrogen fertilizer is a key contributor to CFP. Importantly, the findings demonstrate that water and straw management might regulate the trade-off between embedded nitrogen fertilizer emissions and direct methane emissions.
Compared with continuous flooding, the alternate dry-wet irrigation suppresses CH4 production by elevating soil redox potential[33,34]. Under these irrigation conditions, nitrogen fertilizer emerges as the dominant contributor, resulting in a 'nitrogen fertilizer-dominated' CFP profile. This aligns with the findings of a meta-analysis by Minamikawa[13], which identified alternate dry-wet irrigation as an effective strategy for reducing global warming potential. Conversely, continuous flooding creates a strictly anaerobic soil environment that favors methane production and emissions[35,36], shifting CFP toward a 'methane-dominant' pattern. Meanwhile, straw return provides abundant carbon substrates[37,38], further increasing the proportion of direct CH4 emissions.
Notably, under straw return with irrigation D conditions, the contribution of direct methane emissions was relatively low in fertilizer C treatment (11.81%) but considerably higher in fertilizer U treatment (38.25%). This indicates that even under alternate dry-wet irrigation, the type of fertilizer can alter CFP intensity by influencing CH4 emissions when straw is returned. Previous studies have demonstrated that under straw return conditions, controlled-release fertilizers can reduce CFP compared to conventional fertilizers by mitigating CH4 emissions[39]. The results reveal that embedded emissions from nitrogen fertilizer production and direct CH4 emissions are the dominant contributors to CFP. Their trade-off is jointly regulated by irrigation and straw management, while the influence of fertilizer type under straw return should not be overlooked.
Correlation analysis revealed significant positive correlations between CFPY and embedded emissions from electricity consumption and labor input, as well as direct CH4 emissions. This indicates that agronomic practices influence not only direct CH4 emissions but also CFP per unit yield through energy consumption. Unlike CFPY, CFPS was significantly positively correlated only with N2O emissions. On the one hand, this suggests that although N2O emitting from paddy fields is relatively low, its contribution to CFPS cannot be ignored due to the high global warming potential[40,41]. On the other hand, the results highlight that despite consistent CFPY and CFPS patterns across treatments, their controlling factors differ.
Unlike CFP responses, among the main effects, only fertilization management had a significant impact on rice yield. However, a significant interaction effect was observed between fertilization and irrigation. Nevertheless, rice yield decreased significantly under both straw management conditions when conventional nitrogen fertilizer was combined with continuous flooding. In contrast, the NR-C-F treatment achieved the highest yield. This may be attributed to the enhanced nutrient availability and reduced N loss associated with controlled-release fertilizer under continuous flooding, which minimizes processes such as denitrification that are prevalent under fluctuating moisture conditions like alternate wetting and drying[42]. The results also explain why the negative correlations between fertilizer productivity (PFPN, PFPP, PFPK) and CFPY did not reach statistical significance.
Despite the valuable insights gained from this study, it is important to acknowledge the limitations associated with the pot experiment design. Pot trials cannot fully replicate field conditions, particularly regarding gas diffusion and root growth space. Furthermore, this study did not account for variations in soil type. Soils of different textures differ in water-holding capacity, nutrient retention, and gas diffusion properties, all of which can influence the efficacy of the evaluated management strategies. Future studies should validate these findings across diverse soil types to enhance the generalizability of the results, especially under field conditions.
-
Overall, CFPY and CFPS were inevitably affected by different agronomic practices. Under no straw return conditions, alternate dry-wet irrigation effectively reduced CFP, regardless of the type of fertilizer used. Under straw return conditions, however, controlled-release nitrogen fertilizer combined with alternate dry-wet irrigation achieved greater CFP mitigation. In terms of rice yield, alternate dry-wet irrigation, coupled with controlled-release nitrogen fertilizer, was beneficial to maintain high yield while reducing CFP. Notably, soil carbon pools were not included in CFP calculations, even though straw return may enhance soil carbon sequestration, particularly under long-term management. Future research should incorporate soil carbon dynamics to establish a more comprehensive carbon balance assessment framework, thereby providing more precise support for green rice production.
This research was funded by the Natural Science Foundation of Jiangsu Province (BK20240163) and Jiangsu Agricultural Science and Technology Innovation Fund (CX(24)3104).
-
The authors confirm their contributions to the paper as follows: methodology: Hou P, Xue L, Yang L; formal analysis: Zhang F; investigation: Zhang F, Li Y; data curation: Zhang F; writing-original draft: Zhang F, Hou P; writing-review and editing: Zhang F, Ke J, Wu L, Ma C, Hou P, Xue L, Yang L; visualization: Zhang F; supervision: Xue L, Hou P, Yang L; funding acquisition: Hou P, Xue L. All authors have read and agreed to the published version of the manuscript.
-
The datasets generated during and/or analyzed during the current study are available from the corresponding author upon reasonable request.
-
The authors declare that they have no conflict of interest.
- Copyright: © 2026 by the author(s). Published by Maximum Academic Press, Fayetteville, GA. This article is an open access article distributed under Creative Commons Attribution License (CC BY 4.0), visit https://creativecommons.org/licenses/by/4.0/.
-
About this article
Cite this article
Zhang F, Li Y, Ke J, Wu L, Ma C, et al. 2026. Carbon footprint assessment of integrated paddy field management: irrigation, fertilization, and straw management. Technology in Agronomy 6: e006 doi: 10.48130/tia-0026-0003 

Carbon footprint assessment of integrated paddy field management: irrigation, fertilization, and straw management
- Received: 31 December 2025
- Revised: 09 February 2026
- Accepted: 22 February 2026
- Published online: 07 May 2026
Abstract: Irrigation, fertilization, and straw management are key determinants affecting the carbon footprint of rice production (CFP). To evaluate the synergistic effects among these practices, a three-factor experimental design was employed, involving straw return (R) vs no straw return (NR), continuous flooding (F) vs alternate dry-wet irrigation (D), and controlled-release nitrogen fertilizer (C) vs conventional fertilizer (U). Life cycle assessment was used to quantify the CFP per unit yield (CFPY) and area (CFPS) under different treatment combinations. Results indicated that straw return significantly increased both CFPY and CFPS compared to the NR treatment, whereas the irrigation D treatment reduced both more effectively than the F treatment. Furthermore, the fertilizer C treatment generally lowered both relative to the U treatment, with the reduction in CFPY being significant. Regarding synergistic effects, under NR conditions, both CFPY and CFPS in the D plots were significantly lower than in the F plots, regardless of fertilizer type. Under R conditions, however, only the combination of C and D yielded lower CFPY and CFPS values, which were significantly different from the other treatments. Among all treatments, NR-C-D, NR-U-D, and R-C-D exhibited comparable and significantly lower CFP. The CFP composition analysis revealed that embedded emissions from nitrogen fertilizer production and direct CH4 emissions were the primary contributors, with their trade-off regulated by irrigation and straw management. Overall, alternate dry-wet irrigation reduces CFP when straw is not returned, whereas the combined application of controlled-release fertilizer and alternate dry-wet irrigation is necessary to mitigate CFP under straw return conditions.
-
Key words:
- Rice /
- Carbon footprint /
- Straw return /
- Fertilizer type /
- Irrigation management