-
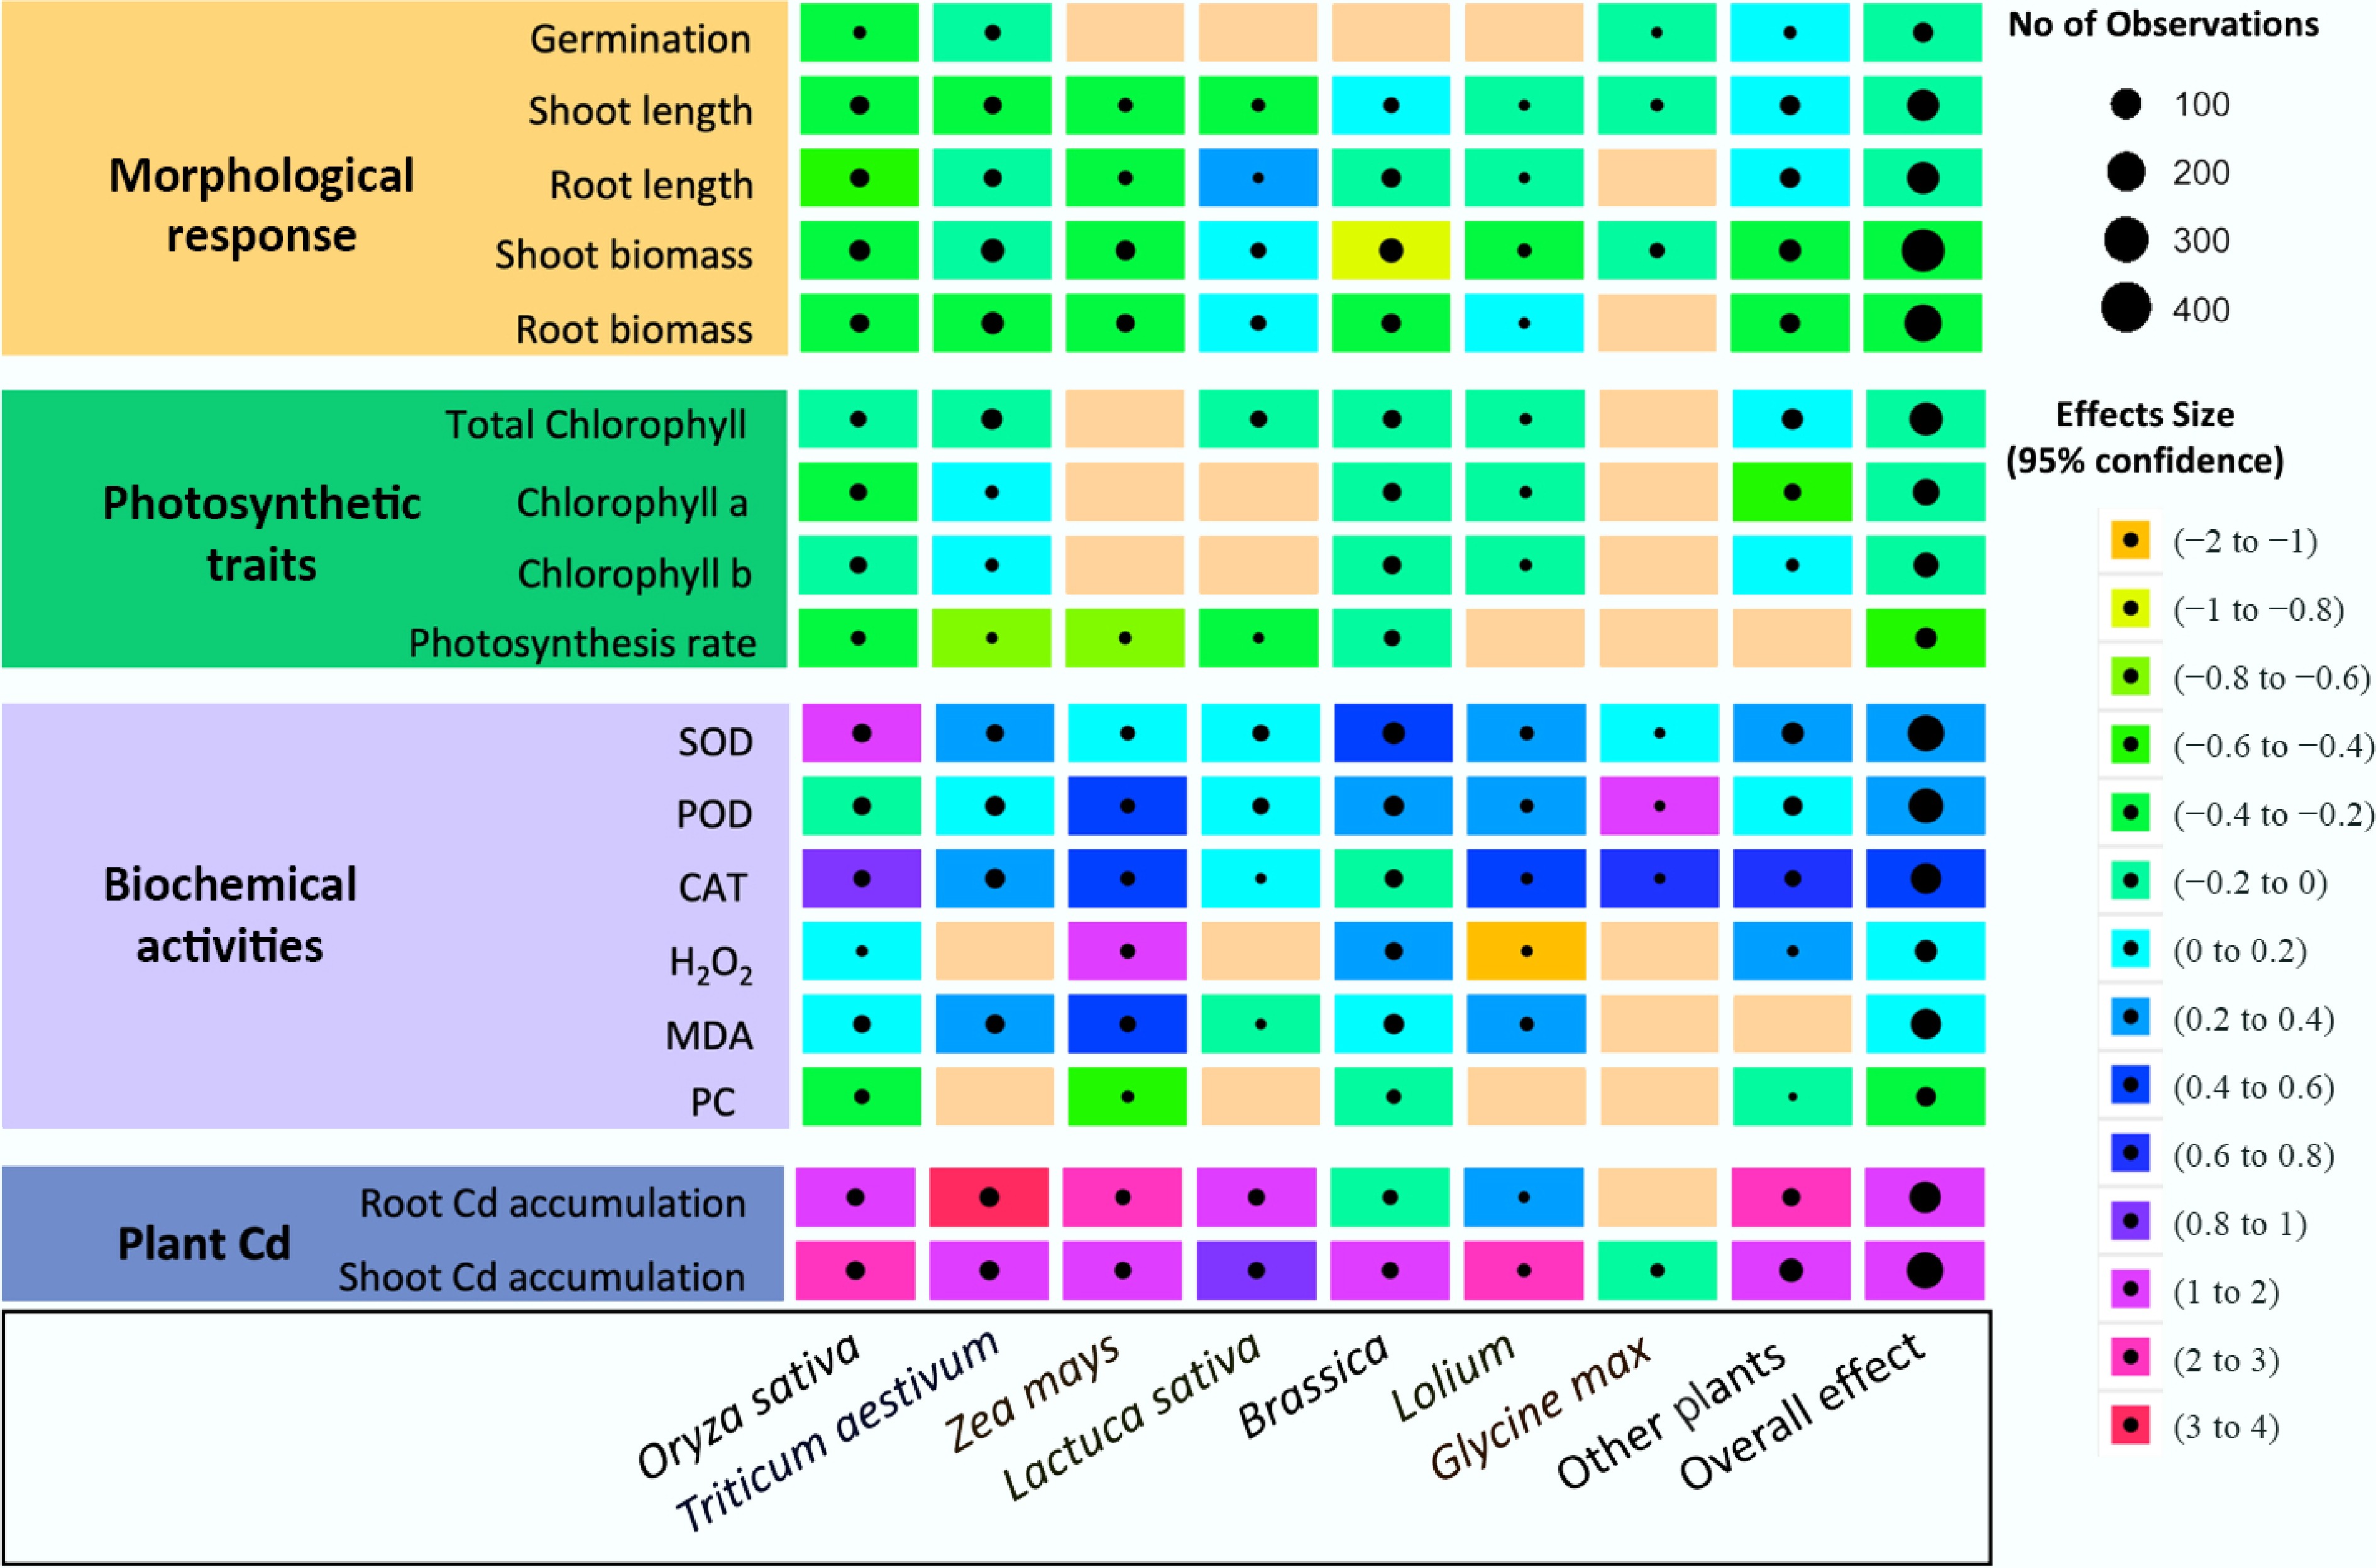
Figure 1.
The overall effects of Cd, MPs, and their combined exposures on plant responses relative to control in terms of morphological parameters, photosynthetic traits, biochemical activities, and plant Cd accumulation across different species. Rows represent specific traits, while columns correspond to plant species, family, and the overall effect. Effect sizes (± 95% CI) are indicated by a color gradient, ranging from strongly inhibitory (orange, –2 to –1) to strongly promotive (magenta, 3 to 4). Circle size denotes the number of contributing observations, and blank cells indicate the absence of reported data.
-
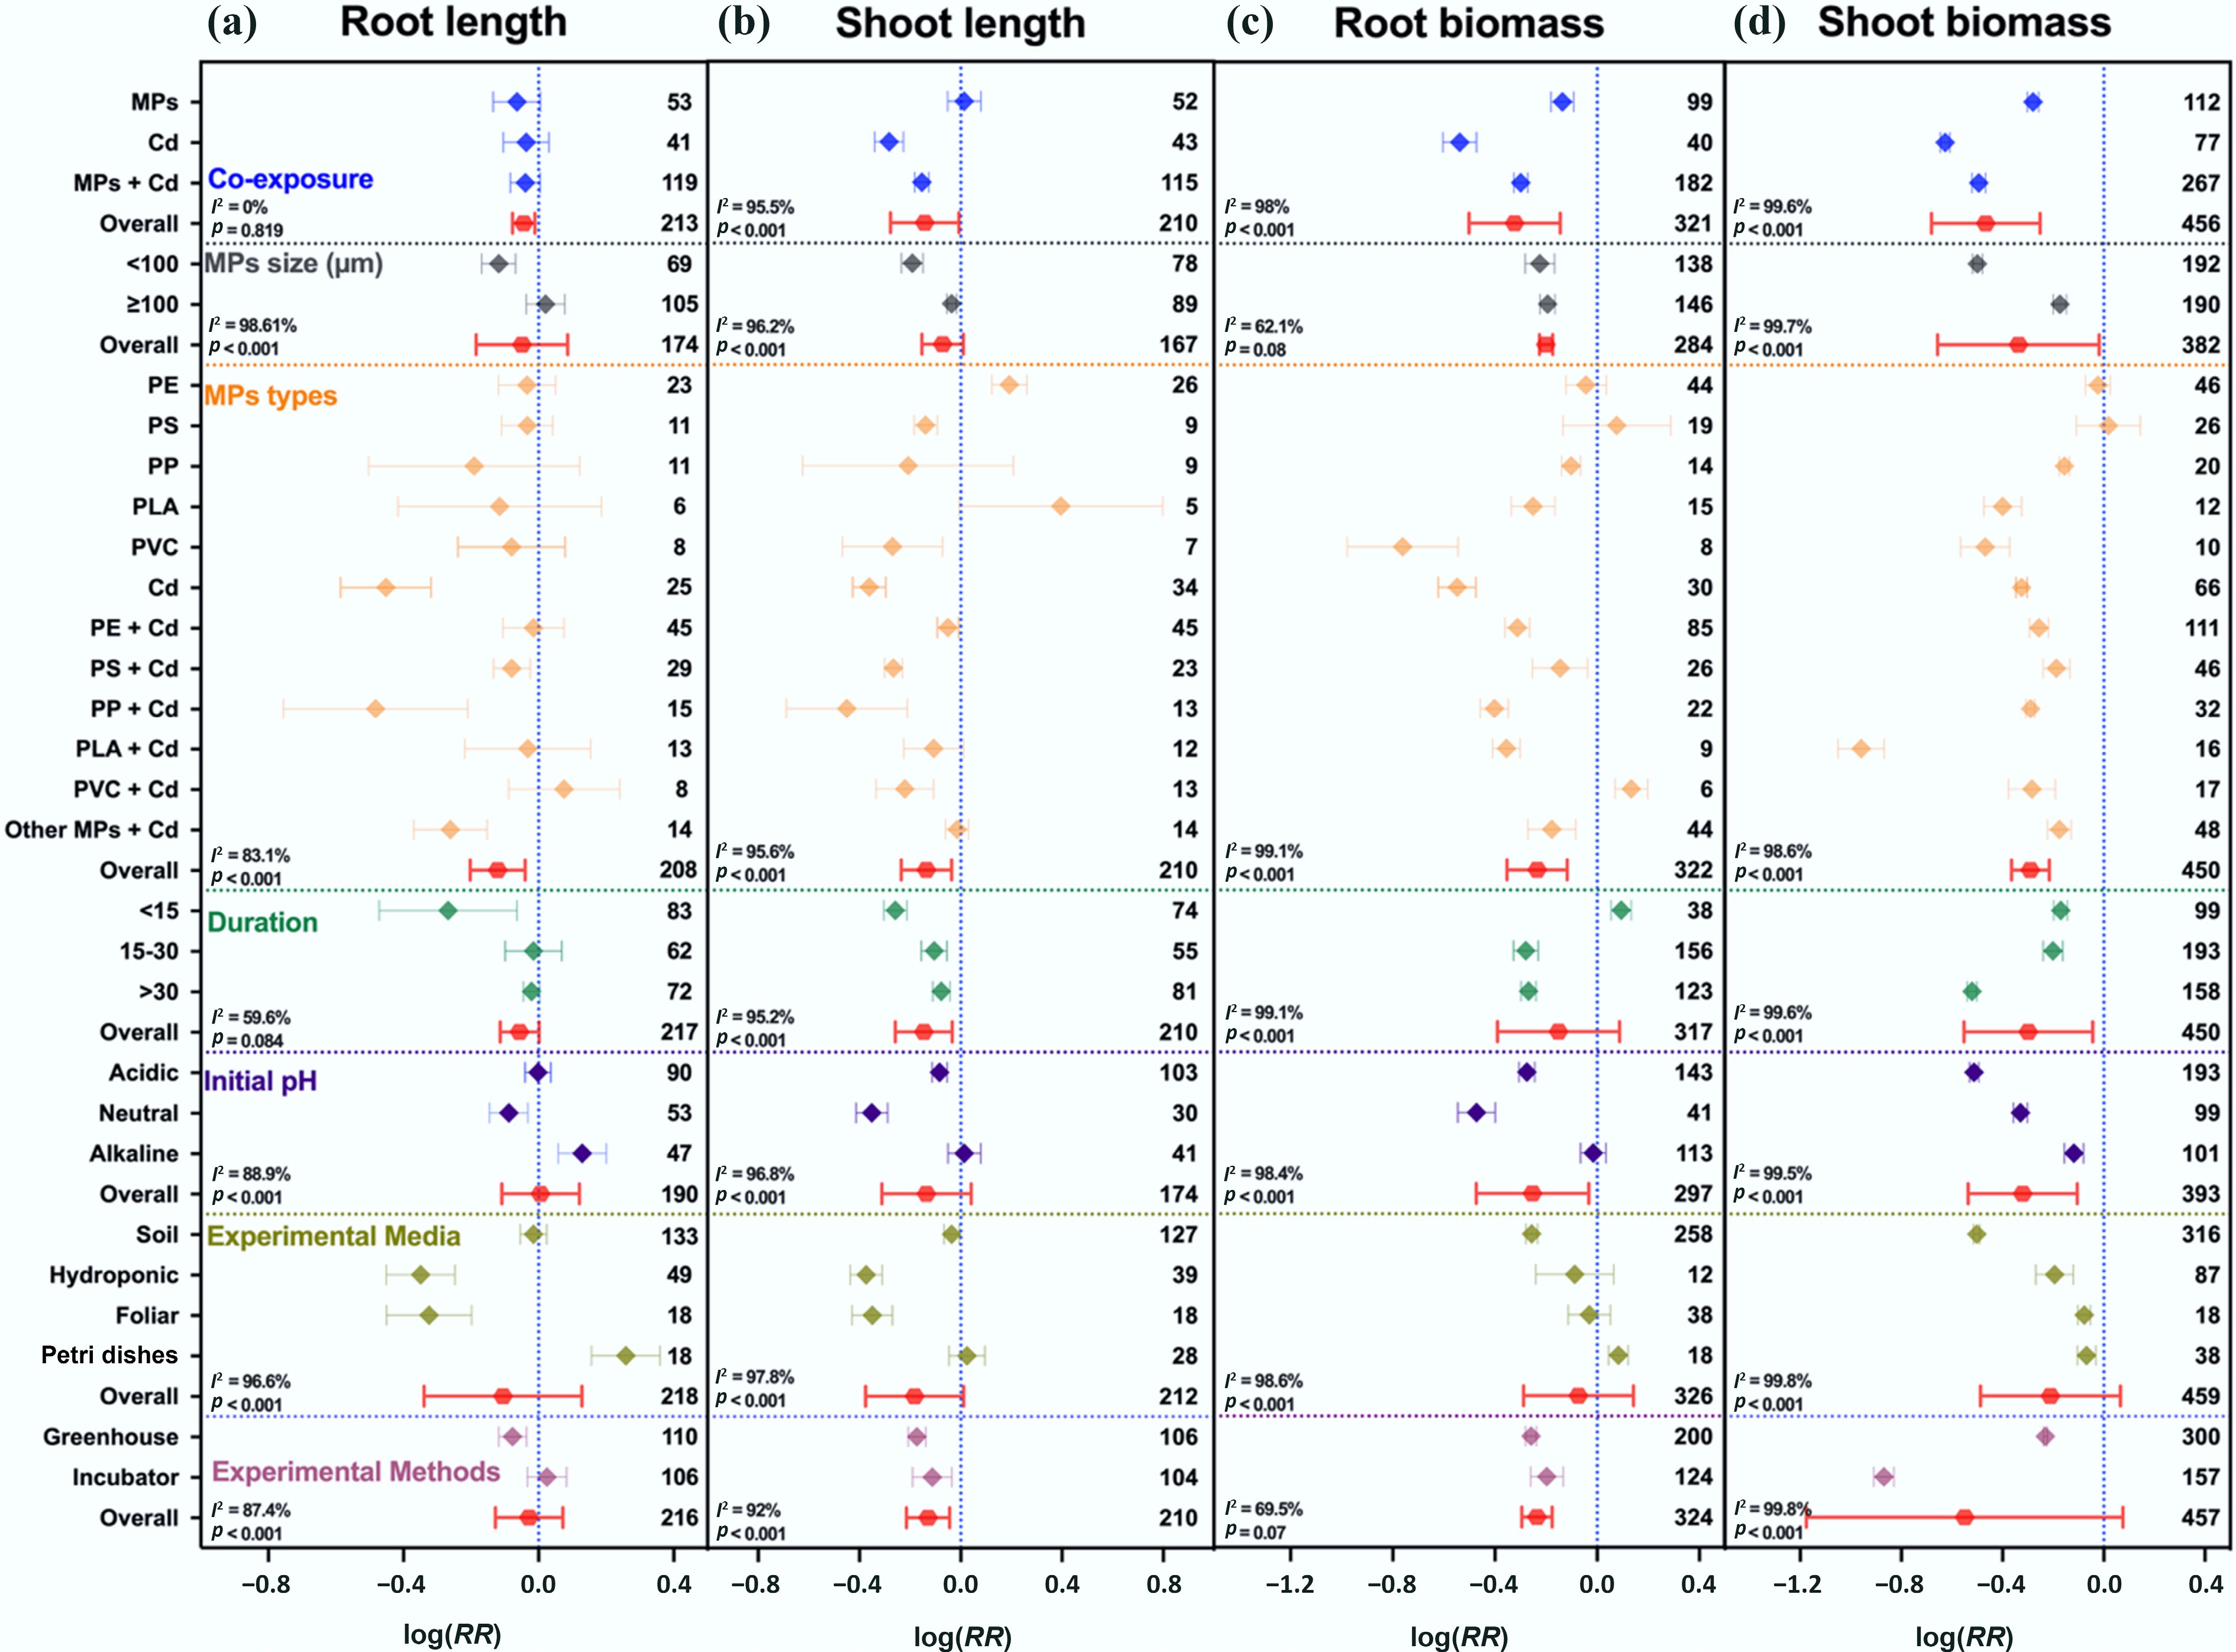
Figure 2.
Interactive effects of MPs, Cd, and co-exposures on plant morphological traits. (a) Root length, (b) shoot length, (c) root biomass, and (d) shoot biomass. Values are the mean effect size ± 95% CI. The right sidebar has a positive effect, the left side has a negative effect, and the bar overlapping zero indicates that the effect is not significant for each plot. Response ratios are arranged by exposure type, MP particle size, polymer types, stress exposure duration, initial media pH, growth media, and experimental methods, which are classified by different colors. In each plot, the number associated with each data point represents the number of pairwise observations. For each plot (a)–(d), color represents different groups of the meta-analytical model effect: blue (single and co-exposure of MPs and Cd), gray (MP size in µm), orange (polymer types), green (duration in days), purple (initial media pH), indigo (growth media), maroon (experimental methods), and red indicates the overall effect across groups.
-
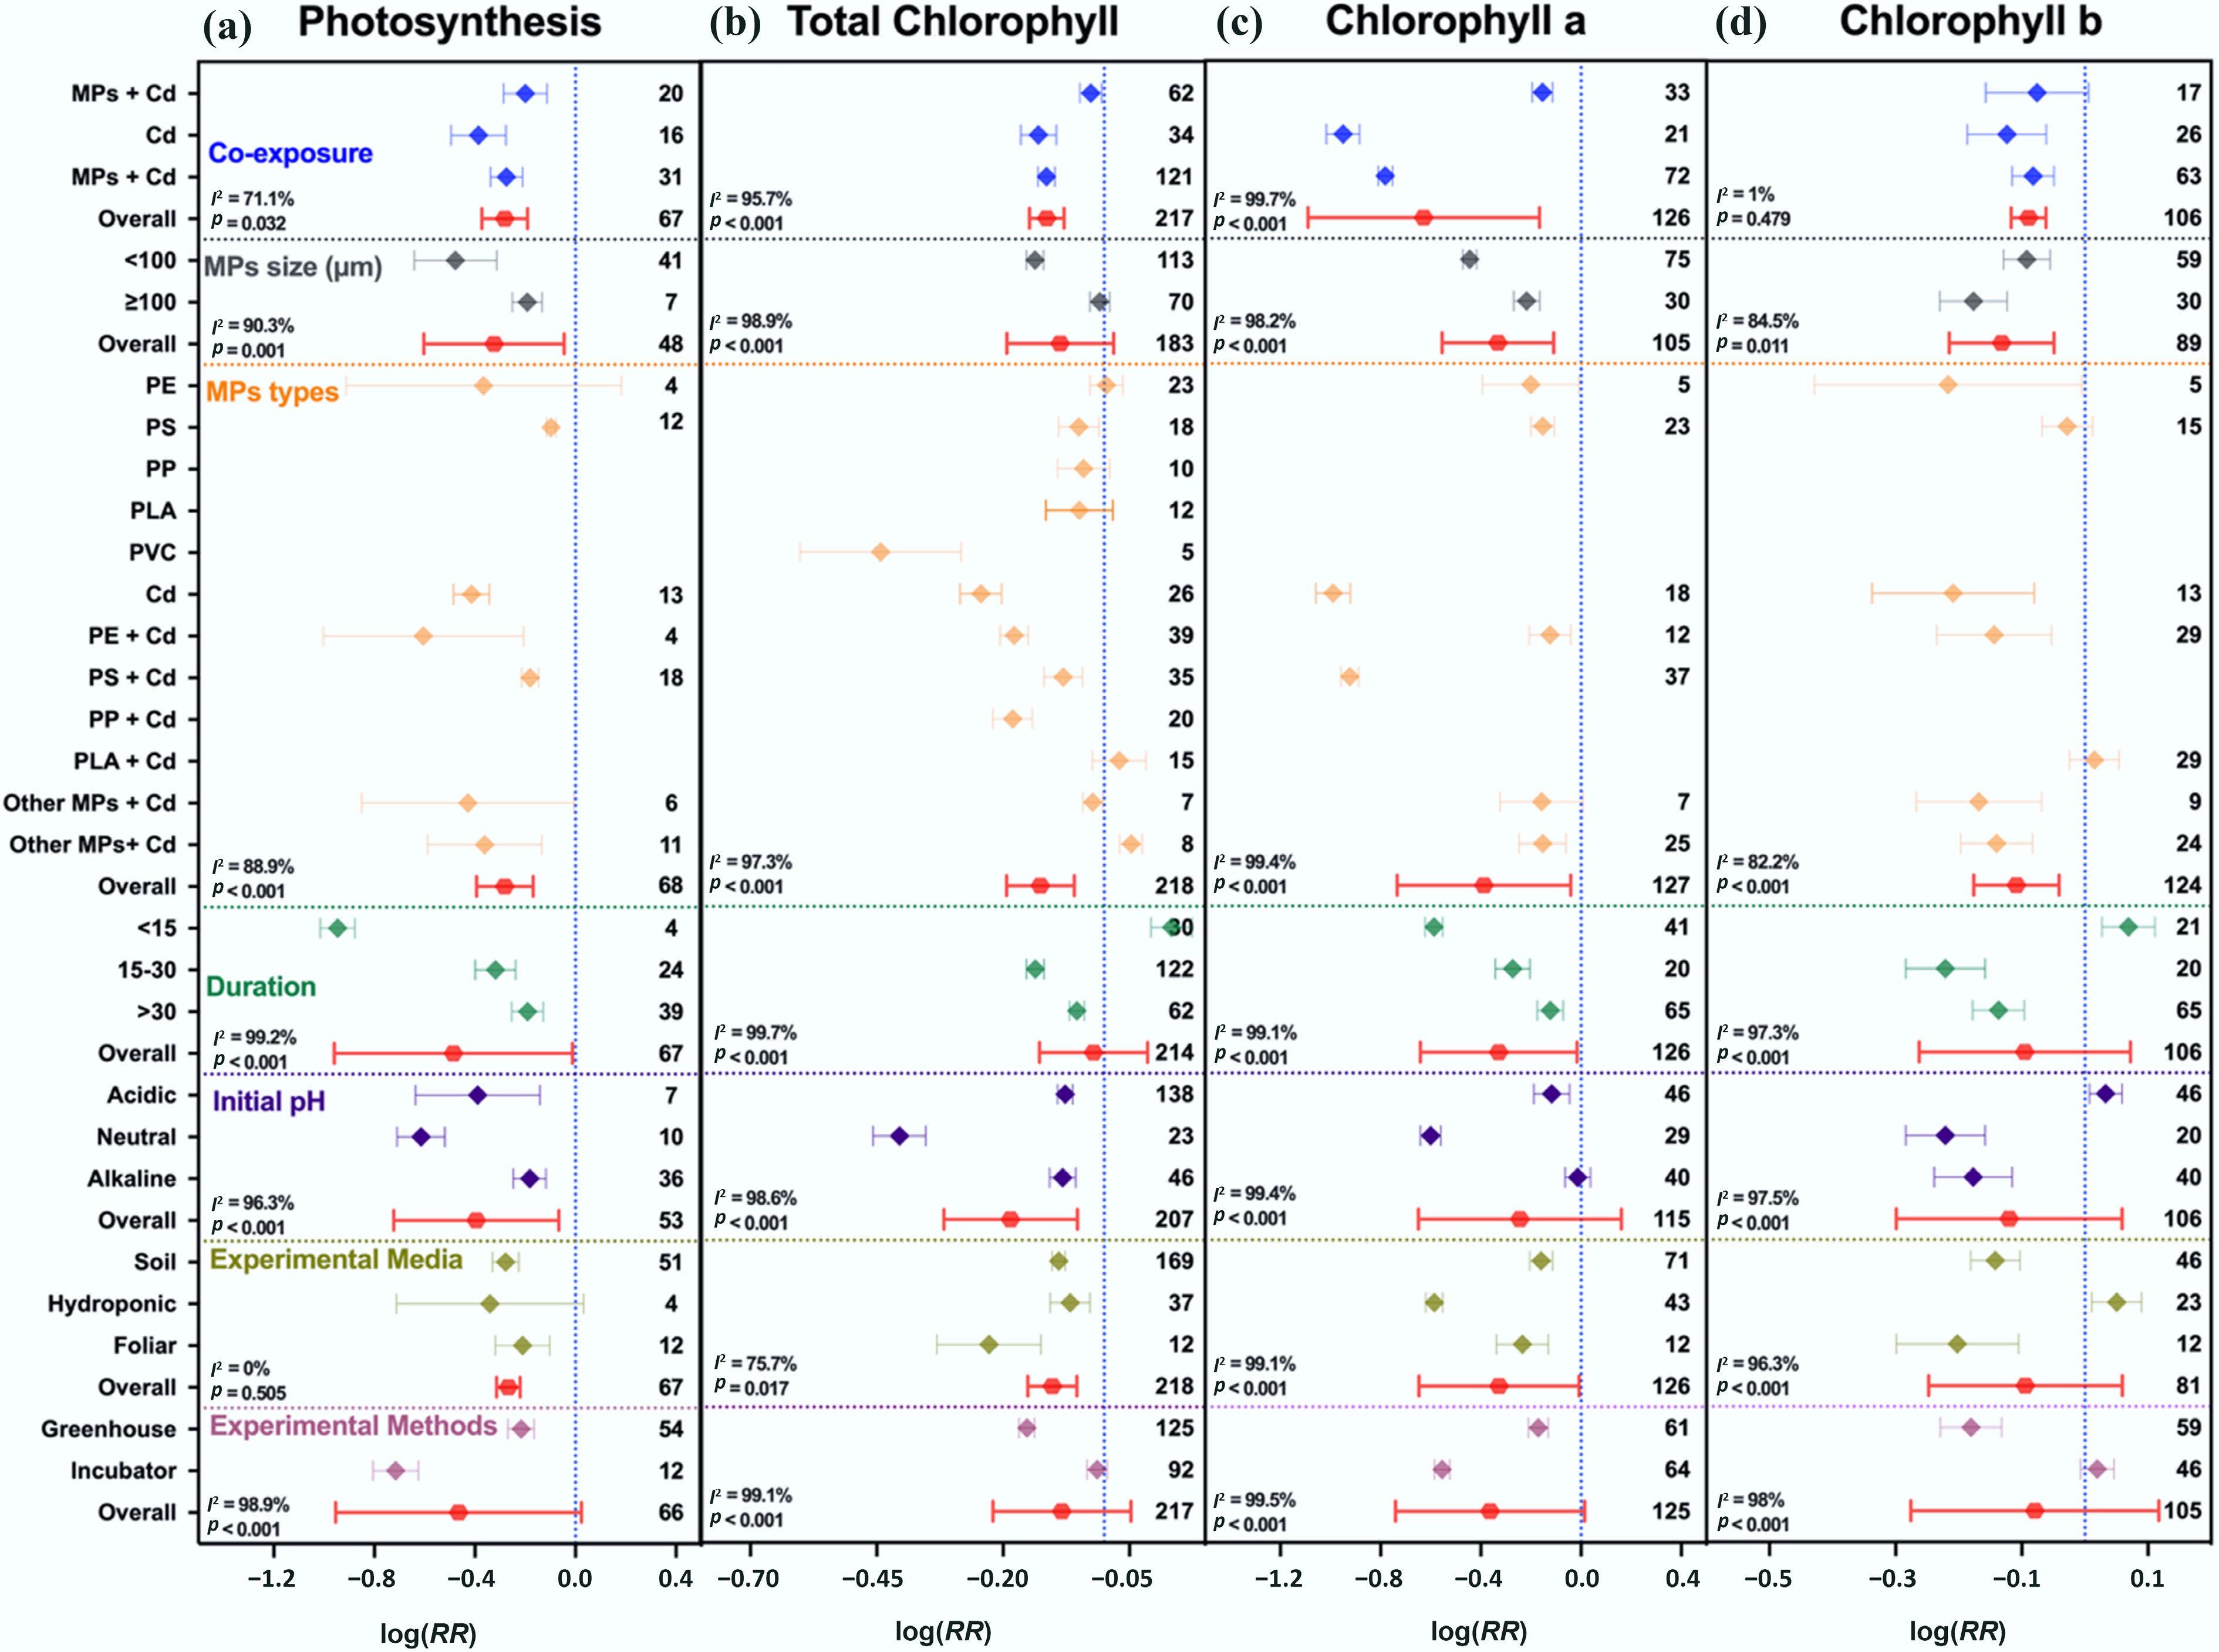
Figure 3.
Responses of plant photosynthetic traits to single and co-exposure of MPs and Cd. (a) Photosynthetic rate, (b) total chlorophyll, (c) chlorophyll a, and (d) chlorophyll b. Values are the mean effect size ± 95% CI. The right sidebar has a positive effect, the left side has a negative effect, and the bar overlapping zero indicates that the effect is not significant for each plot. Response ratios are arranged by exposure type, MPs particle size, polymer types, duration of stress exposure, initial media pH, growth media, and experimental methods, which are classified by different colors. For each plot (a)–(d), color represents different groups of the meta-analytical model effect: blue (single and co-exposure of MPs and Cd), gray (MP size in µm), orange (polymer types), green (duration in days), purple (initial media pH), indigo (growth media), maroon (experimental methods), and red indicates the overall effect across groups.
-
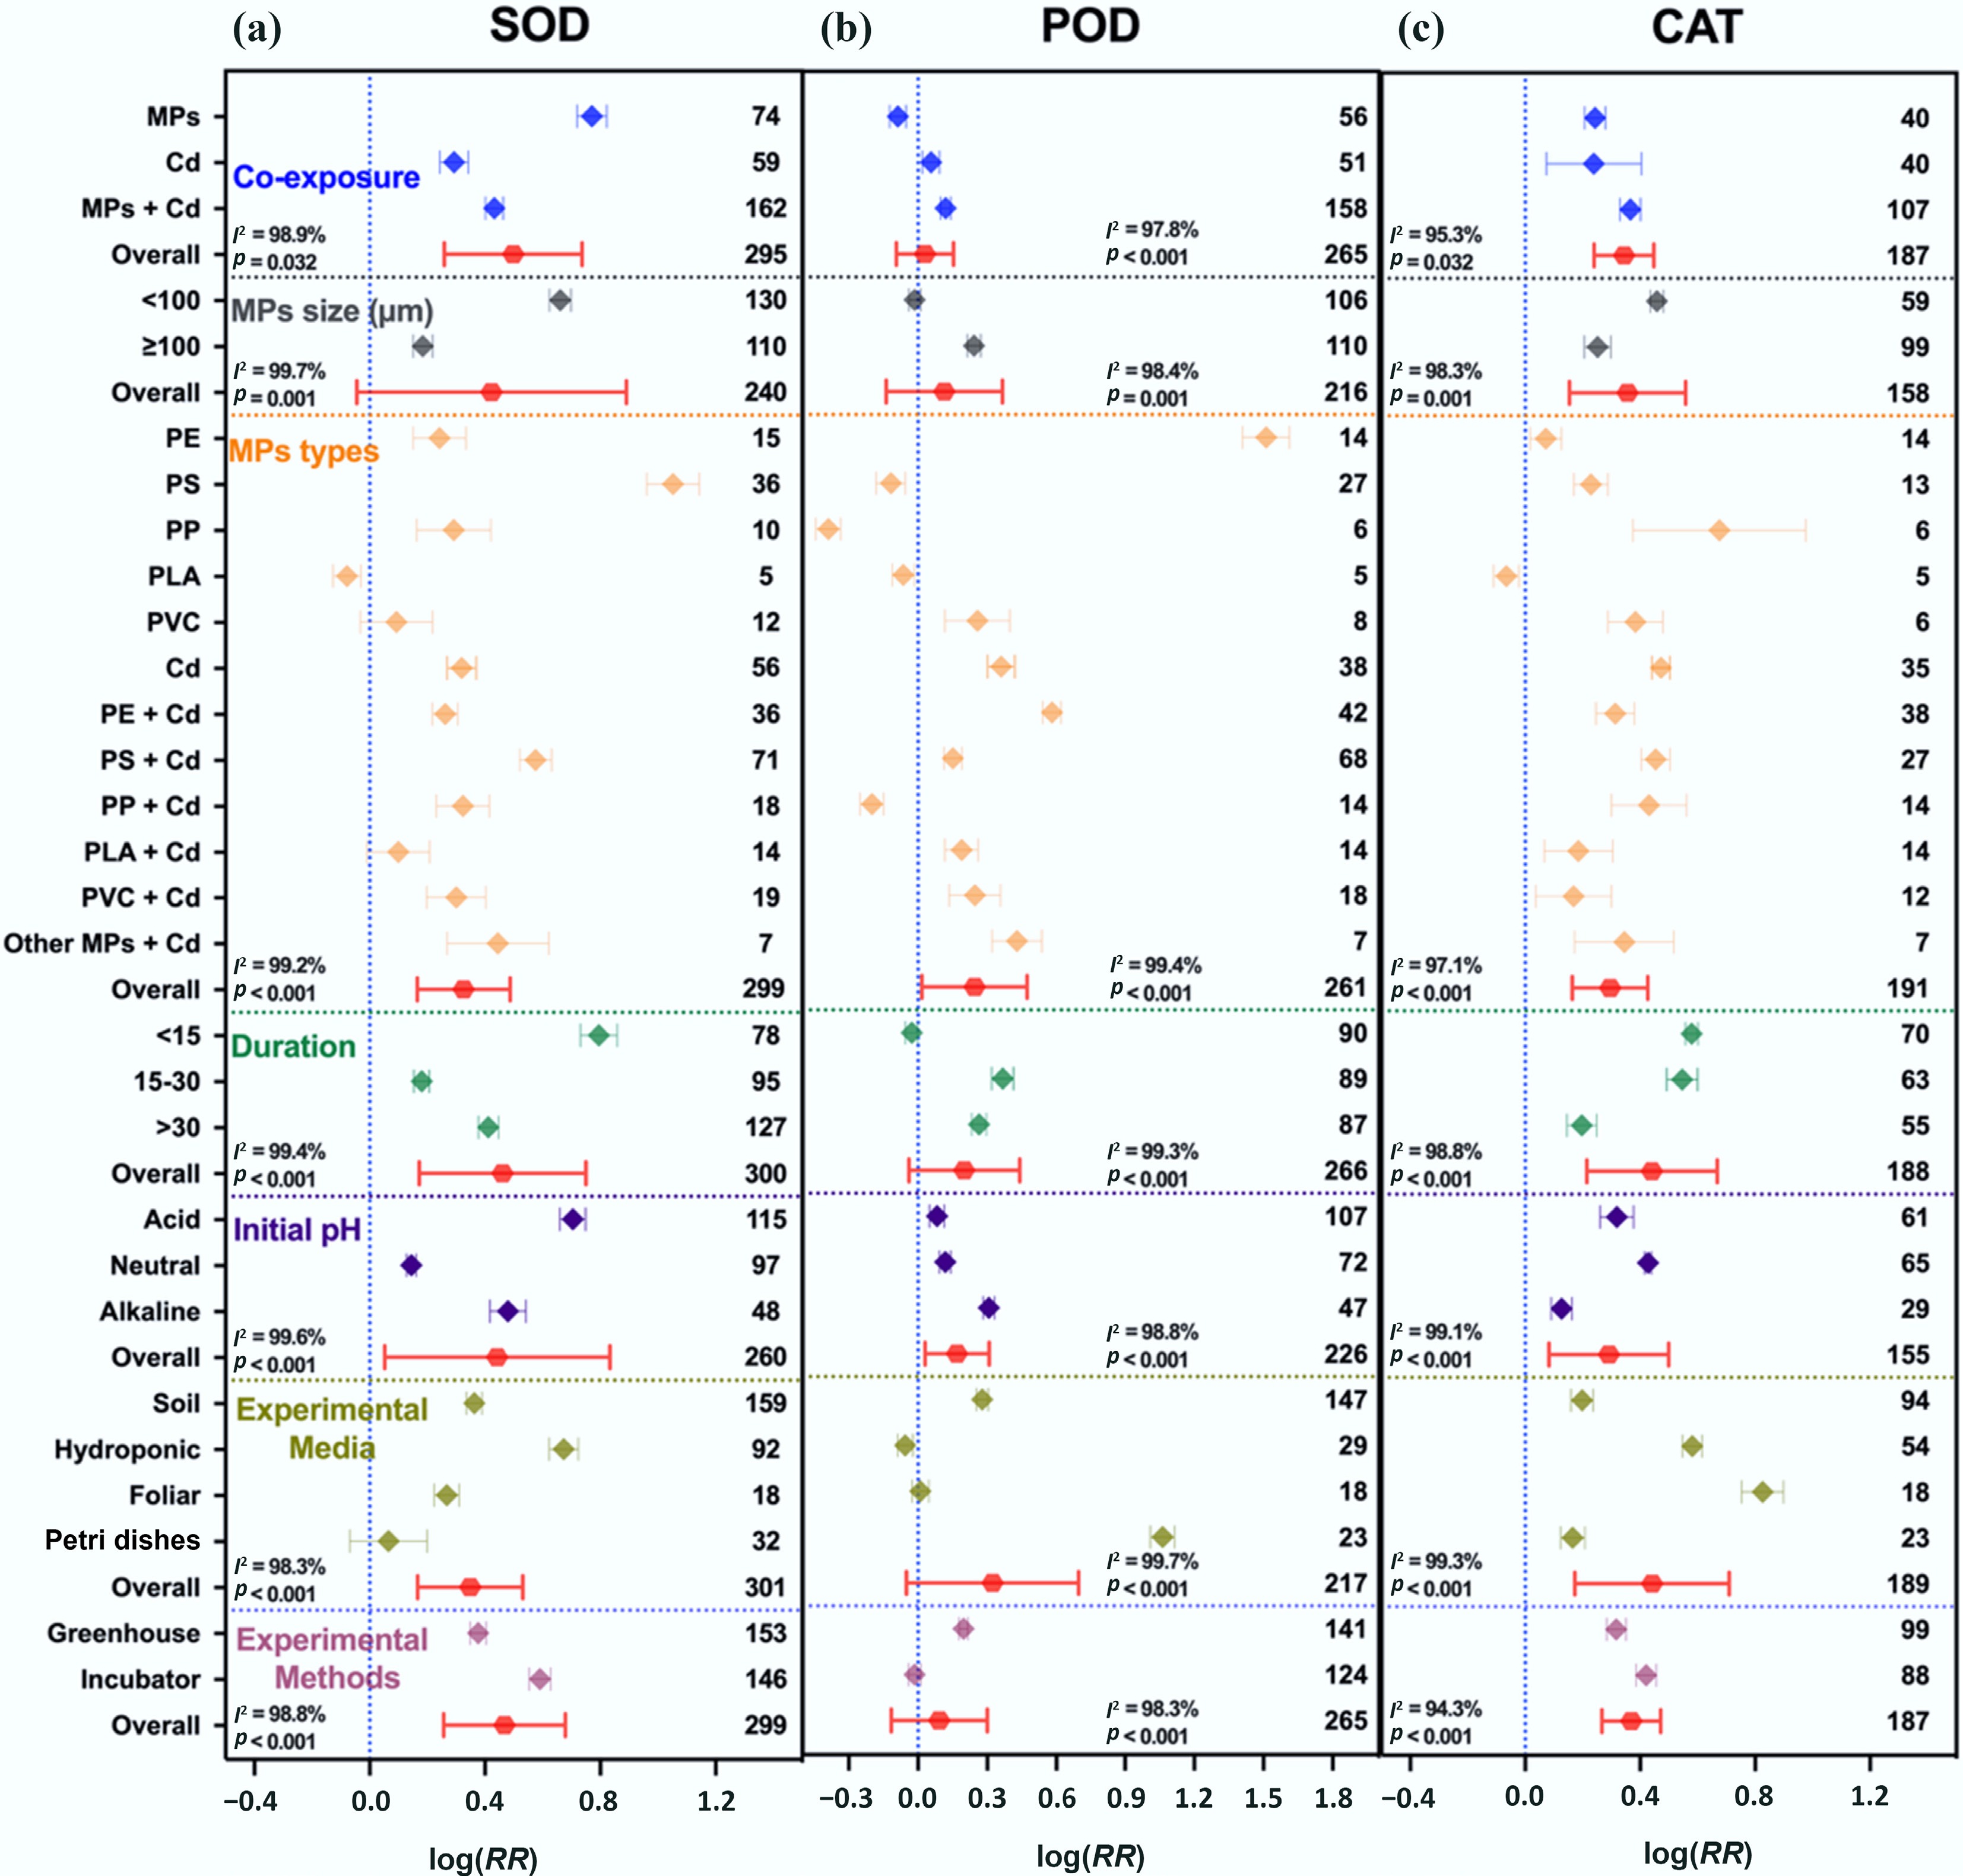
Figure 4.
Single and co-exposure of MPs and Cd modulate the antioxidant enzymatic activities. (a) Superoxide dismutase (SOD), (b) peroxidase (POD), and (c) catalase (CAT). Values are the mean effect size ± 95% CI. The right sidebar has a positive effect, the left side has a negative effect, and the bar overlapping zero indicates that the effect is not significant for each plot. Response ratios are arranged by exposure type, MP particle size, polymer types, duration of stress exposure, initial media pH, growth media, and experimental methods, which are classified by different colors. For each plot (a)–(c), color represents different groups of the meta-analytical model effect: blue (single and co-exposure of MPs and Cd), gray (MP size in µm), orange (polymer types), green (duration in days), purple (initial media pH), indigo (growth media), maroon (experimental methods), and red indicates the overall effect across groups.
-
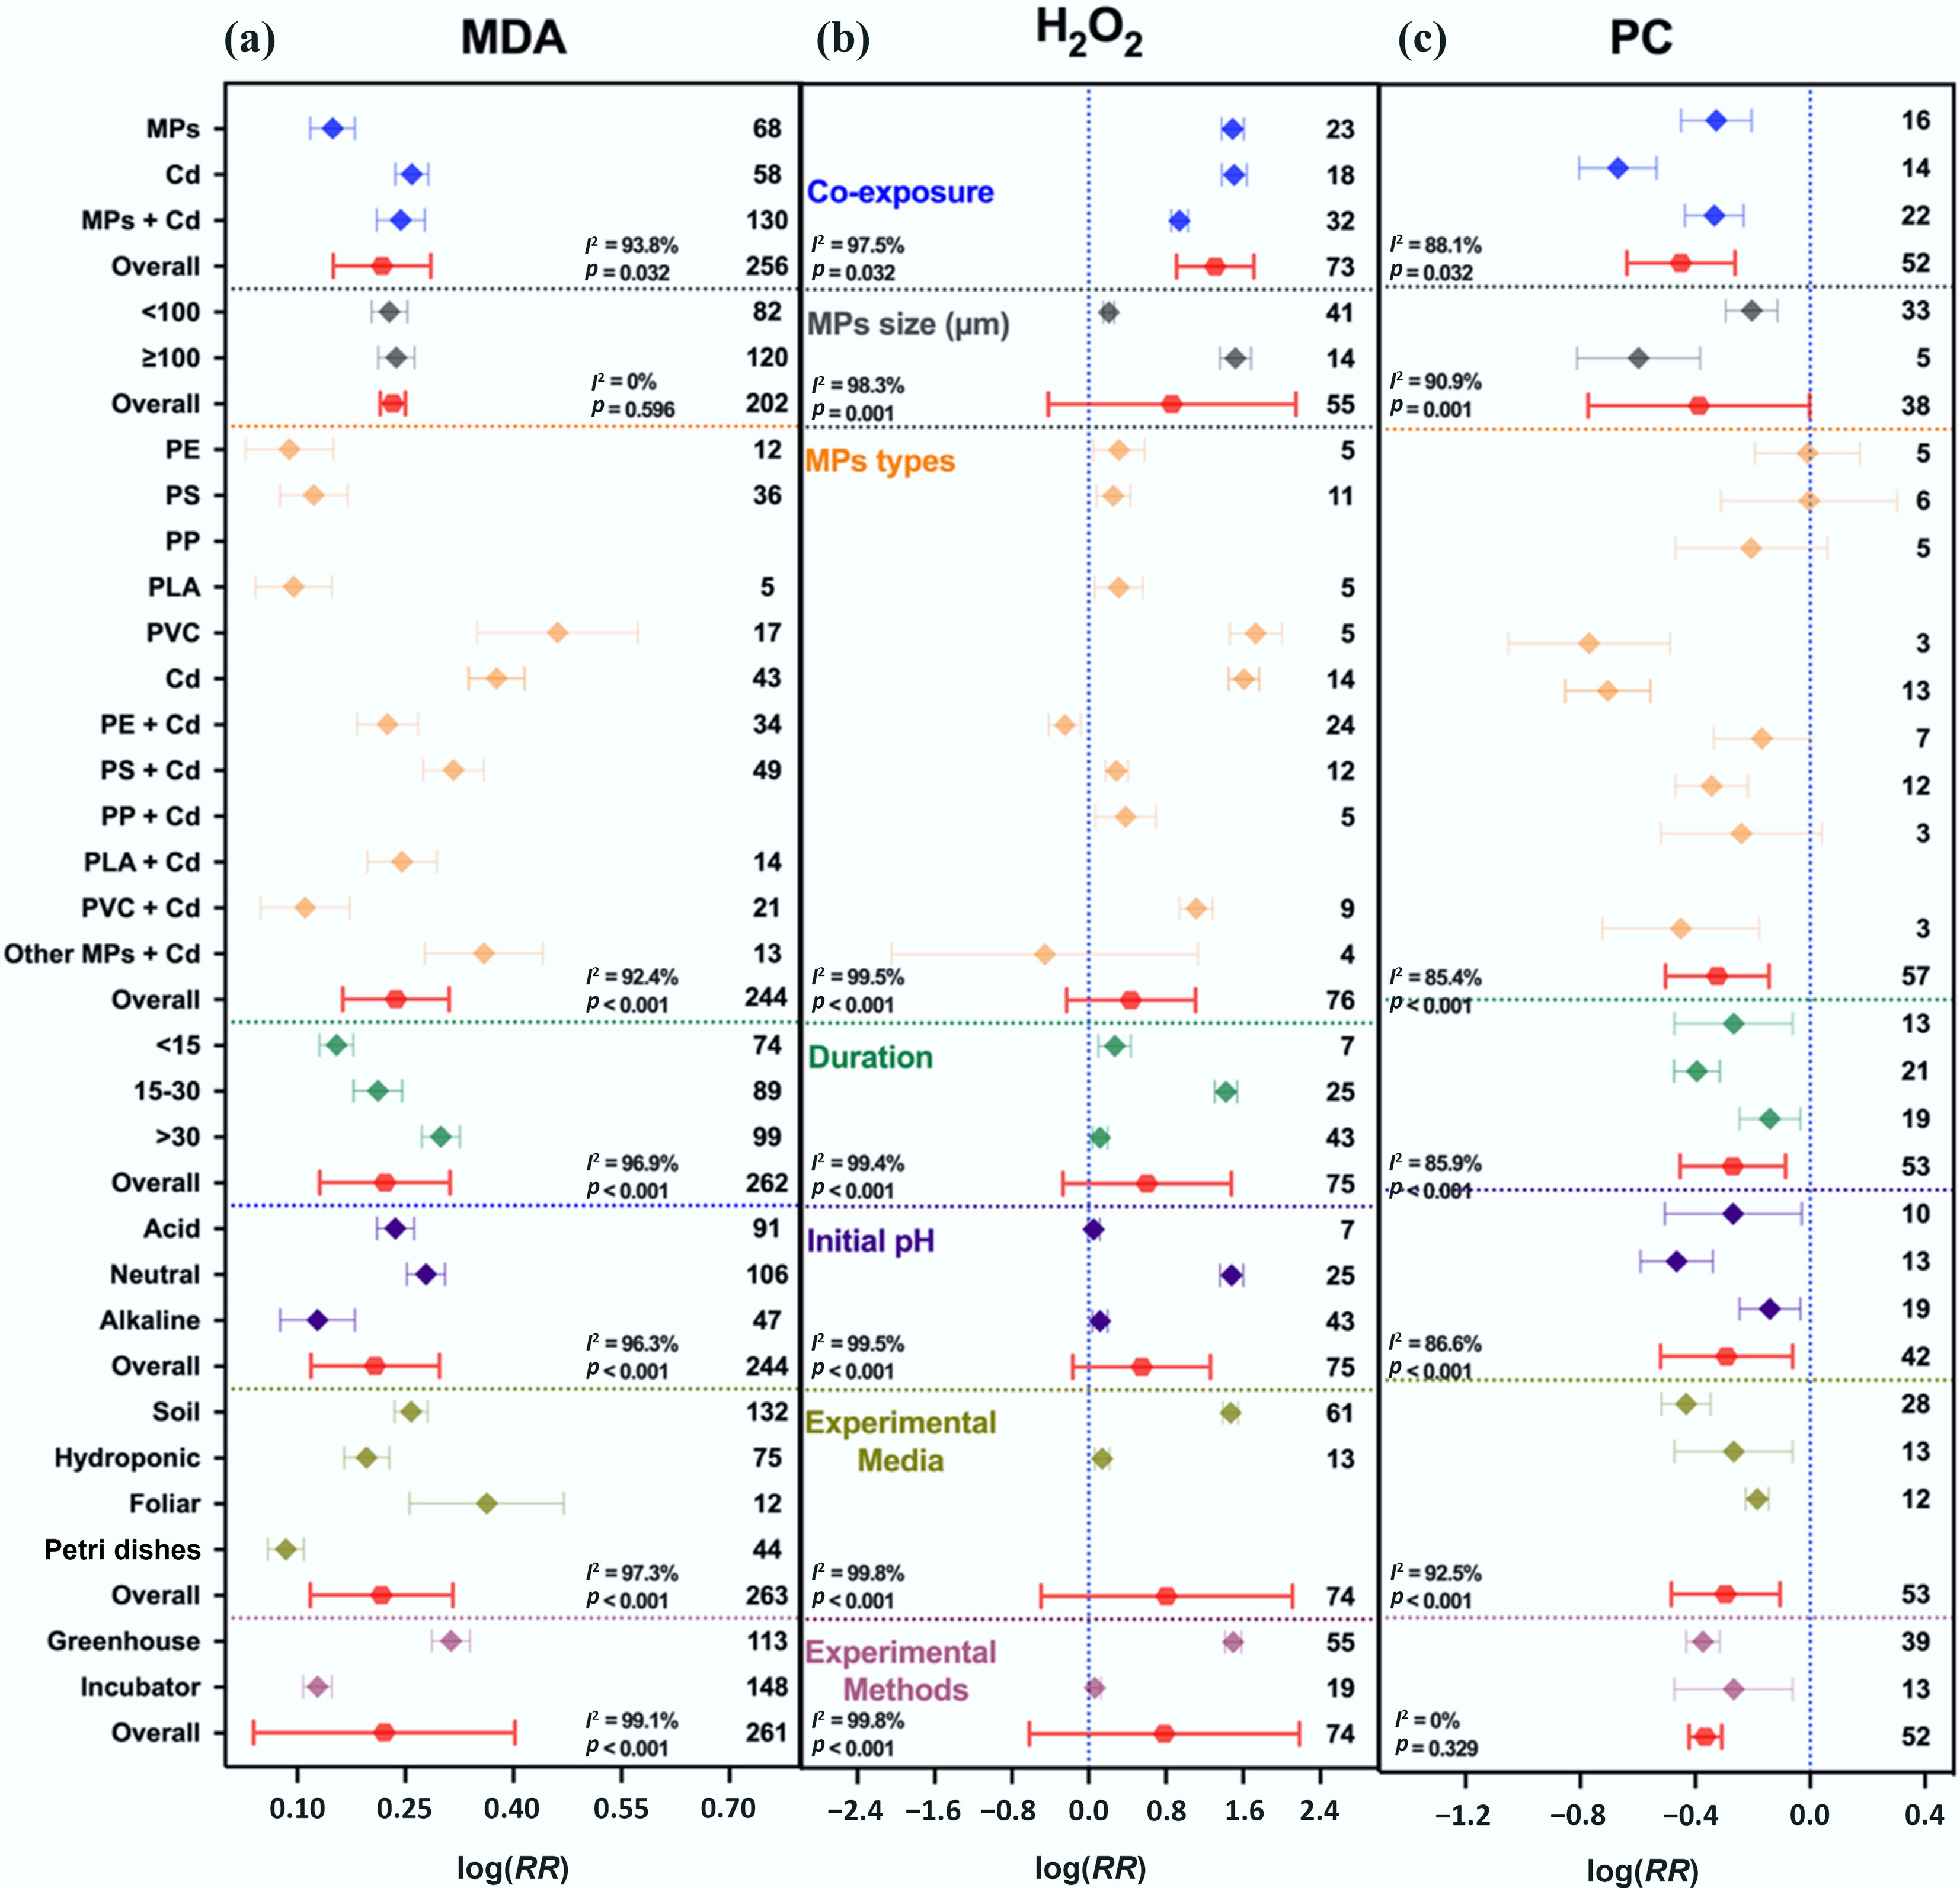
Figure 5.
Responses of oxidative enzymes and protein contents to MPs, Cd, and their co-exposure. (a) Malondialdehyde (MDA), (b) hydrogen peroxide (H2O2), and (c) protein contents (PC). Values are the mean effect size ± 95% CI. The right sidebar has a positive effect, the left side has a negative effect, and the bar overlapping zero indicates that the effect is not significant for each plot. Response ratios are arranged by exposure type, MP particle size, polymer types, duration of stress exposure, initial media pH, growth media, and experimental methods, which are classified by different colors. For each plot (a)–(c), color represents different groups of the meta-analytical model effect: blue (single and co-exposure of MPs and Cd), gray (MP size in µm), orange (polymer types), green (duration in days), purple (initial media pH), indigo (growth media), maroon (experimental methods), and red indicates the overall effect across groups.
-
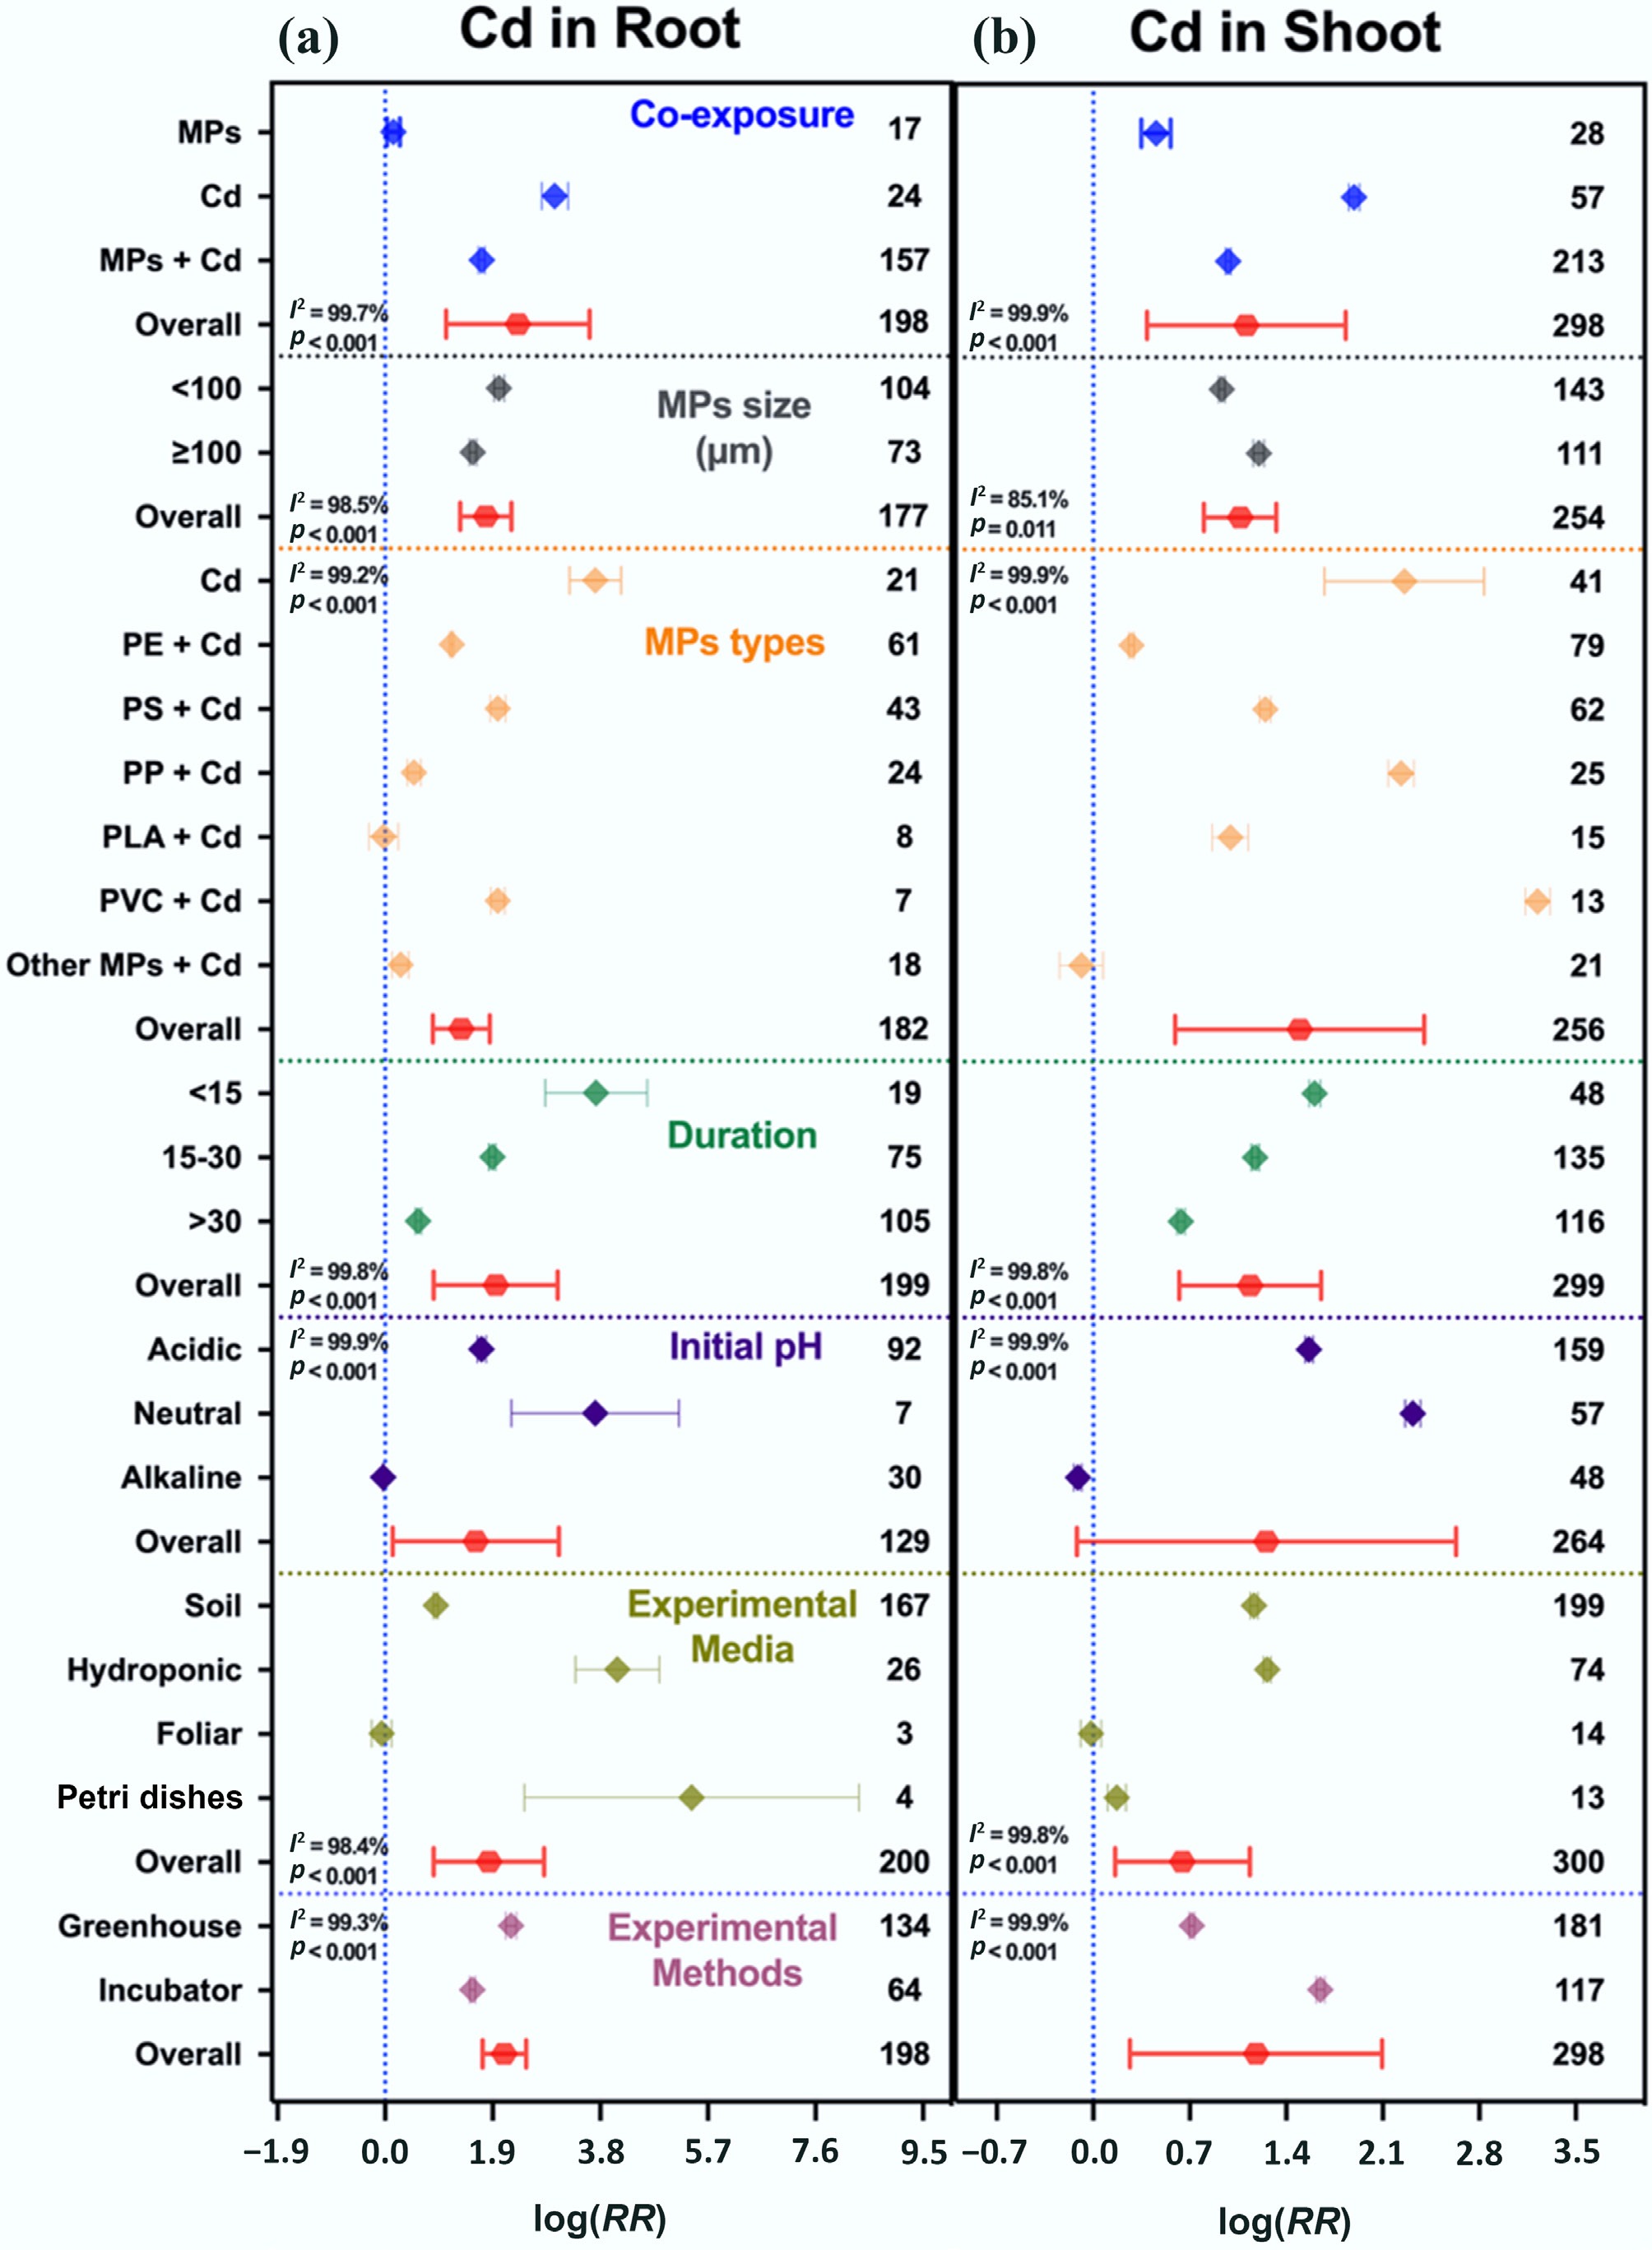
Figure 6.
Cd accumulation in plants under single and co-exposure of MPs and Cd. (a) Cd accumulation in roots, and (b) Cd accumulation in shoots. Values are the mean effect size ± 95% CI. The right sidebar has a positive effect, the left side has a negative effect, and the bar overlapping zero indicates that the effect is not significant for each plot. Response ratios are arranged by exposure type, MP particle size, polymer types, duration of stress exposure, initial media pH, growth media, and experimental methods, which are classified by different colors. For each plot (a), (b), color represents different groups of the meta-analytical model effect: blue (single and co-exposure of MPs and Cd), gray (MP size in µm), orange (polymer types), green (duration in days), purple (initial media pH), indigo (growth media), maroon (experimental methods), and red indicates the overall effect across groups.
-
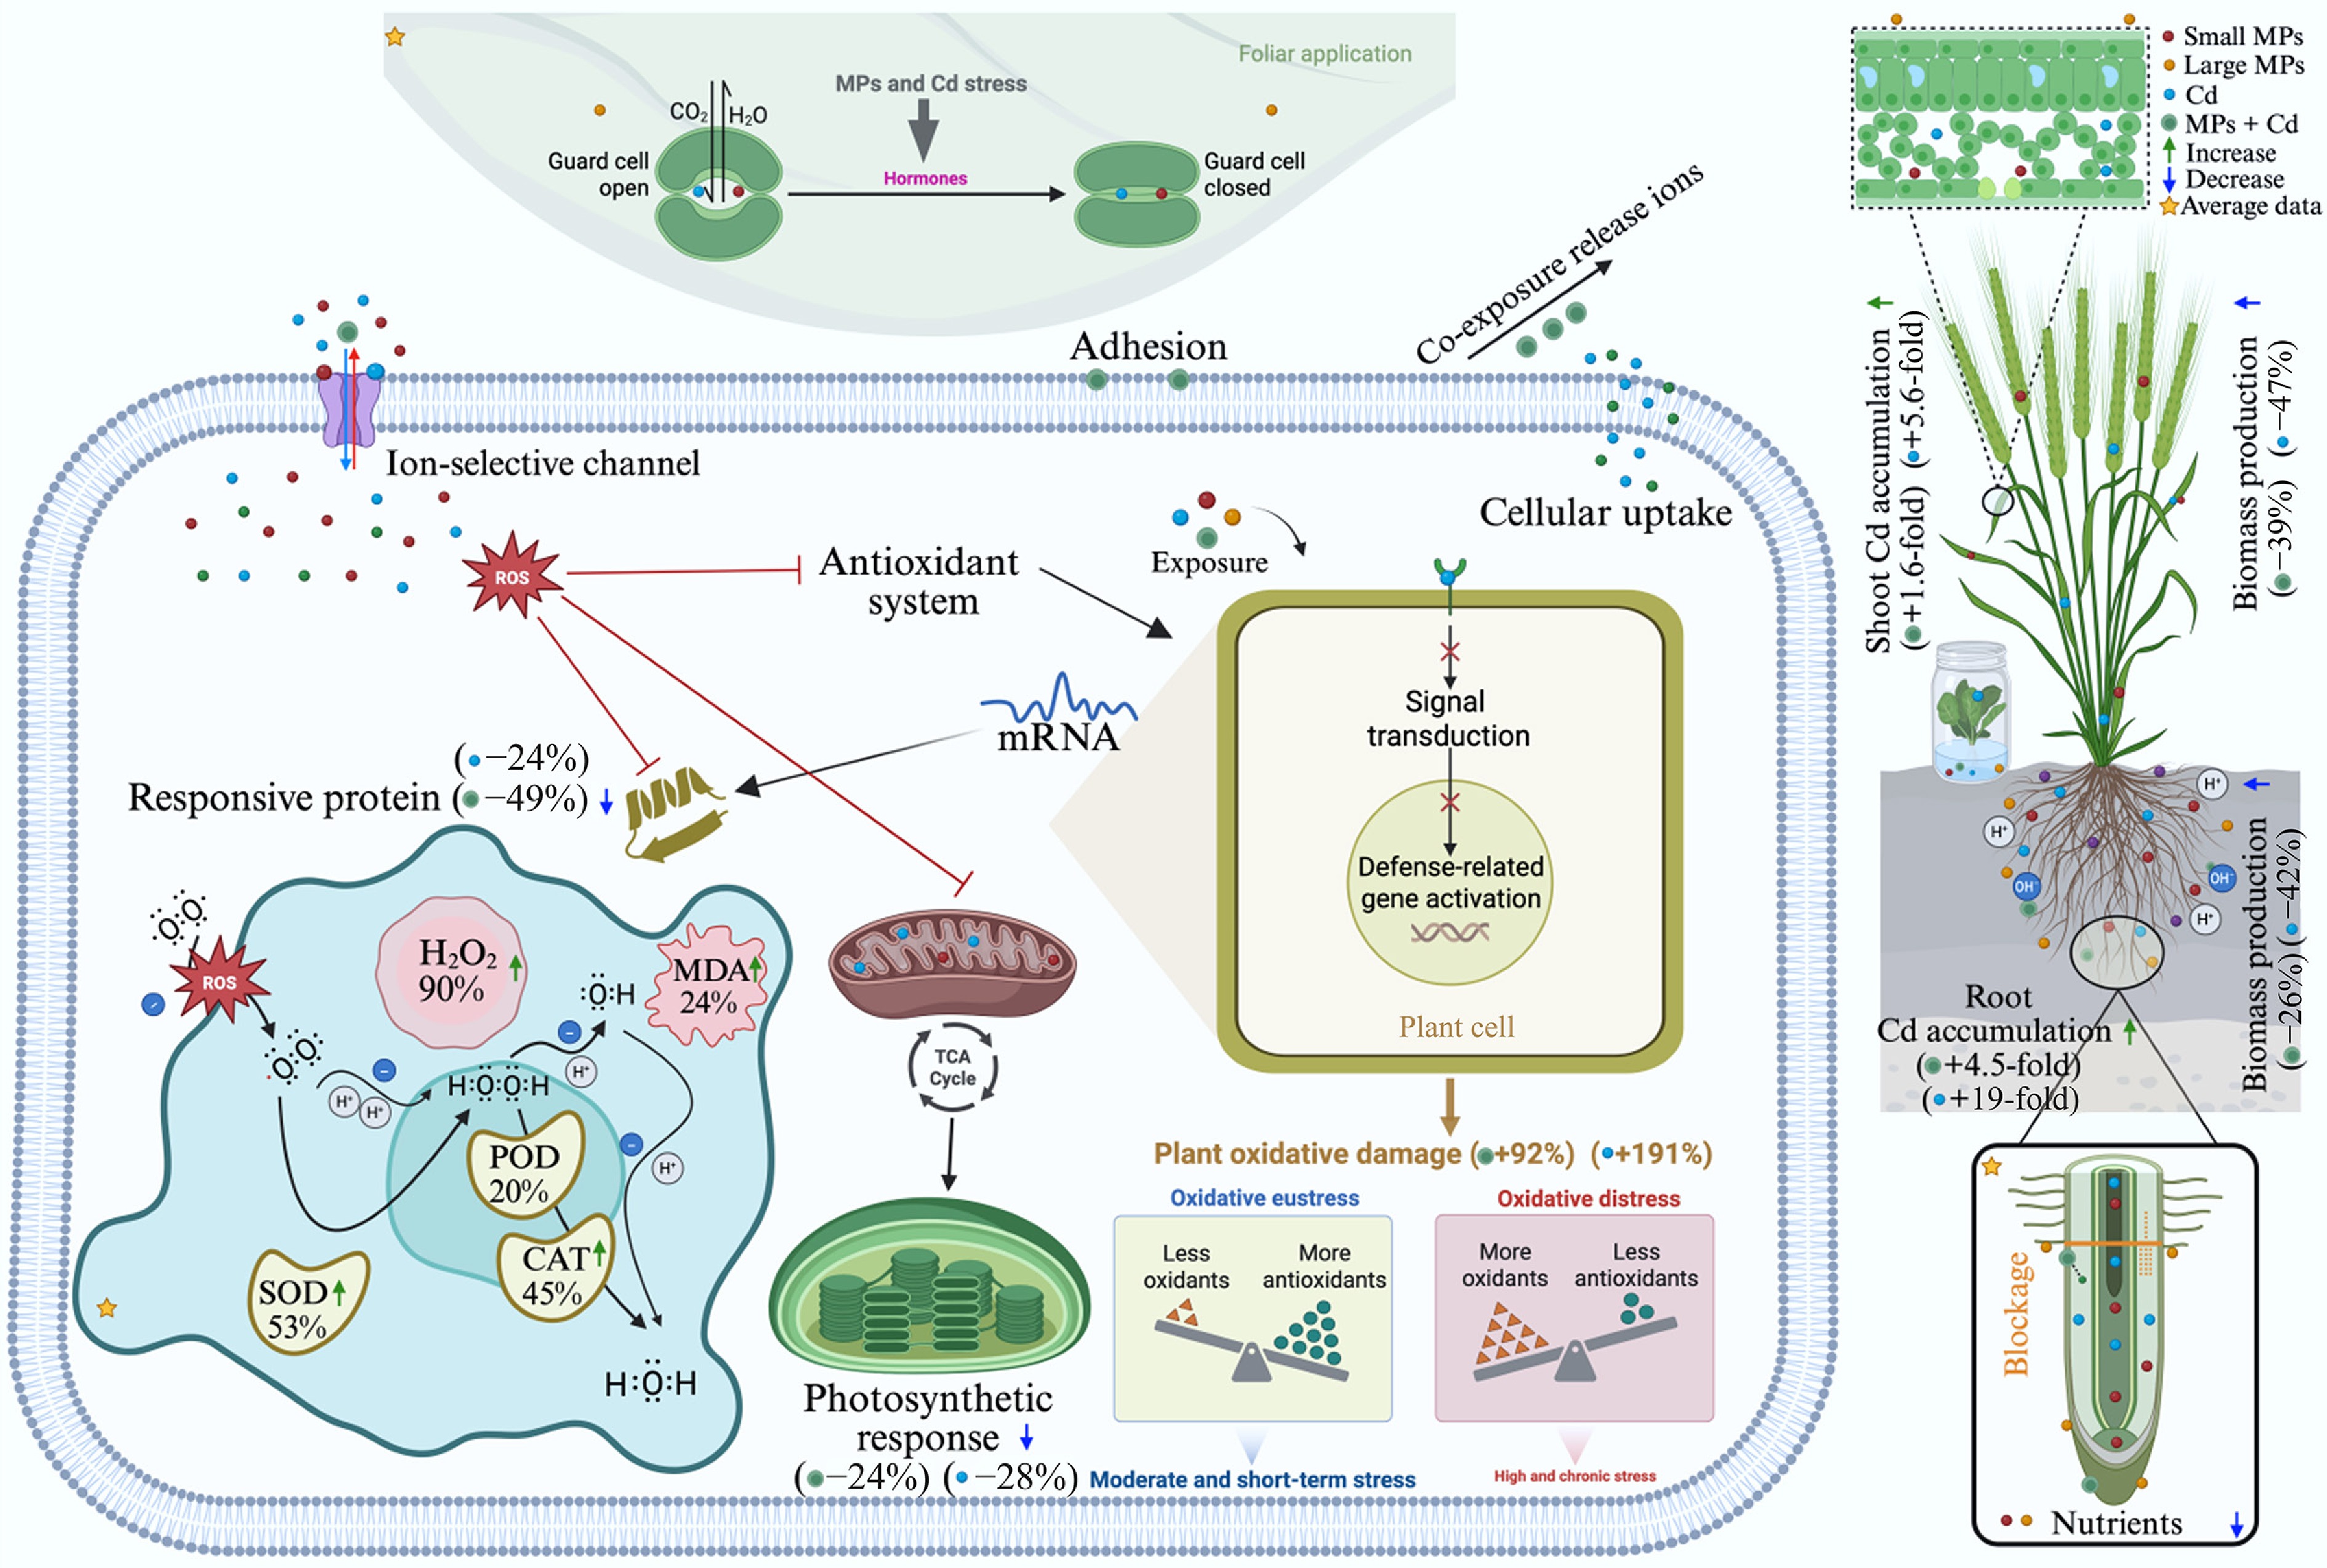
Figure 7.
Mechanisms of MPs and Cd effects on plant growth, photosynthetic performance, Cd uptake and translocation in crop systems, and plant defensive actions against single and co-exposure stresses. Cd can enter plants through both root and above-ground tissues. MPs and soil particles cause physical blockage and adsorption, which may influence plants' uptake and translocation of Cd and nutrients. Plant defense systems mainly involve antioxidant enzymes, such as superoxide dismutase (SOD), catalase (CAT), and peroxidase (POD), along with indicators of oxidative damage (malondialdehyde [MDA] and hydrogen peroxide [H2O2]). The value in parentheses represents the response ratio of observed parameters. Positive and negative values indicate the enhanced or decreased effects on plant response.
-
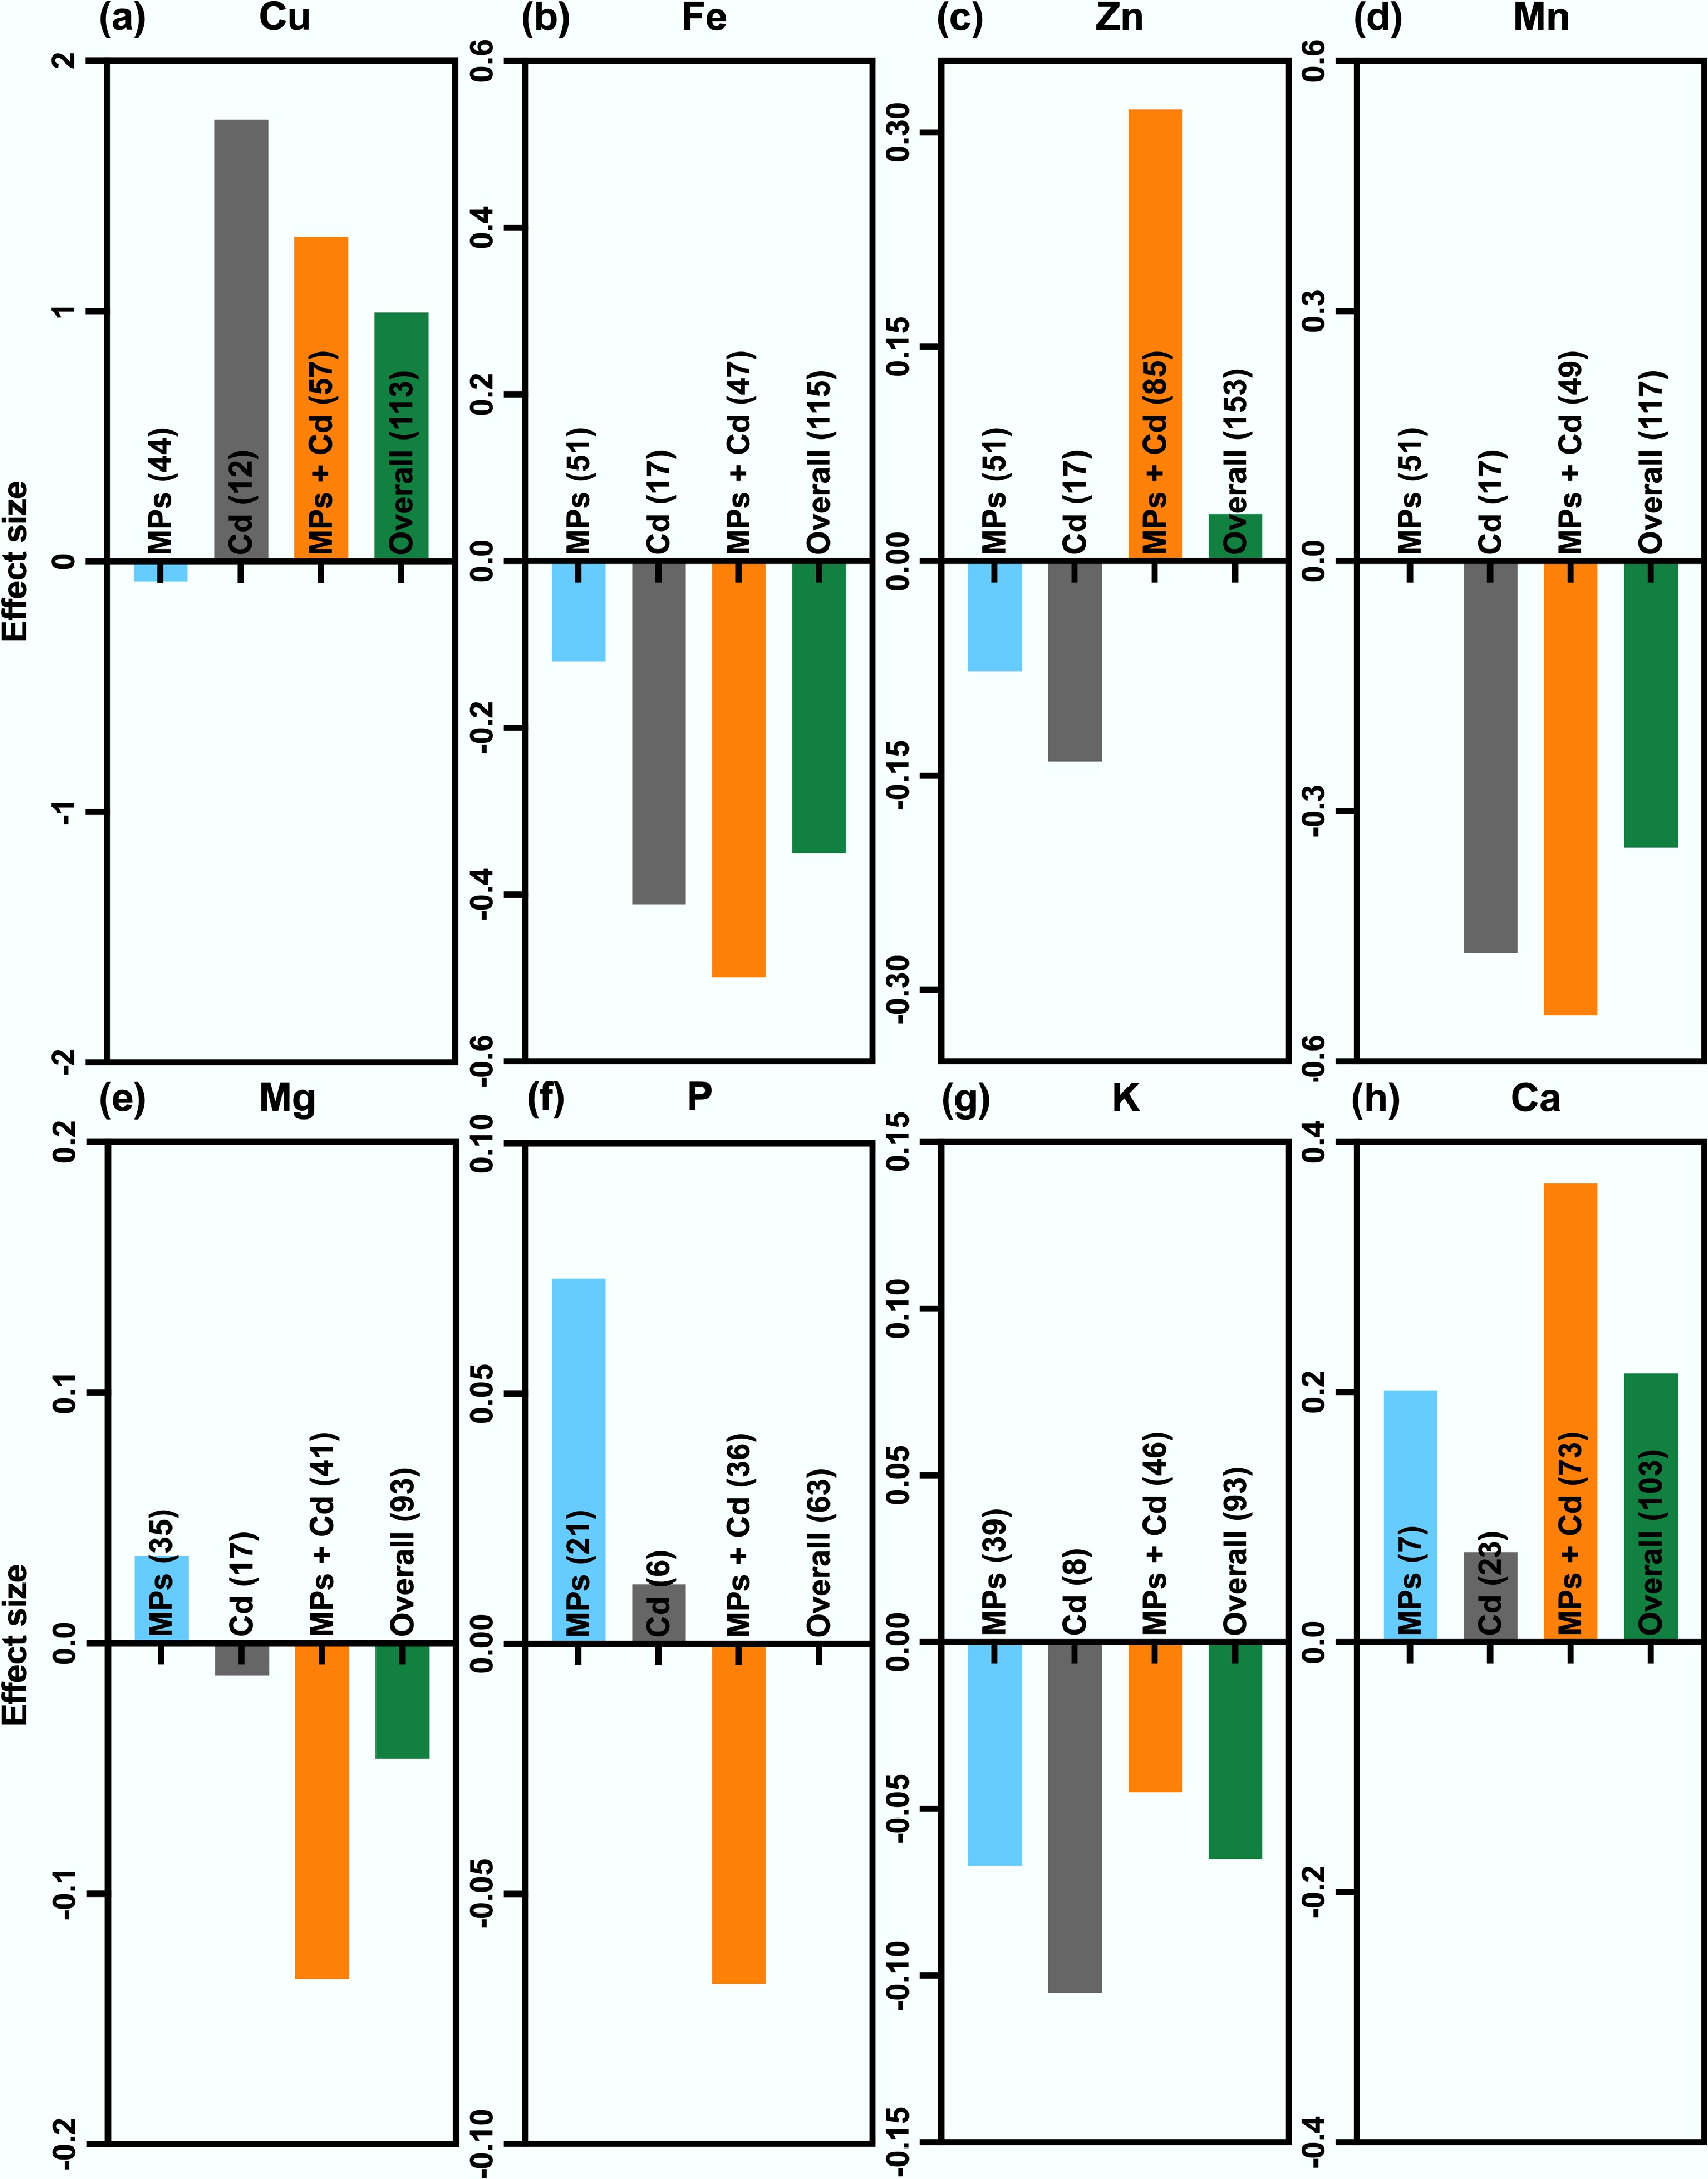
Figure 8.
Meta-analysis of MPs, Cd, and their co-exposure effects on essential plant nutrient uptake. Results are presented for eight mineral nutrients, including: (a) copper (Cu), (b) iron (Fe), (c) zinc (Zn), (d) manganese (Mn), (e) magnesium (Mg), (f) phosphorus (P), (g) potassium (K), and (h) calcium (Ca) under MP exposure (light blue), Cd exposure (gray), and co-exposure of MPs and Cd (orange), along with the overall effect (green). Values represent the mean effect size ± 95% CI. Positive values (above the baseline) indicate enhanced nutrient uptake, while negative (below the baseline) values indicate inhibition.
-
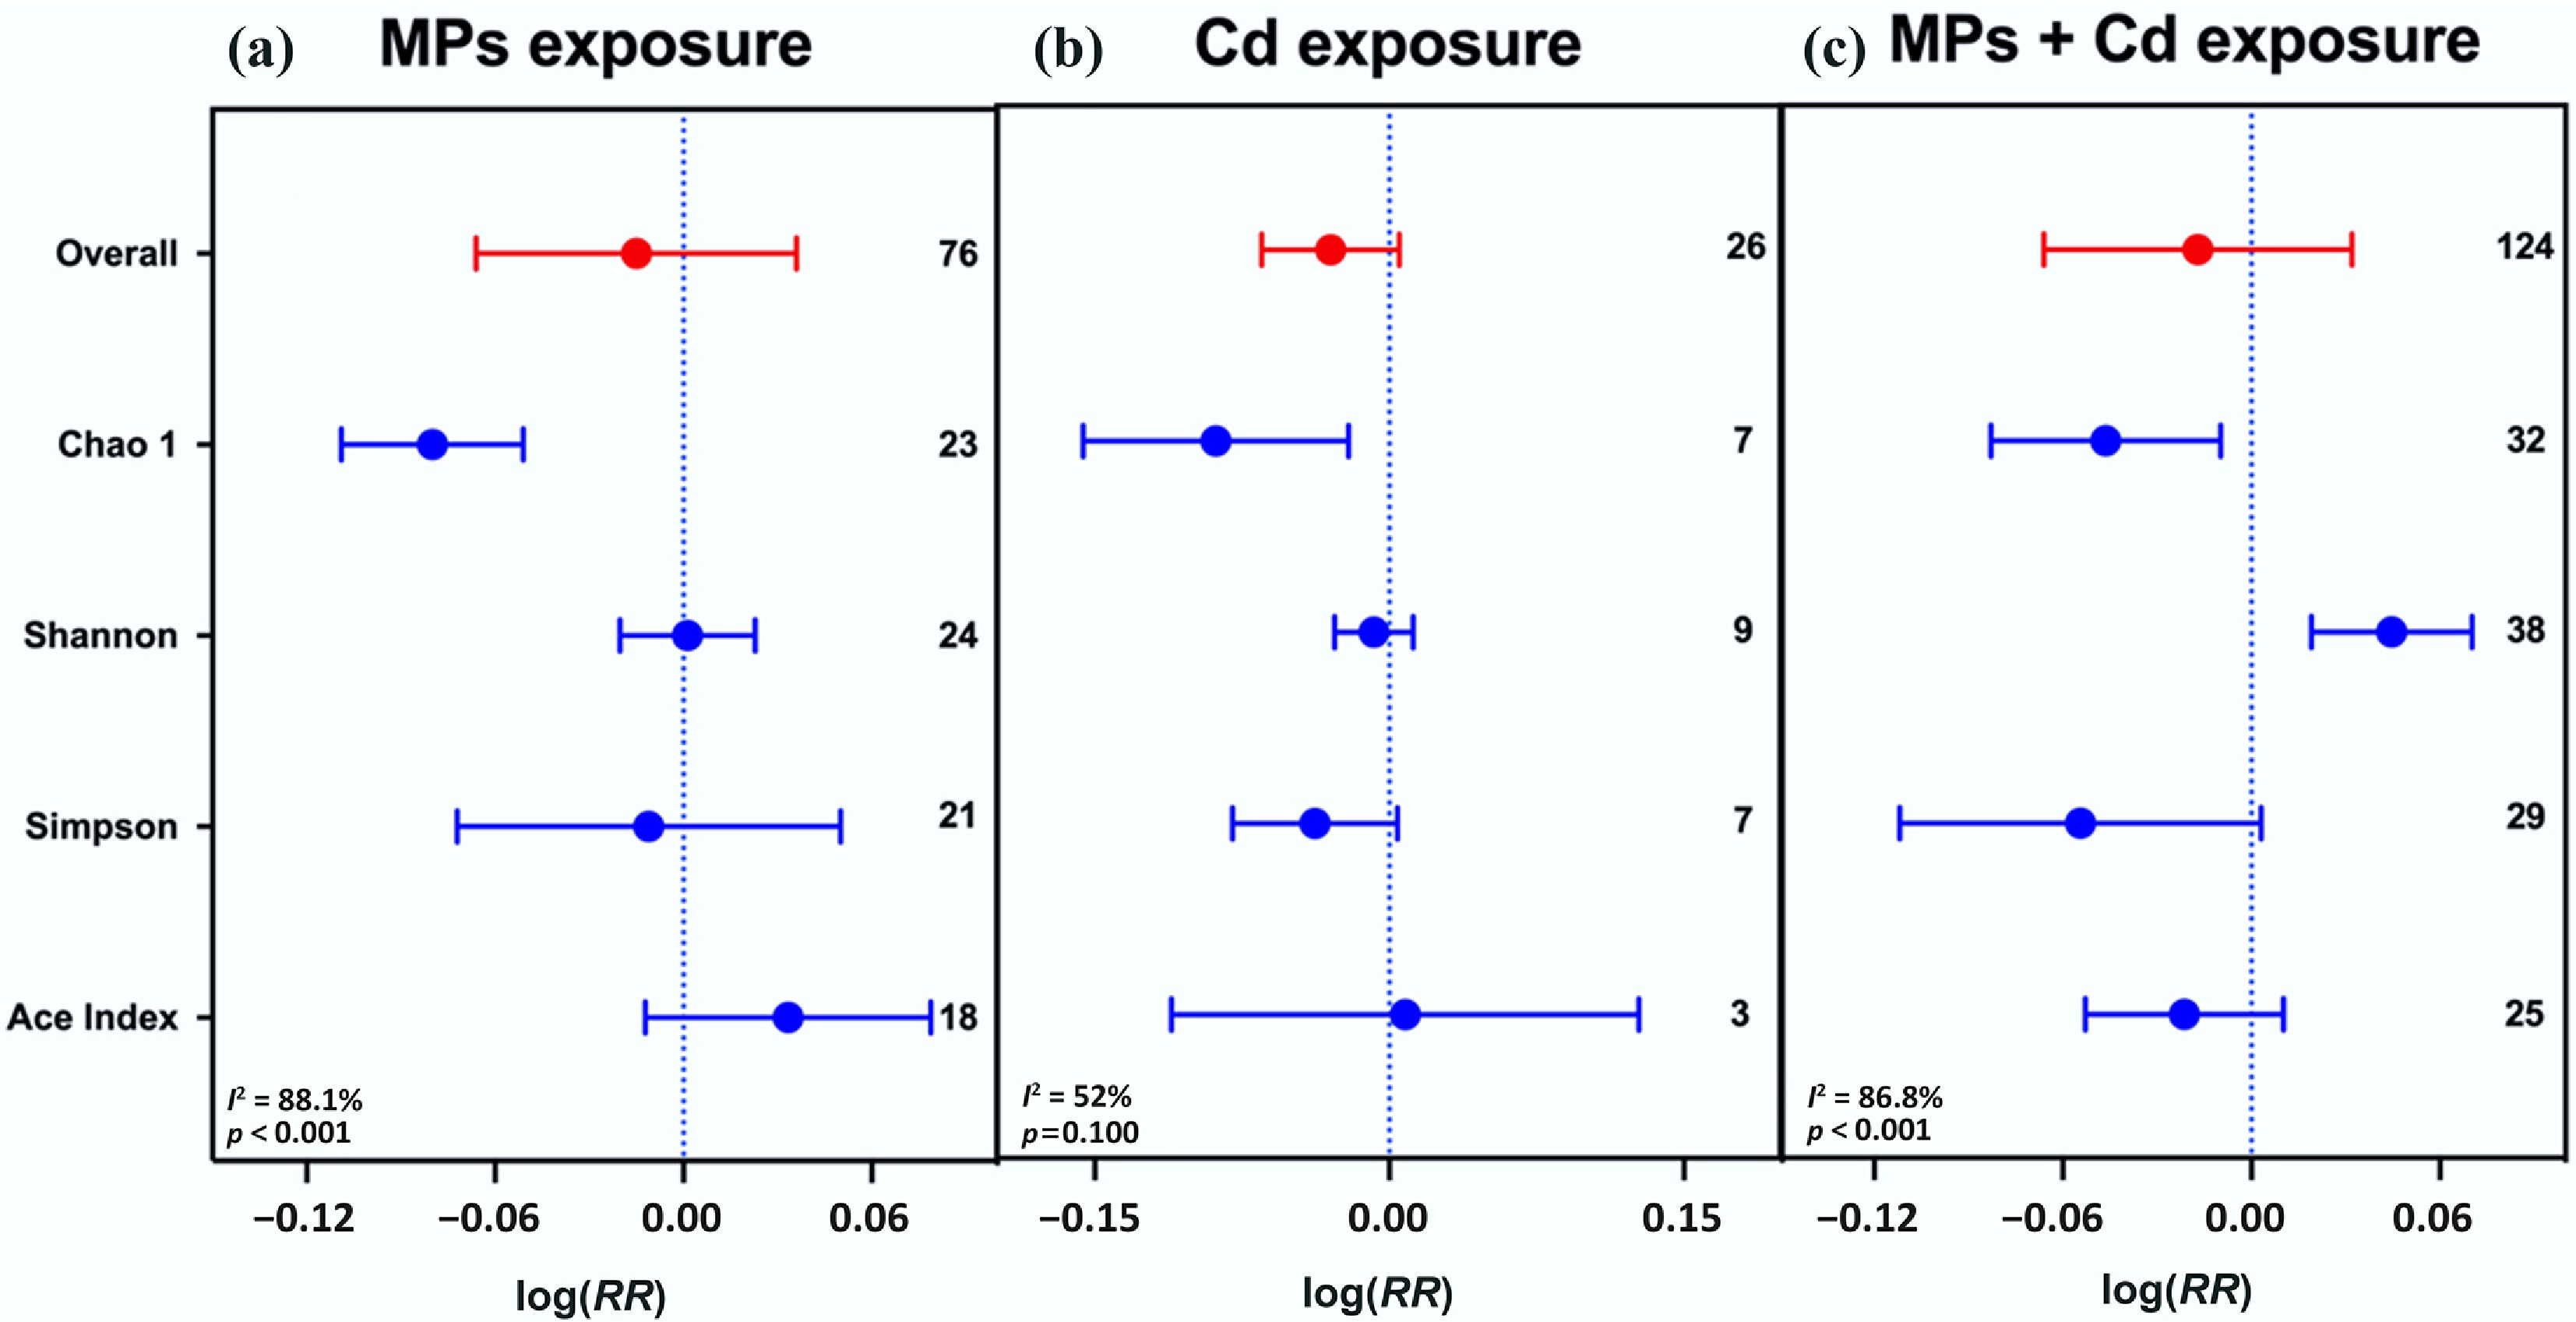
Figure 9.
Single and co-exposure of MPs and Cd affect soil microbial diversity. (a) MP exposure, (b) Cd exposure, and (c) co-exposure of MPs and Cd. Values are the mean effect size ± 95% CI. The right sidebar has a positive effect, the left side has a negative effect, and the bar overlapping zero indicates that the effect is not significant for each plot.
Figures
(9)
Tables
(0)