-
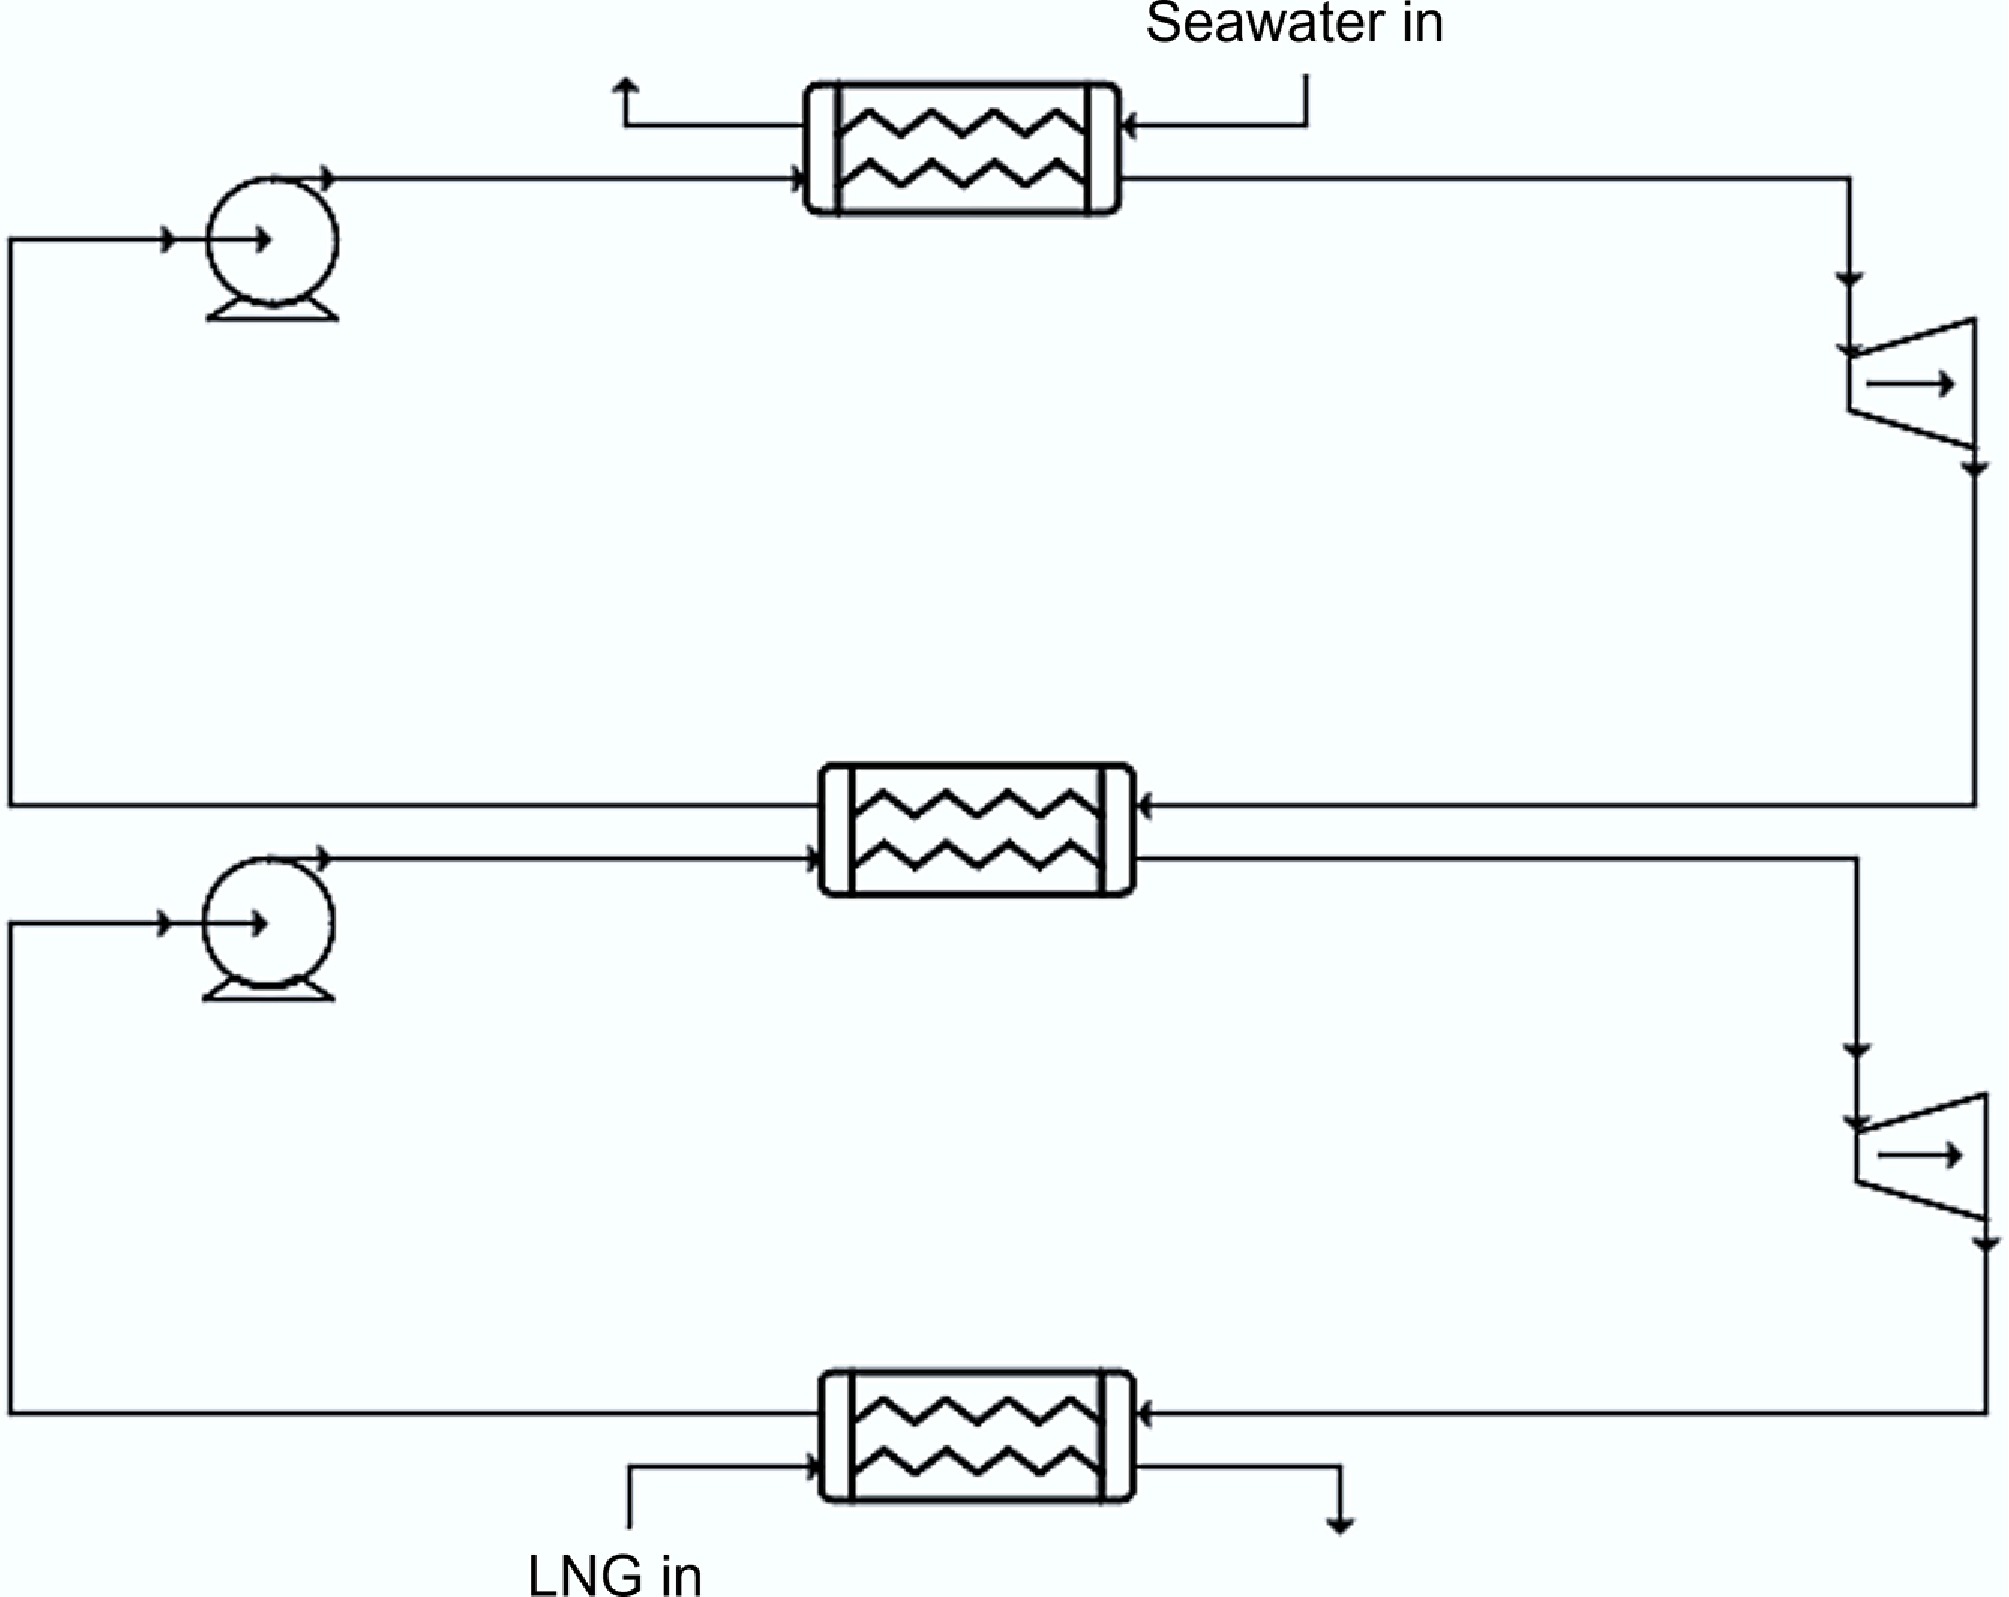
Figure 1.
A schematic of the two-stage Rankine cycle.
-
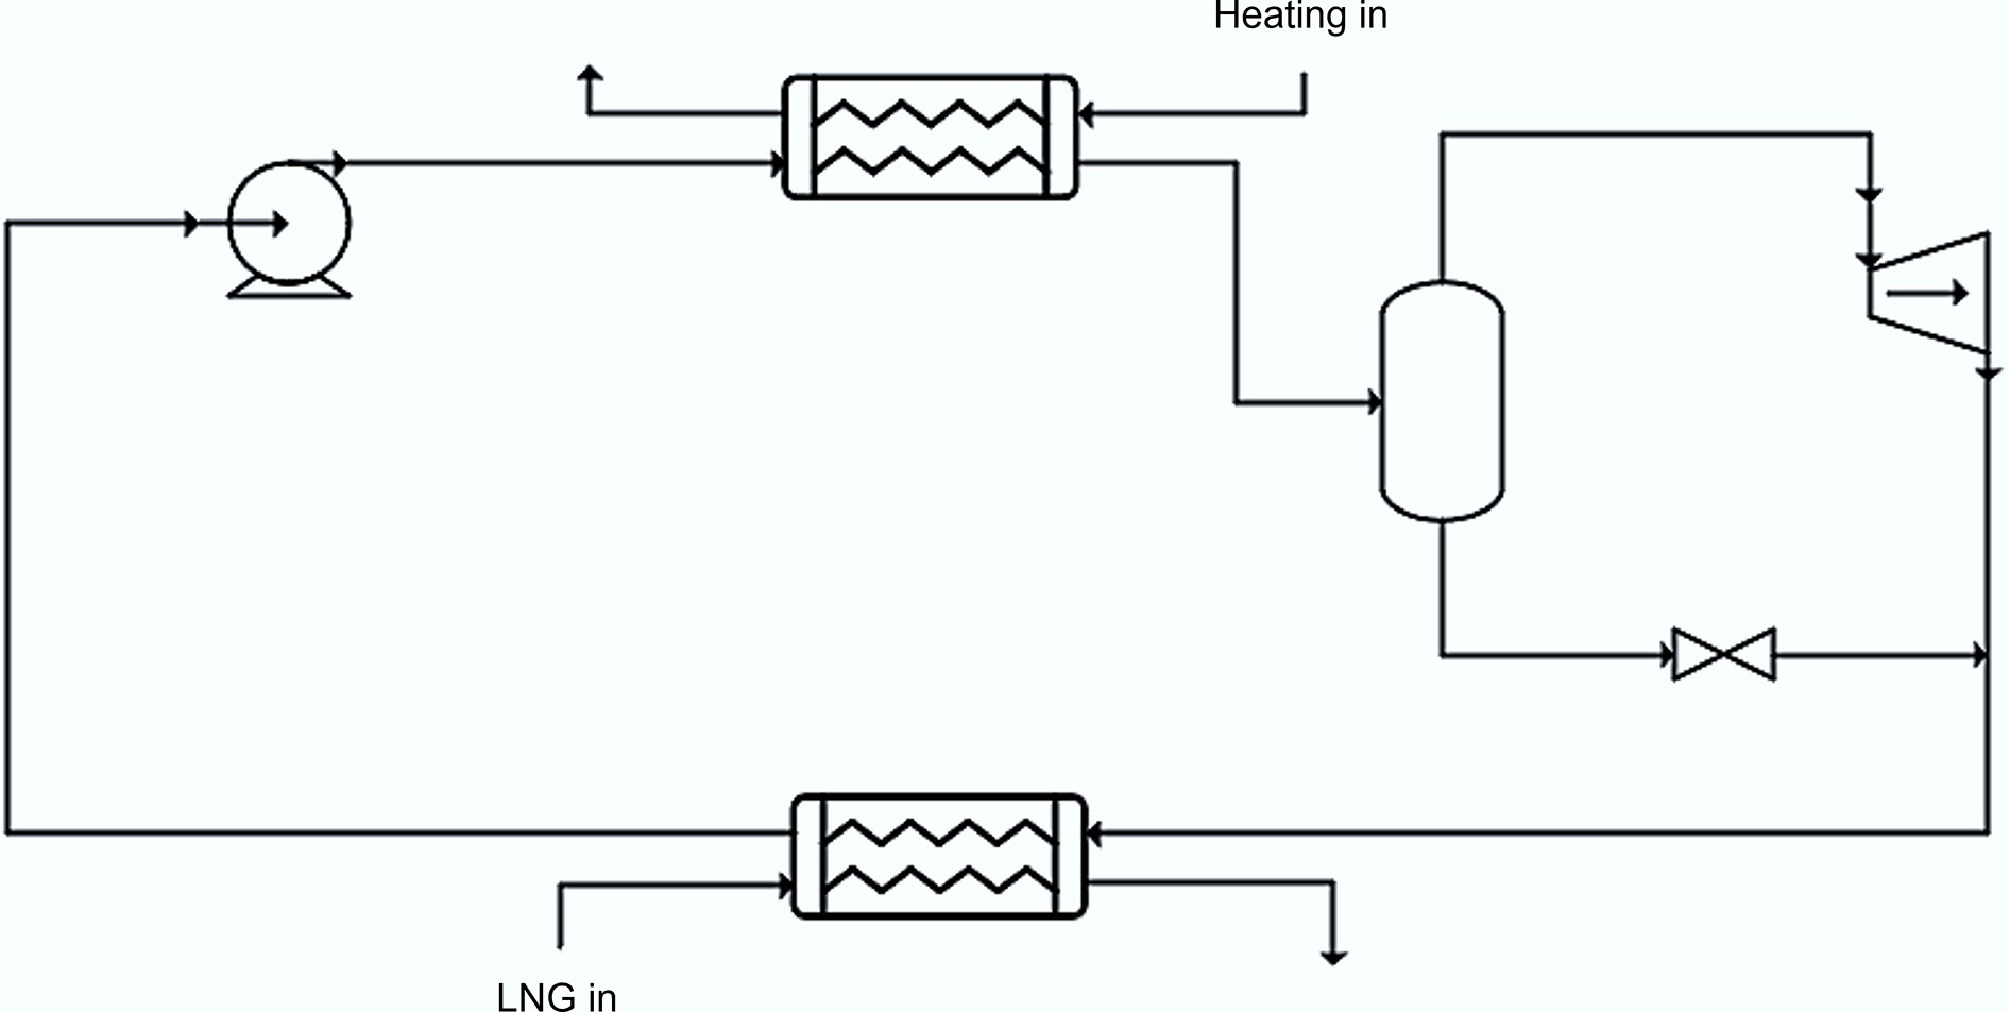
Figure 2.
A schematic of a basic Kalina cycle.
-
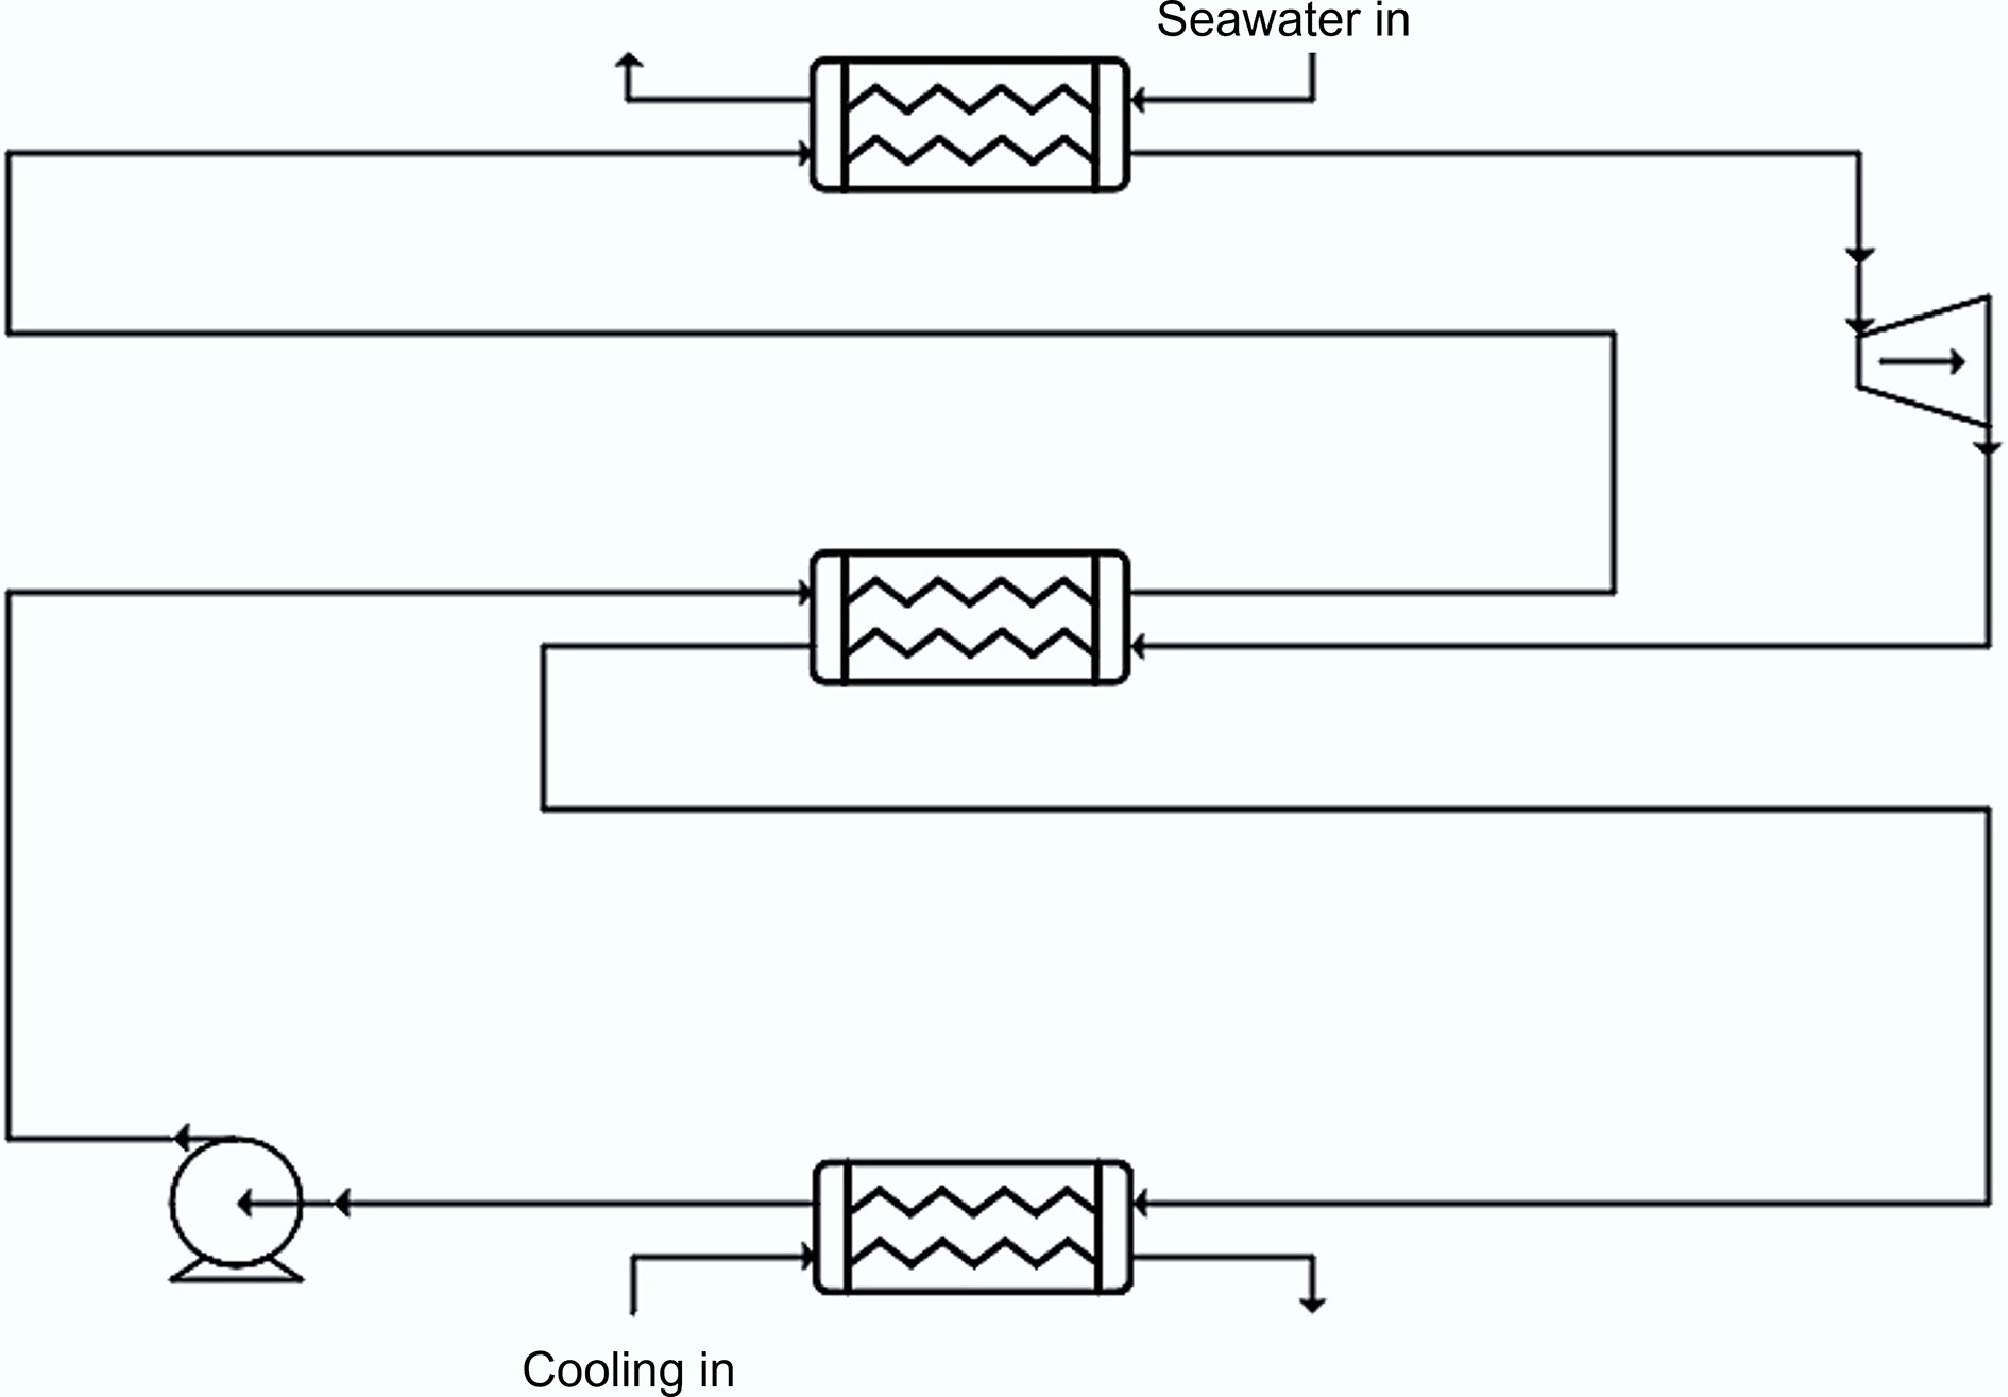
Figure 3.
A schematic of the basic regeneration configuration.
-
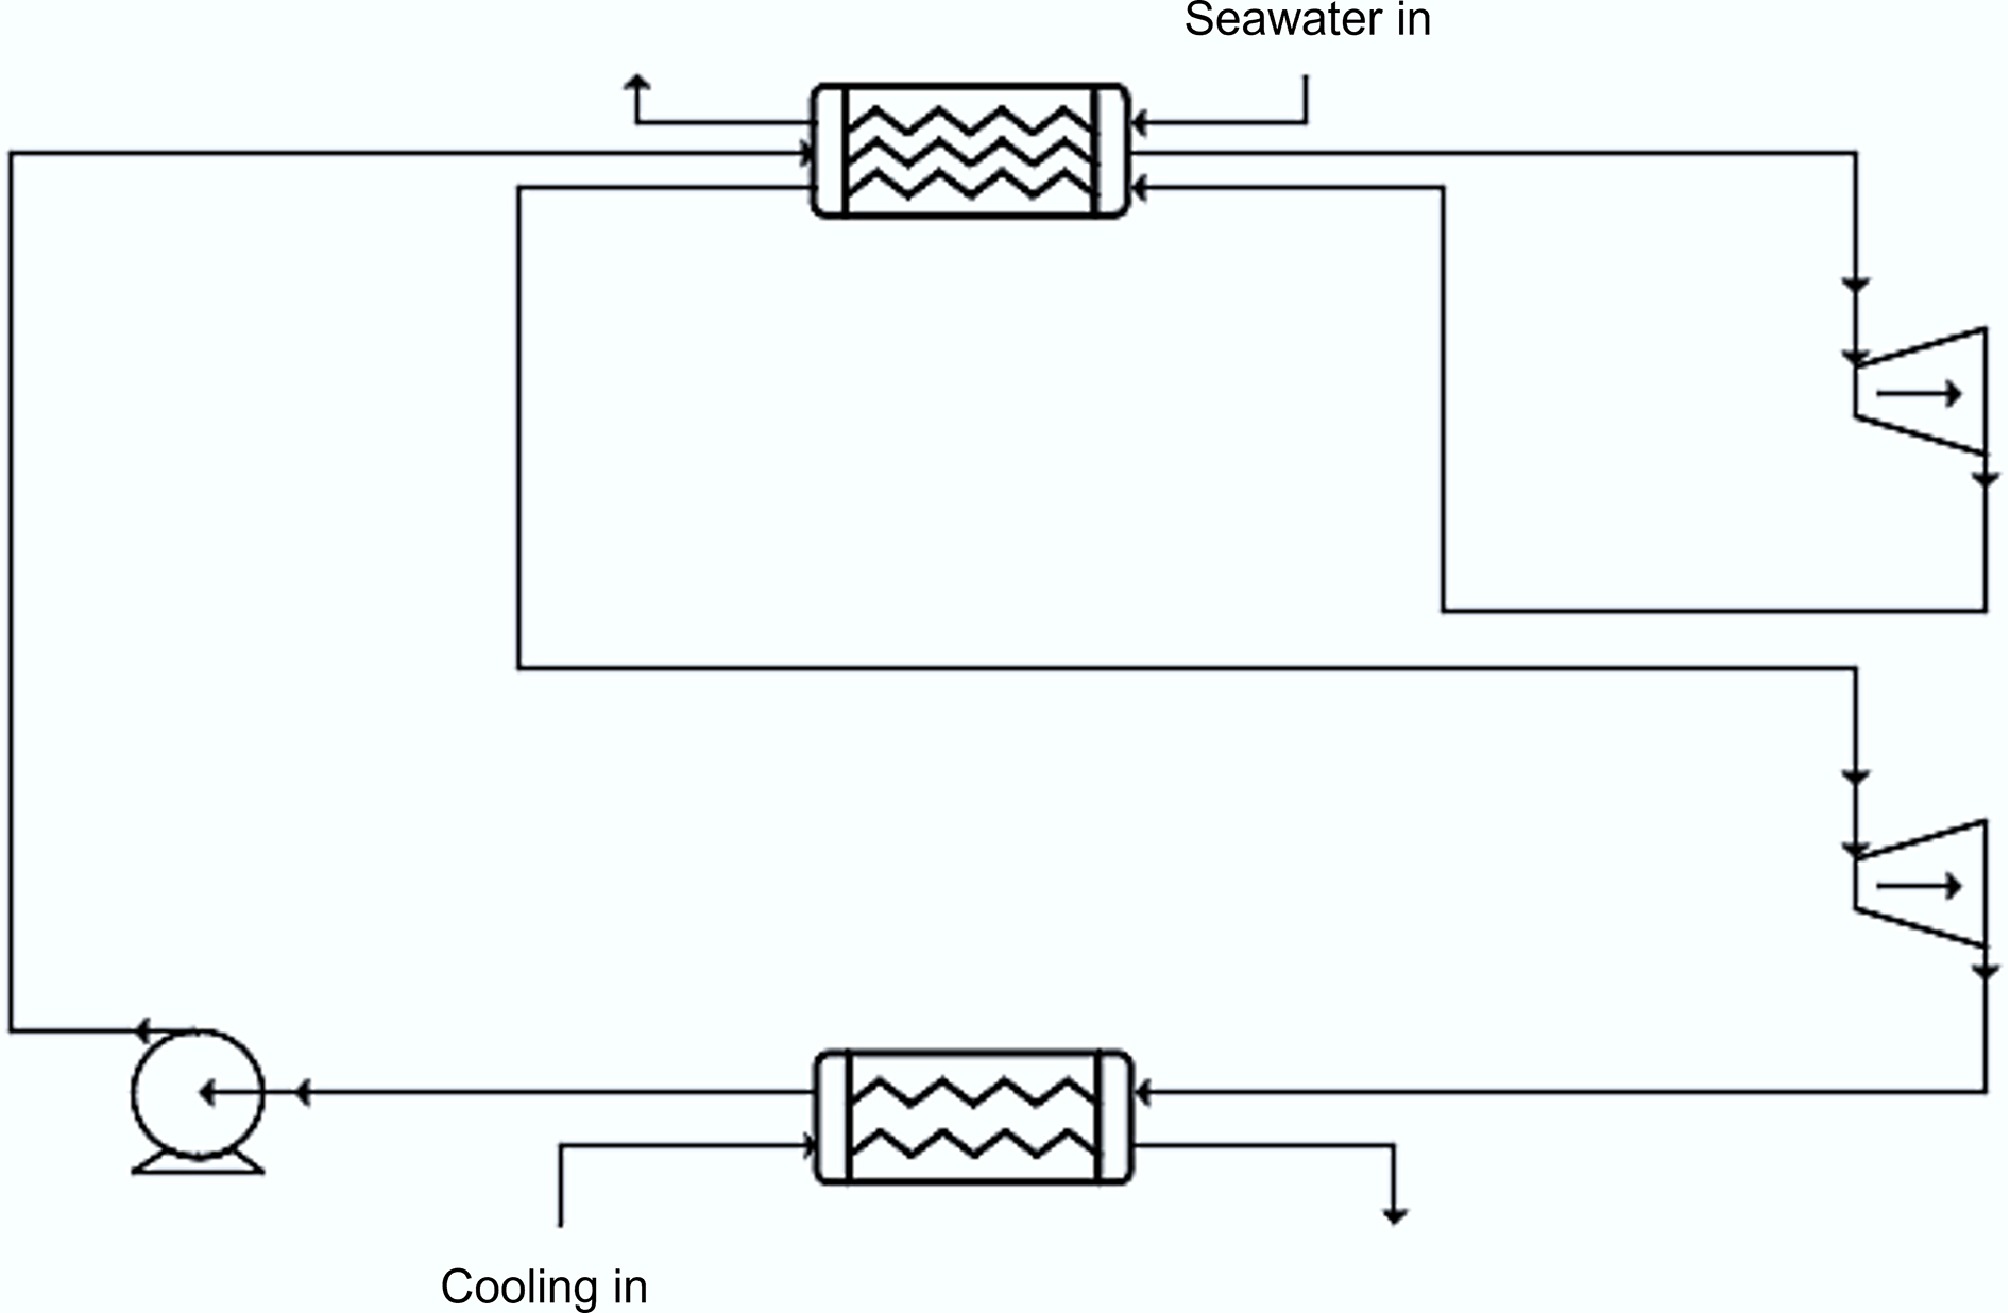
Figure 4.
Schematic of a basic reheating configuration.
-
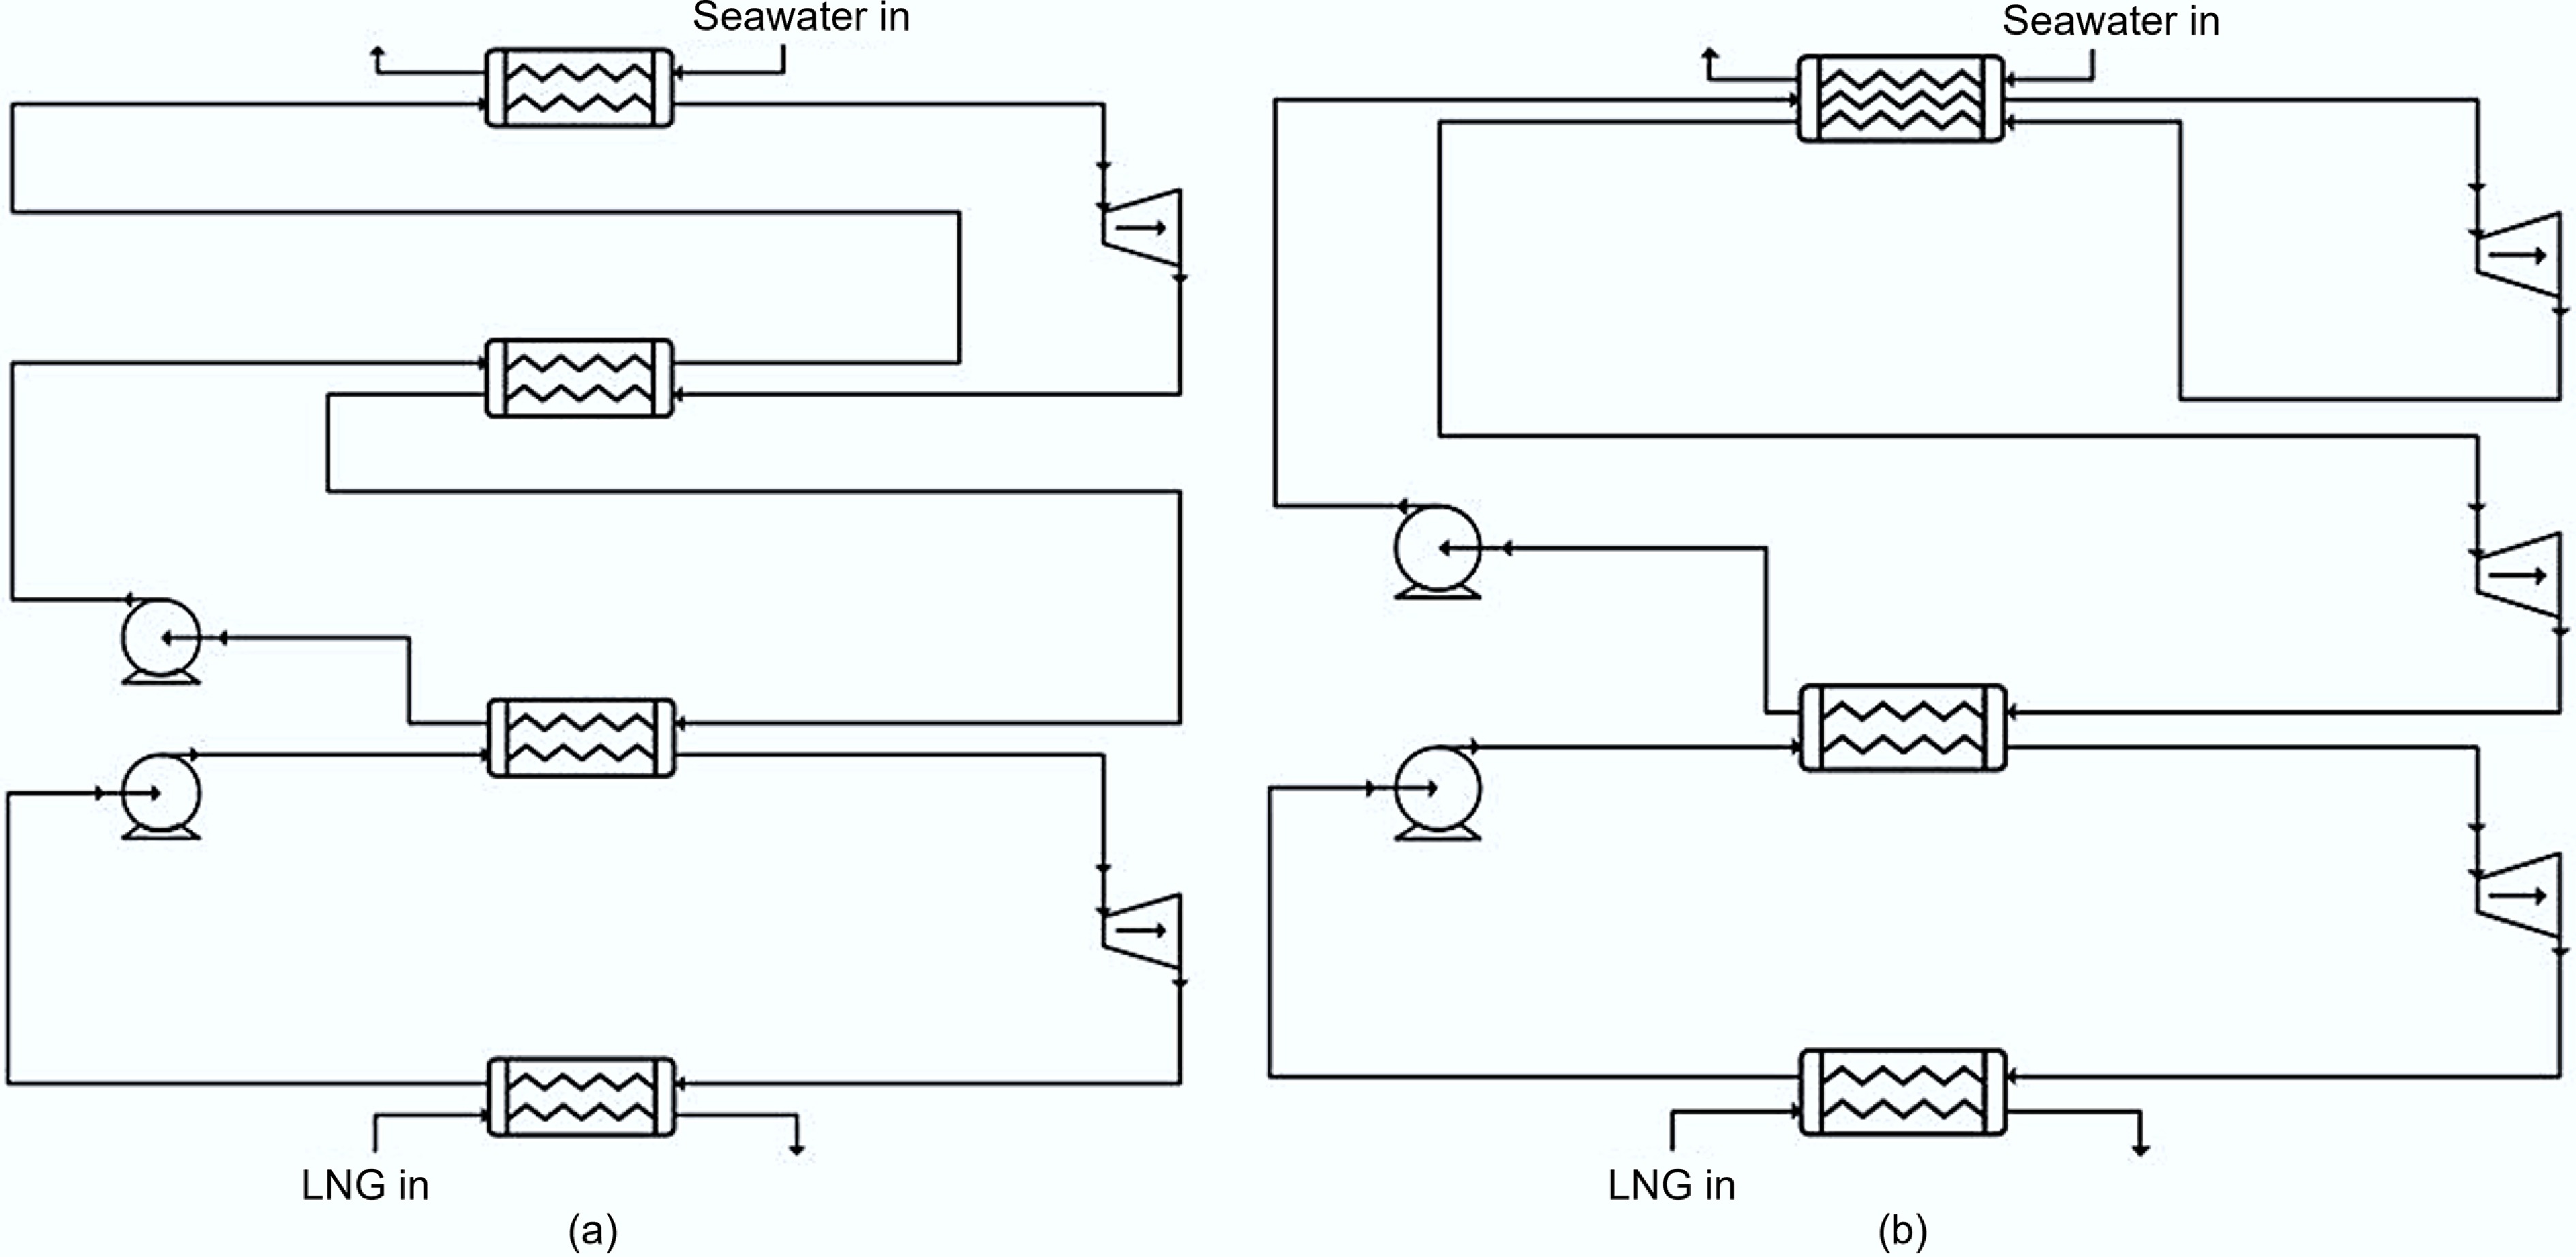
Figure 5.
Schematic of (a) Rankine-regeneration process configuration, and (b) Rankine-reheating process configuration.
-
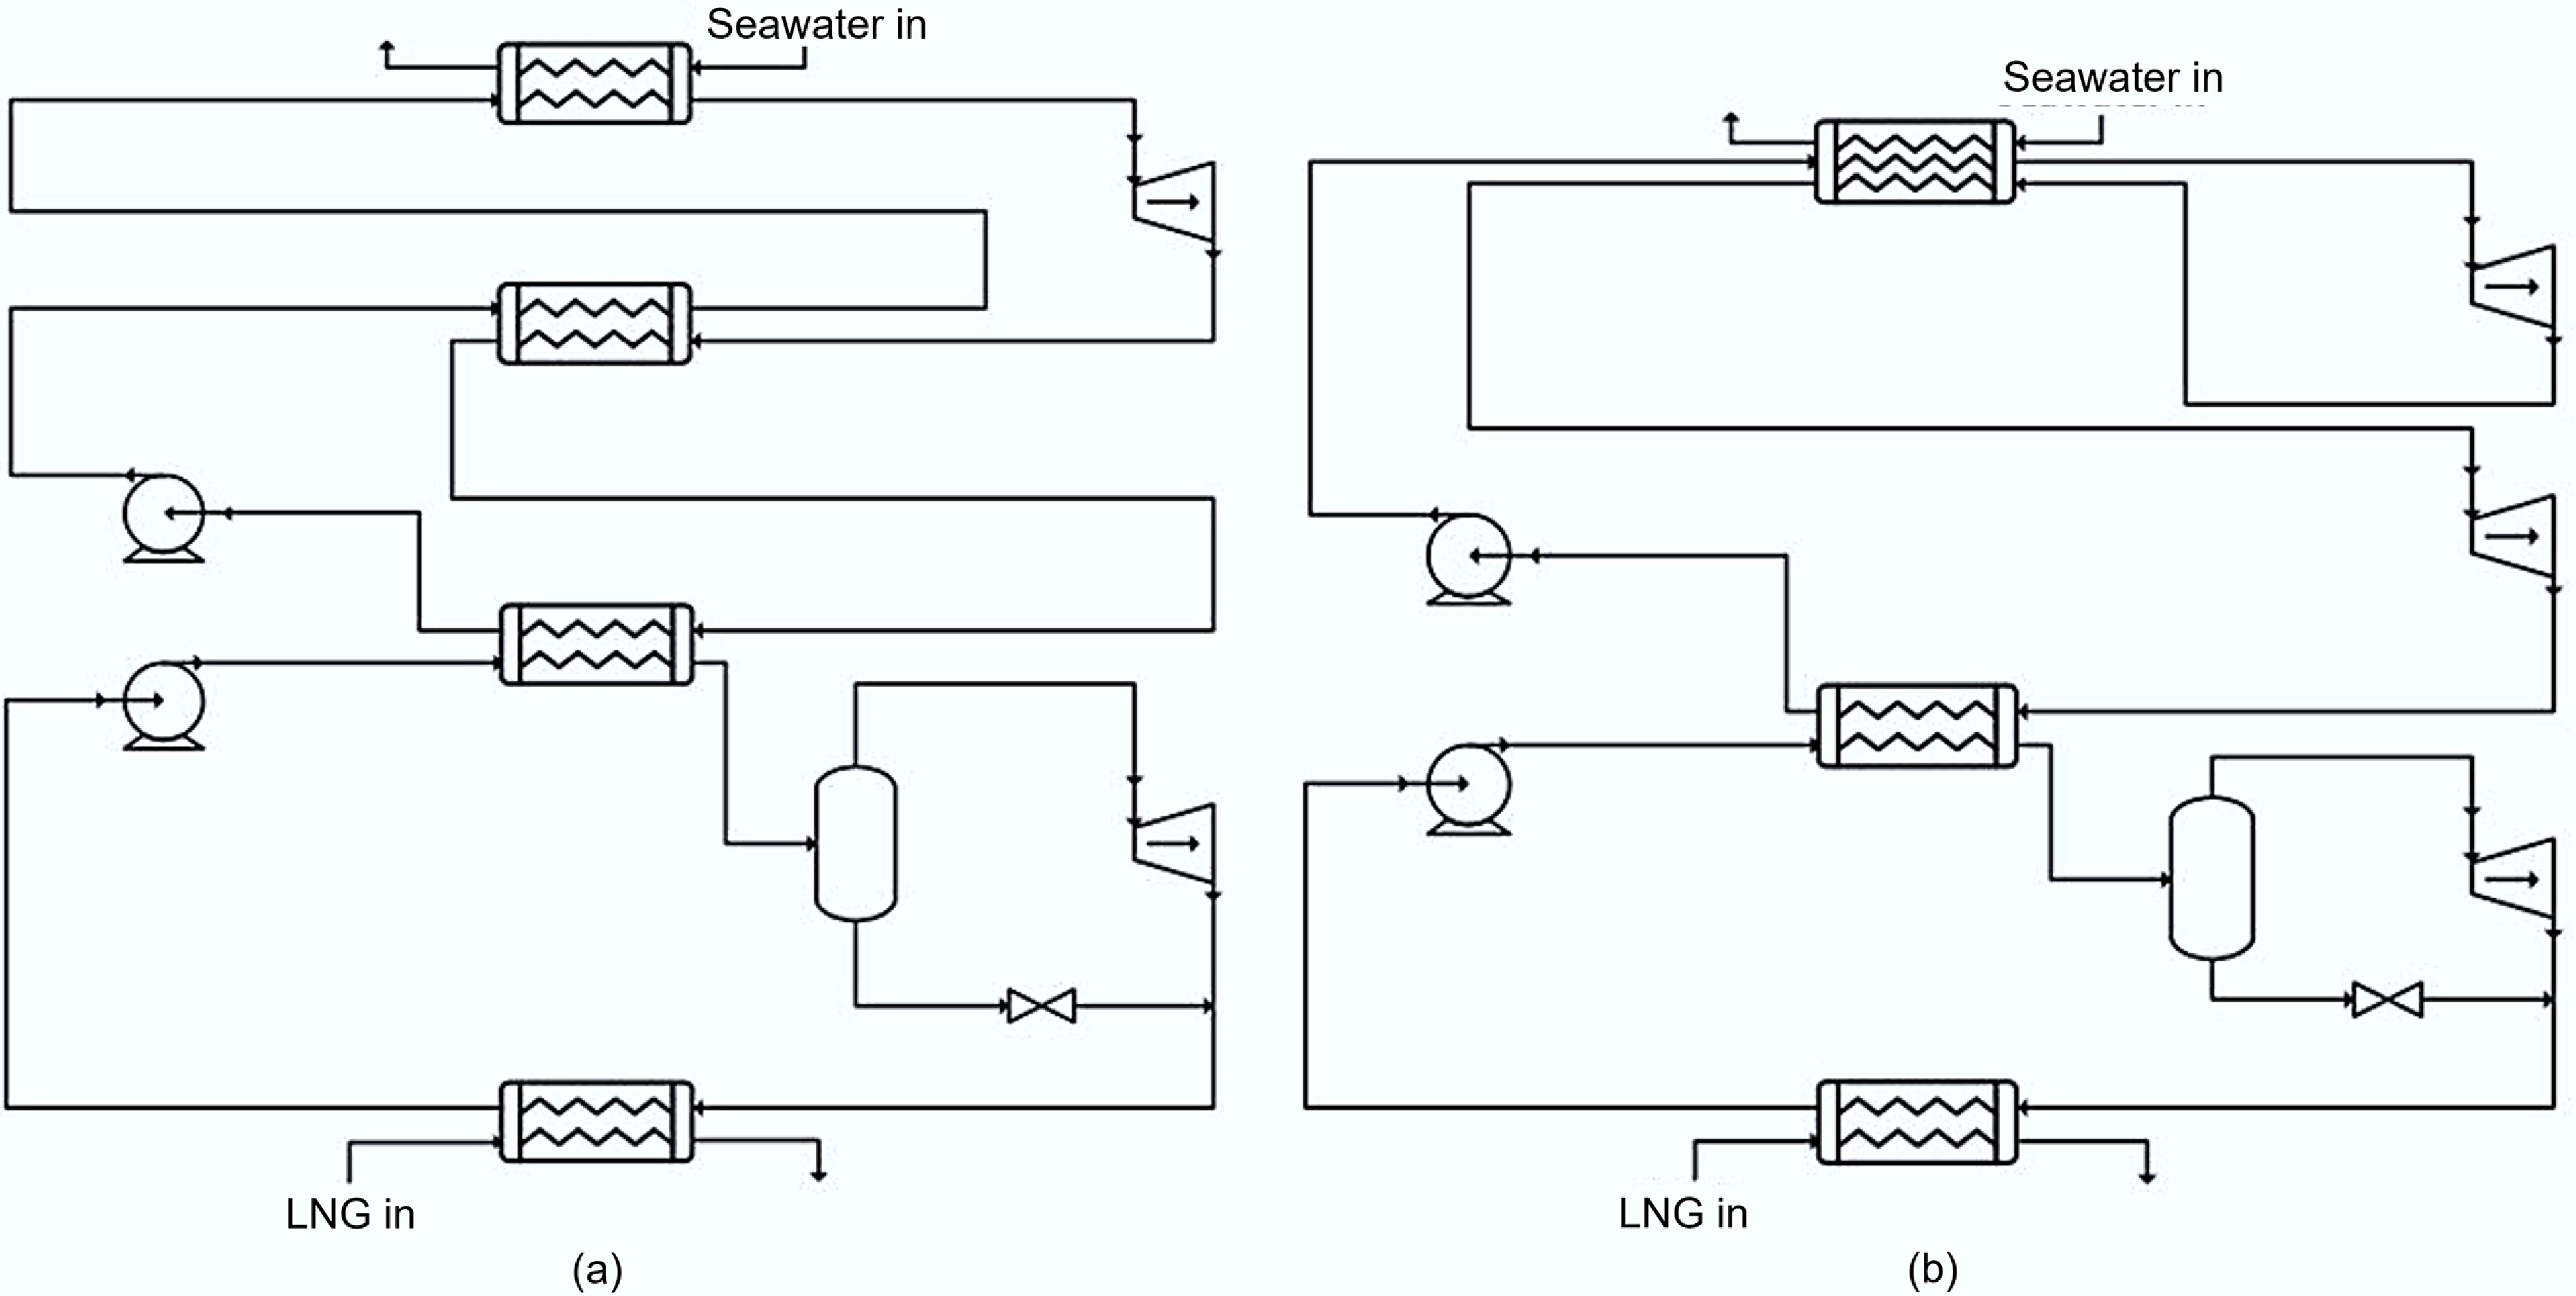
Figure 6.
Schematic of (a) Kalina-regeneration process configuration, and (b) Kalina-reheating process configuration.
-
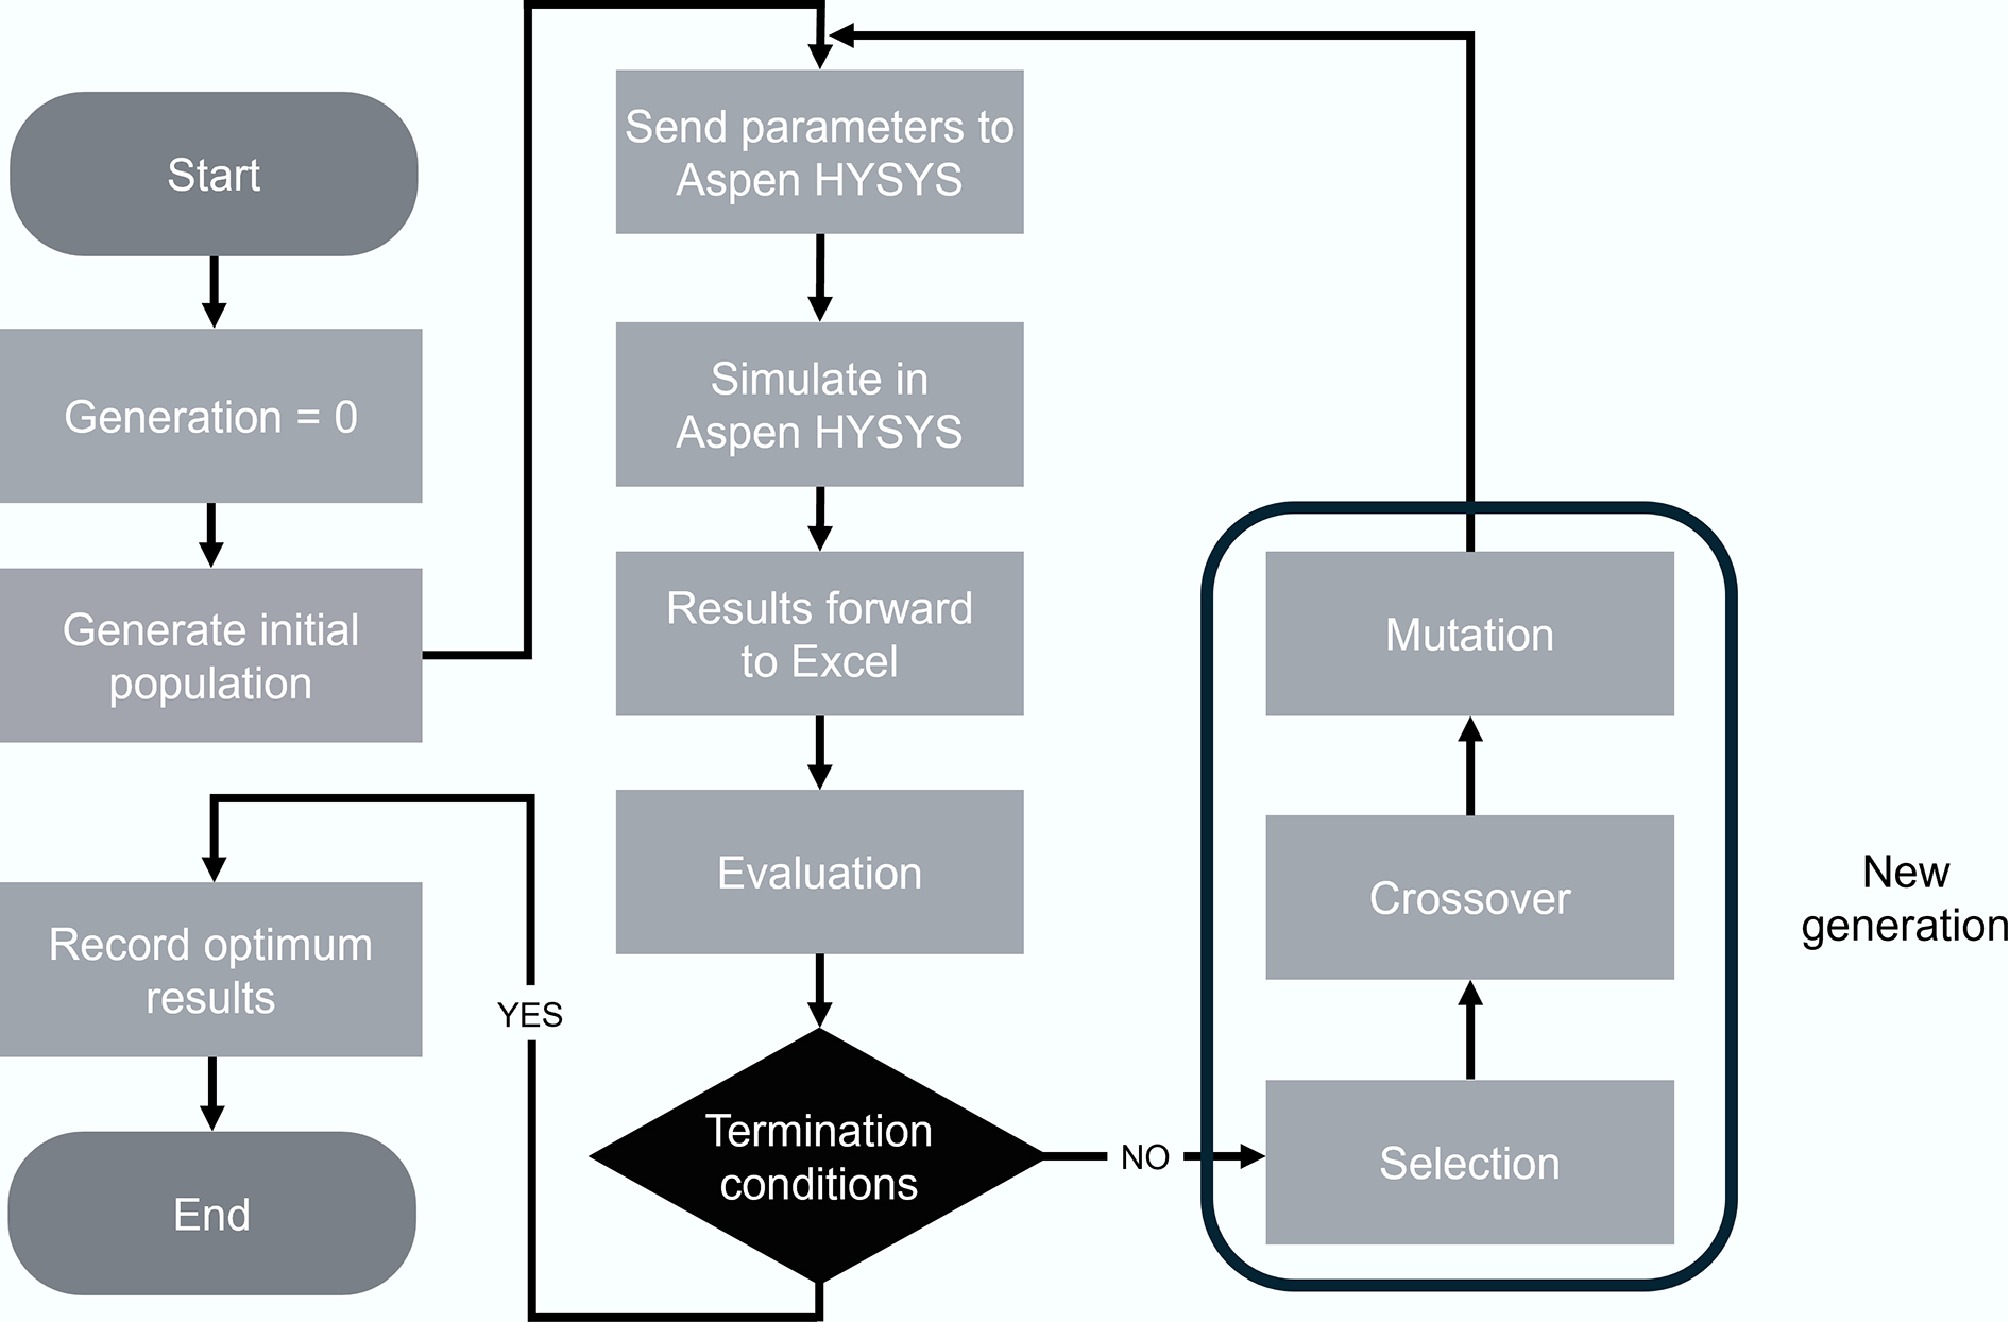
Figure 7.
The genetic algorithm flowsheet.
-
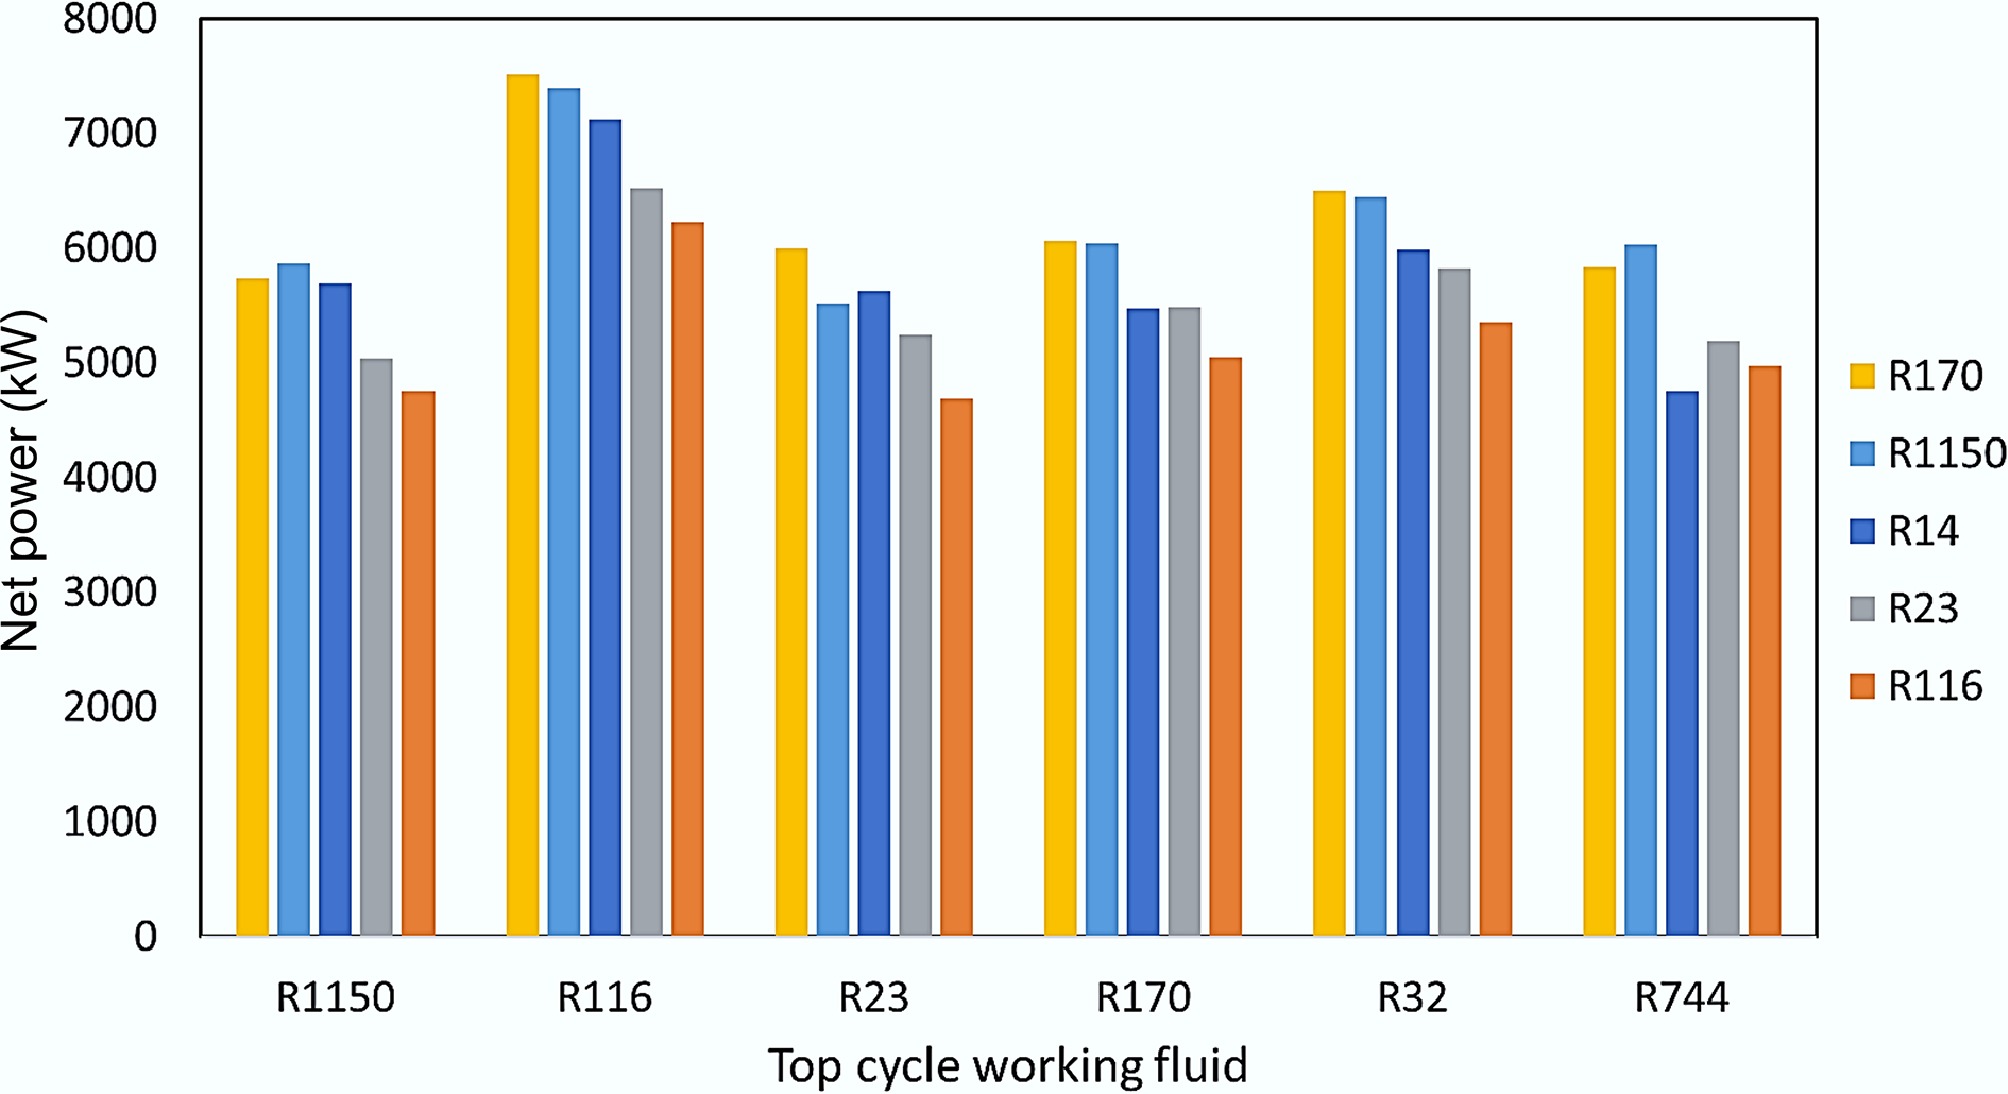
Figure 8.
Net power output for single working fluid combinations.
-
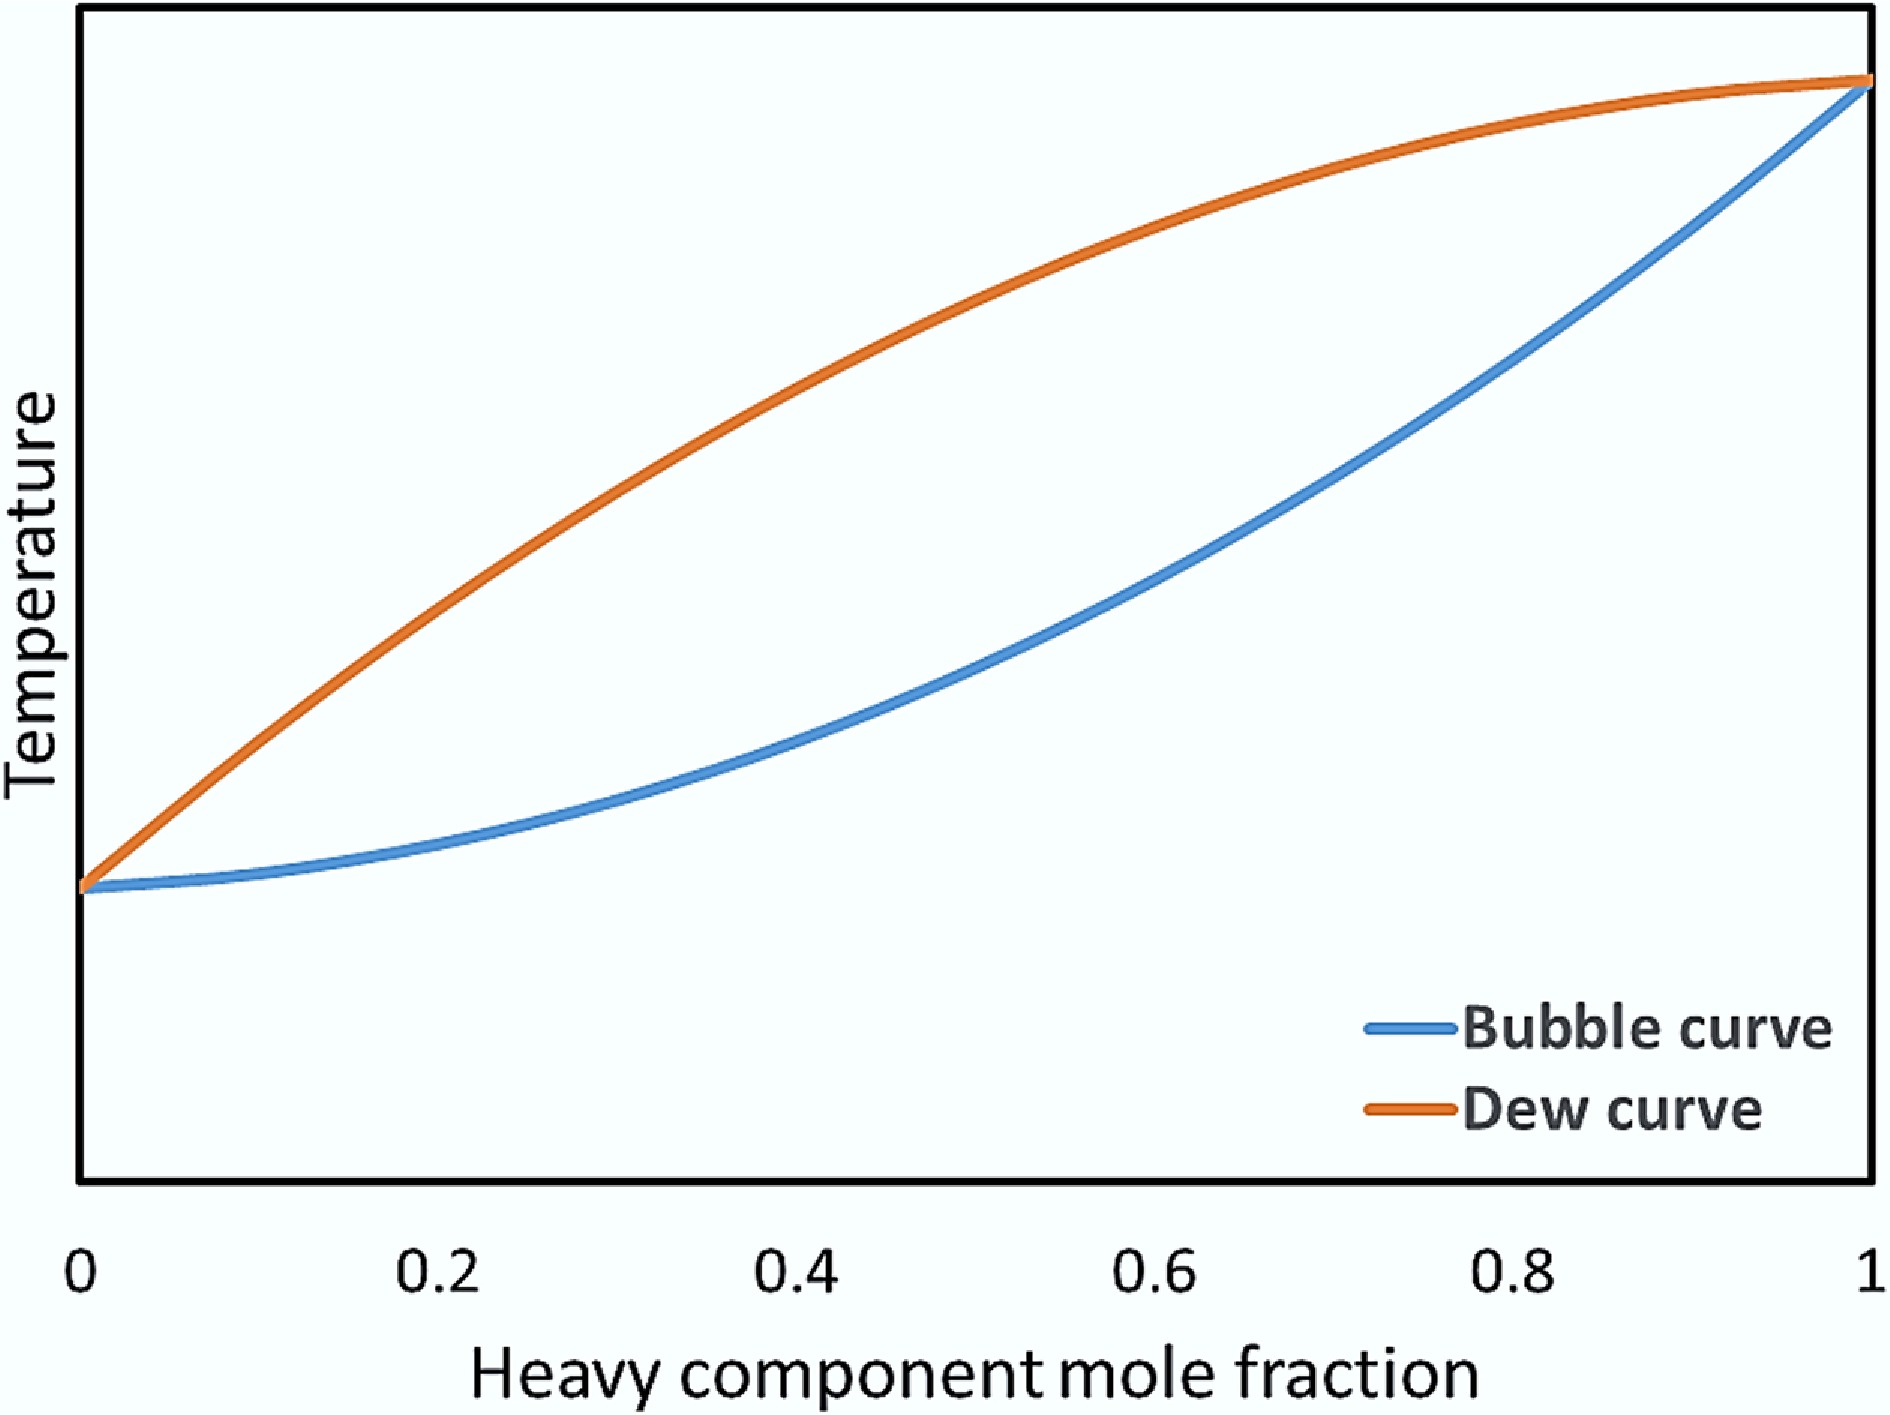
Figure 9.
Txy diagram of a binary mixture.
-
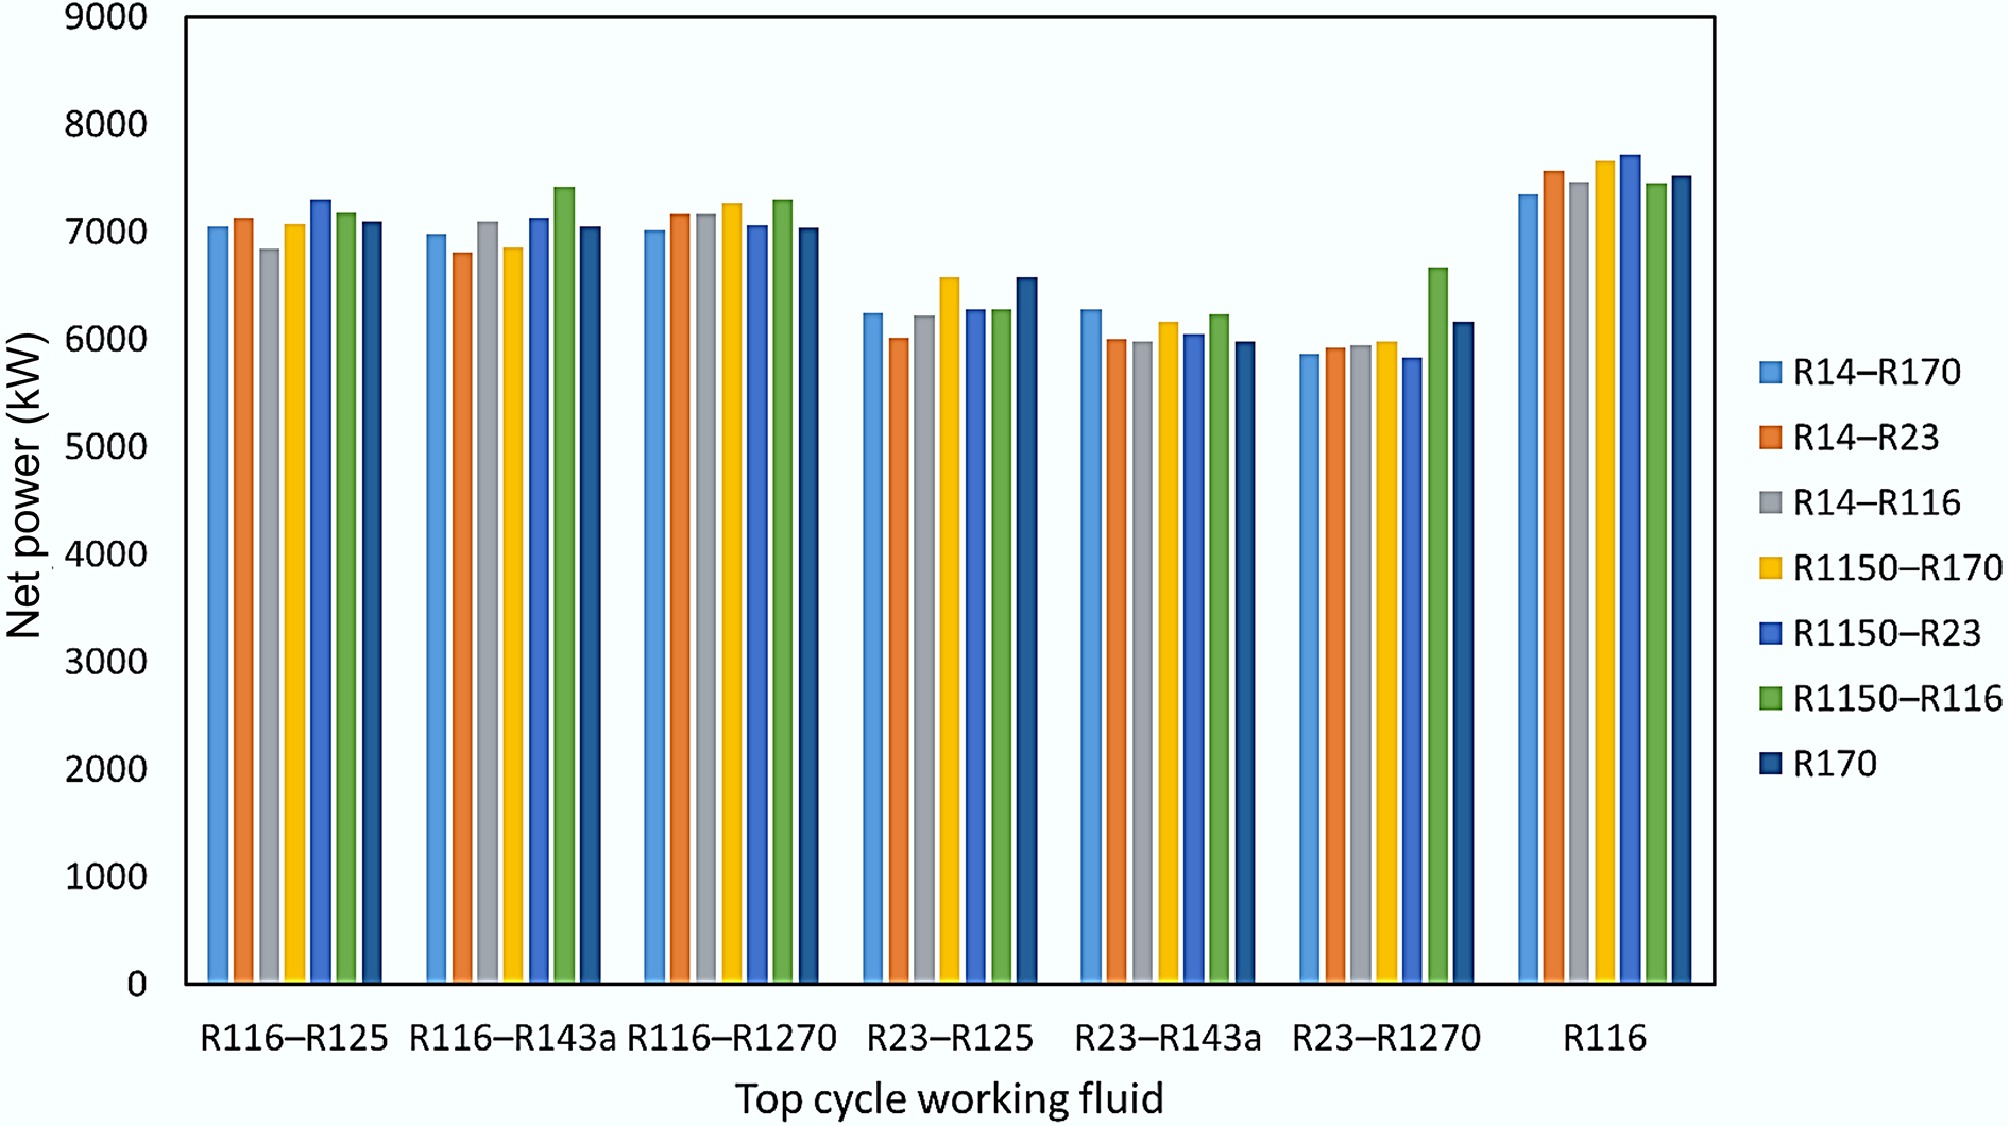
Figure 10.
Net power output for mixed working fluids combinations.
-
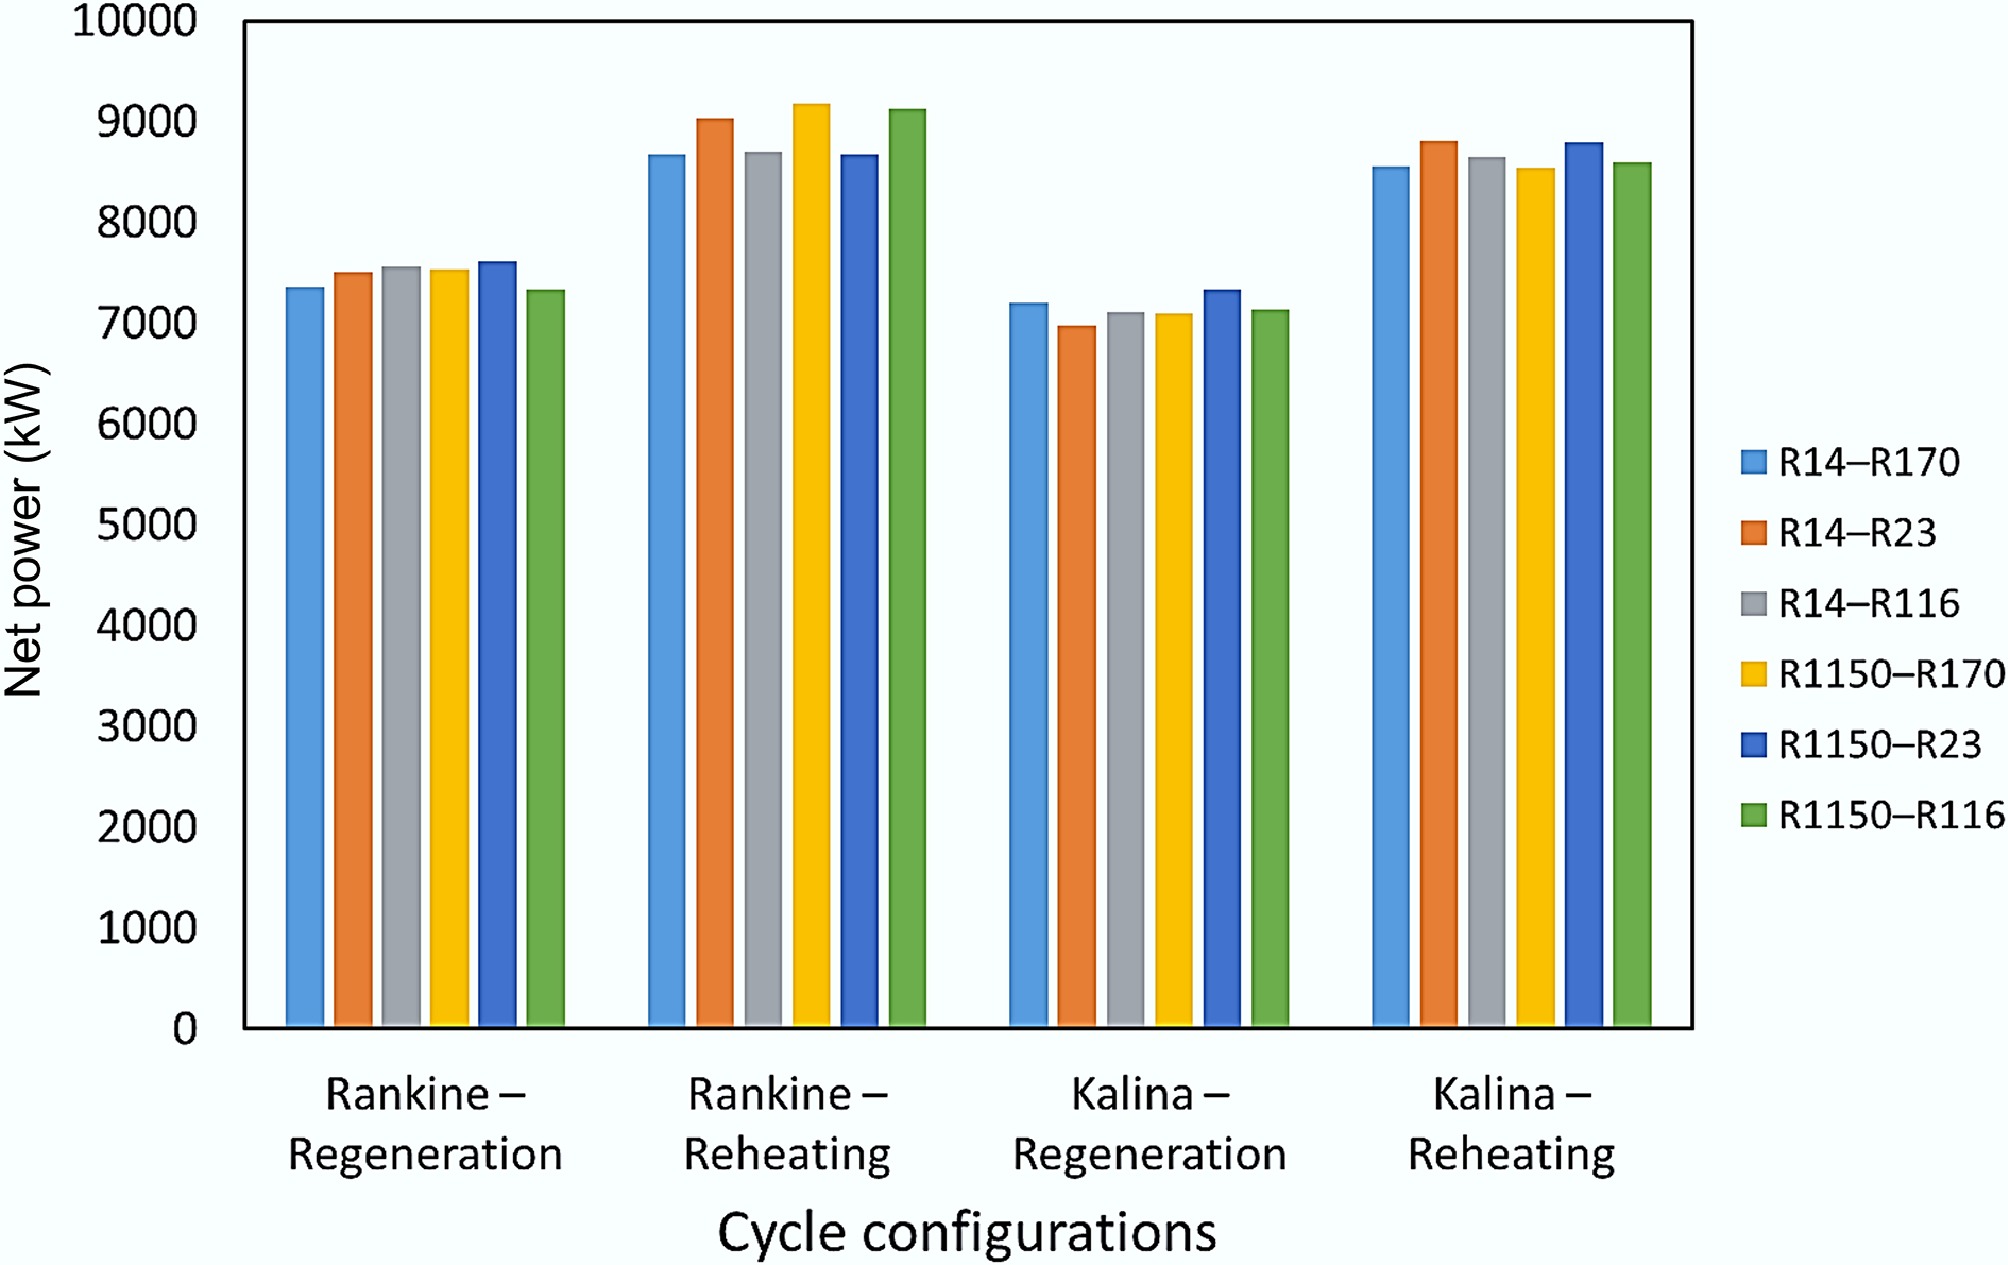
Figure 11.
Net power output for advanced cycle configurations.
-
Ref. Power cycle (s) Working fluid (s) Heat source LNG flow (t·h−1) Power output (kW) Thermal efficiency (%) [9] RC + DEC Propane Seawater 1.62 59.79 N/A [10] RC Propane Seawater 108 2,200 10 [11] Three-stage RC Propane Seawater 3.6 106 12.5 [12] Two-stage RC Ethane, propane Seawater 3.6 96.1 11.1 [13] Two-stage RC Ethane, ethylene Seawater N/A N/A N/A [14] RC Ammonia-water Waste heat 8.87 389.4 25.9 [15] BC + RC + DEC Nitrogen (BC), ammonia-water (RC) Waste heat N/A N/A 53.1 [16] BC + DEC Helium Combustion 3.6 1,650 53.7a [17] BC + DEC Flue gas Combustion N/A N/A 55.5 [18] BC + RC + two-stage DEC Flue gas (BC), propane (RC) Combustion N/A N/A 33.9b a Exergy efficiency; b Thermal efficiency of the gas turbine in the Brayton cycle. Table 1.
Summary of single fluid power generation designs
-
Ref. Power cycle (s) Working fluid (s) Cold reservoir
(°C)Hot reservoir
(°C)LNG flow
(t·h−1)Power output
(kW)Thermal efficiency
(%)[20] RC CO2-based mixtures −55 to −30 25 3.6 13.5 N/A [21] Three-stage RC Mixtures of R14, methane to pentane −160 25 to 85 Varying 151.8 to 248.8a 18.6 to 27.1 a Per kg of LNG flow. Table 2.
Summary of mixed working fluid power generation designs
-
Ref. Power cycle (s) Working fluid (s) Power output (kW) Thermal efficiency (%) Other applications [22] ORC CO2 31.2 5.0 Energy storage, chilled water, cold dry air [23] Three-stage ORC Ethane 11240 13.3a Desalination [24] ORC R1270 58870 63.8b Carbon capture ORC: Organic Rankine cycle; a Exergy efficiency; b System exergy efficiency. Table 3.
Summary of multi-objective power generation systems
-
Working fluid Chemical name Chemical
formulaTC
(°C)PC
(kPa)TTP
(°C)PTP
(kPa)TS @
100 kPa (°C)PS @
−70 °C (kPa)PS @
−30 °C (kPa)PS @
0 °C (kPa)Category R1150 Ethylene C2H4 9.2 5,032 −169.2 0.12 –104.3 517.6 1,062 4,109 Wet R116 Hexafluoroethane C2F6 19.9 3,060 −100 26.1 –79 157.9 377.3 1,872 Dry R23 Fluoroform CHF3 25.9 4,836 −155.1 0.058 –82.2 193.3 479.5 2,525 Dry R170 Ethane C2H6 32.3 4,884 −182.9 0.0011 –89 250.9 553 2,401 Wet R125 Pentafluoroethane C2HF5 66 3,620 −100.6 2.9 –48.4 30.6 92.4 668 Dry R143a 1,1,1-Trifluoroethane C2H3F3 72.7 3,764 −111.8 1.1 –47.4 29.8 88.3 620 Dry R32 Difluoromethane CH2F2 78.5 5,820 −136.8 0.048 –51.9 36 110.5 821 Wet R290 Propane C3H8 96.7 4,242 −187.6 1.7e–7 –42.7 25.3 71.9 476 Wet R1270 Propylene C3H6 92.4 4,664 −185.2 7.5e–7 –48.3 33.4 92.6 586 Wet R134a 1,1,1,2-Tetrafluoroethane C2H2F4 101 4,056 −103.3 0.39 –26.4 8.2 29.8 292 Dry R14 Tetrafluoromethane CF4 −45.7 3,745 −153.2 11.3 –128.3 1,739 3,302 N/A Dry R152a 1,1-Difluoroethane C2H4F2 113.9 4,444 −118.6 0.064 –24.8 8.2 28.7 266 Dry RC318 Perfluorocyclobutane C4F8 118.8 2,330 −39.8 19.5 –3.3 N/A 10.8 113 Dry R600a Isobutane C4H10-2 134.8 3,655 −159.4 2.3e–5 –12.4 5.1 17.5 158 Dry R600 n-Butane C4H10-1 152 3,796 −138.3 6.7e–4 –0.86 2.6 9.7 103 Dry R601a Isopentane C5H12-2 187.2 3,334 −160.5 9e–7 27.5 0.53 2.4 35 Dry R601 n-Pentane C5H12-1 196.4 3,375 −129.7 7.8e–5 35.9 0.29 1.4 24 Dry R744 Carbon Dioxide CO2 31 7,384 −56.6 517.9 N/A N/A 677 3,474 Isentropic R717 Ammonia NH3 132.3 11,310 −77.7 6.1 –33.4 10.7 40.2 427 Wet TC: Critical temperature; PC: Critical pressure; TTP: Triple point temperature; PTP: Triple point pressure; TS: Saturation temperature; PS: Saturation pressure. Table 4.
Working fluid candidates for low-temperature power cycle
-
Parameter Value LNG compositions (mol%): Methane 85 Ethane 10 Propane 2.5 n-butane 2.5 LNG inlet temperature (°C) −130 LNG outlet temperature (°C) −95 LNG pressure (kPa) 1,000 LNG mass flow rate (kg·s−1) 60 Pump/turbine adiabatic efficiency (%) 75 Pressure drop in the heat exchanger (kPa) 10 Minimum pinch point in heat exchangers (°C) 5 Table 5.
LNG conditions and simulation parameters
-
Parameters Range Top cycle evaporation pressure 200 kPa to PS @ 0 °C Top cycle condensation pressure 100 kPa to PS @ 0 °C Bottom cycle evaporation pressure 200 kPa to PS @ 30 °C Bottom cycle condensation pressure 100 kPa to PS @ 30 °C Bottom cycle evaporation temperature –70 to –30 °C Additional parameters for mixed fluid Top mixture composition (component 1) 0.1 to 0.9 Bottom mixture composition (component 2) 0.1 to 0.9 Additional parameters for reheating configuration Top cycle evaporation pressure 2 200 kPa to PS @ 0 °C Additional parameters for Kalina configuration Separator ratio* 0.1 to 0.9 * Vapor fraction of the separator feed on a molar basis. Table 6.
Parameter value ranges
-
Algorithm settings Value Total generations 50/100* Populations per generation 100/200* Mutation probability 0.2 * For integrated configurations with Kalina, reheating, and regeneration. Table 7.
Genetic algorithm settings
-
Bottom cycle
working fluidTop cycle working fluid R1150 R116 R23 R170 R32 R744 R1150 1 2 3 4 5 6 R116 7 8 9 10 11 12 R23 13 14 15 16 17 18 R170 19 20 21 22 23 24 R14 25 26 27 28 29 30 Table 8.
Combinations of single working fluid
-
Top cycle Bottom cycle Power
(MW)Top cycle power
(MW)Bottom cycle power
(MW)Thermal
efficiency
(%)2nd law
efficiency
(%)R116 R170 7.5 4.4 3.2 24.1 52.8 R116 R1150 7.4 4.4 3.0 23.8 52.1 R116 R14 7.1 4.0 3.2 23.1 50.7 R1150 R14 5.7 1.9 3.8 19.4 42.5 R1150 R116 4.8 2.6 2.2 16.7 36.6 R23 R116 4.7 2.5 2.2 16.5 36.2 Table 9.
Performance comparison of selected single working fluid combinations
-
Bottom cycle
working fluidTop cycle working fluid R116–
R125R116–
R143aR116–
R1270R23–
R125R23–
R143aR23–
R1270R116 R14–R170 1 2 3 4 5 6 7 R14–R23 8 9 10 11 12 13 14 R14–R116 15 16 17 18 19 20 21 R1150–R170 22 23 24 25 26 27 28 R1150–R23 29 30 31 32 33 34 35 R1150–R116 36 37 38 39 40 41 42 R170 43 44 45 46 47 48 49 Table 10.
Combinations of mixtures of working fluids
-
Top cycle Bottom cycle Power (MW) Top cycle power (MW) Bottom cycle power (MW) Thermal efficiency (%) 2nd law efficiency (%) R116 R1150–R23 7.7 4.3 3.4 24.6 53.8 R116 R14–R116 7.4 4.7 2.8 24.0 52.5 R116–R143a R14–R23 6.8 2.5 4.3 22.3 48.9 R23–R143a R1150–R23 6.0 1.9 4.1 20.3 44.5 R23–R143a R14–R23 6.0 3.9 2.1 20.2 44.3 Table 11.
Performance comparison of selected mixed working fluid combinations
-
Bottom cycle configuration Top cycle configuration Regeneration Rankine cycle Reheating Rankine cycle Rankine cycle Configuration 1 Configuration 2 Kalina cycle Configuration 3 Configuration 4 Table 12.
Advanced configurations
-
Bottom cycle working fluid Top cycle working fluid R116 R14–R170 1 R14–R23 2 R14–R116 3 R1150–R170 4 R1150–R23 5 R1150–R116 6 Table 13.
Working fluid candidates for advanced cycle configurations
-
Cycle configuration Power (MW) Top power (MW) Bottom
power (MW)Top Pevap (kPa) Top Pevap 2 (kPa) Top
Pcond (kPa)Bottom
Pevap (kPa)Bottom
Pcond (kPa)Bottom
Tcond (°C)Single fluid 7.5 4.4 3.2 1,030 – 100 550 100 –50 Mixed working fluid 7.7 4.1 3.5 870 – 100 770 120 –46 Rankine–reheating 9.2 5.0 4.2 1,830 510 100 1,000 110 –34 Rankine–regeneration 7.5 4.2 3.4 940 – 100 840 150 –48 Evaporation pressure (turbine inlet); Pcond: Condensation pressure (turbine outlet); Tcond: Condensation temperature (turbine outlet). Table 14.
Performance comparison of cycle configurations with identical working fluids
-
Top cycle Bottom cycle Power (MW) Top cycle power
(MW)Bottom cycle power (MW) Thermal efficiency
(%)2nd law efficiency (%) Baseline Rankine cycle configuration R116 R1150–R23 7.7 4.3 3.4 24.6 53.8 R116 R1150–R170 7.7 4.1 3.5 24.4 53.5 R116 R14–R23 7.6 4.1 3.5 24.2 53.1 Rankine-regeneration configuration R116 R1150–R23 7.6 4.1 3.5 24.3 53.3 R116 R1150–R170 7.5 4.2 3.4 24.1 52.9 R116 R14–R23 7.5 4.4 3.1 24 52.7 Table 15.
Performance comparison of regeneration and baseline configurations
-
Top
cycleBottom
cyclePower
(MW)Top cycle
power
(MW)Bottom
cycle power
(MW)Thermal
efficiency
(%)2nd law
efficiency
(%)Rankine-reheating configuration R116 R1150–R23 8.7 5.2 3.5 26.8 58.8 R116 R1150–R170 9.2 5.0 4.2 27.9 61.2 R116 R14–R116 8.7 5.1 3.6 26.9 58.9 Kalina-reheating configuration R116 R1150–R23 8.8 5.0 3.8 27.1 59.4 R116 R1150–R170 8.6 5.1 3.5 26.5 58.1 R116 R14–R116 8.7 5.0 3.7 26.8 58.6 Table 16.
Performance comparison of Rankine and Kalina style configurations
Figures
(11)
Tables
(16)