-
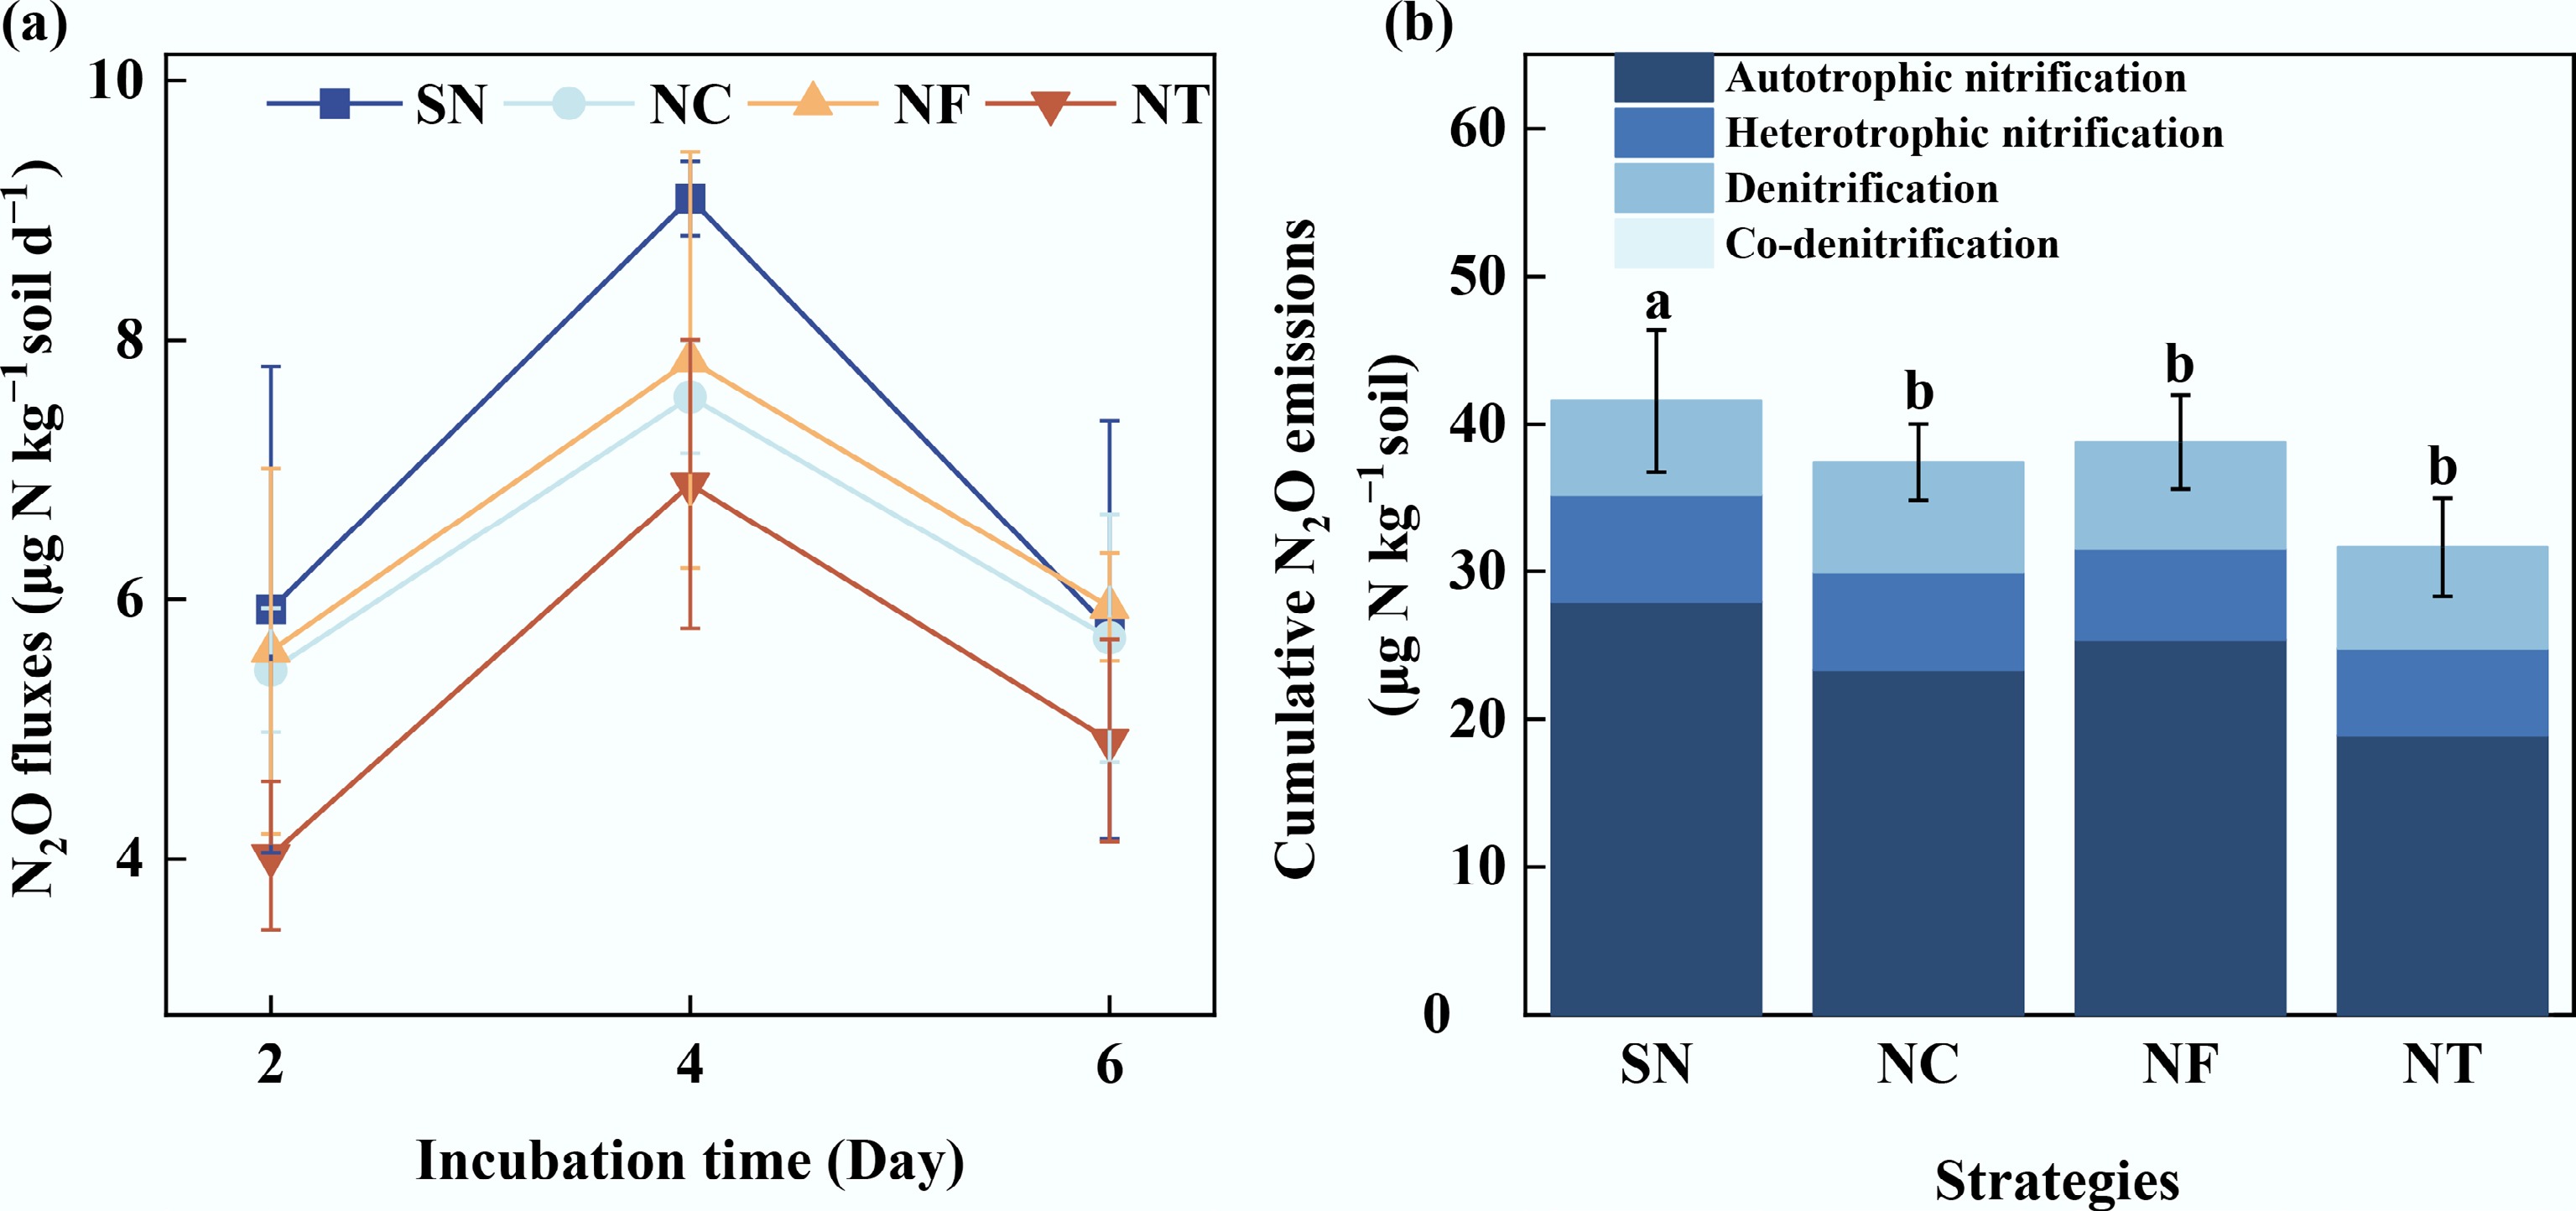
Figure 1.
(a) N2O fluxes, and (b) cumulative N2O emissions via four pathways in tobacco fields under organic substitution treatments. SN: synthesized chemical fertilizer; NC: commercial organic manure substituting 15% synthesized N; NF: farmyard manure substituting 15% synthesized N; NT: bio-organic (Trichoderma viride Pers.) manure substituting 15% synthesized N. Significant differences among treatments are denoted by different letters (one-way ANOVA, Duncan's multiple range test, p < 0.05).
-
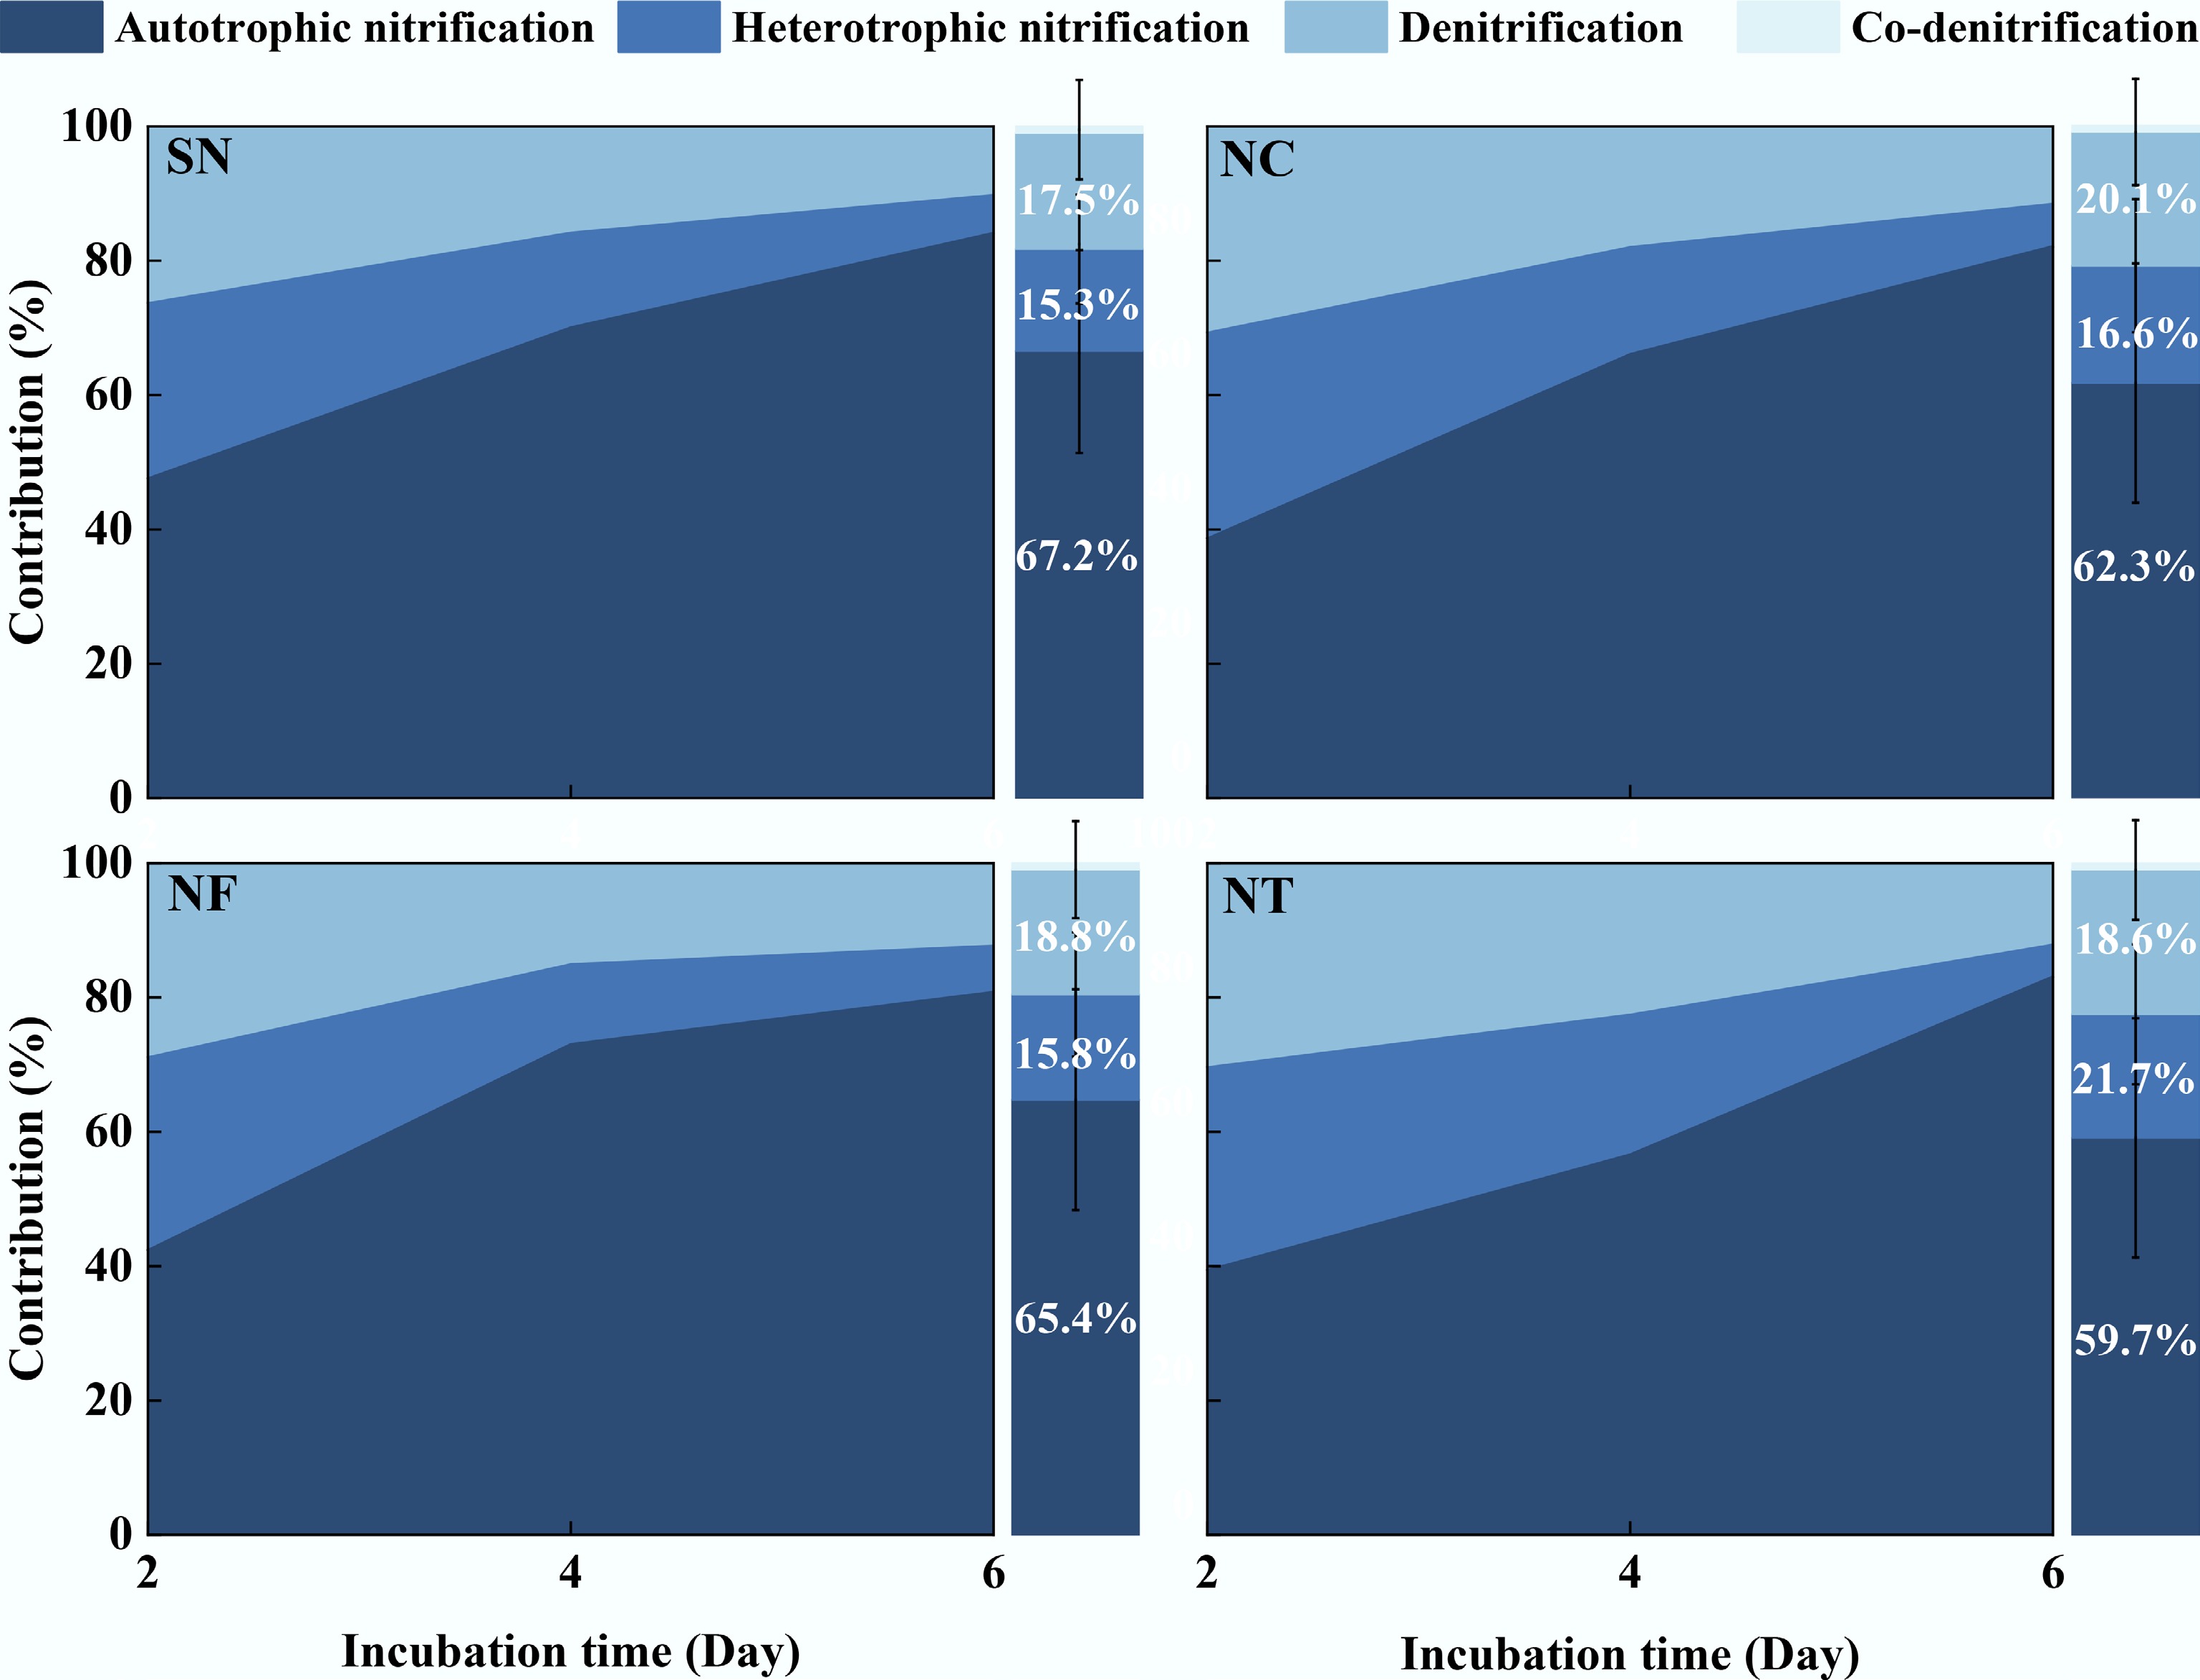
Figure 2.
N2O emission pathways and their average contributions in tobacco fields under organic substitution treatments. SN: synthesized chemical fertilizer; NC: commercial organic manure substituting 15% synthesized N; NF: farmyard manure substituting 15% synthesized N; NT: bio-organic (Trichoderma viride Pers.) manure substituting 15% synthesized N.
-
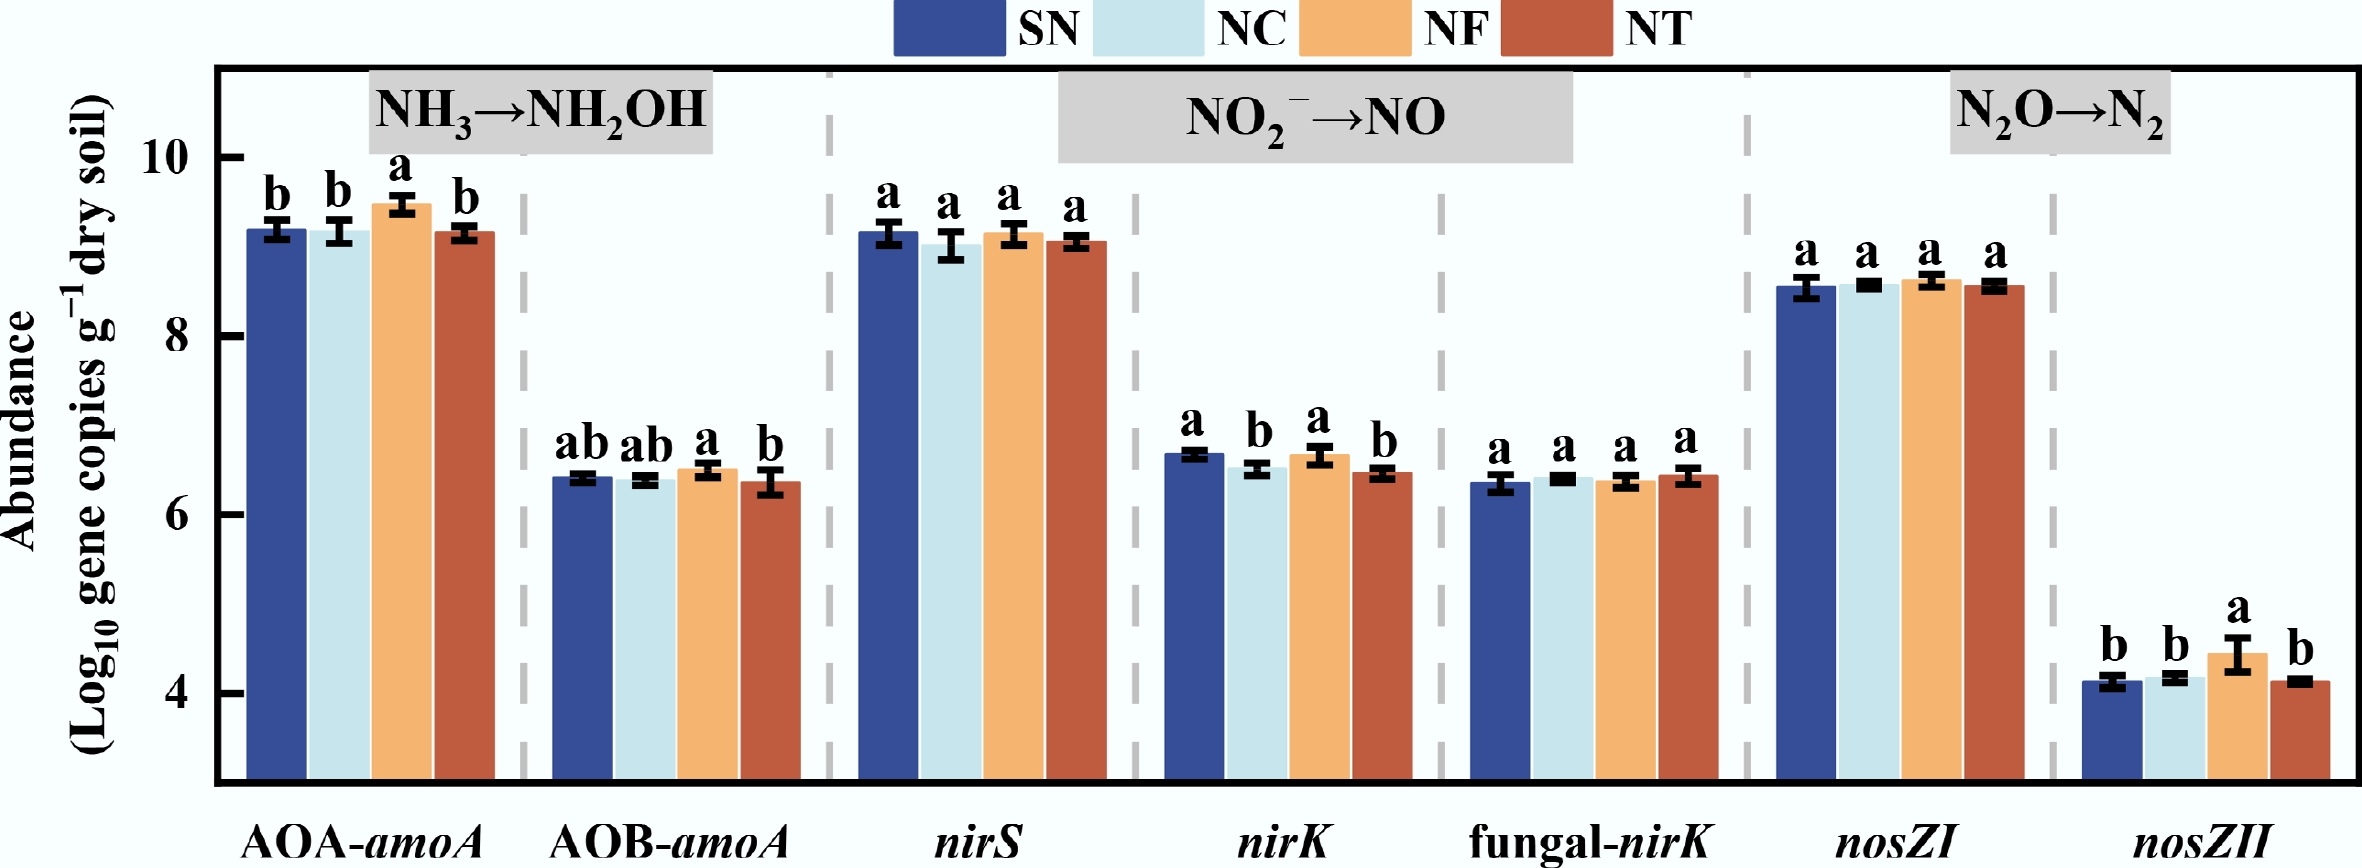
Figure 3.
Log10-transformed gene copy numbers of soil functional genes (AOA-amoA, AOB-amoA, nirS, nirK, fungal-nirK, nosZI, and nosZII) after 144 h of incubation under different organic substitution treatments. SN: synthesized chemical fertilizer; NC: commercial organic manure substituting 15% synthesized N; NF: farmyard manure substituting 15% synthesized N; NT: bio-organic (Trichoderma viride Pers.) manure substituting 15% synthesized N. Significant differences among treatments are denoted by different letters (one-way ANOVA, Duncan's multiple range test, p < 0.05).
-
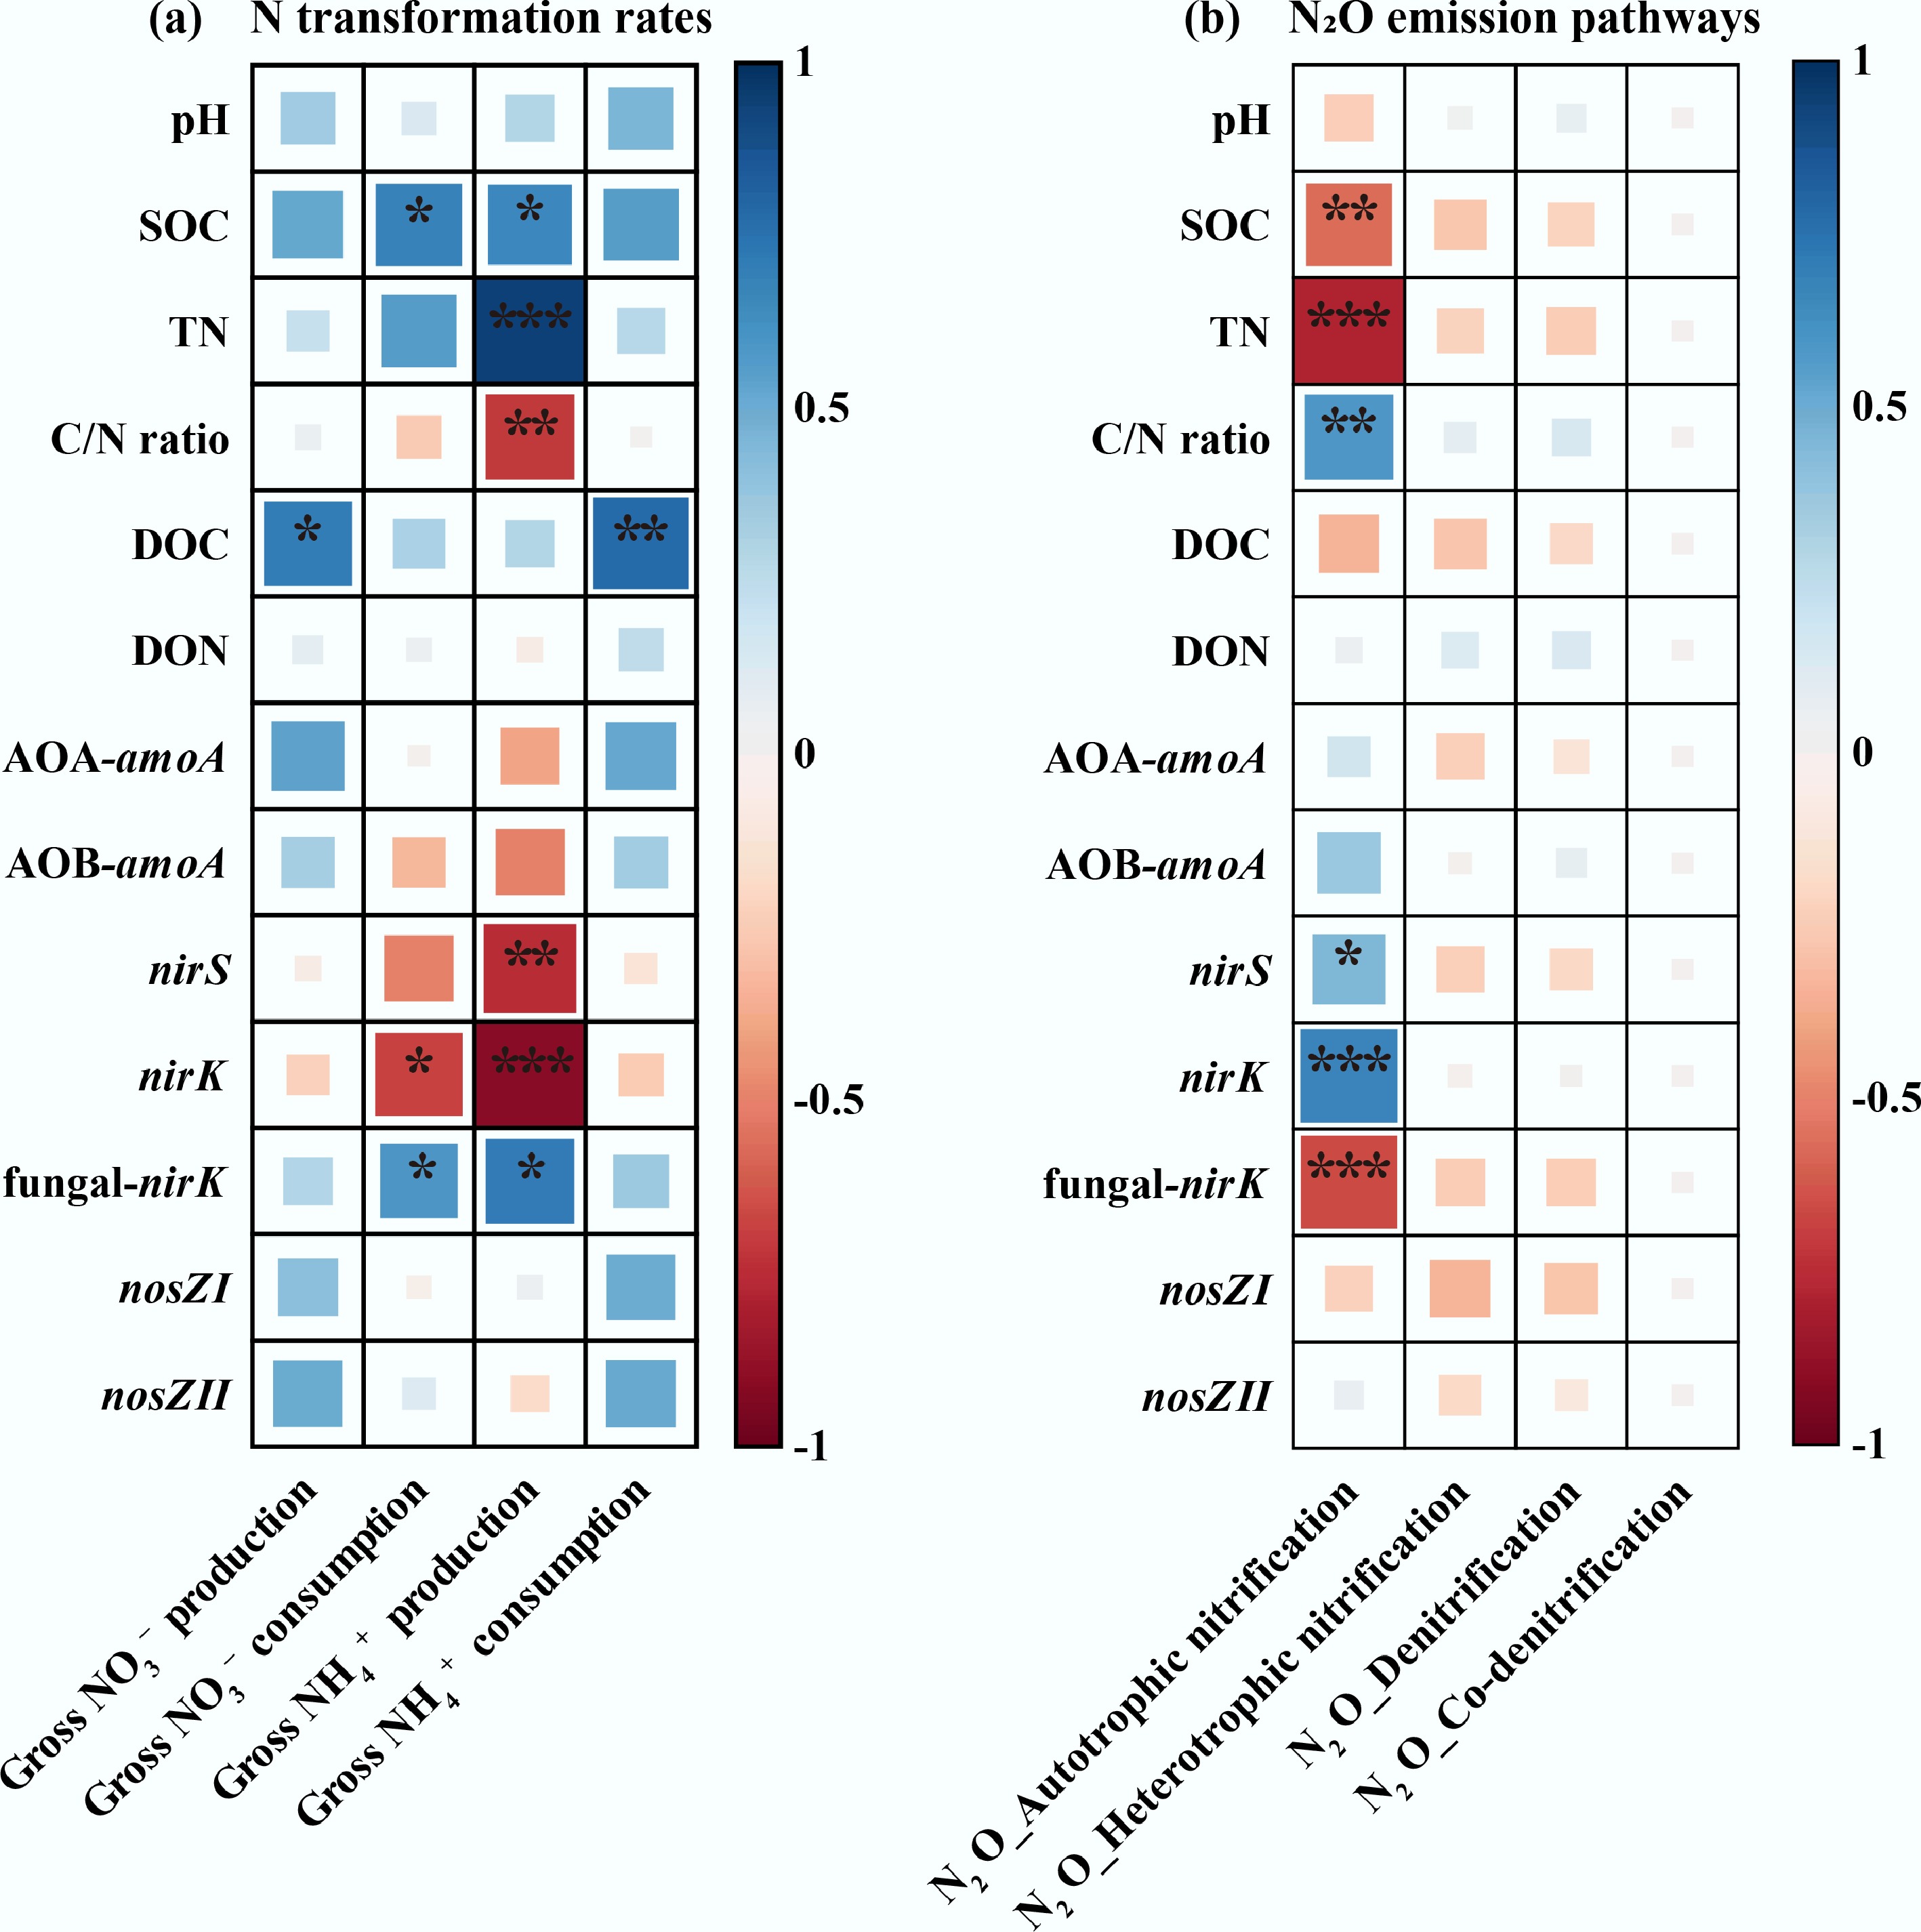
Figure 4.
Heatmap of Pearson's correlation matrix between soil biochemical characteristics and gross NH4+ and NO3− (a) production and consumption rates, and (b) cumulative N2O emissions via pathways in tobacco soils. SN: synthesized chemical fertilizer; NC: commercial organic manure substituting 15% synthesized N; NF: farmyard manure substituting 15% synthesized N; NT: bio-organic (Trichoderma viride Pers.) manure substituting 15% synthesized N. * indicates significance at p < 0.05; ** indicates significance at p < 0.01; *** indicates significance at p < 0.001.
-
Treatment pH SOC (g kg−1) TN (g kg−1) C/N ratio DOC (mg kg−1) DON (mg kg−1) SN 5.87 ± 0.02a 20.05 ± 2.25b 1.44 ± 0.09b 15.42 ± 2.06ab 21.29 ± 1.06b 24.37 ± 1.67a NC 6.41 ± 0.50a 22.83 ± 0.99ab 1.80 ± 0.16a 12.78 ± 1.44b 25.68 ± 0.13ab 28.93 ± 4.48a NF 6.45 ± 0.49a 23.57 ± 2.08ab 1.42 ± 0.05b 16.56 ± 1.33a 28.73 ± 1.06a 27.62 ± 0.58a NT 6.33 ± 0.52a 25.79 ± 0.20a 1.99 ± 0.14a 13.03 ± 0.84b 25.54 ± 4.26ab 25.98 ± 0.58a pH: soil potential of hydrogen; SOC: soil organic carbon; TN: total nitrogen; C/N ratio: SOC/TN ratio; DOC: dissolved organic carbon; DON: dissolved organic nitrogen; SN: synthesized chemical fertilizer; NC: commercial organic manure substituting 15% synthesized N; NF: farmyard manure substituting 15% synthesized N; NT: bio-organic (Trichoderma viride Pers.) manure substituting 15% synthesized N. Significant differences among treatments are denoted by different letters (one-way ANOVA, Duncan's multiple range test, p < 0.05). Table 1.
Soil physicochemical characteristics (mean ± SD) under different organic substitution treatments
-
N transformation rate SN (mg N kg−1
soil d−1)Contribution NC (mg N kg−1
soil d−1)Contribution NF (mg N kg−1
soil d−1)Contribution NT (mg N kg−1
soil d−1)Contribution Gross NO3− production 6.00 ± 0.04d 6.43 ± 0.14c 7.43 ± 0.13a 7.21 ± 0.04b Autotrophic nitrification 3.90 ± 0.13c 65.0% 4.07 ± 0.02c 63.4% 4.68 ± 0.14b 63.0% 5.39 ± 0.01a 74.8% Heterotrophic nitrification 2.10 ± 0.17c 35.0% 2.35 ± 0.15b 36.6% 2.74 ± 0.07a 37.0% 1.82 ± 0.03d 25.2% Gross NO3− consumption 2.88 ± 0.05b 3.14 ± 0.10b 3.18 ± 0.38b 3.58 ± 0.01a DNRA 0.32 ± 0.08c 11.1% 0.47 ± 0.05b 15.1% 0.52 ± 0.03b 16.5% 1.25 ± 0.02a 34.9% NO3− immobilization 2.54 ± 0.04a 88.1% 1.82 ± 0.10c 57.8% 2.19 ± 0.05b 68.7% 2.27 ± 0.05b 63.3% Gross NH4+ production 0.88 ± 0.04d 1.21 ± 0.04b 1.01 ± 0.03c 1.37 ± 0.01a DNRA 0.32 ± 0.08c 36.4% 0.47 ± 0.05b 39.3% 0.52 ± 0.03b 51.8% 1.25 ± 0.02a 90.9% Mineralization 0.56 ± 0.04b 63.6% 0.73 ± 0.03a 60.7% 0.49 ± 0.06c 48.2% 0.13 ± 0.00d 9.1% Gross NH4+ consumption 6.14 ± 0.10d 6.50 ± 0.03c 6.96 ± 0.02a 6.81 ± 0.02b Autotrophic nitrification 3.89 ± 0.14c 63.5% 4.07 ± 0.02c 62.6% 4.68 ± 0.14b 67.3% 5.39 ± 0.01a 79.2% NH4+ immobilization 1.30 ± 0.03a 21.0% 1.16 ± 0.12ab 17.9% 1.07 ± 0.05b 15.4% 1.17 ± 0.04ab 17.2% Nitrate nitrogen: NO3−; ammonium nitrogen: NH4+; dissimilatory nitrate reduction to ammonium: DNRA; SN: synthesized chemical fertilizer; NC: commercial organic manure substituting 15% synthesized N; NF: farmyard manure substituting 15% synthesized N; NT: bio-organic (Trichoderma viride Pers.) manure substituting 15% synthesized N. Significant differences among treatments are denoted by different letters (one-way ANOVA, Duncan's multiple range test, p < 0.05). Table 2.
The average gross NH4+ and NO3− production and consumption rates, along with their percentage contributions to the total N pool production or consumption, under different organic substitution treatments at incubation times ranging from 0.5 to 144 h
Figures
(4)
Tables
(2)