-
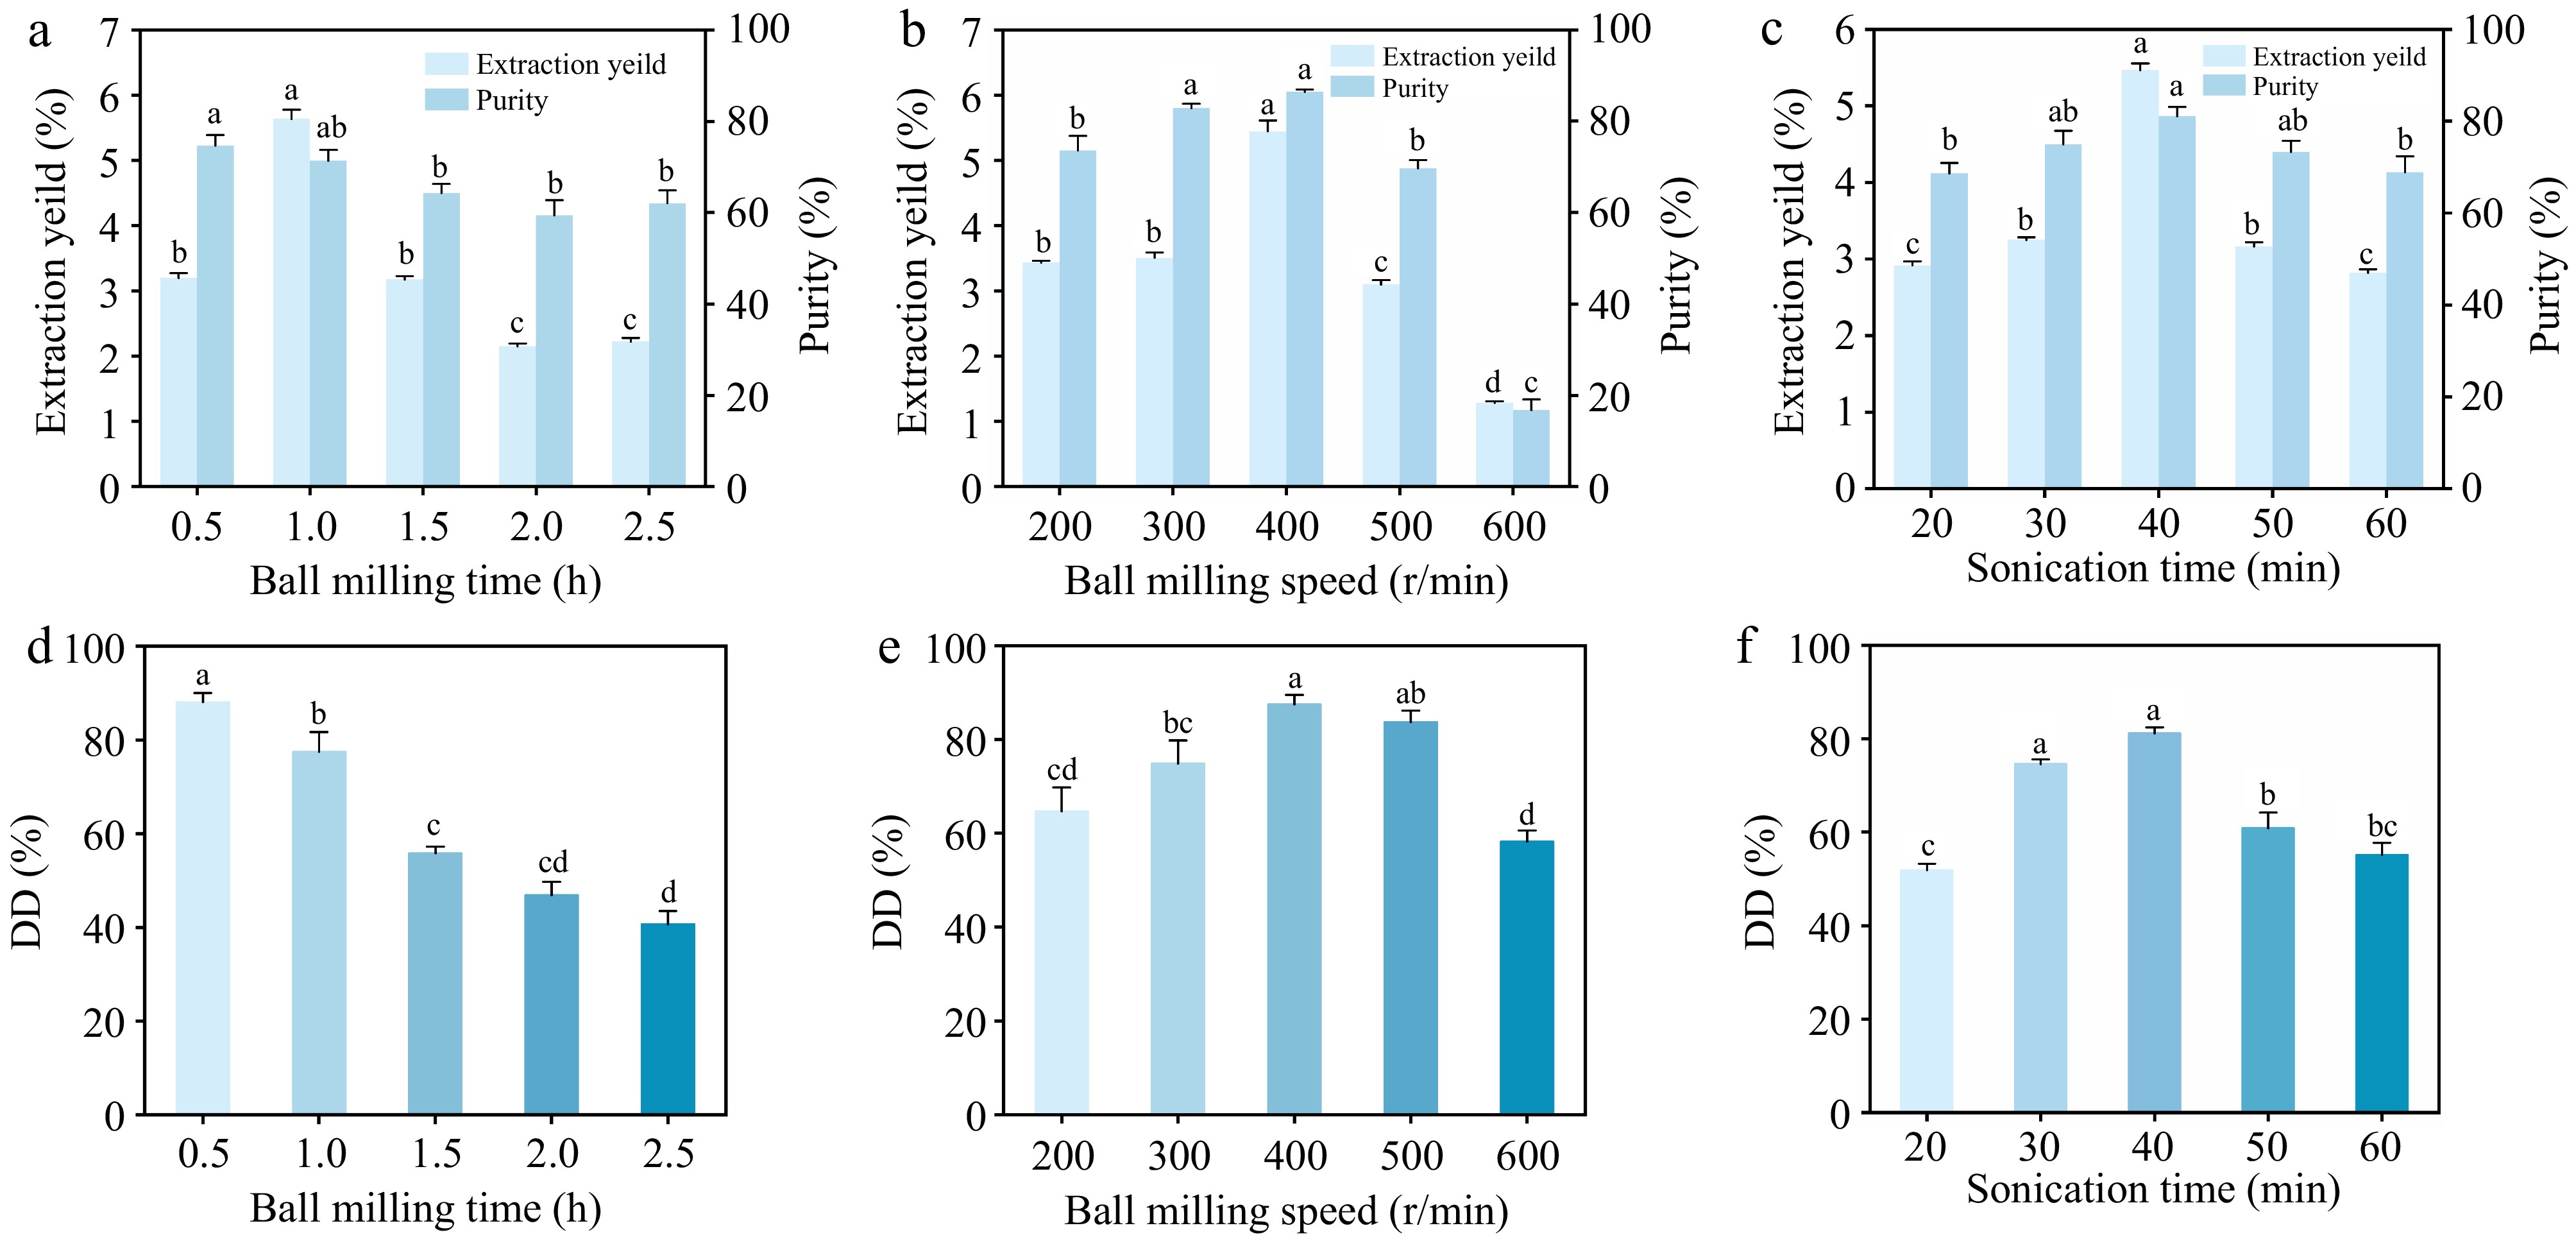
Figure 1.
Effects of (a) ball-milling time, (b), ball-milling speed, and (c) sonication time on the extraction yield and purity of chitosan products. Effects of (d) ball milling time, (e) ball-milling speed, and (f) sonication time on the DD of chitosan products. The letters a, b, c, and d denote the significance level α = 0.05.
-
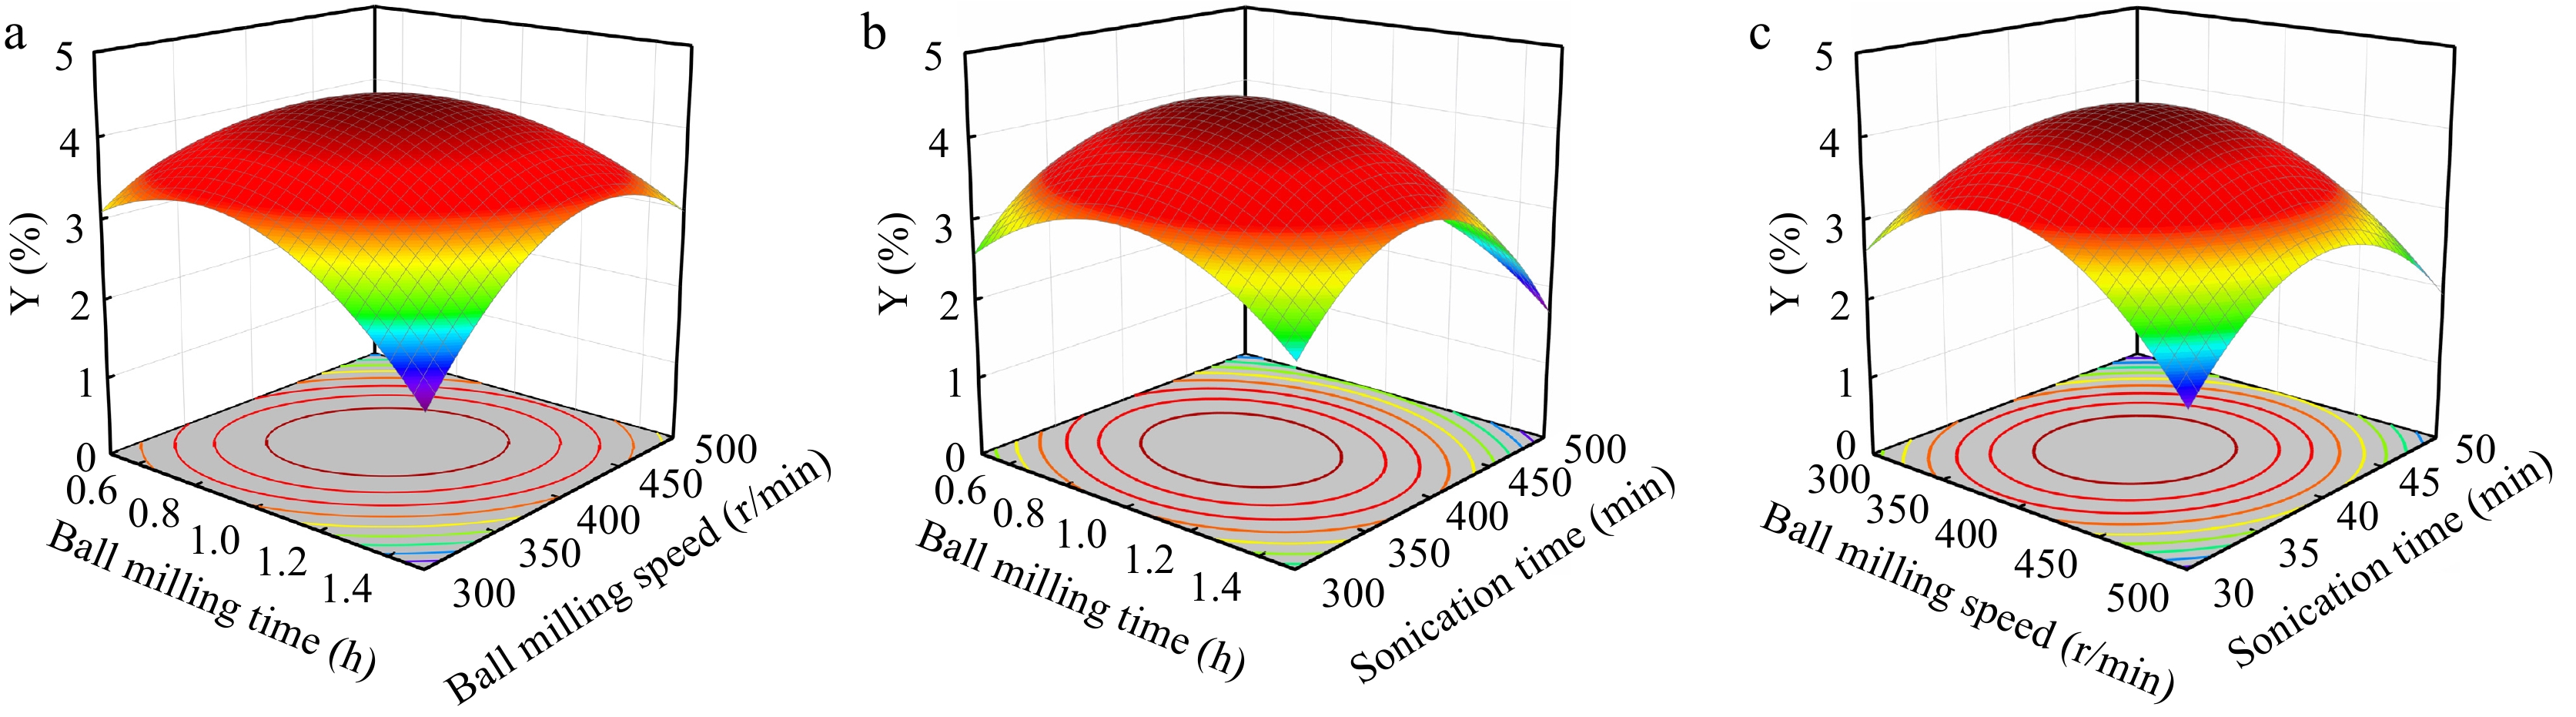
Figure 2.
Three-dimensional surface diagrams of factor interactions: (a) ball milling time and ball milling speed; (b) ball milling time and sonication time; (c) ball milling speed and sonication time.
-
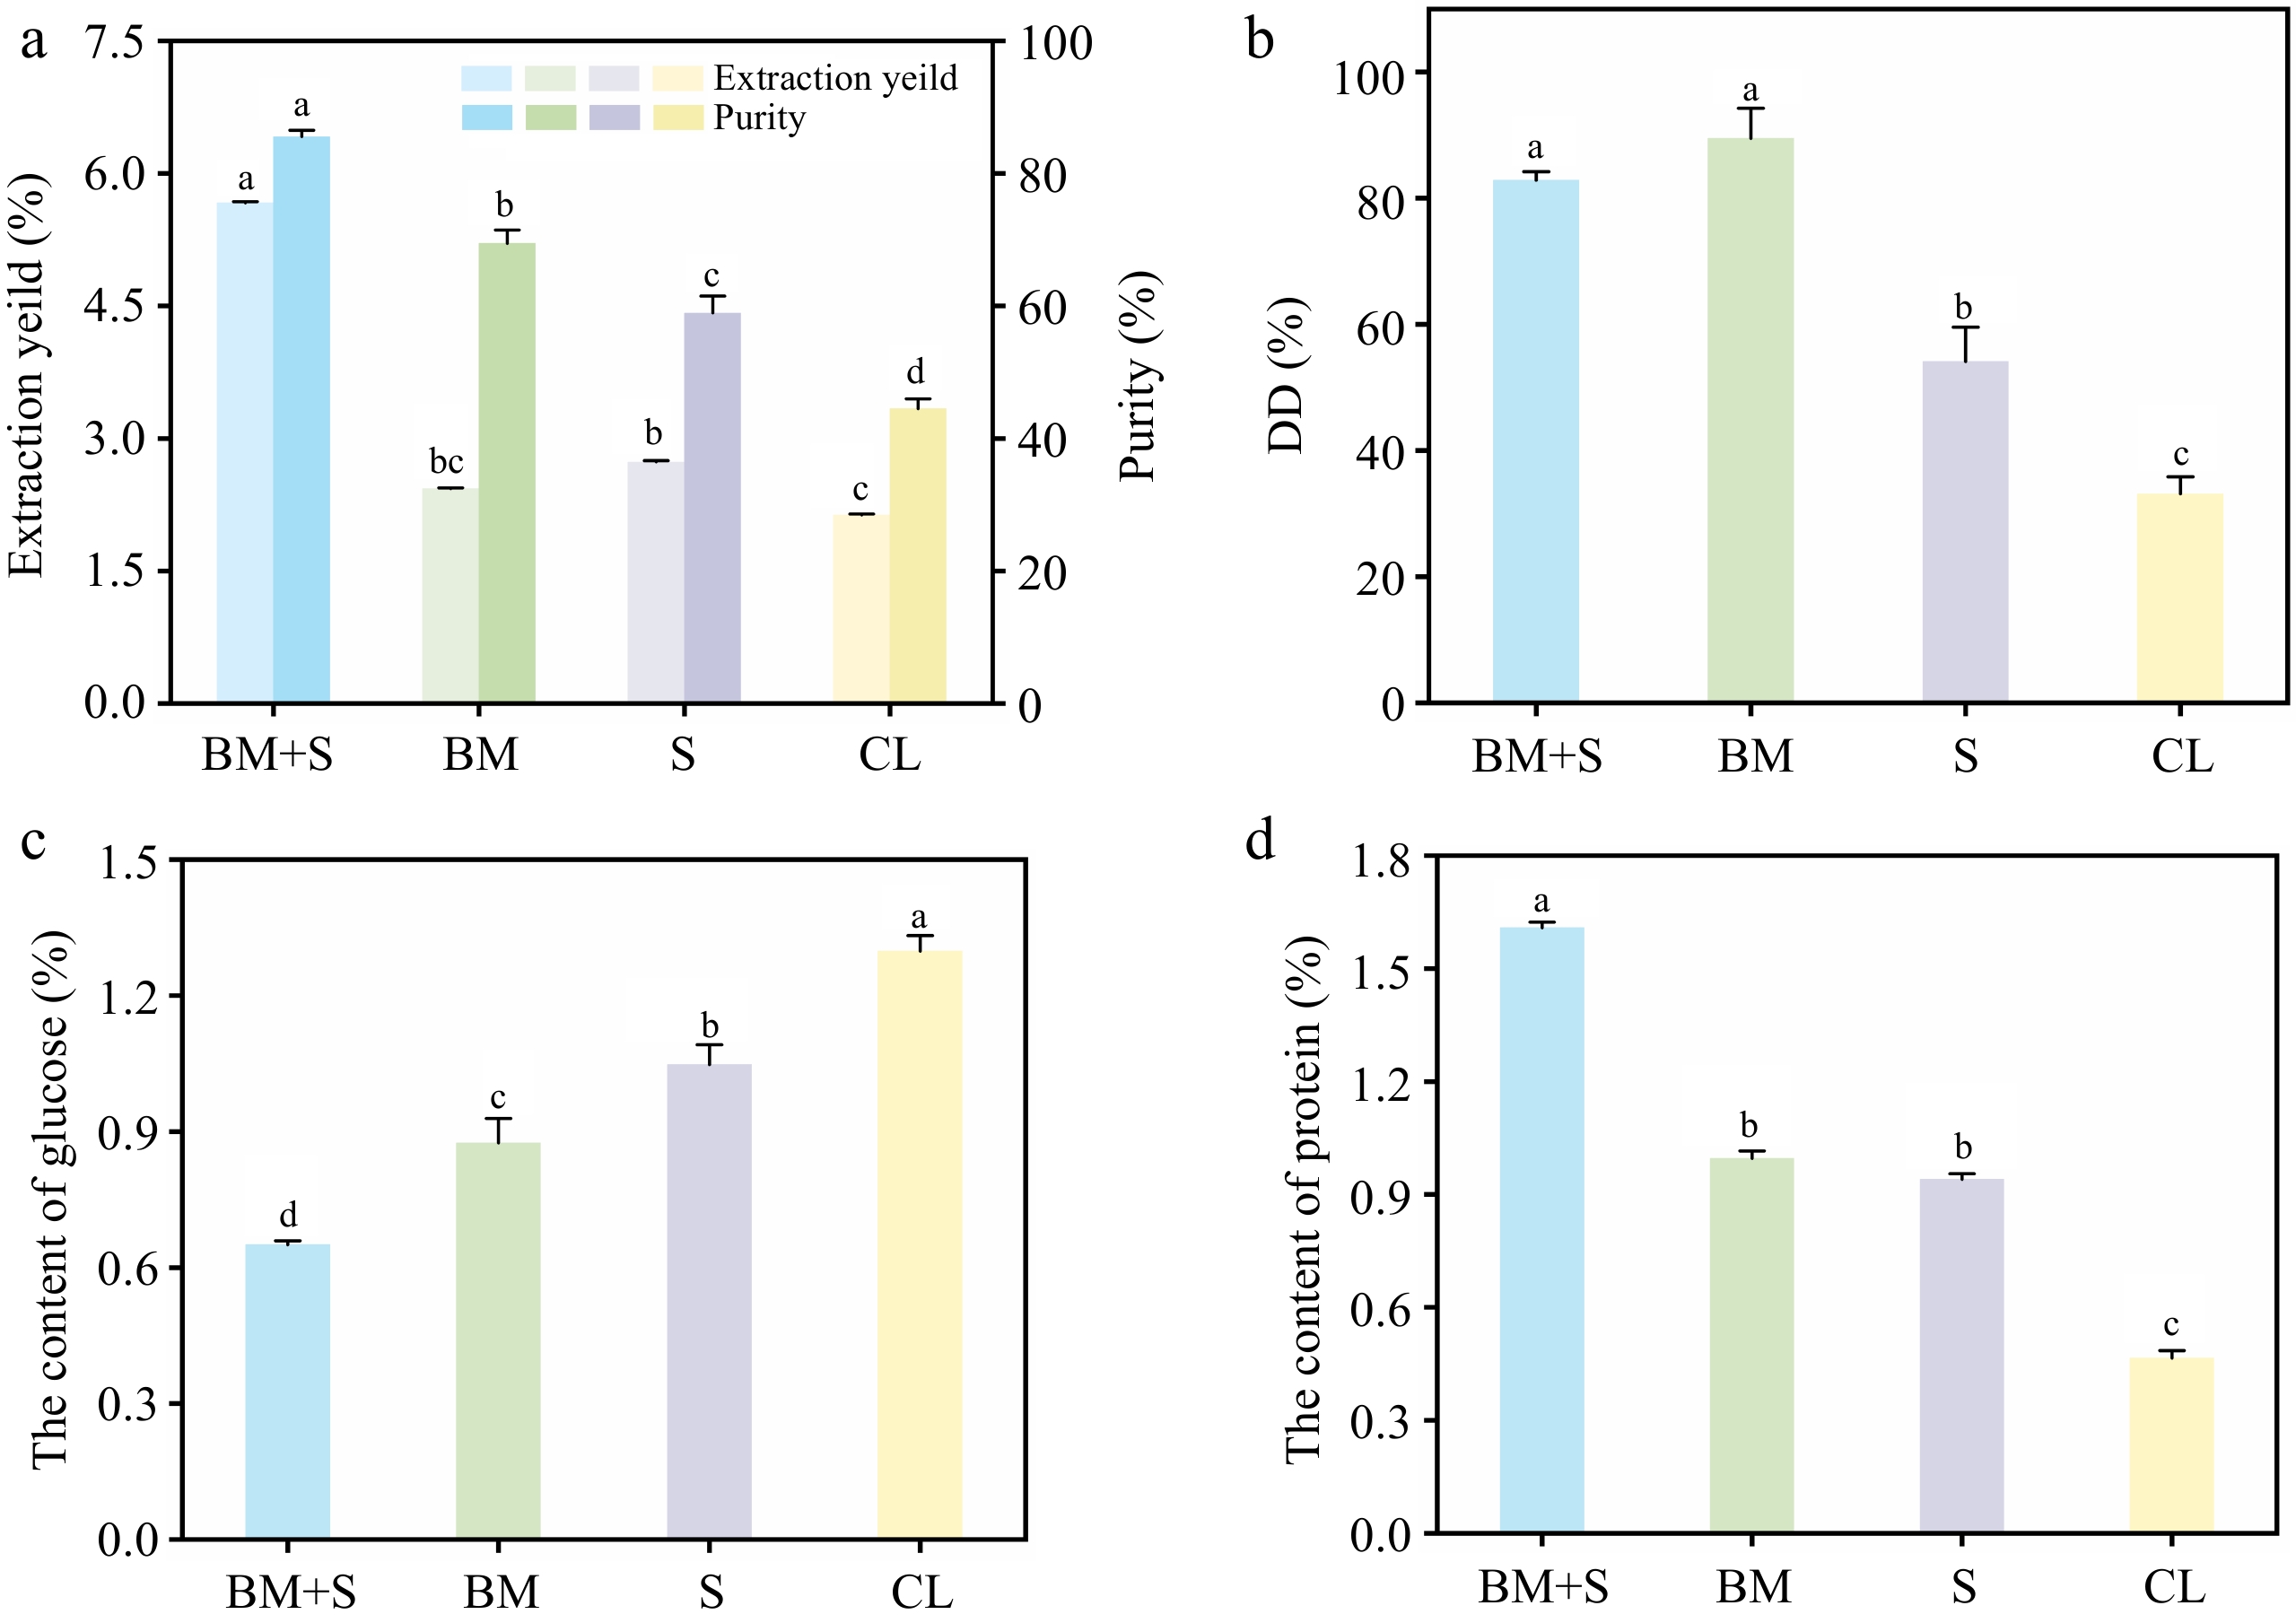
Figure 3.
(a) Extraction yield and purity, (b) DD values, (c) protein content, and (d) glucan content of the different chitosan products. The letters a, b, c, and d denote the significance level α = 0.05.
-
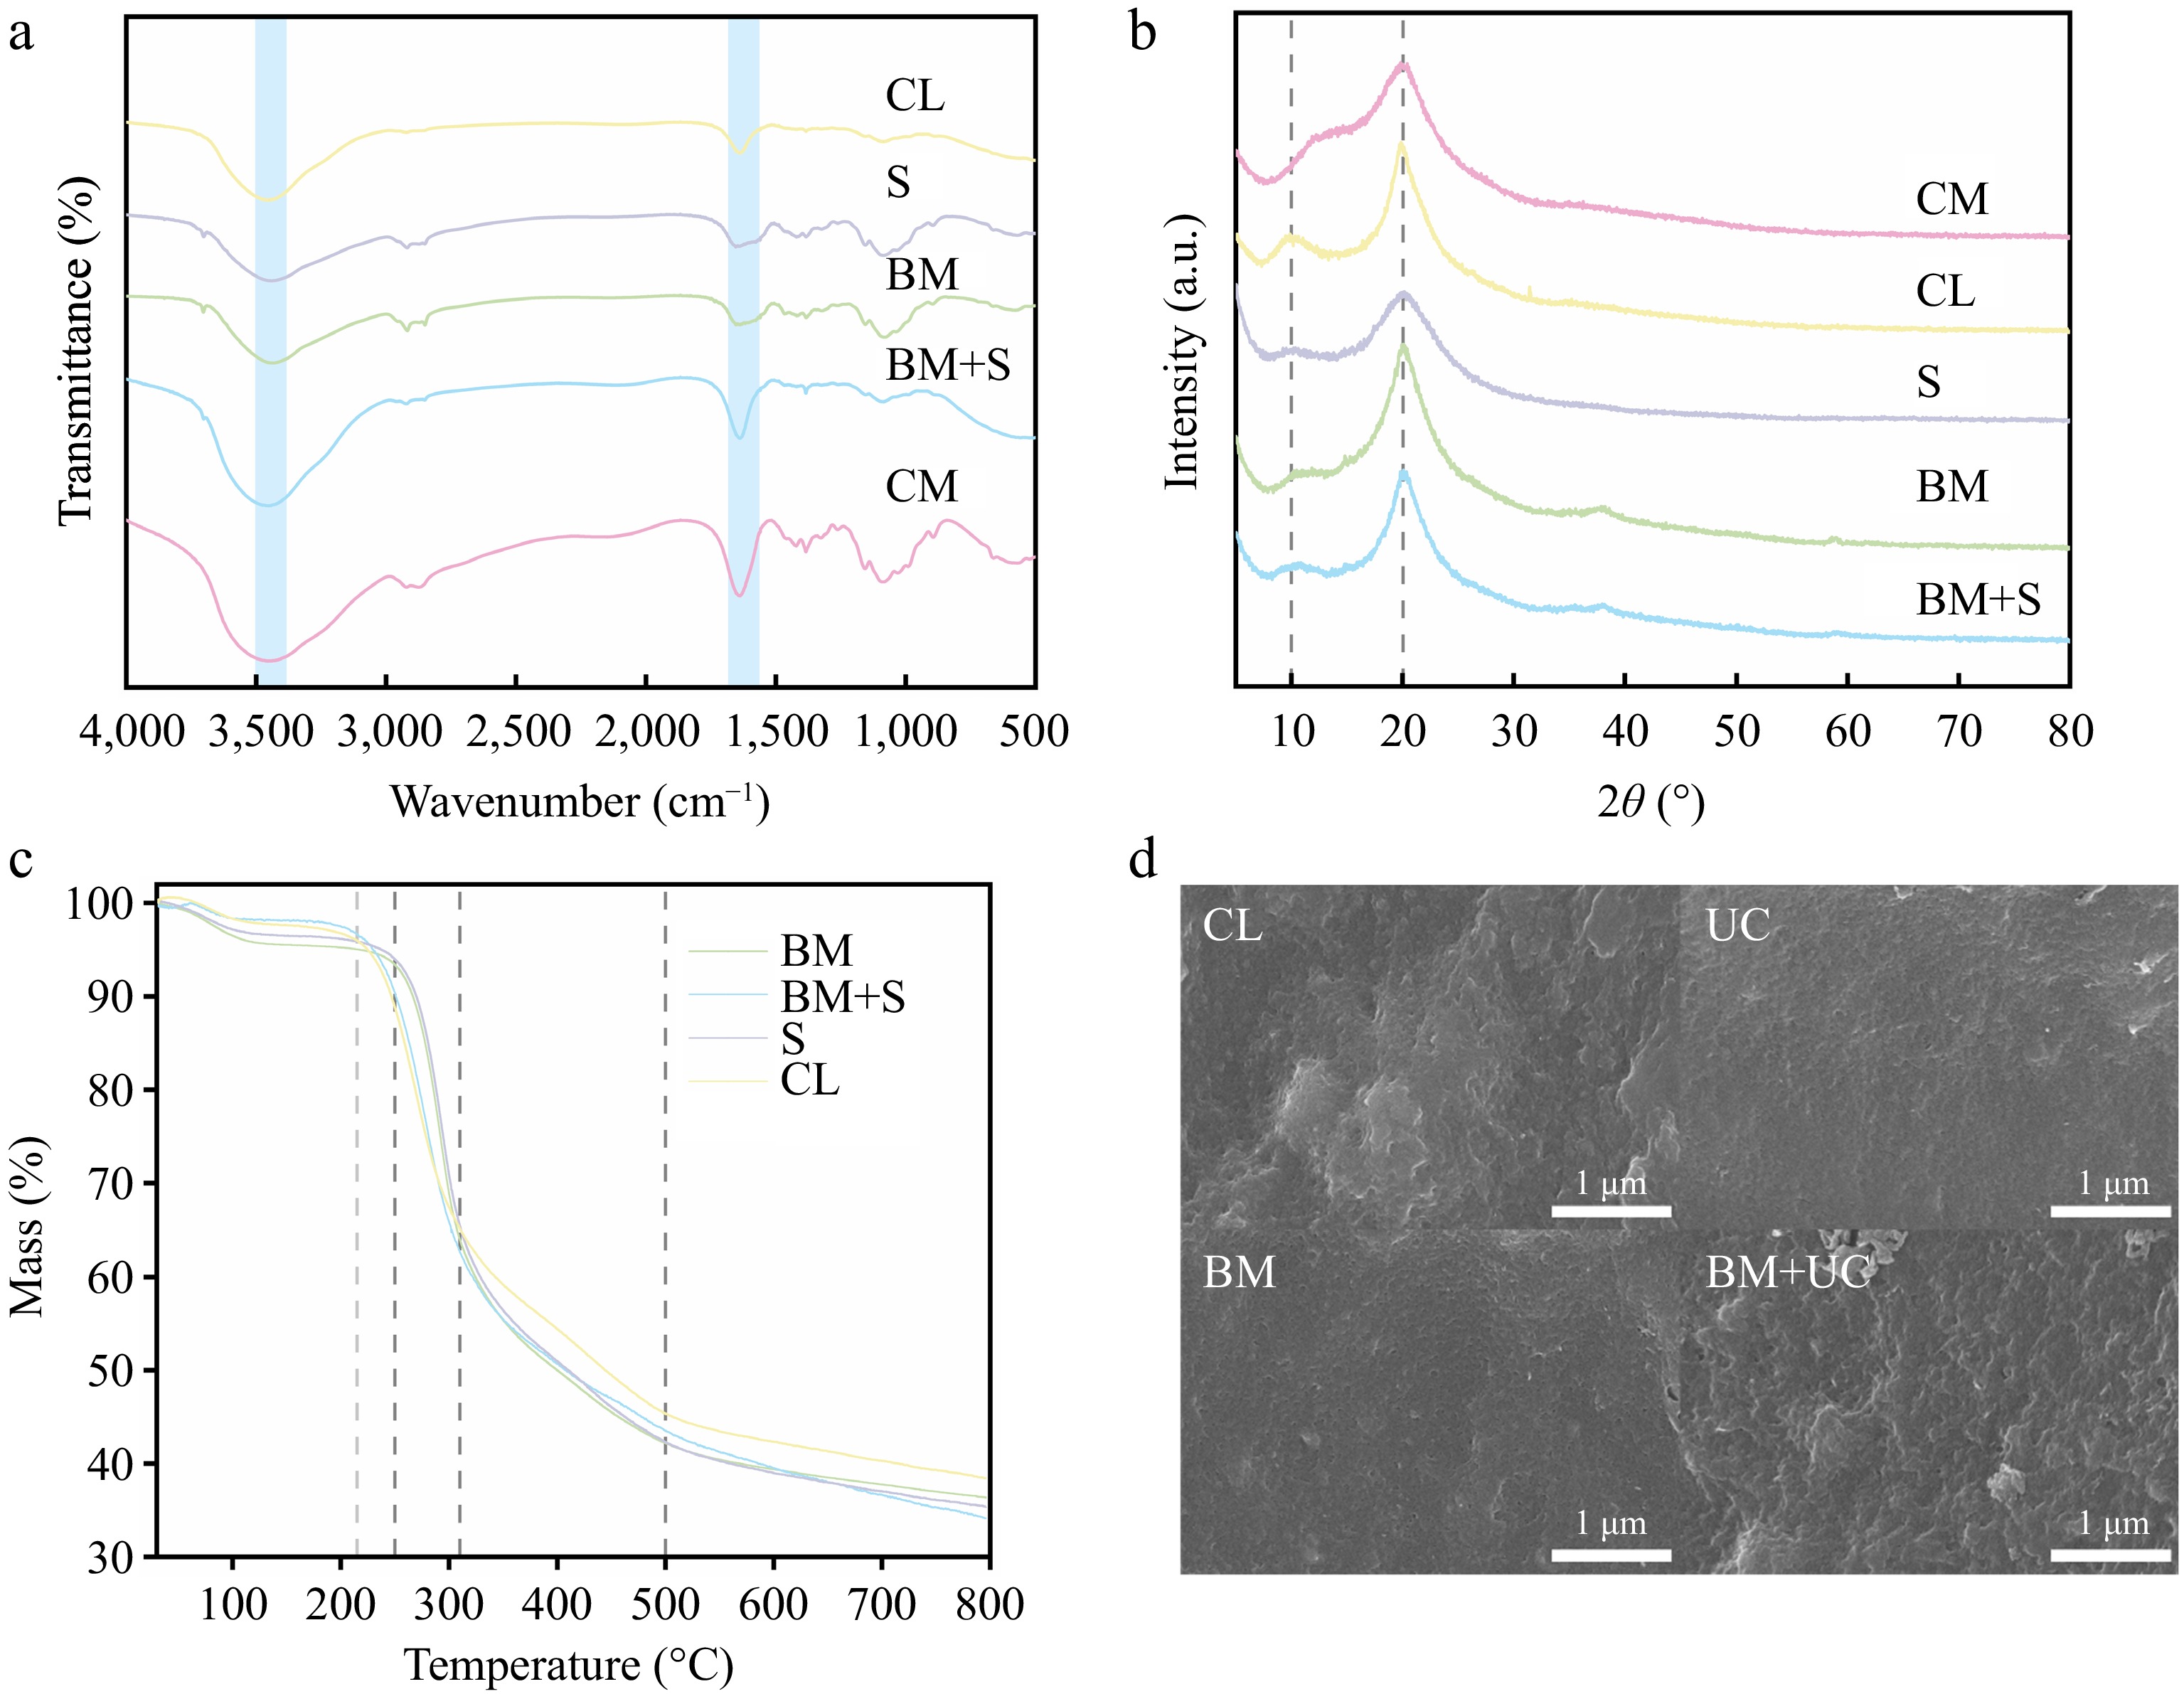
Figure 4.
(a) FTIR, and (b) XRD spectra of all chitosan extracts of Agaricus bisporus and CM chitosan; (c) TGA, and (d) SEM spectra of all chitosan extracts of Agaricus bisporus.
-
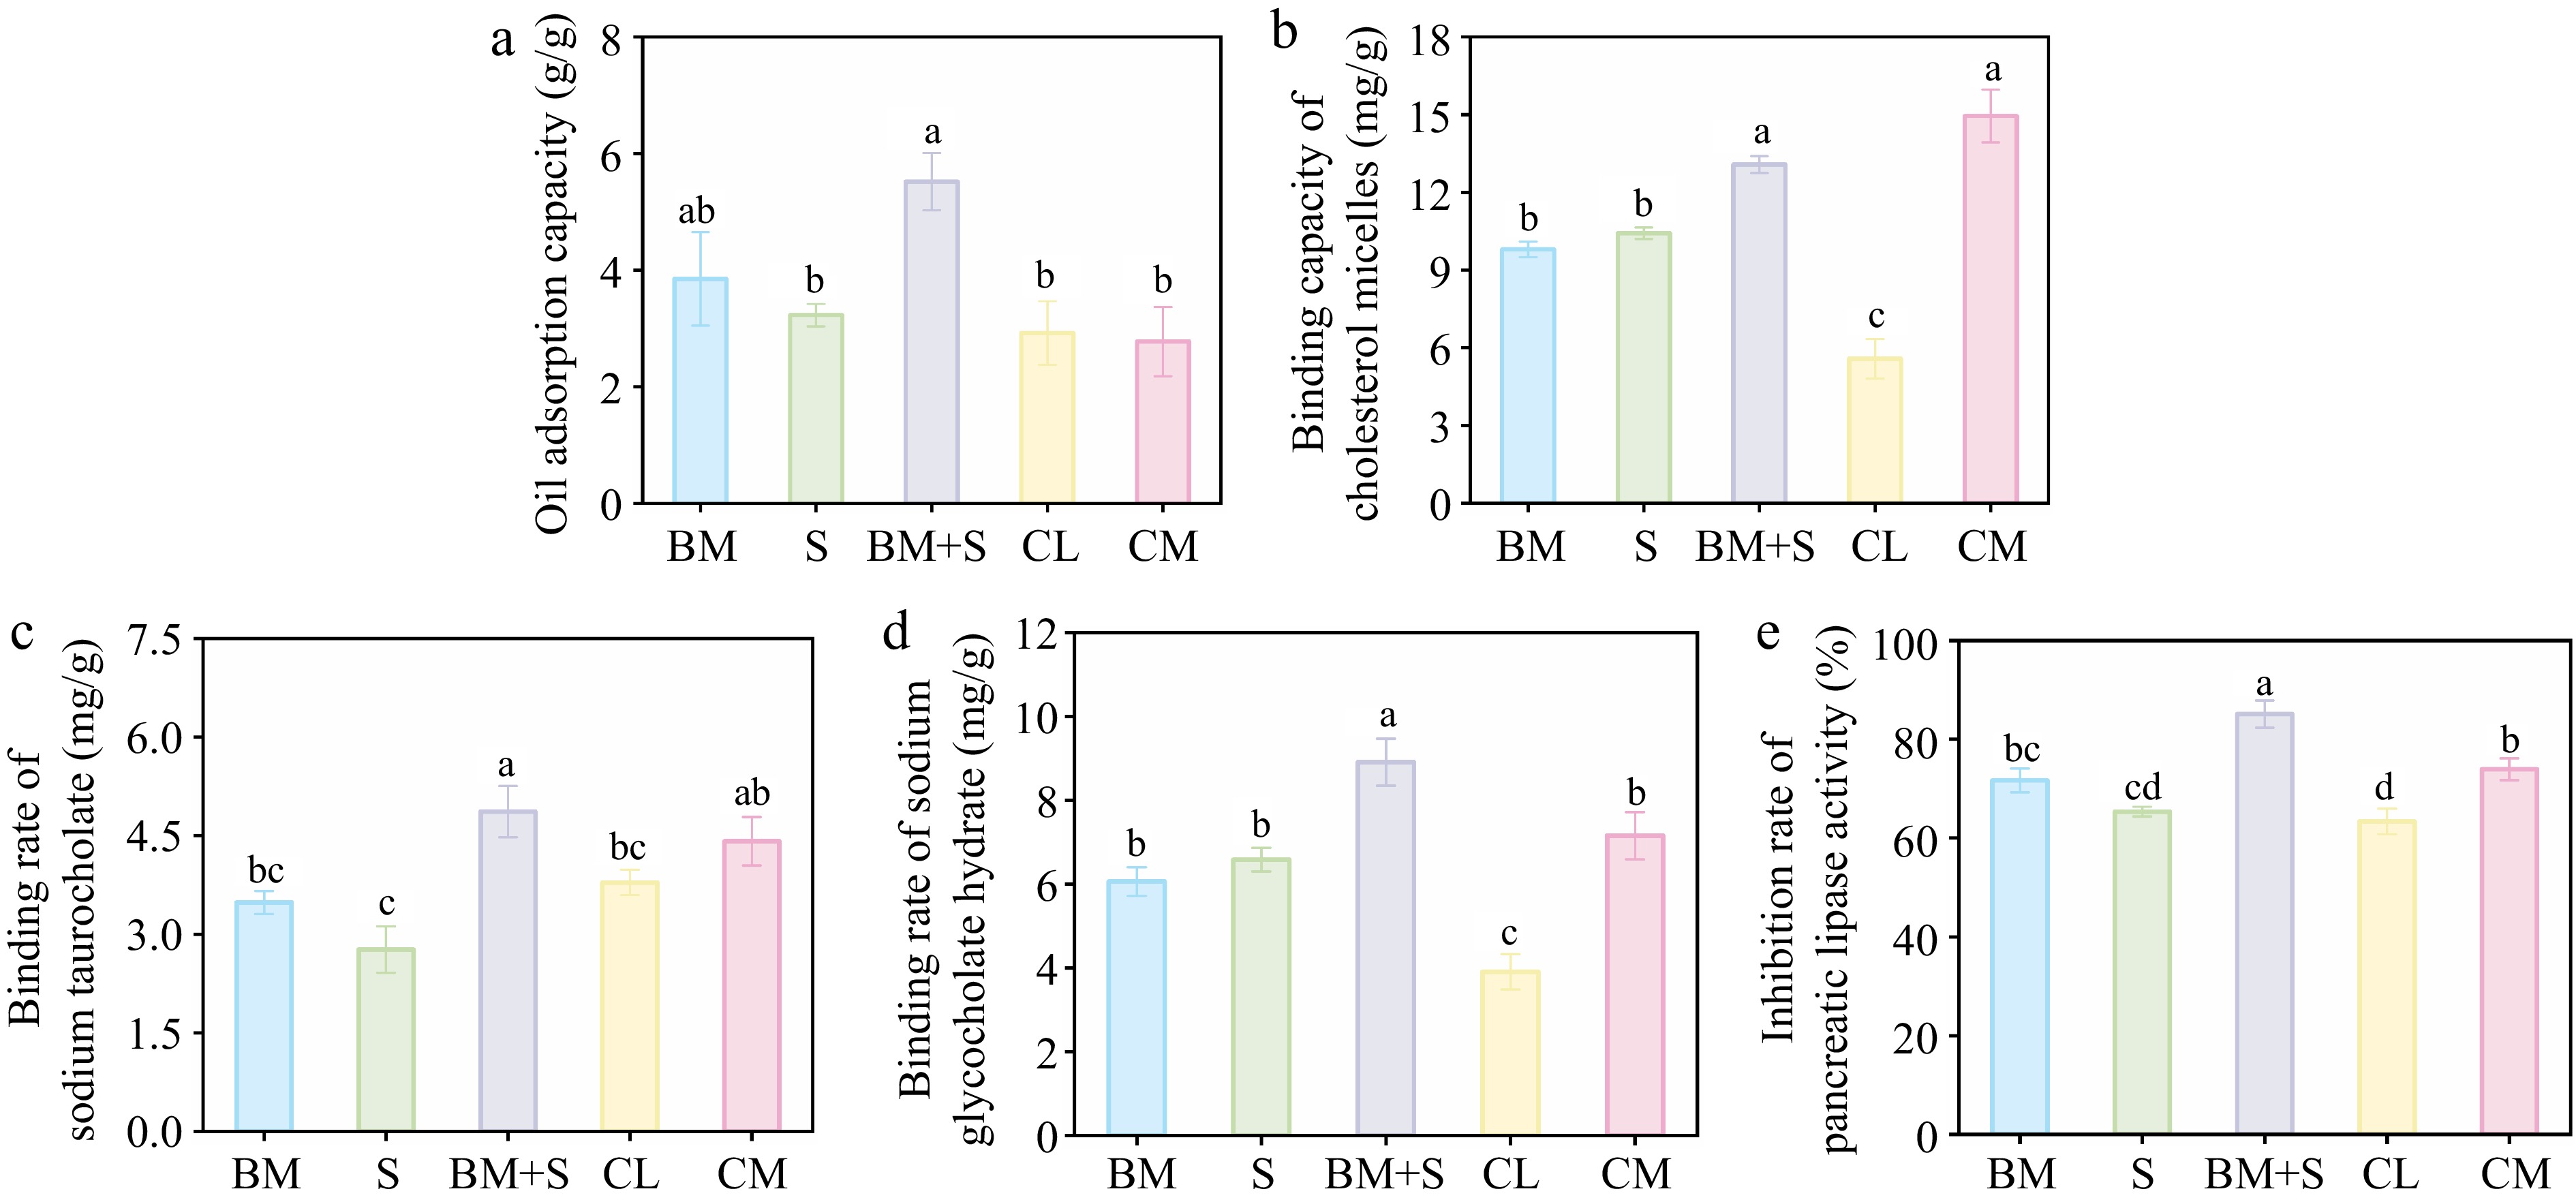
Figure 5.
(a) The oil absorption capacity. Binding capacity of (b) cholesterol micelles, (c) sodium taurocholate, (d) sodium glycocholate hydrate, and (e) inhibition rate of pancreatic lipase of different chitosan products. The letters a, b, c, and d denote the significance level α = 0.05.
-
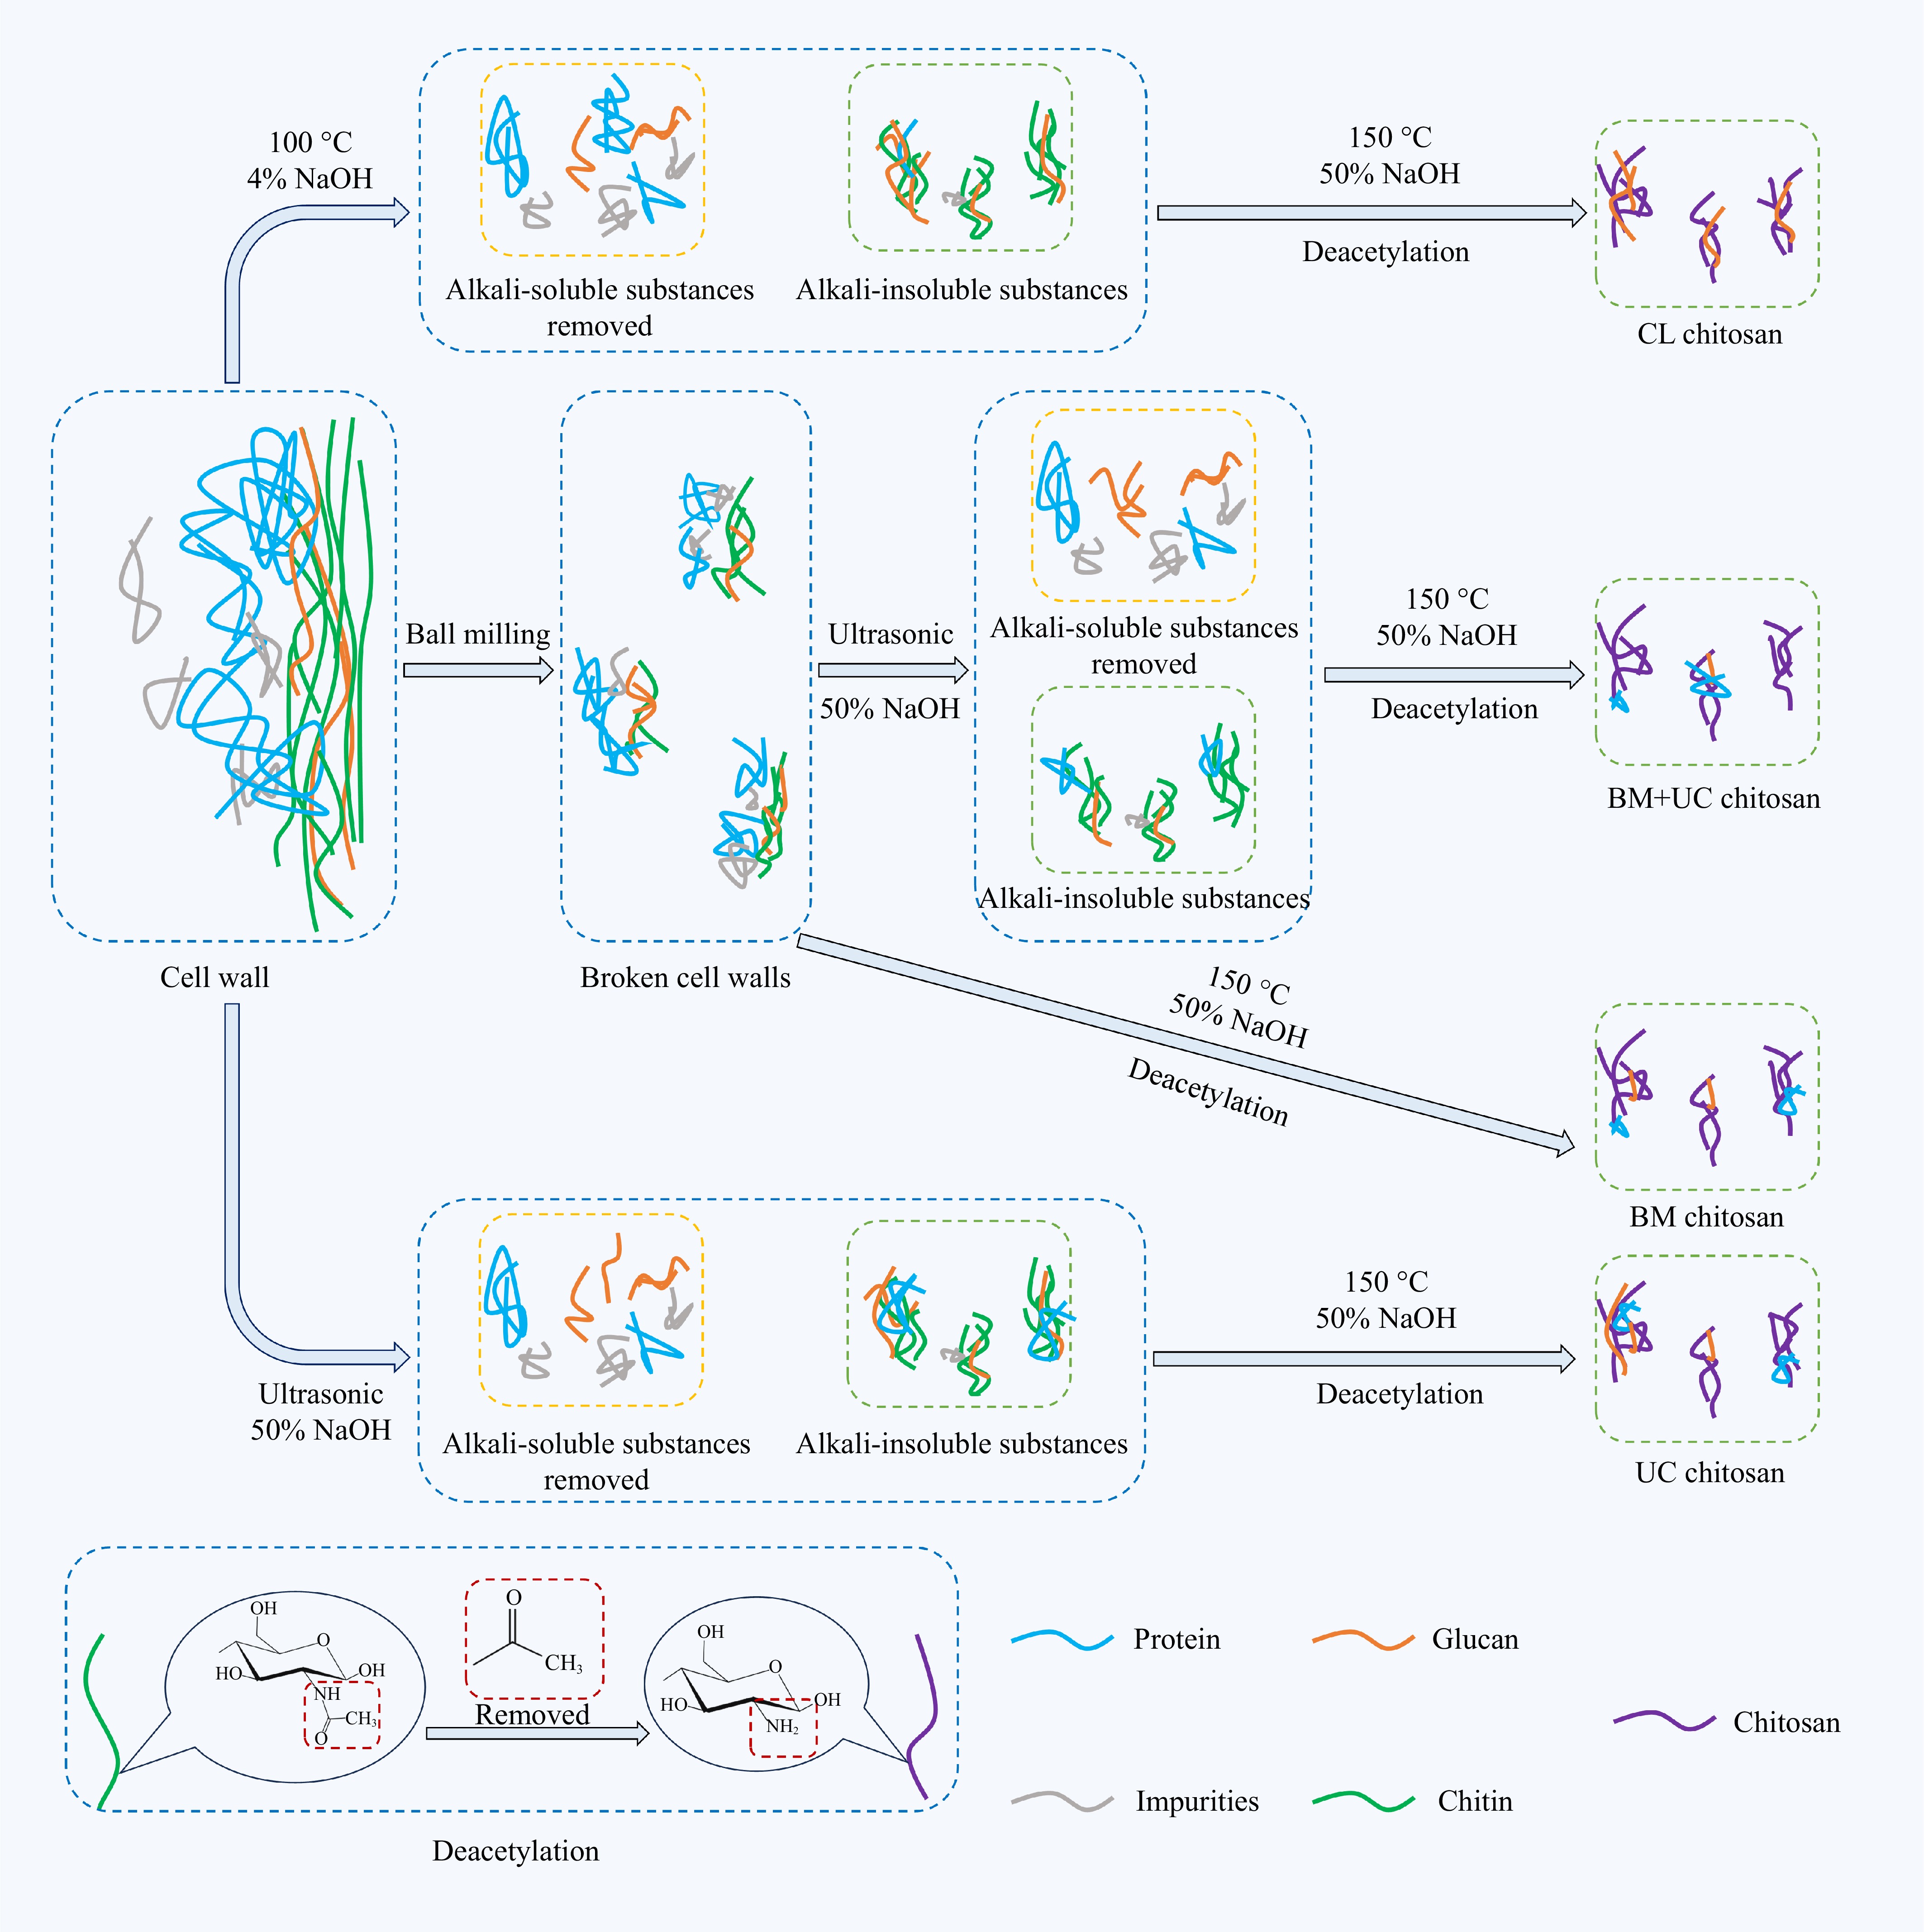
Figure 6.
Potential changes in chitin, glucan, and protein within the cell walls of Agaricus bisporus during different extraction processes.
-
Sample CrI (%) BM chitosan 47.71 CL chitosan 51.38 BM + S chitosan 48.85 S chitosan 36.17 CM chitosan 30.70 Table 1.
CrI of different chitosan samples.
Figures
(6)
Tables
(1)