


-
Agaricus bisporus, commonly referred to as the white mushroom, is a prominent species in the global food market, accounting for approximately 30% of the world's total mushroom production[1]. It is notable for its high protein and low fat content, in addition to its relatively high carbohydrate content, which includes the presence of chitin[2]. Edible fungal cell walls contain high levels of chitin, which is typically covalently linked to β-glucan and is a constituent of complex biopolymer networks[3]. It has been estimated that in industrial production processes, the waste biomass of Agaricus bisporus, inclusive of irregularly sized and shaped ascospores, can reach 50,000 t per year. The extraction of chitin from the specified waste biomass has the potential to yield a production capacity of up to 1,000 t per year[4]. Consequently, Agaricus bisporus waste biomass exhibits considerable potential for chitin production. Chitin, the second largest biopolymer in nature, and a major structural component of many organisms, consists mainly of N-acetyl-d-glucosamine units linked to a small number of deacetylated monomeric units via a 1,4-β-glycosidic bond[5]. Chitosan is the only cationic polysaccharide in nature, and is one of the important derivatives of chitin, obtained through a process of deacetylation, which has been widely used in the fields of biomedicine and food packaging[6]. In addition, the lipid-binding activity of chitosan has been verified. In the acidic environment of gastric juice, dissolved chitosan has been observed to attract negatively charged triglycerides, fatty acids, bile acids, and cholesterol, forming complexes and micelles[7]. The binding of chitosan to fat droplets has been demonstrated to inhibit fat absorption in the gastrointestinal tract, thereby contributing to the development of anti-obesity strategies[8].
Contrary to the high mineral and metal ion content of shrimp and crab shells, edible fungi do not require acid treatment[9]. The treatment of edible fungi with alkali to remove proteins and acetyl groups results in the production of chitin, which is notable for its absence of allergenic animal proteins[10]. However, the use of dilute alkali in the protein removal process and concentrated alkali in the deacetylation process generates large amounts of alkaline liquid, increasing environmental pressure[11]. The mechanical treatment process is devoid of chemical contamination and aligns with the principles of green extraction. Ball milling technology has gained a lot of attention in the field of carbohydrate modification and extraction pretreatment because of its ability to finely grind particles while ensuring greater safety, simplicity, cost-effectiveness, and generating fewer contaminants than other non-thermal treatments[12]. The potential of this technology to disrupt the crystallization areas of macromolecular carbohydrates has been demonstrated, with the consequent effects including improved yields of target substances[13], increased number of reaction binding sites[14], and enhanced emulsion stability[15]. Sonication technology is another mature physical auxiliary method that utilizes the cavitation effect to promote chemical reactions[16]. It has been demonstrated that the implementation of sonication technology can enhance the yield of chitosan[17,18] and exert a favorable influence on the DD of the polymer[19]. This type of mechanical processing promotes the breakdown of cell walls and the depolymerization of polysaccharides[20], potentially facilitating the separation of carbohydrates from edible fungal cells. Typically, the extraction of chitosan from fungi requires preliminary cell wall digestion using dilute alkali to obtain an alkali-insoluble material containing chitosan. Therefore, this study employs mechanical processing to preliminarily deconstruct the cell walls of edible fungi, rather than chemical treatment.
Considering the benefits of ball-milling and sonication in the extraction of bioactive substances, a combined utilization of these two techniques was selected to substitute for the conventional dilute alkali treatment followed by concentrated alkali treatment, with the objective of reducing the alkali consumption in the extraction process, while enhancing the yield of chitosan derived from Agaricus bisporus. This study aimed to optimize the process of extracting chitosan using a combination of ball-milling and sonication treatment, followed by alkaline extraction. Additionally, the composition, microstructure, thermal stability, and in vitro lipid-binding activity of chitosan products obtained via various mechanical treatment processes were evaluated to investigate the impact of these processes on the products.
-
Fresh Agaricus bisporus was purchased from the local vegetable market (Huzhou, China), dried at 65 °C, pulverized using a grinder to obtain dried Agaricus bisporus powder. Commercial (CM) chitosan, derived from shrimp shells (purity ≥ 90%, DD ≥ 95%), purchased from Shanghai Aladdin Technology Co., Ltd. All other reagents were purchased from Sinopharm Chemical Reagent Co., Ltd.
Preparation of chitosan from Agaricus bisporus
-
Four different chitosan products were obtained by subjecting dried Agaricus bisporus powder to control (CL) treatment, ball-milling (BM) treatment, sonication (S) treatment, and combined ball-milling and sonication (BM + S) treatment. To obtain CL chitosan, the dried powder was mixed with NaOH solution (4%) in the ratio of 1:10 (w : v) and heated at 100 °C for 2 h. The mixture was then centrifuged to obtain the precipitate. The precipitate was washed and freeze-dried for 48 h to obtain a chitin sample for subsequent chitosan extraction. The extraction of BM chitosan was achieved through the use of the dried powder, following ball-milling, at a frequency of 400 r/min, for a duration of 1 h. To obtain CL chitosan, the powder was mixed with NaOH solution (50%) in the ratio of 1:20 (w : v) and subjected to sonication (300 w, 40 min). In addition, BM + S chitosan was obtained by combining ball-milling and ultrasound treatment, followed by alkaline extraction.
Next, the treated samples were mixed with NaOH solution (50%) at 1:20 (w : v) in an oil bath at 150 °C and heated with stirring for 3 h. Afterwards, the mixture was centrifuged, and the precipitate was mixed with acetic acid solution (1%) and stirred at 95 °C for 2 h. After filtering the mixture, a 30% sodium hydroxide solution was added to the filtrate until a gray-white precipitate forms. The precipitate was washed with deionized water and then freeze-dried for 48 h to obtain a chitosan sample. The sequence of processing steps is illustrated in Supplementary Fig. S1.
Determination of ball-milling and sonication conditions
-
The effects of ball-milling time, speed, and sonication time on the extraction yield of chitosan from Agaricus bisporus was investigated using the actual yield of chitosan from Agaricus bisporus as an indicator. The range of values of the three parameters was selected through a pre-experiment. The ball-milling time was set to 0.5, 1, 1.5, 2, and 2.5 h; the ball milling speed to 100, 200, 300, 400, and 500 r/min; and the sonication time to 20, 30, 40, 50, and 60 min, respectively. Subsequently, the response surface methodology was employed to investigate the interaction between ball-milling and sonication.
Compositional analysis of chitosan extraction products
-
The purity of the sample was determined by calculating the digested glucosamine content of the extract using the Elson-Morgan method[21]. The extraction rate, purity and the actual withdrawal rate are expressed as a percentage and is calculated by Eqs (1), (2), and (3), respectively.
$ Extaction\;yeild\;\left({\text{%}} \right)={m}_{1}/{m}_{0}\times 100 $ (1) $ Purity\;\left({\text{%}} \right)={m}_{2}{/m}_{1}\times 100 $ (2) $ Actual\;yield\;\left({\text{%}} \right)=Extraction\;yeild\times Purity $ (3) Where, m0 is the mass of dried Agaricus bisporus powder used for extraction (g); m1 is the mass of chitosan extract of Agaricus bisporus obtained by extraction (g); m2 is the quality of chitosan in chitosan extracts (g).
The degree of deacetylation of the sample was determined by pH titration[22]. The degree of deacetylation of the samples was expressed as a percentage and calculated by Eq. (4) based on the volume of NaOH solution consumed.
$ DD\;\left({\text{%}} \right)=\left({C}_{1}{V}_{1}-{C}_{2}{V}_{2}\right)\times 0.016/(G\times \left(1-w\right)\times 9.94)\times 100 $ (4) Where, C1 and C2 represent the concentration of HCl and NaOH standard solutions (mol/L), respectively; V1 represents the volume of HCl (mL) used to dissolve the sample; V2 represents the volume of NaOH standard solution consumed (mL); 0.016 represents the amount of amino acid equivalent to 1 mL of 1 M HCl solution (g); 9.94 represents the amount of amino acid in the ideal chitosan; G represents the number of grams of the sample (g); w represents the humidity of the sample (%).
The protein content of the extracts was determined using the Folin-Phenol method[23]. The protein content of the samples was expressed as a percentage and calculated by Eq. (5).
$ The\;protein\;content\;\left({\text{%}} \right)={m}_{1}/{m}_{0}\times 100 $ (5) Where, m1(g) represents the measured protein mass; m0(g) represents the quality of samples used for testing.
The content of glucan in the samples was determined by phenol-oxalate acid method[24]. Glucan content was expressed as a percentage and calculated by Eq. (6).
$ Glucan\;content\;\left({\text{%}} \right)={m}_{1}\times {V}_{1}\times {10}^{-6}/{(m}_{2}\times {V}_{2}\times \left(1-c\right))\times 100 $ (6) Where, V1 is the volume of sample volume in milliliter (mL); V2 is the volume of sample solution in milliliter (mL); m1 is the sugar content of the sample solution in micrograms (ug) from the standard curve; m2 is mass of the sample in grams (g); c is water content of the sample (%).
Characterization of the structure and thermal stability of chitosan products
-
Scanning infrared spectroscopy was carried out by grinding the dried samples with potassium bromide to make transparent flakes. The scanning range was set from 4,000 to 400 cm−1 with 32 scans per spectrum, and the resolution was set to 4.0 cm−1.
X-ray diffraction analysis of chitosan was recorded with Cu-Kα radiation at room temperature using an automated diffractometer with an operating voltage of 40 kV, and an operating current of 40 mA. The operating voltage was 40 kV, and the operating current was 40 mA. The 2θ angle of the tested samples ranged from 5–80°, and the patterns were collected in steps of 0.04° (353 s per step). The crystallinity index (CrI) of the samples was calculated by Eq. (7)[25].
$ CrI\;\left({\text{%}} \right)=({I}_{110}-{I}_{am})/{I}_{110}\times 100 $ (7) Where, I110 is the maximum intensity at 20°; Iam is the intensity of amorphous diffraction at 16°.
Thermogravimetric loss curves of the samples were determined by a thermogravimetric analyzer. The sample (approximately 10 mg) was placed in an open aluminum pot and heated from 30 °C to approximately 800 °C in a nitrogen atmosphere at a heating rate of 10 °C/min.
A scanning electron microscope was used to observe the microscopic surface structure of the samples. The freeze-dried sample powder was placed on a conductive adhesive, sprayed with gold, and subsequently photographed with a field emission scanning electron microscope at an accelerating voltage of 7 KV.
Evaluation of lipid-binding activity in vitro
-
The oil adsorption capacity is determined as follows[26]. The sample (0.05 g) and soybean oil (5 mL) was added to a centrifuge tube and shaken at 37 °C for 1 h, then removed and centrifuged (8,000 r/min, 20 min), and the precipitates were weighed after blotting the surface oils with filter paper. The oil adsorption capacity of the samples was expressed in g/g and calculated by Eq. (8).
$ Oil\;absorption\;\left( g/g\right) ={(W}_{2}-{W}_{1})/{W}_{1} $ (8) Where, W1 is the mass of the sample (g); W2 is the weight after adsorption (g).
Inhibition of pancreatic lipase activity was determined by titration[27]. The inhibition of pancreatic lipase activity was expressed as a percentage and calculated by Eqs (9) and (10).
$ IU=1000\times \left({V}_{sample}-{V}_{blank}\right)\times c/(t\times w) $ (9) Where, c is the concentration of NaOH standard solution (mol/L); Vsample is the volume of NaOH standard solution consumed by the sample (mL); Vblank is the volume of NaOH standard solution consumed by the blank (mL); t is the reaction time after enzyme addition (min); w is the amount of pancreatic lipase added (g).
$ Inhibition\;rate\;\left( {\text{%}} \right) ={(IU}_{0}-{IU}_{1})/{IU}_{0}\times 100 $ (10) Where, IU0 is the pancreatic lipase activity; IU1 is the pancreatic lipase activity after sample addition.
The cholesterol adsorption capacity of the samples was determined with reference to Raederstorff et al.[28].The method for evaluating the adsorption capacity of bile salts was referred to Zhou et al.[29]. The bile acid salt adsorption capacity of the samples was calculated using Eq. (11).
$ Bile\;Acid\;Salt\;Binding\;Ratio\;({\text{%}} )={(C}_{0}-{C}_{1})/{C}_{0}\times 100{\text{%}} $ (11) Where, C0 is the bile acid salt concentration without sample, mmol/L; C1 is the bile acid salt content of the sample set, mmol/L.
Statistical analysis
-
All experiments are conducted at least in triplicate. The data was analyzed by one-way analysis of variance (ANOVA) using SPSS software program (SPSS, USA).
-
The effects of ball-milling time, ball-milling speed, and sonication time on the yield, purity, and deacetylation of chitosan products from Agaricus bisporus are shown in Fig. 1. When the ball milling time is 1 h, the yield is 5.63% ± 0.25%. With less than 1 h of milling, the product has higher purity, and the yield rises with time. However, when the ball milling time exceeds 1 h, the yield demonstrates a negative correlation with time. The yield of chitosan increased with sonication time, reaching a peak of 5.47% ± 0.16% after 40 min, but there was no significant difference in the purity of chitosan products between sonication times of 30 and 50 min.
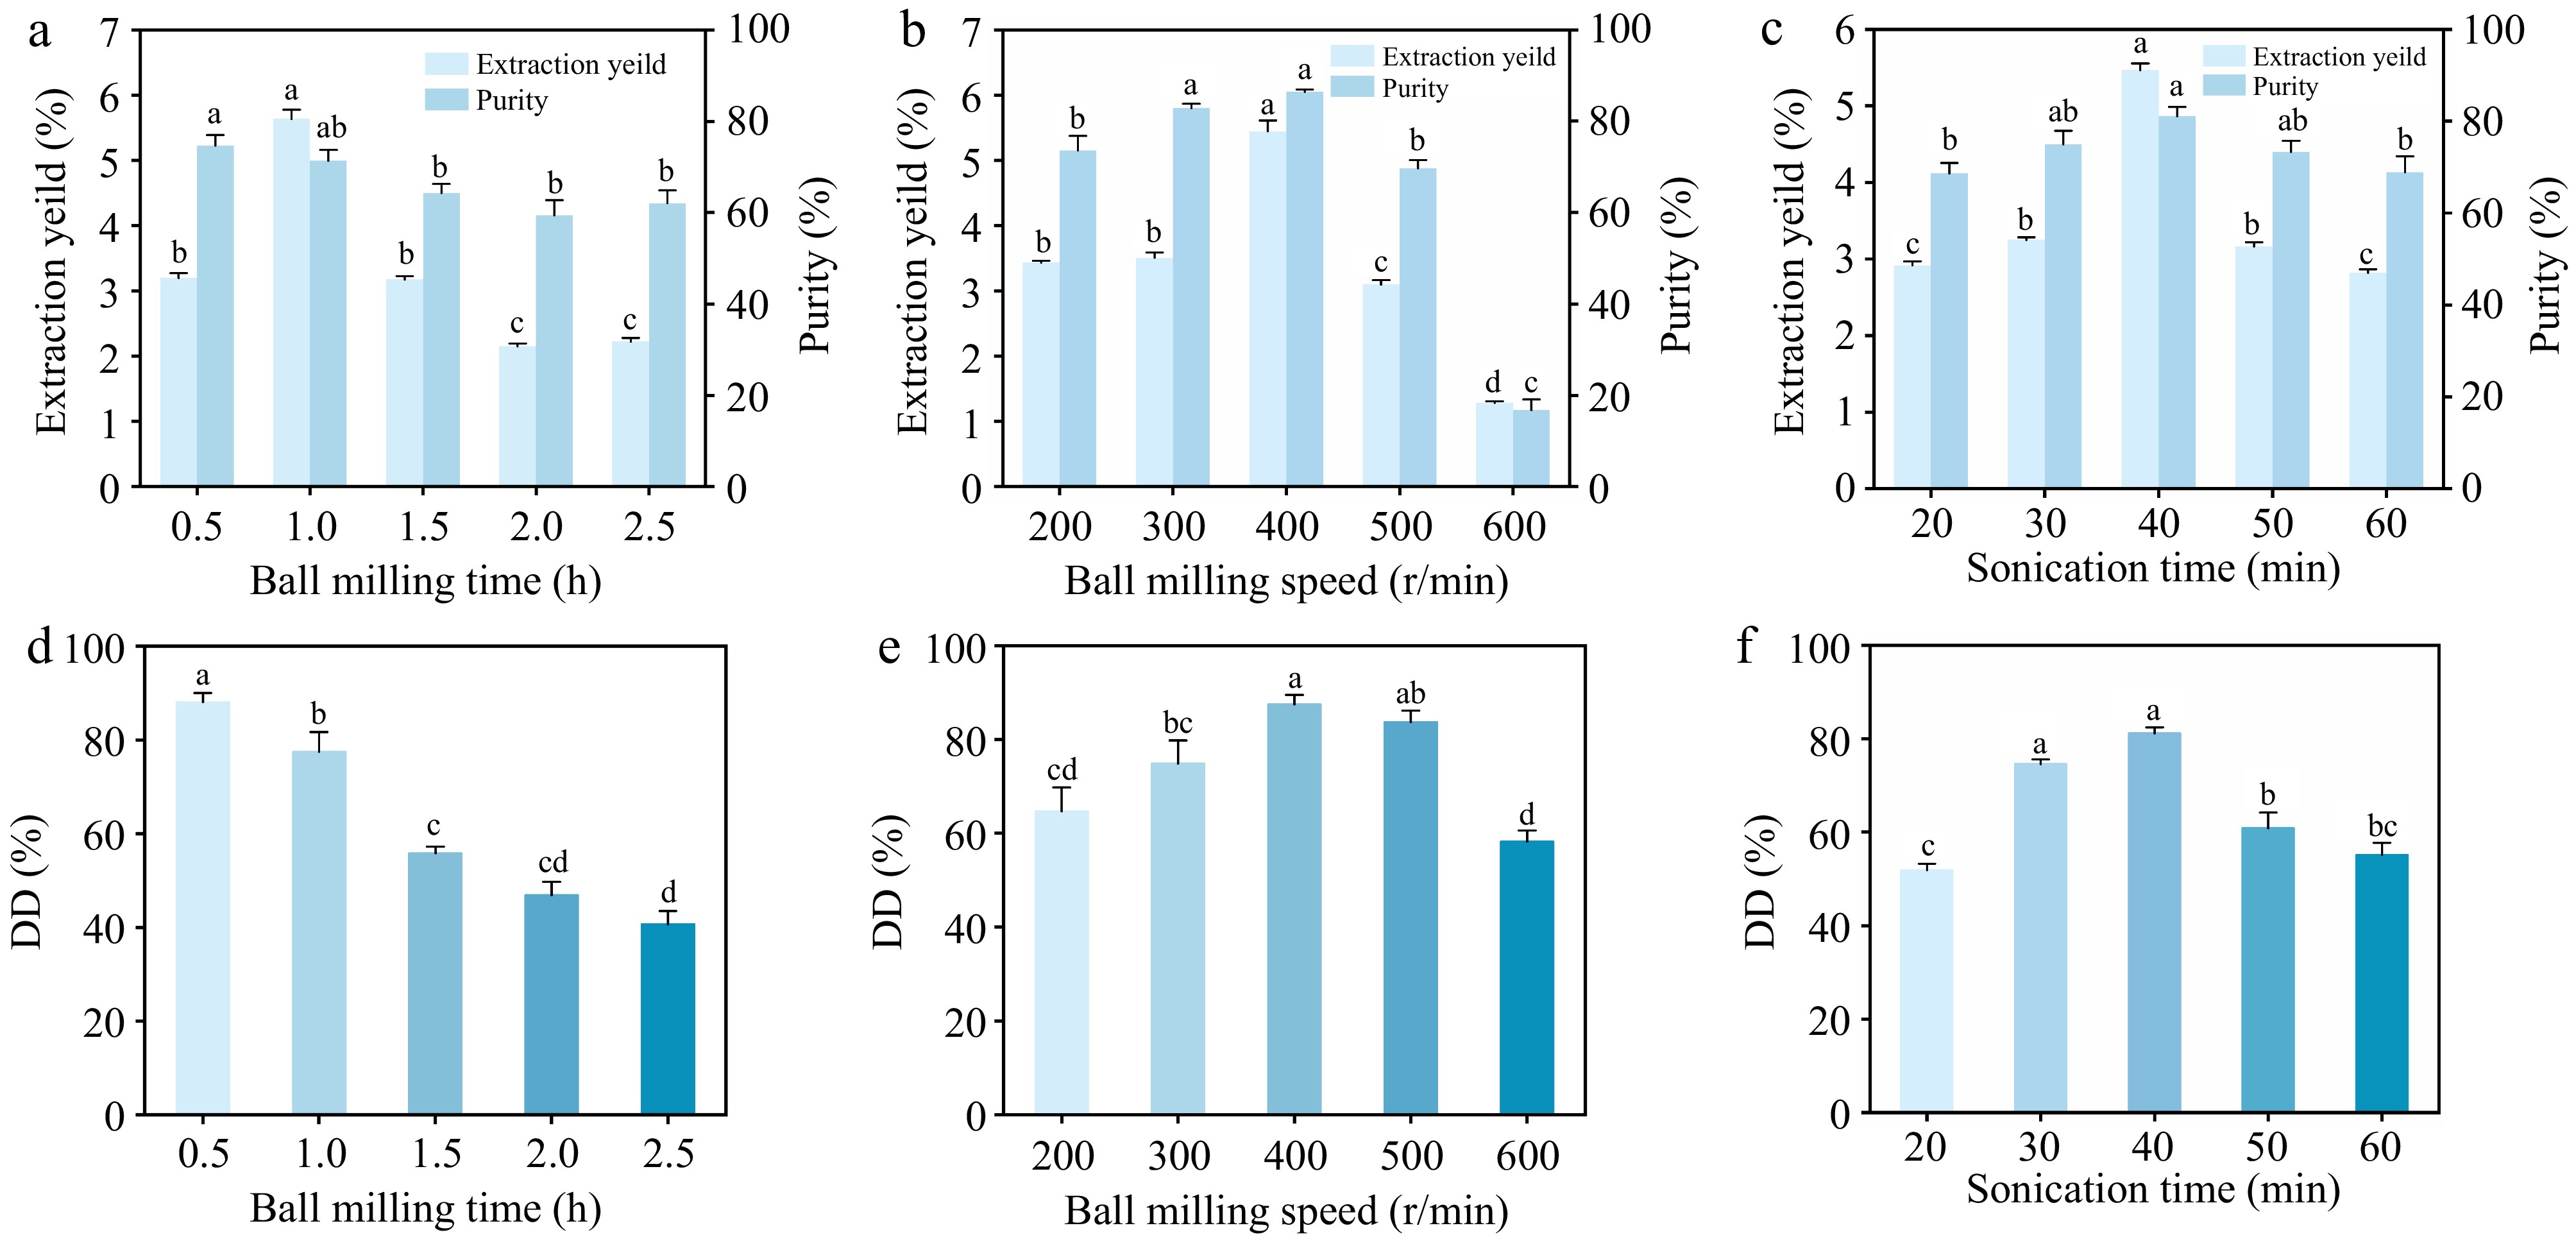
Figure 1.
Effects of (a) ball-milling time, (b), ball-milling speed, and (c) sonication time on the extraction yield and purity of chitosan products. Effects of (d) ball milling time, (e) ball-milling speed, and (f) sonication time on the DD of chitosan products. The letters a, b, c, and d denote the significance level α = 0.05.
A three-level, three-factor experimental design based on response surface methodology combined with Box-Behnken was used, as shown in Supplementary Table S1. Ball-milling time (A), ball-milling speed (B), and sonication time (C) were used as variables, with the extraction yield of chitosan from Agaricus bisporus used as the response value. The results are presented in Supplementary Table S2. With a coefficient of determination of R2 = 0.9824, it can be concluded that the regression equation can be used to predict the theoretical yield of chitosan. The regression equation was analyzed through ANOVA to test its significance, and the results are presented in Supplementary Table S3. The F-test showed that the model was significant, with a high F-value (F = 43.30) and a low p-value (p < 0.0001). Therefore, the model was able to describe the relationship between the parameters comprehensively. Notably, only category C had a low p-value (p < 0.05), indicating a significant correlation between sonication time and the yield of chitosan. The extraction yield of chitosan is significantly influenced by ball-milling time and rotational speed, as shown in Fig. 2a. As shown in Supplementary Table S2, both AB and BC have low p-values (p < 0.05), indicating that there is an interaction between milling time and rotational speed, as well as between milling speed and sonication time. The experimental results were analyzed by Design-Expert 13.0 software, and the optimal extraction conditions were obtained as follows: ball-milling time of 1.3 h, ball-milling speed of 416 r/min, and ultrasound time of 39 min; the predicted extraction rate was 4.106%. A total of three experiments were carried out within the stipulated conditions, yielding an average yield of 4.21% ± 0.07%. The value differed 0.104% from the predicted, showing the model's reliability for chitin yield prediction in Agaricus bisporus.
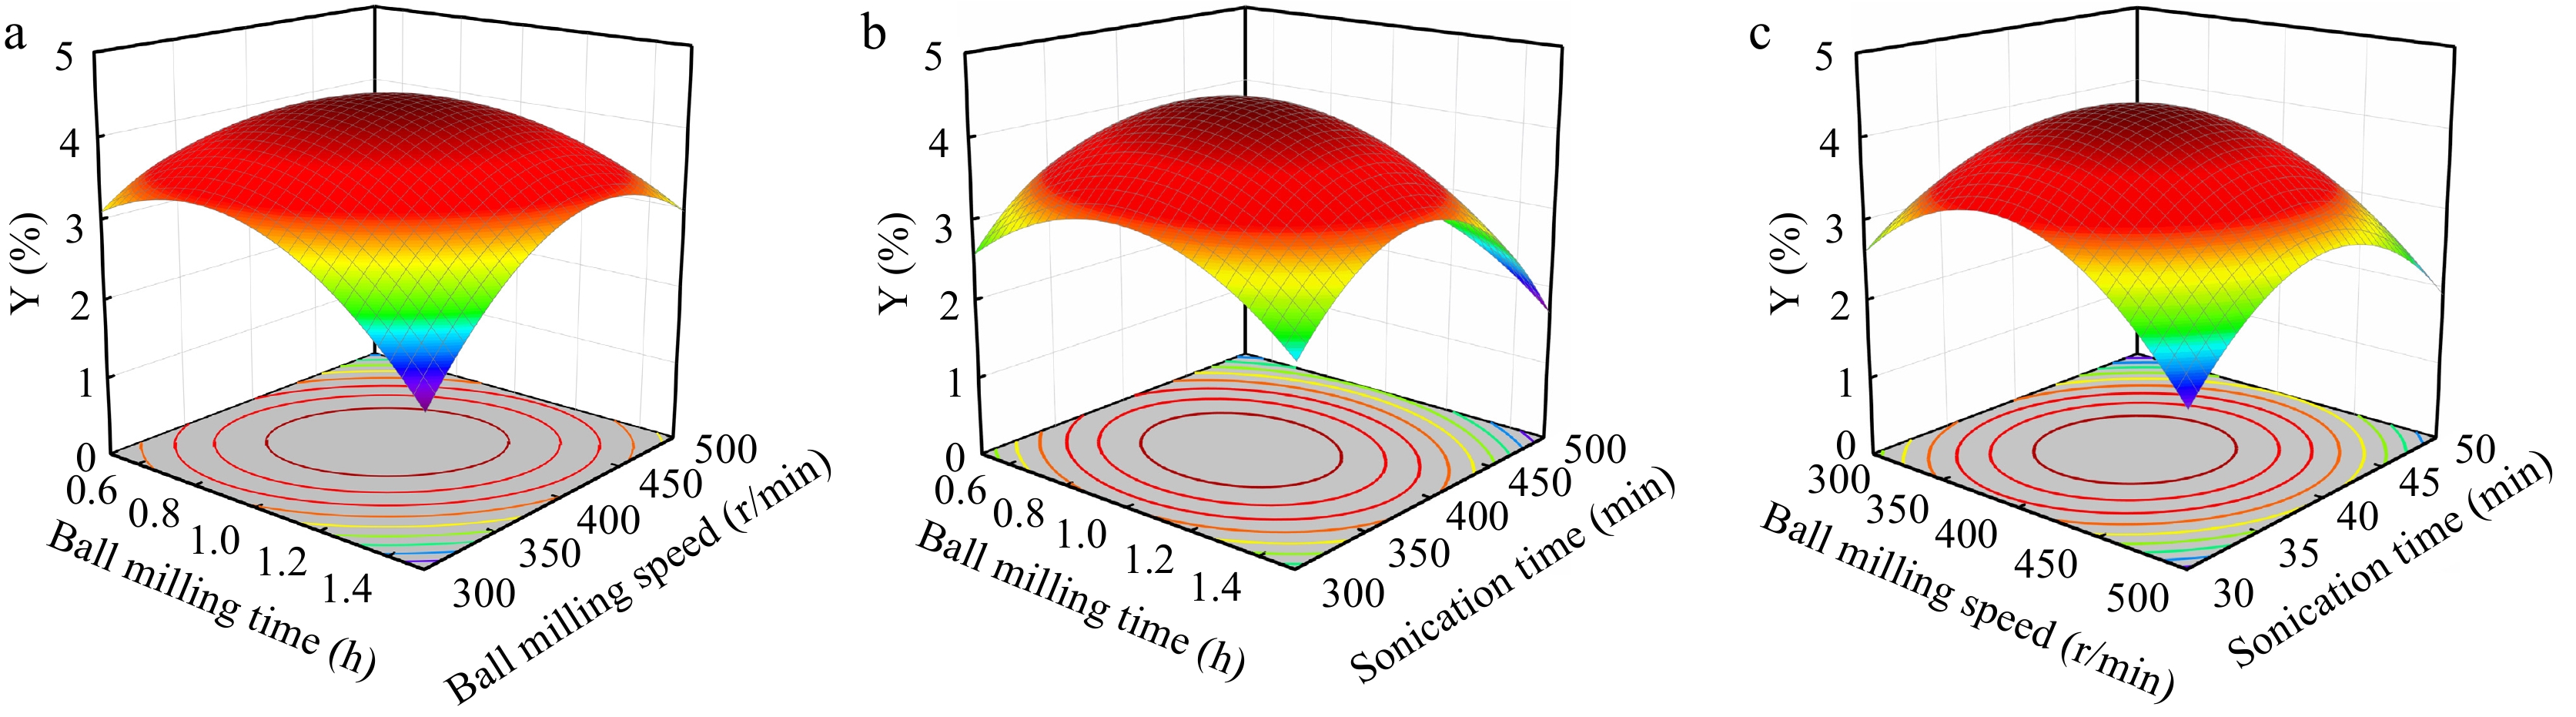
Figure 2.
Three-dimensional surface diagrams of factor interactions: (a) ball milling time and ball milling speed; (b) ball milling time and sonication time; (c) ball milling speed and sonication time.
Effect of mechanical treatment on the yield and composition of chitosan products from Agaricus bisporus
-
Compared to the CL treatment, the yield and purity of chitosan from Agaricus bisporus increased in the BM, S, and BM+S treatments (Fig. 3a). Specifically, the yield (5.67% ± 0.21%) and purity (85.54% ± 1.37%) of chitosan was the highest under BM+S treatment. Furthermore, BM chitosan and BM + S chitosan exhibited considerably elevated DD values in comparison to other CS (Fig. 3b). The lowest glucan content in BM + S chitosan was recorded at 0.65% ± 0.02%, while the highest glucan content in CL chitosan was 1.3% ± 0.06% (Fig. 3c). Notably, BM + S chitosan had the highest protein content (1.61% ± 0.03%), while the CL chitosan sample had the lowest protein content of only 0.46% ± 0.03% (Fig. 3d).
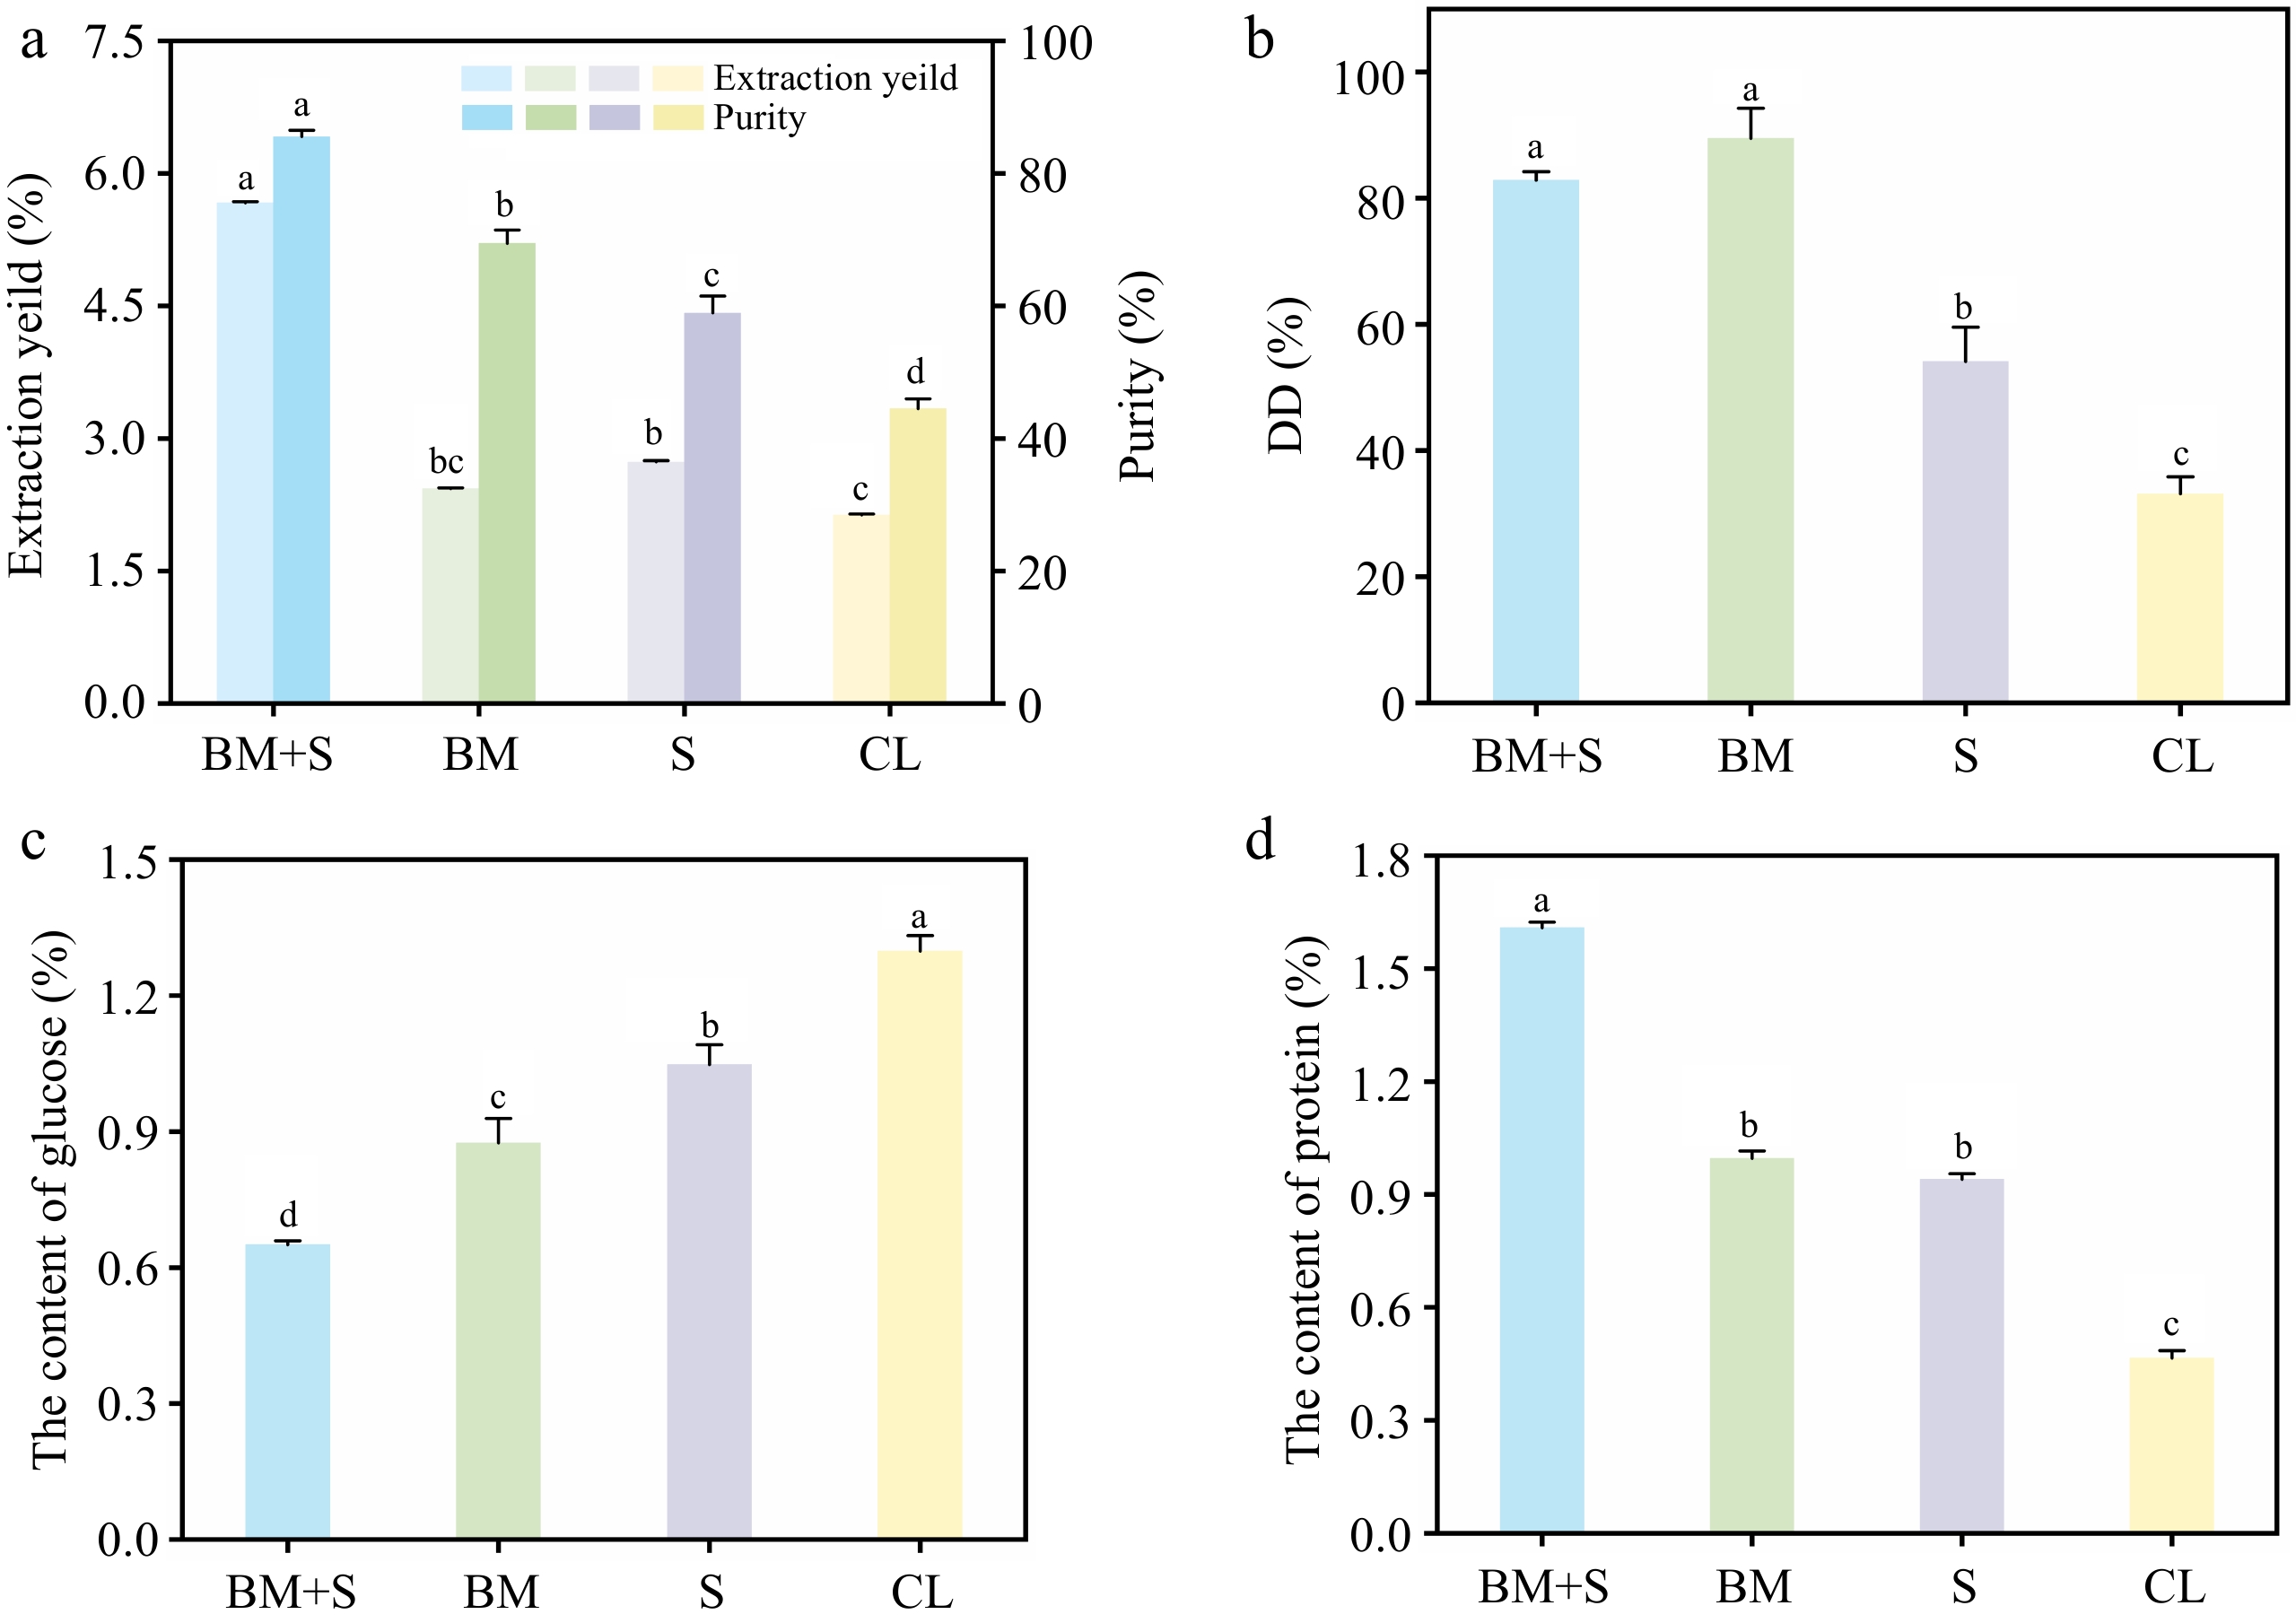
Figure 3.
(a) Extraction yield and purity, (b) DD values, (c) protein content, and (d) glucan content of the different chitosan products. The letters a, b, c, and d denote the significance level α = 0.05.
Differences in the structural properties of chitosan extracted from Agaricus bisporus by different treatments
-
As illustrated in Fig. 4a, the infrared spectra of all samples of chitosan and commercial chitosan (CM chitosan) are shown from 500 to 4,000 cm−1. The FTIR spectrum of chitosan exhibits characteristic peaks that can be utilized as a unique 'fingerprint' to identify the polymer and elucidate its structural and compositional characteristics[30]. All samples exhibited a similar chemical structure to CM chitosan. The stretching vibrational bands around 3,450–3,400 cm−1 are attributed to ν(N-H) and ν(O-H), which are essential for the formation of hydrogen bonds within the chitosan molecule[31]. The peaks between 2,850 and 2,950 cm−1 are attributed to the stretching vibrations of the C-H bonds in the methylene (-CH2) and methyl (-CH3) groups of the chitosan molecule, which function as enthalpies of thermal decomposition, underlining the energy required to break the bonds and stabilize the structure of chitin/chitosan[32]. The CH3 bands observed at wavelengths ranging from 1,380 to 1,390 cm−1 are indicative of symmetric scaling of the moiety, thereby suggesting the presence of N-acetyl-D-glucosamine units within the structure of chitosan. The C-O bonds in the samples between 1,070 and 1,300 cm−1 indicate the presence of ester-based, carboxyl, and epoxy C-O functional groups in the chitosan[33].
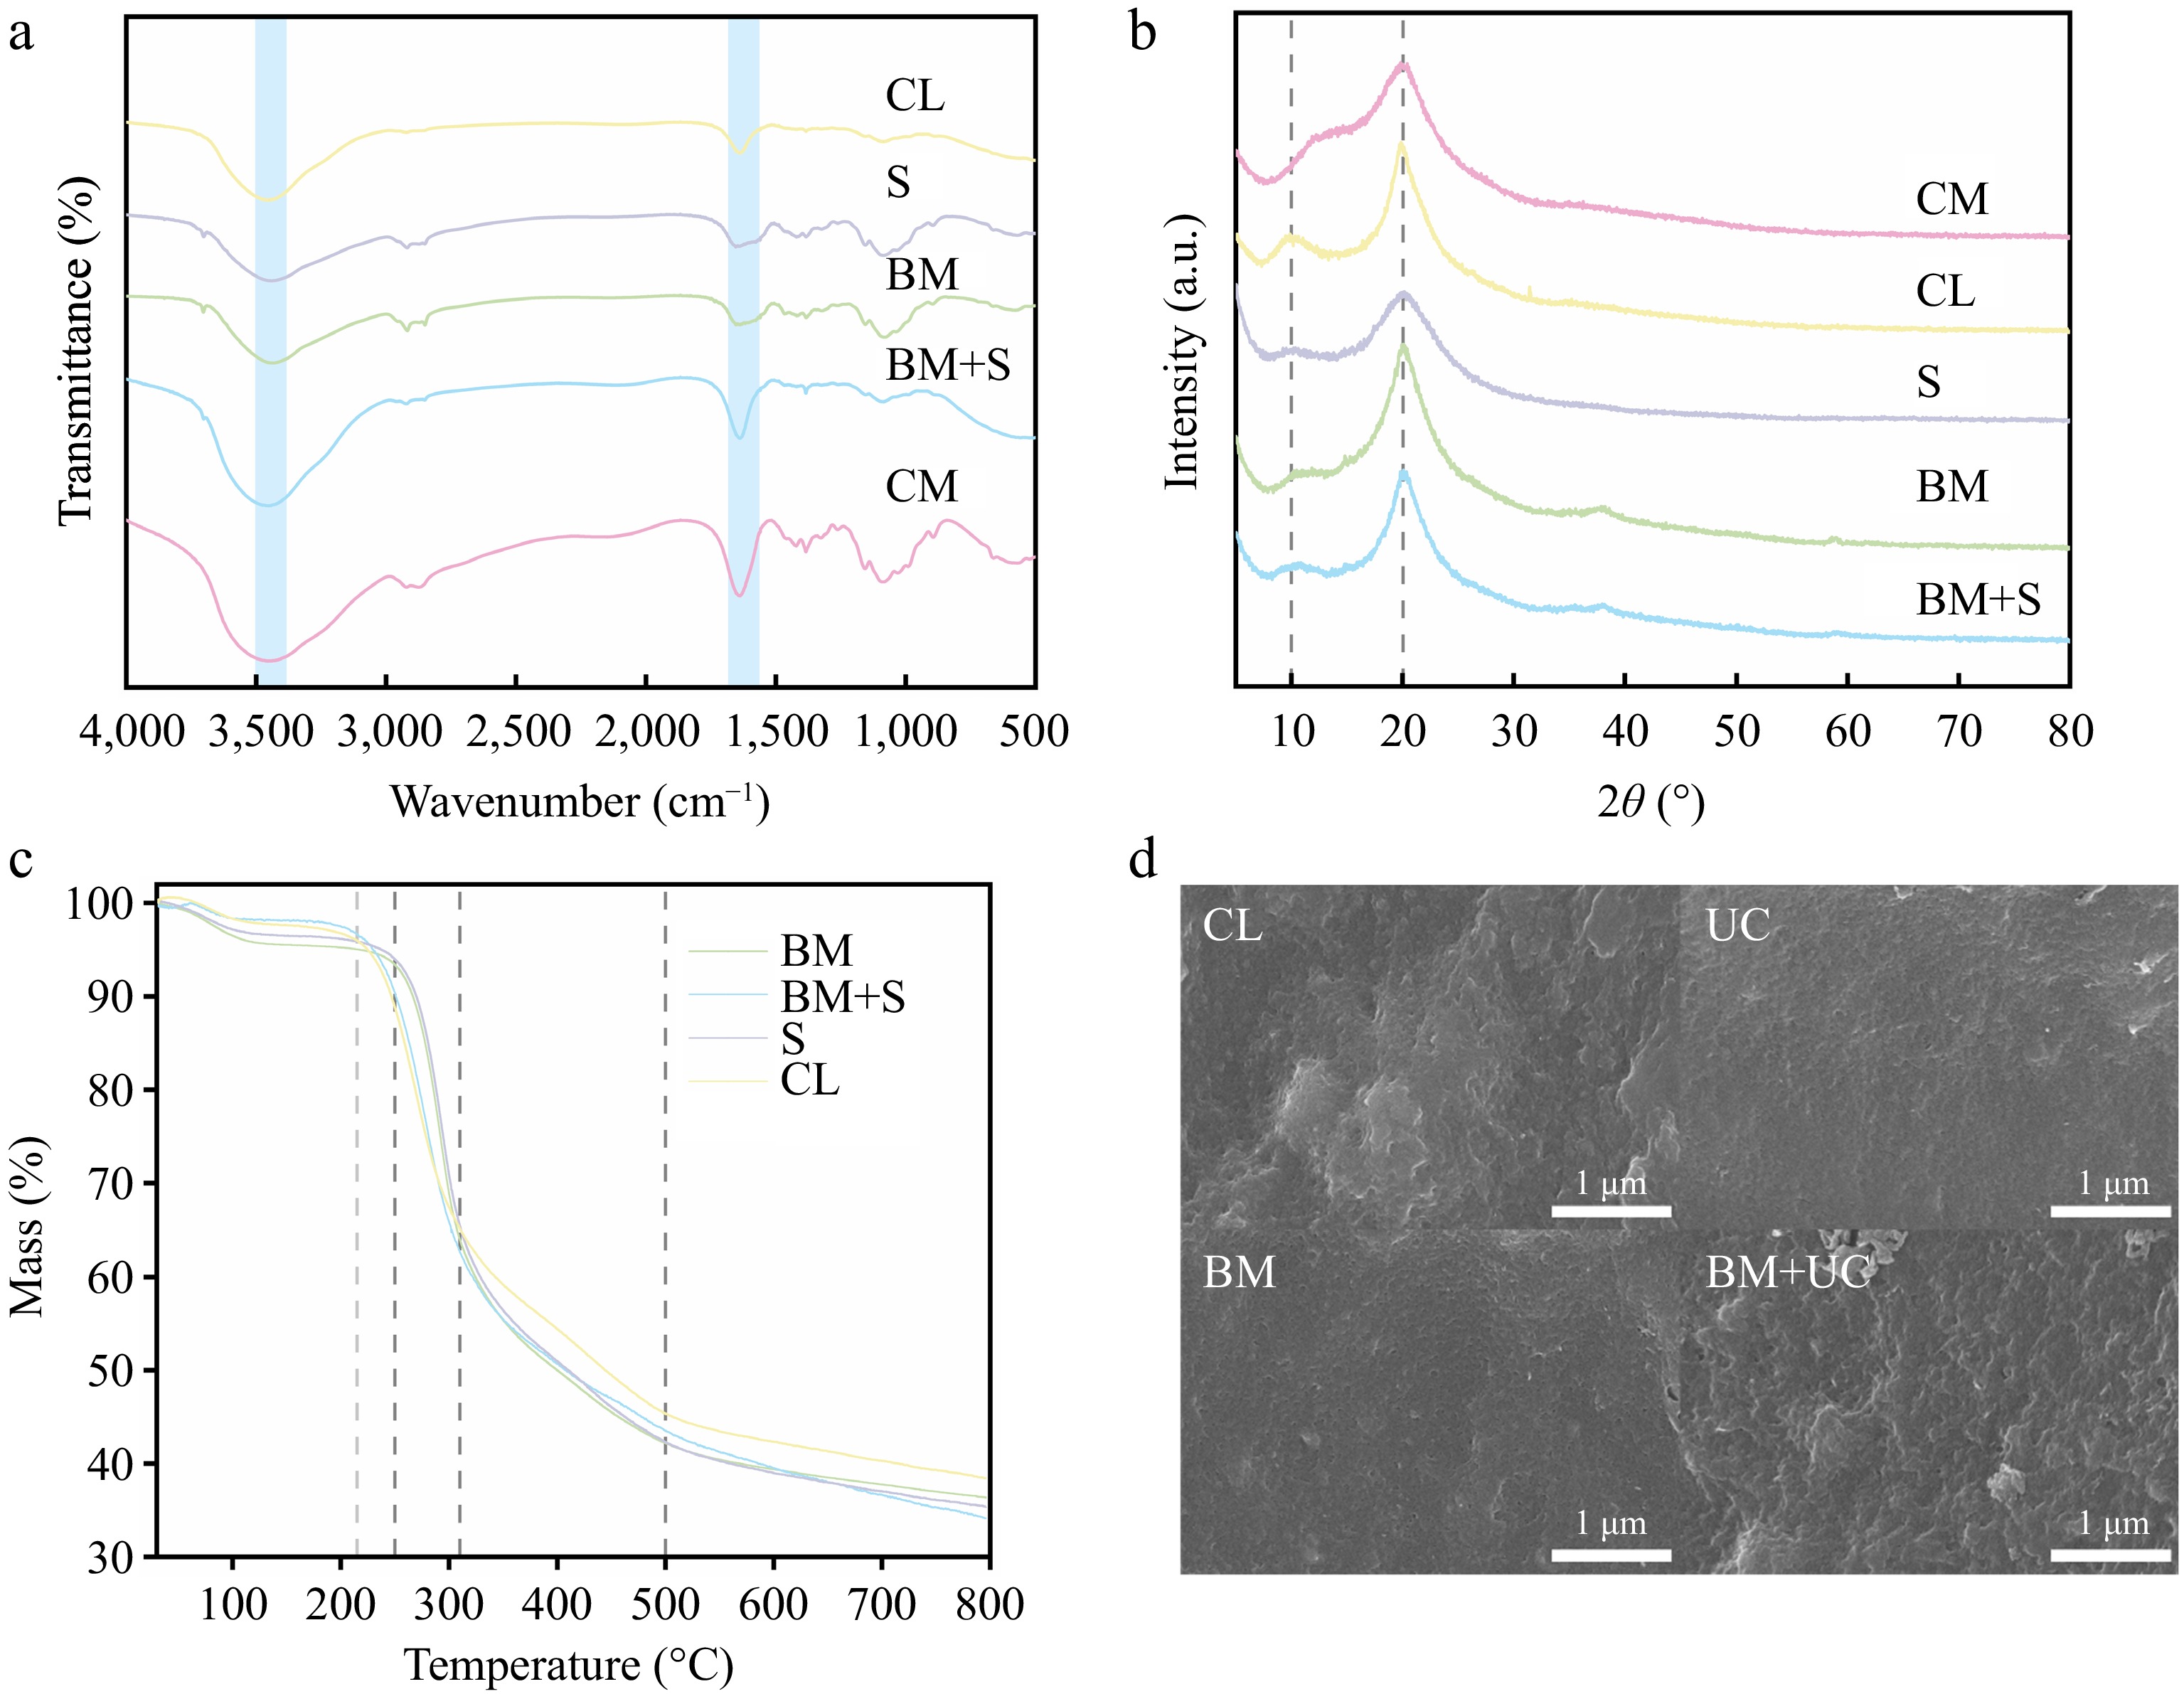
Figure 4.
(a) FTIR, and (b) XRD spectra of all chitosan extracts of Agaricus bisporus and CM chitosan; (c) TGA, and (d) SEM spectra of all chitosan extracts of Agaricus bisporus.
Furthermore, the increase in intensity at the 1,600 and 1,500 cm−1 bands suggests an increase in the sample's DD value[34]. In the figure, the peak intensities of CM, BM + S, BM, S, and CL chitosan in this band decrease sequentially, indicating that their DD values also decrease in the same order. Based on the results in Fig. 3b, the DD values for BM + S and BM chitosan were at the same level, significantly higher than that of S chitosan, while CL exhibited the lowest DD value. And the DD value of CM chitosan (≥ 95%) was higher than that of BM + S chitosan (82.86% ± 7.16%). Therefore, these results correspond to Fig. 4a.
The XRD diffraction patterns of all the samples are shown in Fig. 4b and the CrI are shown in Table 1. As illustrated in Fig. 4b, the initial intensity peak for all samples is situated between approximately 10° and 12° at 2θ, while the higher intensity peaks are observed at approximately 20° at 2θ. The CrI of chitosan depends on various factors, such as DD, weight average molecular weight, the extraction method, and the composite material[35]. All samples showed the highest peak at 2θ, located near 20°, while all chitosan extraction products had a higher CrI than CM chitosan. The CrI of CL chitosan is the highest of the samples, at 51.38%. This may be due to the fact that the DD value of CL chitosan is less than 50%, and its properties are closer to a chitin-based material. It has been demonstrated that an increase in the DD of the chitosan molecule results in an increase in the charge density along the chain. Consequently, the chitosan chain becomes more flexible, tending to form a more irregular morphology, and thus exhibiting a lower degree of crystallinity. Increased deacetylation of chitosan decreases the number of acetyl side groups, which leads to a more regular stacking of the polymer chains and ultimately promotes crystallinity[36]. However, in our study, the CrI of BM chitosan with higher DD values as well as BM + S chitosan was lower than that of CL chitosan with lower DD values, which may be related to the relatively high protein content in the BM + S, and CL chitosan.
Table 1. CrI of different chitosan samples.
Sample CrI (%) BM chitosan 47.71 CL chitosan 51.38 BM + S chitosan 48.85 S chitosan 36.17 CM chitosan 30.70 The TGA curves of all Agaricus bisporus chitosan samples are shown in Fig. 4c. The mass loss process of all chitosan samples was segmented into four stages, while chitosan obtained from different treatments exhibited varied thermal behaviors in different temperature ranges. The first stage involved the removal of moisture from the samples[37], which indicated that BM chitosan and BM + S chitosan contained higher levels of moisture. In the second stage, all samples experienced a significant decrease in mass with increasing temperatures, and degraded to approximately 60% of their original mass. During this process, thermal decomposition of chitosan occurred, probably due to partial hydrogen bond breakage of chitosan polymer molecules in this temperature range[38]. As the temperature increased further, an increased number of hydrogen bonds in the chitosan polymer molecules were broken, leading to further thermal degradation of the samples[39], but with a reduced tendency to decrease in mass. As the temperature is elevated to 500 °C, a decline in the mass of all samples is observed at a remarkably sluggish rate, ultimately leading to a period of constant mass.
The microscopic surface structures of four chitosan extracts prepared via different treatment methods are shown in Fig. 4d. Among these, CL chitosan exhibits the most irregular surface, featuring irregular depressions and protrusions, whereas S and BM chitosan possess relatively smooth surfaces. The chitosan product from the BM + S treatment exhibits uniform protrusions and depressions, potentially indicating enhanced adsorption capacity.
Evaluation of in vitro hypolipidemic activity of chitosan extraction products
-
The in vitro lipid-binding activity of different chitosan samples is shown in Fig. 5. All chitosan samples exhibited inhibition of pancreatic lipase activity and adsorption of fats, oils, cholesterol micelles, and bile acid salts. This finding is consistent with the results of earlier research, which demonstrated that chitosan has the capacity to bind cholesterol and lipids, thereby exerting anti-obesity effects[40]. It is remarkable that the oil adsorption capacity of S chitosan, and BM + S chitosan is significantly greater than the rest of the samples (Fig. 5a). Consequently, the enhanced oil-binding properties of the Agaricus bisporus chitosan samples suggest a potential for enhanced anti-obesity efficacy in vivo. Similarly, the cholesterol micelle adsorption results showed that the cholesterol micelle adsorption capacity of BM + S chitosan, S chitosan, and BM chitosan were significantly greater than CL chitosan (Fig. 5b). The cholate adsorption capacity of chitosan samples was mainly demonstrated by determining the adsorption capacity of chitosan samples for sodium taurocholate and sodium glycocholate.
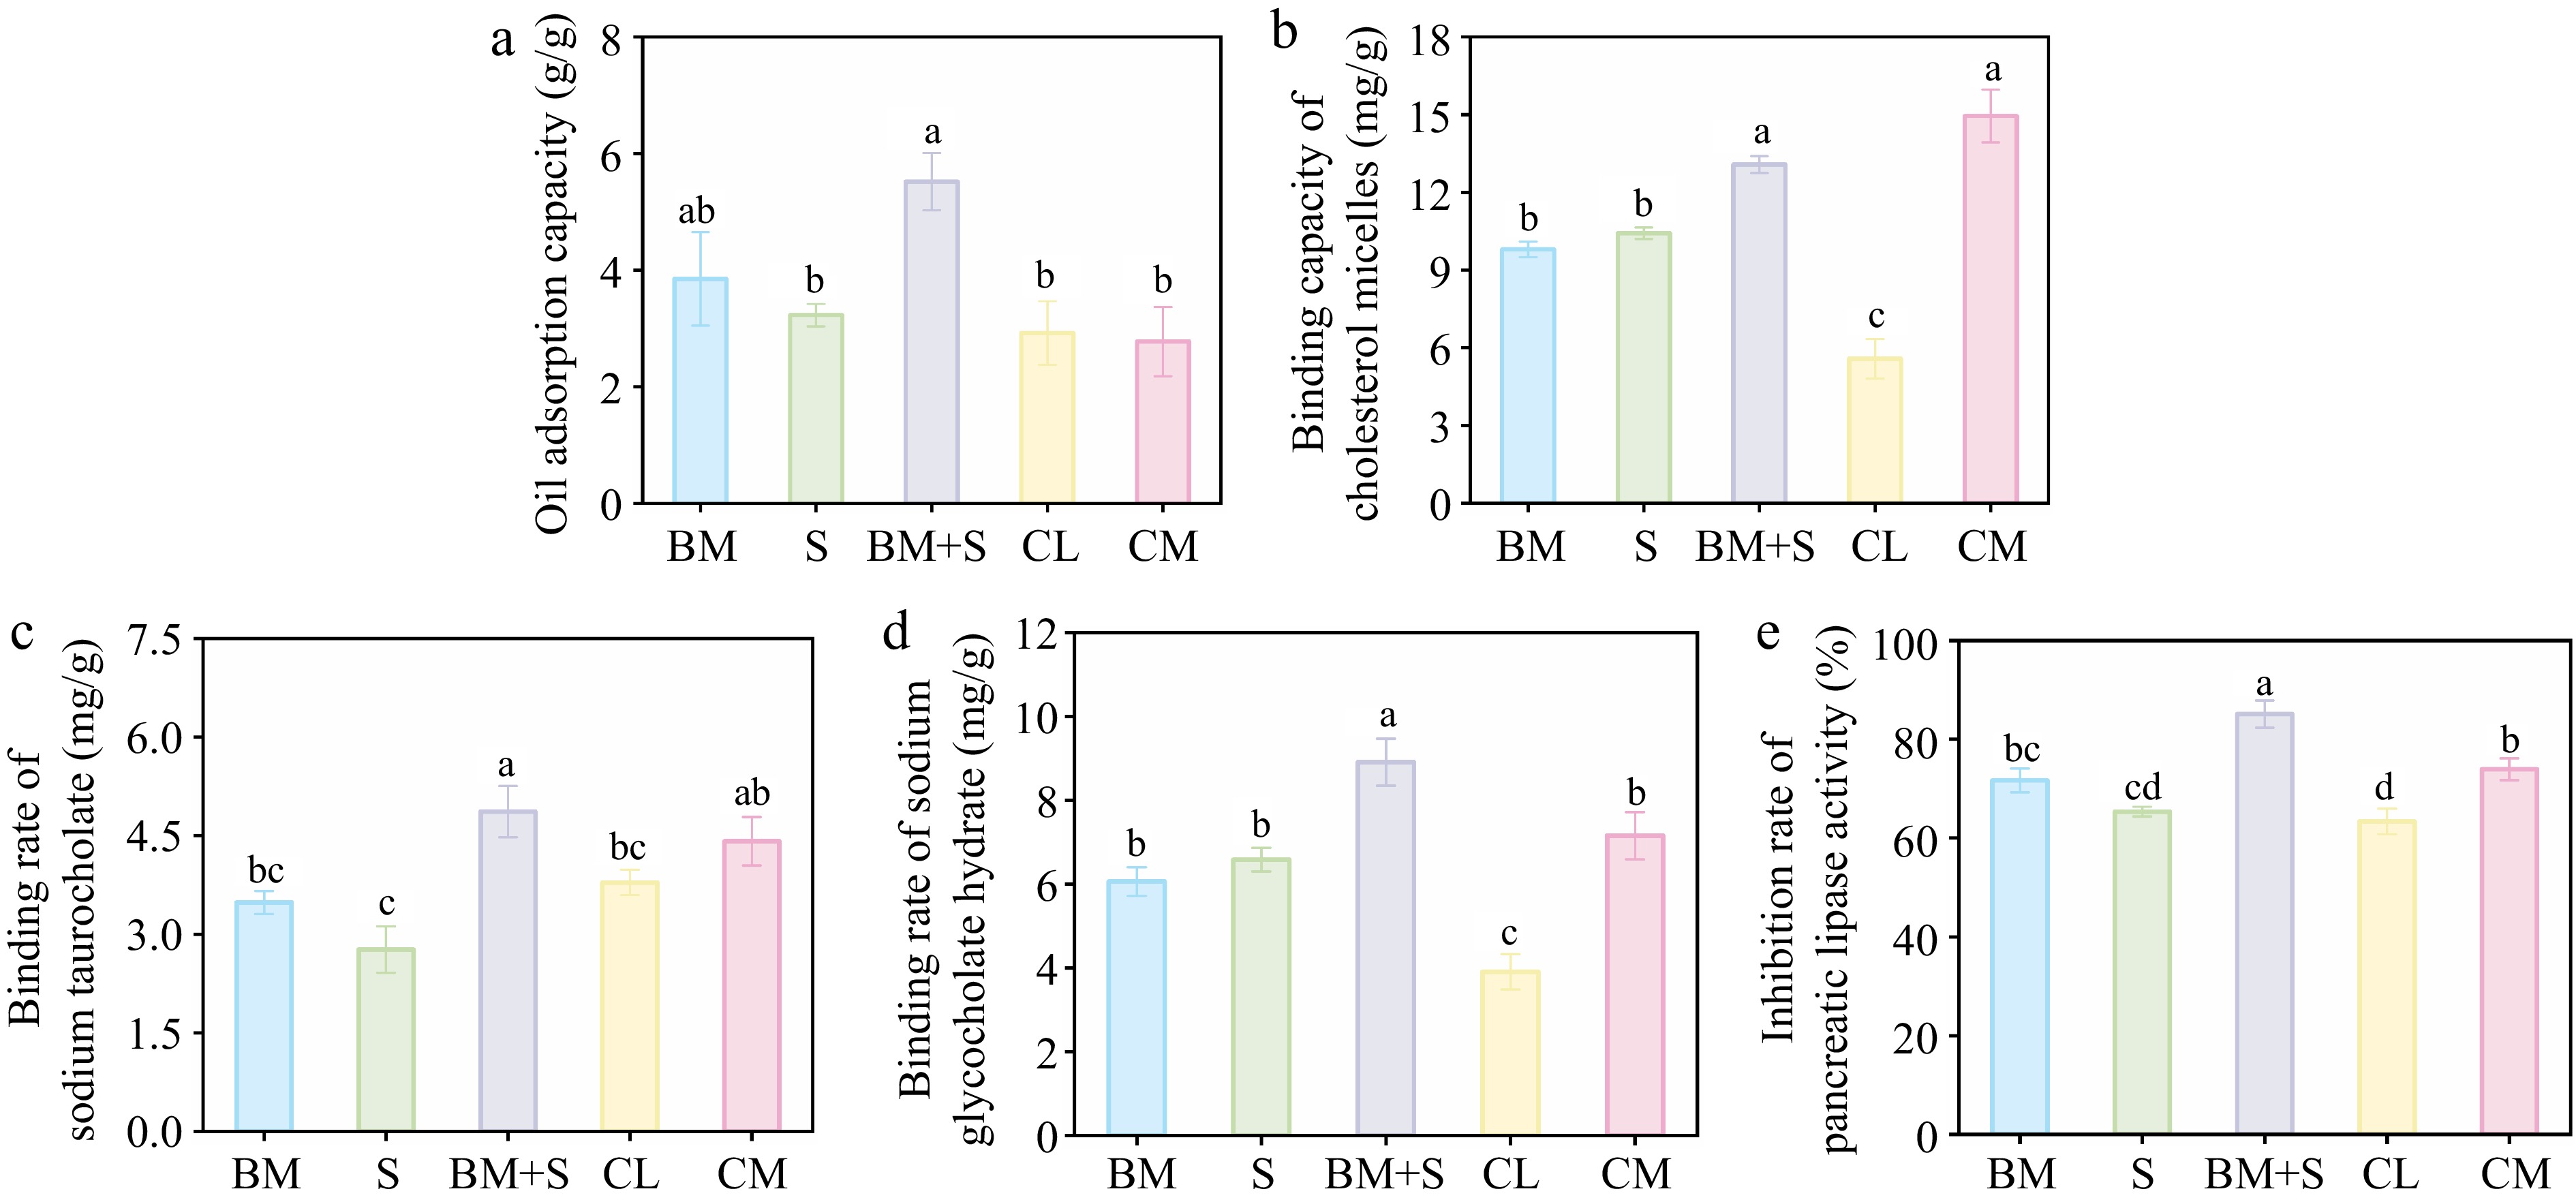
Figure 5.
(a) The oil absorption capacity. Binding capacity of (b) cholesterol micelles, (c) sodium taurocholate, (d) sodium glycocholate hydrate, and (e) inhibition rate of pancreatic lipase of different chitosan products. The letters a, b, c, and d denote the significance level α = 0.05.
In all chitosan samples, the adsorption capacity of BM + S chitosan for both bile acid salts was significantly greater than those of the other samples. In particular, the adsorption effect of BM + S chitosan was stronger for sodium glycocholate, whereas there was no significant difference between the adsorption effect of CM chitosan and BM + S chitosan for sodium taurocholate (Fig. 5c, d). Based on the results of the inhibition rate of pancreatic lipase activity, it was shown that BM + S chitosan was significantly higher than other chitosan samples of Agaricus bisporus (Fig. 5e).
-
Changes in the powder of Agaricus bisporus during ball-milling are shown in Supplementary Fig. S2. During ball-milling, the movement of balls generates energy that breaks down the material's structure through a transfer of mass, energy, and mechanical stress[41]. In the early stage of ball-milling, the powder's internal crystal structure is destroyed, increasing contact sites with NaOH, which promotes the yield of chitosan products. Increased ball-milling time and speed leads to higher friction and impact between the ball and the powder. This creates high-energy vibrations that break polysaccharide bonds in the powder, reducing the yield of chitosan products[42]. Simultaneously, these small particles formed during ball-milling occur in agglomeration, thereby reducing the contact points between particles and NaOH, leading to decreased purity of chitosan in the final product. Ultrasound generates bubbles that collapse when pressure exceeds surface tension, disrupting cells and increasing polysaccharide separation[43]. The depolymerization effect of sonication treatment on chitin and glucan in Agaricus bisporus powder is shown in Supplementary Fig. S3. During sonication treatment of plants and microbes, their polysaccharides experience intense mechanical motion caused by the high ultrasound acceleration, which breaks the glycosidic bonds of polysaccharides, not their groups[44]. Therefore, the change in product DD induced by the sonication treatment was probably due to the degradation changes in the chitosan backbone.
Ball-milling reduces particle size through shearing and collision forces, which expose more active binding sites. At the same time, agglomeration occurs between particles. The cavitation and shear effects of sonication further disperse the particles and promote the reaction between the particles and sodium hydroxide[45]. If the ball-mill speed is too low, the particles will not be ground sufficiently, resulting in an insufficient number of bonding sites. Extending the sonication time does not improve reaction efficiency. Similarly, when the sonication time is insufficient, particles that are adequately ground cannot be uniformly dispersed, and reaction efficiency cannot be enhanced.
Ball milling-sonication treatment significantly improved the extraction yield of chitosan from Agaricus bisporus. This process changes the microstructure of solid particles by applying various forces[46]. At the start of ball-milling, particle size decreases, and surface area increases as grinding depth increases[47]. At the beginning of ball-milling, the particle size decreases, and the surface area increases as the degree of grinding deepens. However, as the degree of ball-milling intensifies, the intermolecular interactions within the particles are disrupted, and deformation and breakage of the molecular chain occurs, leading to degradation of the substance[48]. This may explain the observed increase and subsequent decrease in the chitosan yield as the ball-milling time and speed are increased (Fig. 2b). The application of sonication facilitates the enhancement of the extraction rate of the substance by creating cavitation bubbles that disrupt the cell wall. Conversely, when the sonication time is excessively prolonged, it results in the degradation of the substance[49]. This may provide a potential explanation for the observed decrease in chitosan yield following the sonication time course (Figures 2a, c).
The effect of processing methods on product properties
-
BM chitosan and BM + S chitosan exhibited considerably elevated DD values in comparison to other CS. This phenomenon may be attributed to the transformation of the chitin structure in Agaricus bisporus from a qualitative to an amorphous state during the ball-milling process, thereby facilitating NaOH access to the N-acetyl group for deacetylation[50]. Initially, chitin and β-glucan chains accumulate individually in the fungal cell wall and subsequently form inter-polymer bonds. The formation of complexes between chitin/chitosan and glucan results in a network of rigid linkages within the cell wall, thereby posing significant challenges to the extraction of intact chitosan and glucan, which are not efficiently decomposed under mild extraction conditions[51]. The conventional method for extracting chitosan from fungi involves a two-step alkali treatment. In the initial step, the fungi are subjected to elevated temperatures (90–121 °C) in an alkaline solution (e.g., 2%–4% NaOH), resulting in the degradation of the cell walls and the release of proteins and chitosan as alkali-insoluble substances. Thereafter, the material is subjected to treatment under concentrated alkaline conditions (e.g., 20%–60% NaOH) at an elevated temperature (120–150 °C). During this process, the chitin-glucan complex is dissociated, with the release of chitin, followed by its conversion to chitosan through a deacetylation process[52], as shown in Fig. 6.
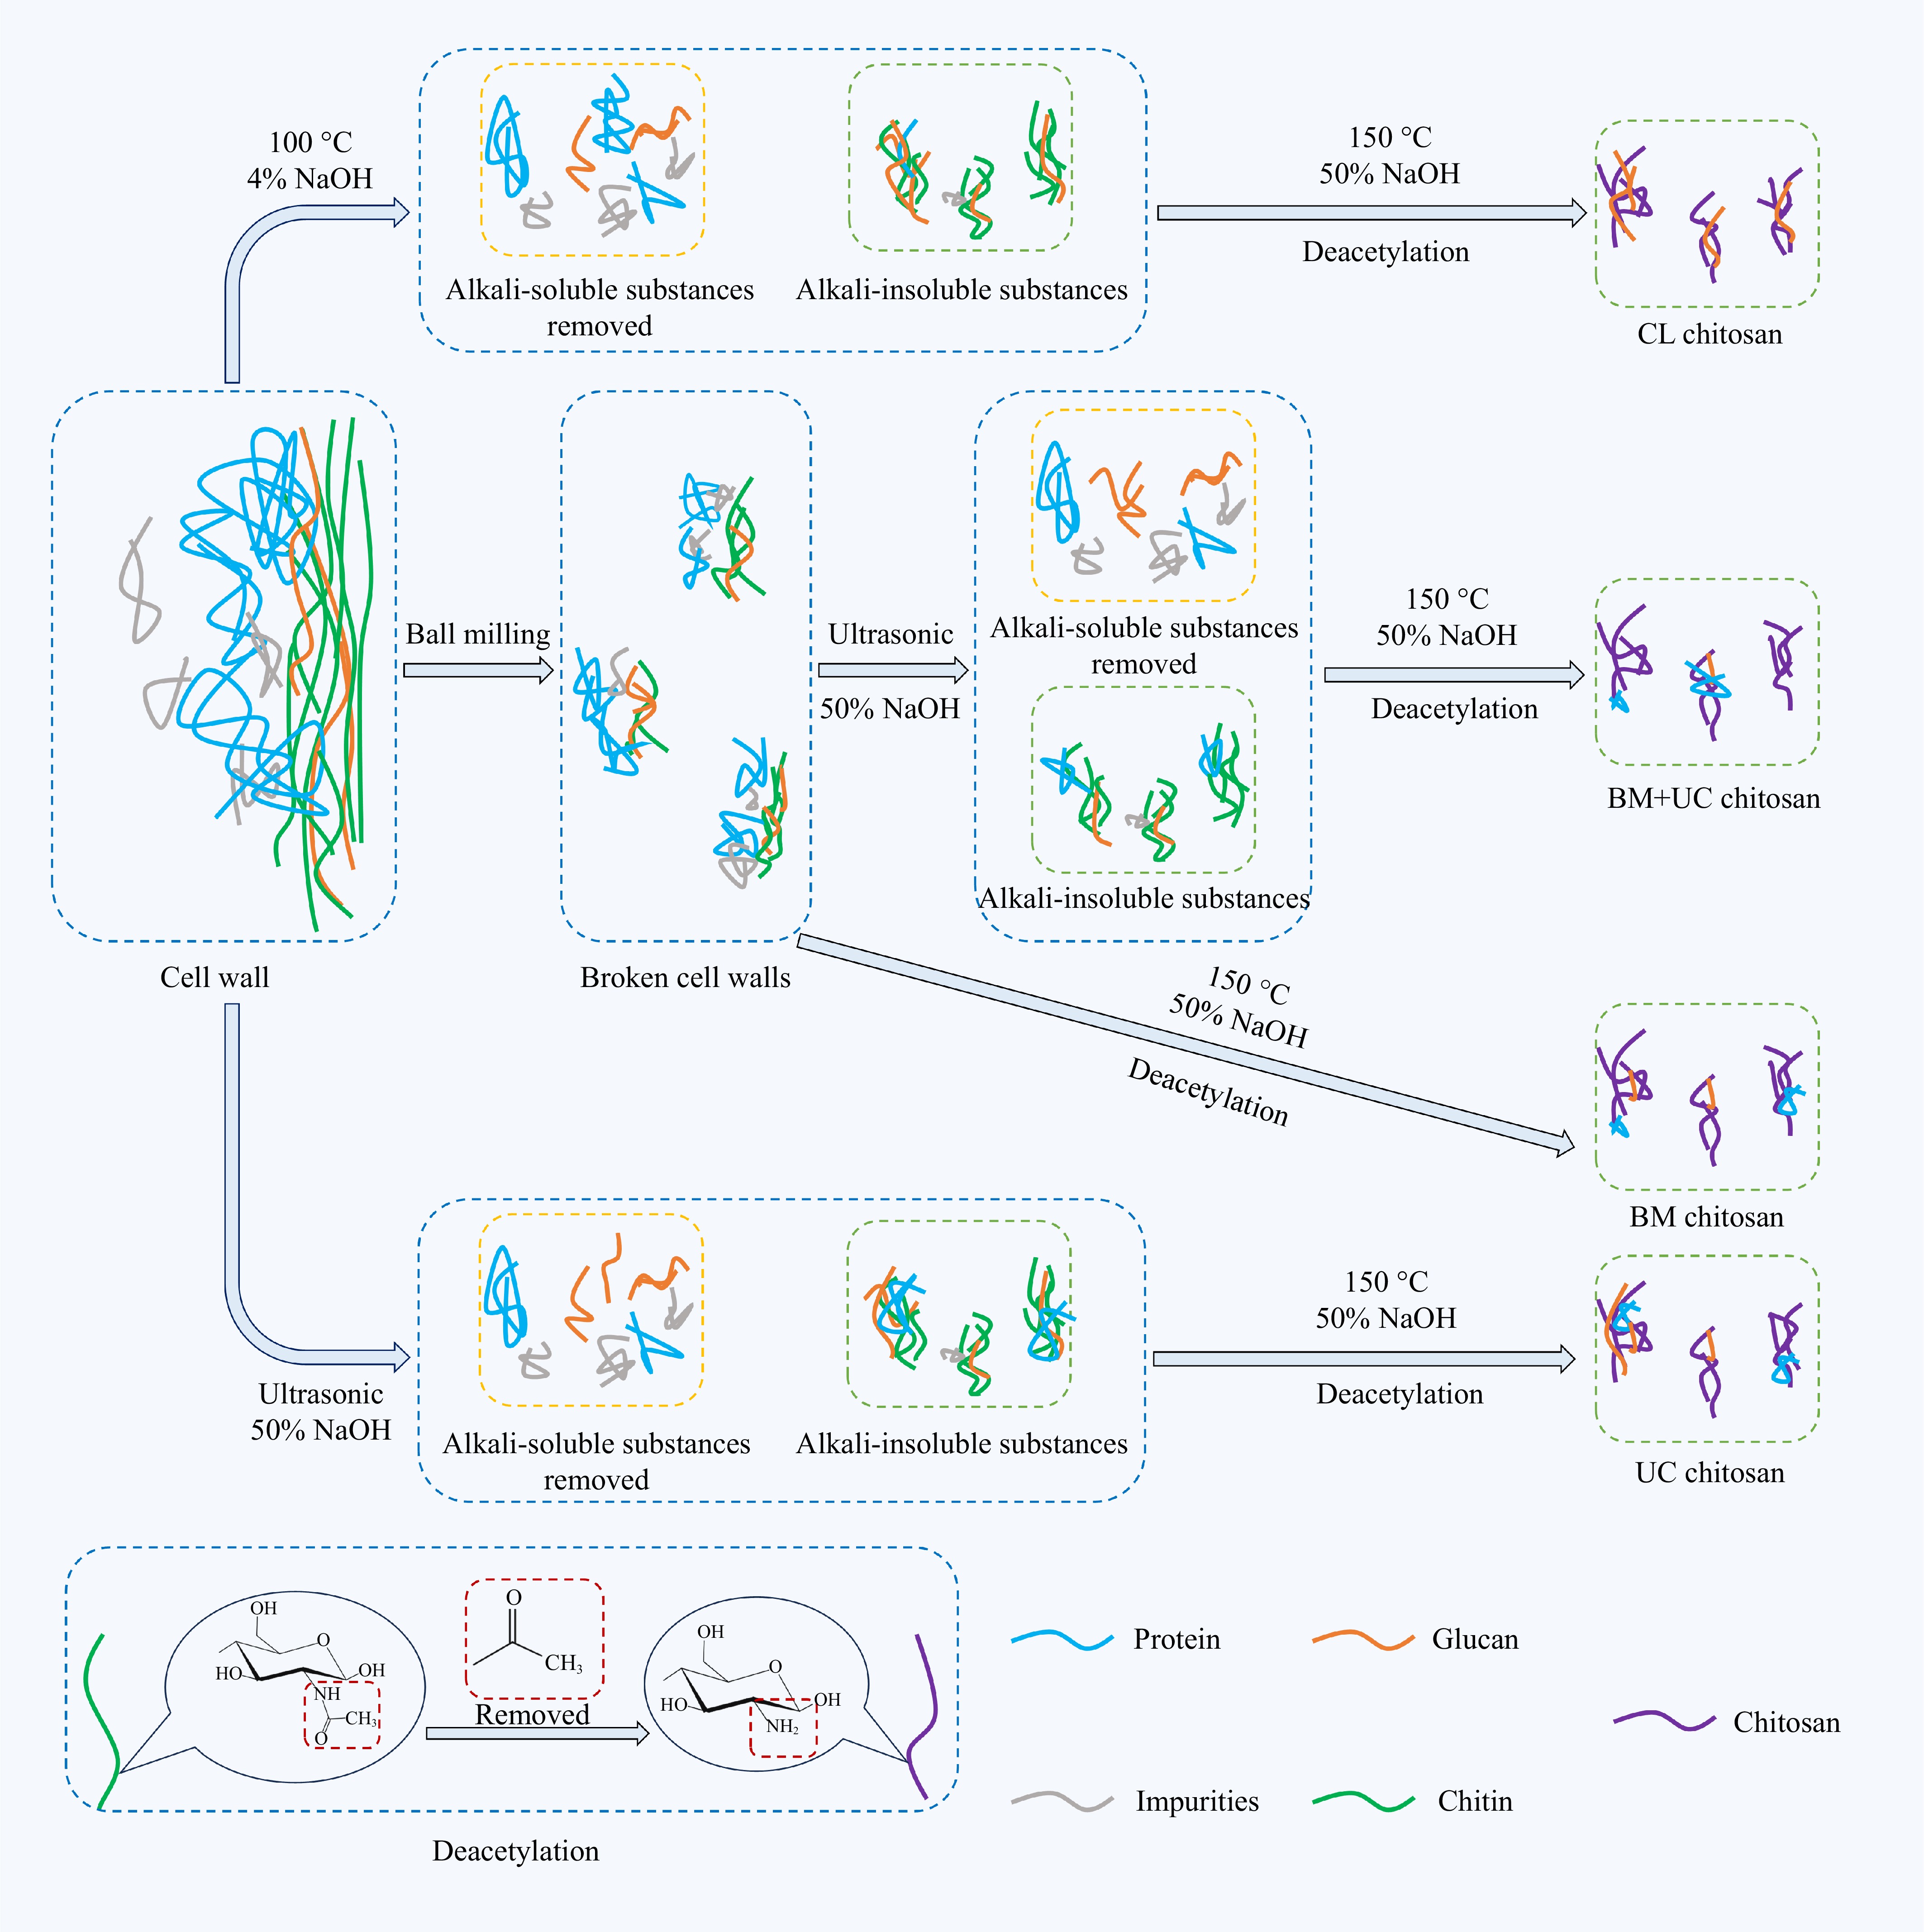
Figure 6.
Potential changes in chitin, glucan, and protein within the cell walls of Agaricus bisporus during different extraction processes.
BM chitosan exhibits a lower glucan content than CL chitosan. This phenomenon may be attributed to the promotional effect of the ball-milling treatment on the disintegration of the fungal cell wall structure, thereby exposing a greater number of NaOH-binding sites. As a consequence, the breakage of the chitin-glucan bond is promoted[13], leading to a reduction in glucan content in the products. Furthermore, the generation of bubbles during sonication leads to their abrupt collapse under conditions of localized high temperatures and pressures. This process results in the release of a significant amount of energy, which in turn disrupts the structural integrity of cell walls[53]. This process promotes the release and dissolution of polysaccharides within the cell walls[54]. As shown in Fig. 6, the cavitation effect of sonication treatment may have facilitated the release and solubilization of glucan from the cell walls of Agaricus bisporus, ultimately reducing its glucan content in BM + S chitosan. Compared to other CS samples treated once with a NaOH solution, CL chitosan was obtained by treating the material twice with NaOH. This greater exposure to the NaOH solution resulted in CL chitosan being more effective in the removal of proteins during the production process, and consequently, the protein content of the final product was reduced (Fig. 6).
The association between the lipid-binding activity of chitosan products and their composition
-
The reason for the higher in vitro lipid-binding activity of BM + S chitosan compared to other Agaricus bisporus chitosan products may be its high purity and high DD, as mentioned before. However, this explanation fails to account for why CM chitosan, despite possessing higher purity and DD values, exhibits inferior in vitro lipid-binding activity compared to BM + S chitosan. This phenomenon may be attributable to the higher protein content in BM + S chitosan products compared to CM chitosan. Proteins undergo a process known as hydrolysis when exposed to alkaline conditions. This results in the exposure of additional polar groups, such as carboxyl and amino groups. The presence of these groups has been shown to enhance the adsorption capacity of proteins[55]. As shown in Fig. 5d, the protein content of the BM + S chitosan product was significantly higher than that of the BM, S, and CL chitosan products. Consequently, the BM + S chitosan product possesses a greater number of polar groups than the other three Agaricus bisporus chitosan products, thereby exhibiting enhanced in vitro lipid-binding activity. Similarly, BM + S chitosan exhibits superior oil-binding capacity and bile acid adsorption capability compared to CM chitosan due to its higher content of polar functional groups. The inhibitory effect of the sample on pancreatic lipase activity is related to its adsorption capacity; the greater the adsorption capacity, the tighter the sample binds to the enzyme, preventing the binding of the substrate to the enzyme[56]. This may explain why BM + S chitosan exhibits a higher pancreatic lipase inhibitory rate than other chitosan products.
-
The combined treatment of ball-milling and ultrasound techniques increased the yield of chitosan products from Agaricus bisporus by a multiple of 1.67 relative to the traditional extraction method. Moreover, employing this method enhances the purity and DD value of Agaricus bisporus chitosan, thereby increasing its in vitro lipid-binding activity. This study provides technical guidance for the energy-efficient and high-yield extraction of carbohydrate products from edible fungi, thereby facilitating the development and application of lipid-binding products derived from edible fungi.
This work was funded by the National Key Research and Development Program for Intergovernmental International Science and Technology Innovation Cooperation (Grant No. 2024YFE0109500), the National Natural Science Foundation of China (Grant Nos 32472367, 32372249), the 'Pioneer' and 'Leading Goose' R&D Program of Zhejiang Province (Grant No. 2025C01100), and the Belarusian Republican Foundation for Fundamental Research (Grant No. Х24KITG-002).
-
The authors confirm contribution to the paper as follows: study conception and design: Feng S, Shao P; data collection: Yang J, Zong T, Zhang M; analysis and interpretation of results: Yang P, Wang Y, Hileuskaya K, Xie Y; draft manuscript preparation: Yang J, Feng S. All authors reviewed the results and approved the final version of the manuscript.
-
The datasets generated during and/or analyzed during the current study are available from the corresponding author upon reasonable request.
-
The authors declare that they have no conflict of interest.
-
accompanies this paper online at: https://doi.org/10.48130/fia-0026-0016.
- Supplementary Table S1 Design factors and levels for response surface experiments.
- Supplementary Table S2 Design and results of the Box-Behnken test.
- Supplementary Table S3 ANOVA results for the quadratic model of the extraction yield determined via RSM.
- Supplementary Fig. S1 Chitosan extraction process from Agaricus bisporus.
- Supplementary Fig. S2 Changes in the structure of Agaricus bisporus powder and chitin during ball milling.
- Supplementary Fig. S3 Changes in chitin and glucan in Agaricus bisporus following sonication treatment.
- Copyright: © 2026 by the author(s). Published by Maximum Academic Press on behalf of China Agricultural University, Zhejiang University and Shenyang Agricultural University. This article is an open access article distributed under Creative Commons Attribution License (CC BY 4.0), visit https://creativecommons.org/licenses/by/4.0/.
-
About this article
Cite this article
Feng S, Yang J, Zong T, Zhang M, Yang P, et al. 2026. Synergistic ball milling-sonication extraction: impact on structural properties and lipid-binding activity of Agaricus bisporus chitosan. Food Innovation and Advances 5(2): 230−239 doi: 10.48130/fia-0026-0016 

Synergistic ball milling-sonication extraction: impact on structural properties and lipid-binding activity of Agaricus bisporus chitosan
- Received: 20 November 2025
- Revised: 27 January 2026
- Accepted: 28 January 2026
- Published online: 15 May 2026
Abstract: In this study, dried Agaricus bisporus powder was pretreated using ball milling and sonication processing, followed by alkaline treatment to obtain Agaricus bisporus chitosan products. The yield of chitosan products obtained by this method can reach up to 5.67% ± 0.21%, with a purity of 85.54% ± 1.36% and a deacetylation degree of 82.86% ± 7.16%. However, the yield of chitosan products from traditional methods was only 2.13% ± 0.17%, with a purity of 44.51% ± 2.07% and a deacetylation degree (DD) of just 33.14% ± 5.41%. Furthermore, the results of the in vitro evaluation of lipid-binding activity show that chitosan obtained utilizing the ball-milling-sonication method exhibits superior lipid-binding activity. Specifically, its pancreatic lipase inhibitory rate was 85.15% ± 2.76%, and its adsorption capacities for oil, cholesterol micelles, sodium glycocholate hydrate, and sodium taurocholate were 5.52 ± 0.75 g/g, 13.07 ± 0.33 mg/g, 8.91 ± 0.56 mg/g and 4.87 ± 0.39 mg/g, respectively. Consequently, the chitosan preparation process utilized in this study possesses the potential to enhance the lipid-binding efficacy of Agaricus bisporus.
-
Key words:
- Agaricus bisporus /
- Chitosan /
- Ball milling /
- Sonication /
- Extraction /
- Lipid-binding