-
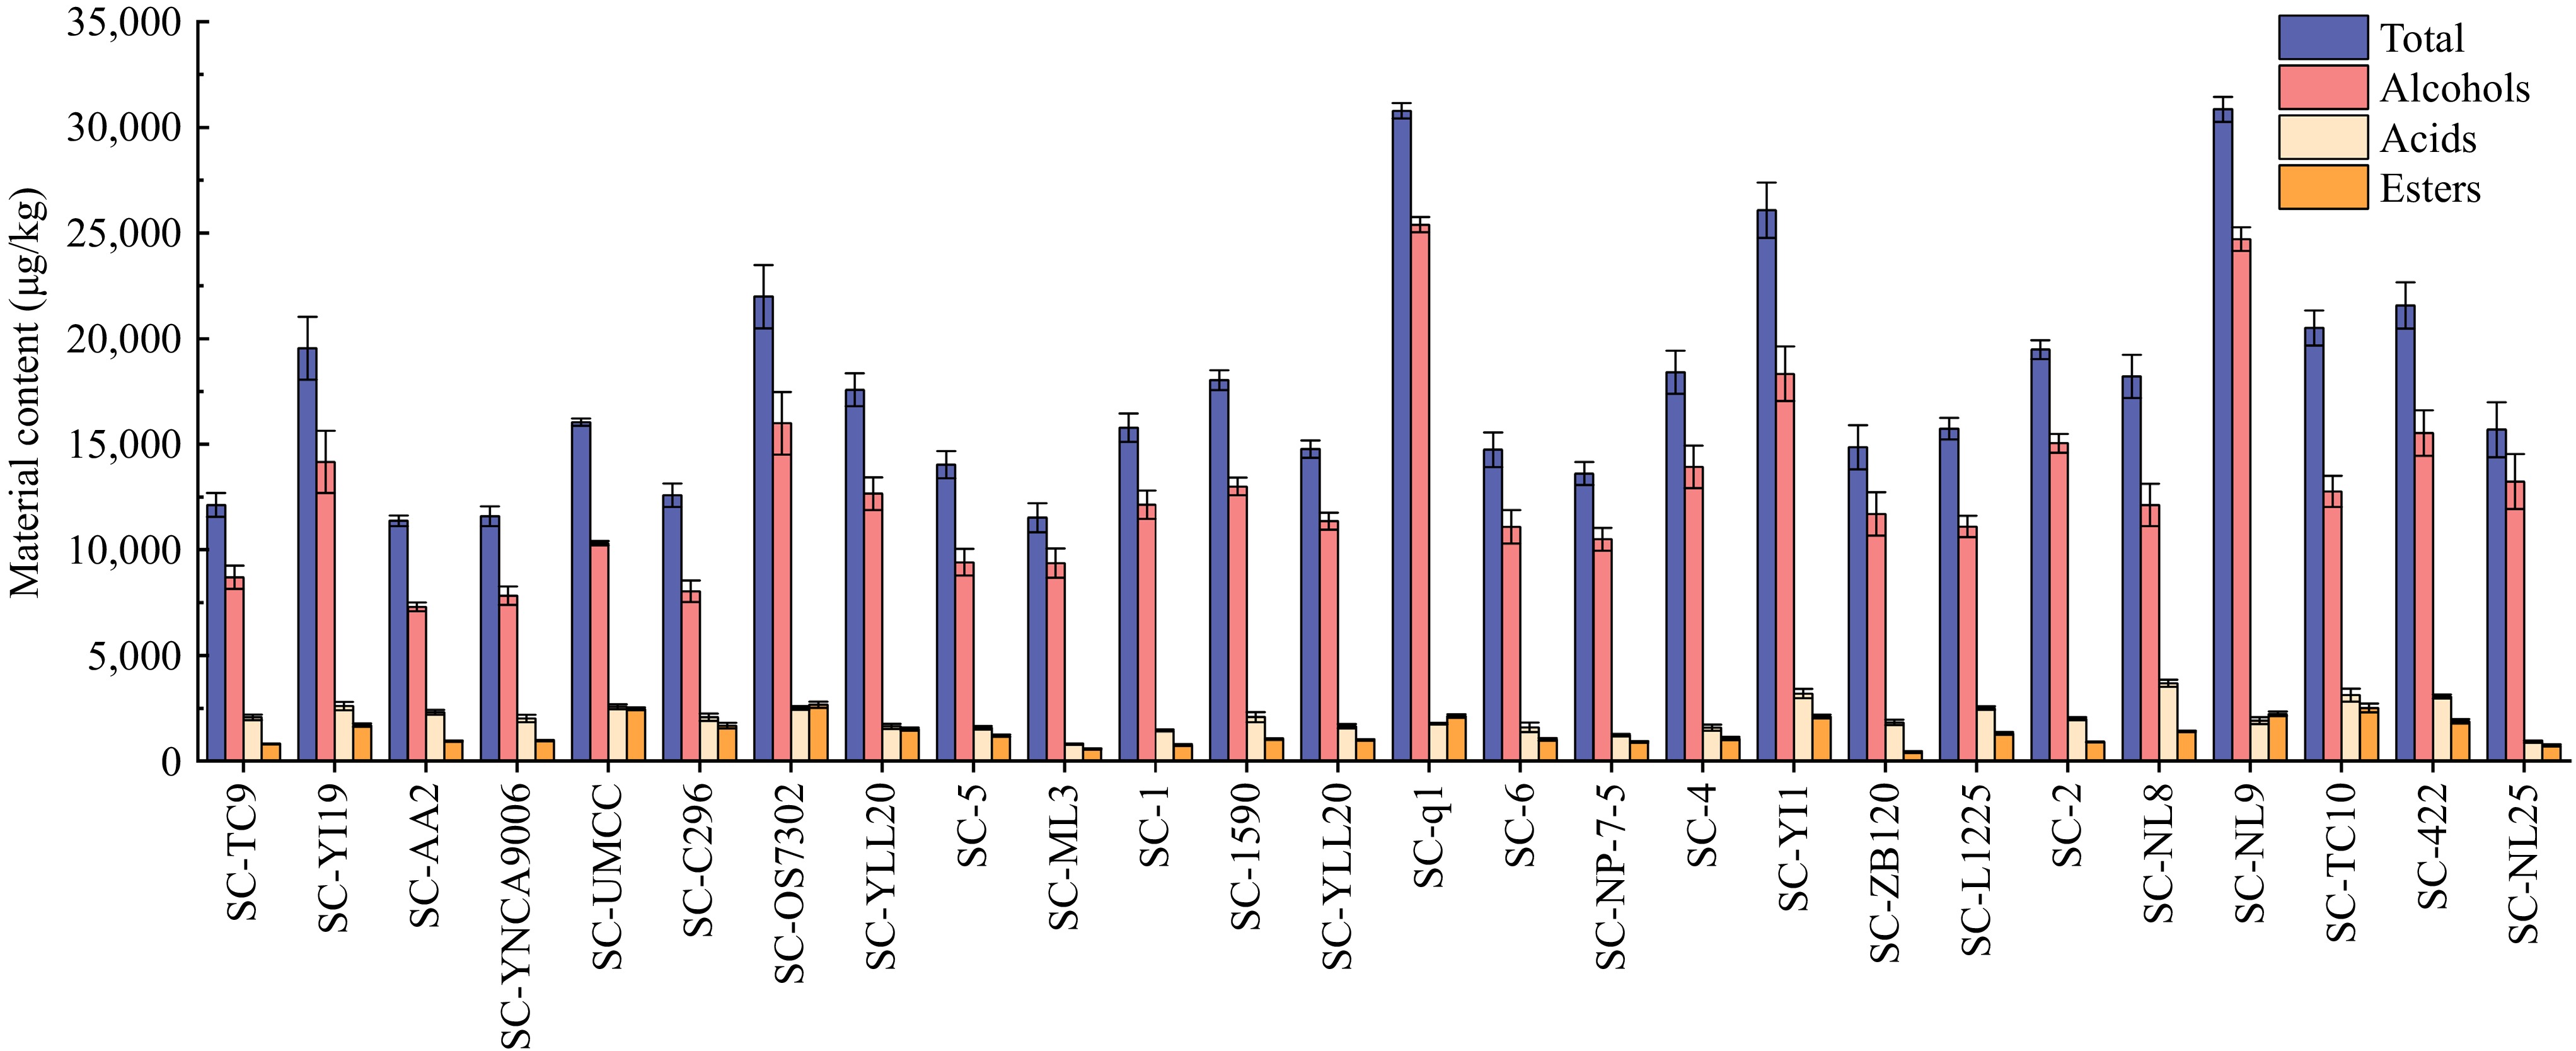
Figure 1.
Comparison of total contents of aroma components, alcohols, acids, and esters in fermentation broths of different strains.
-
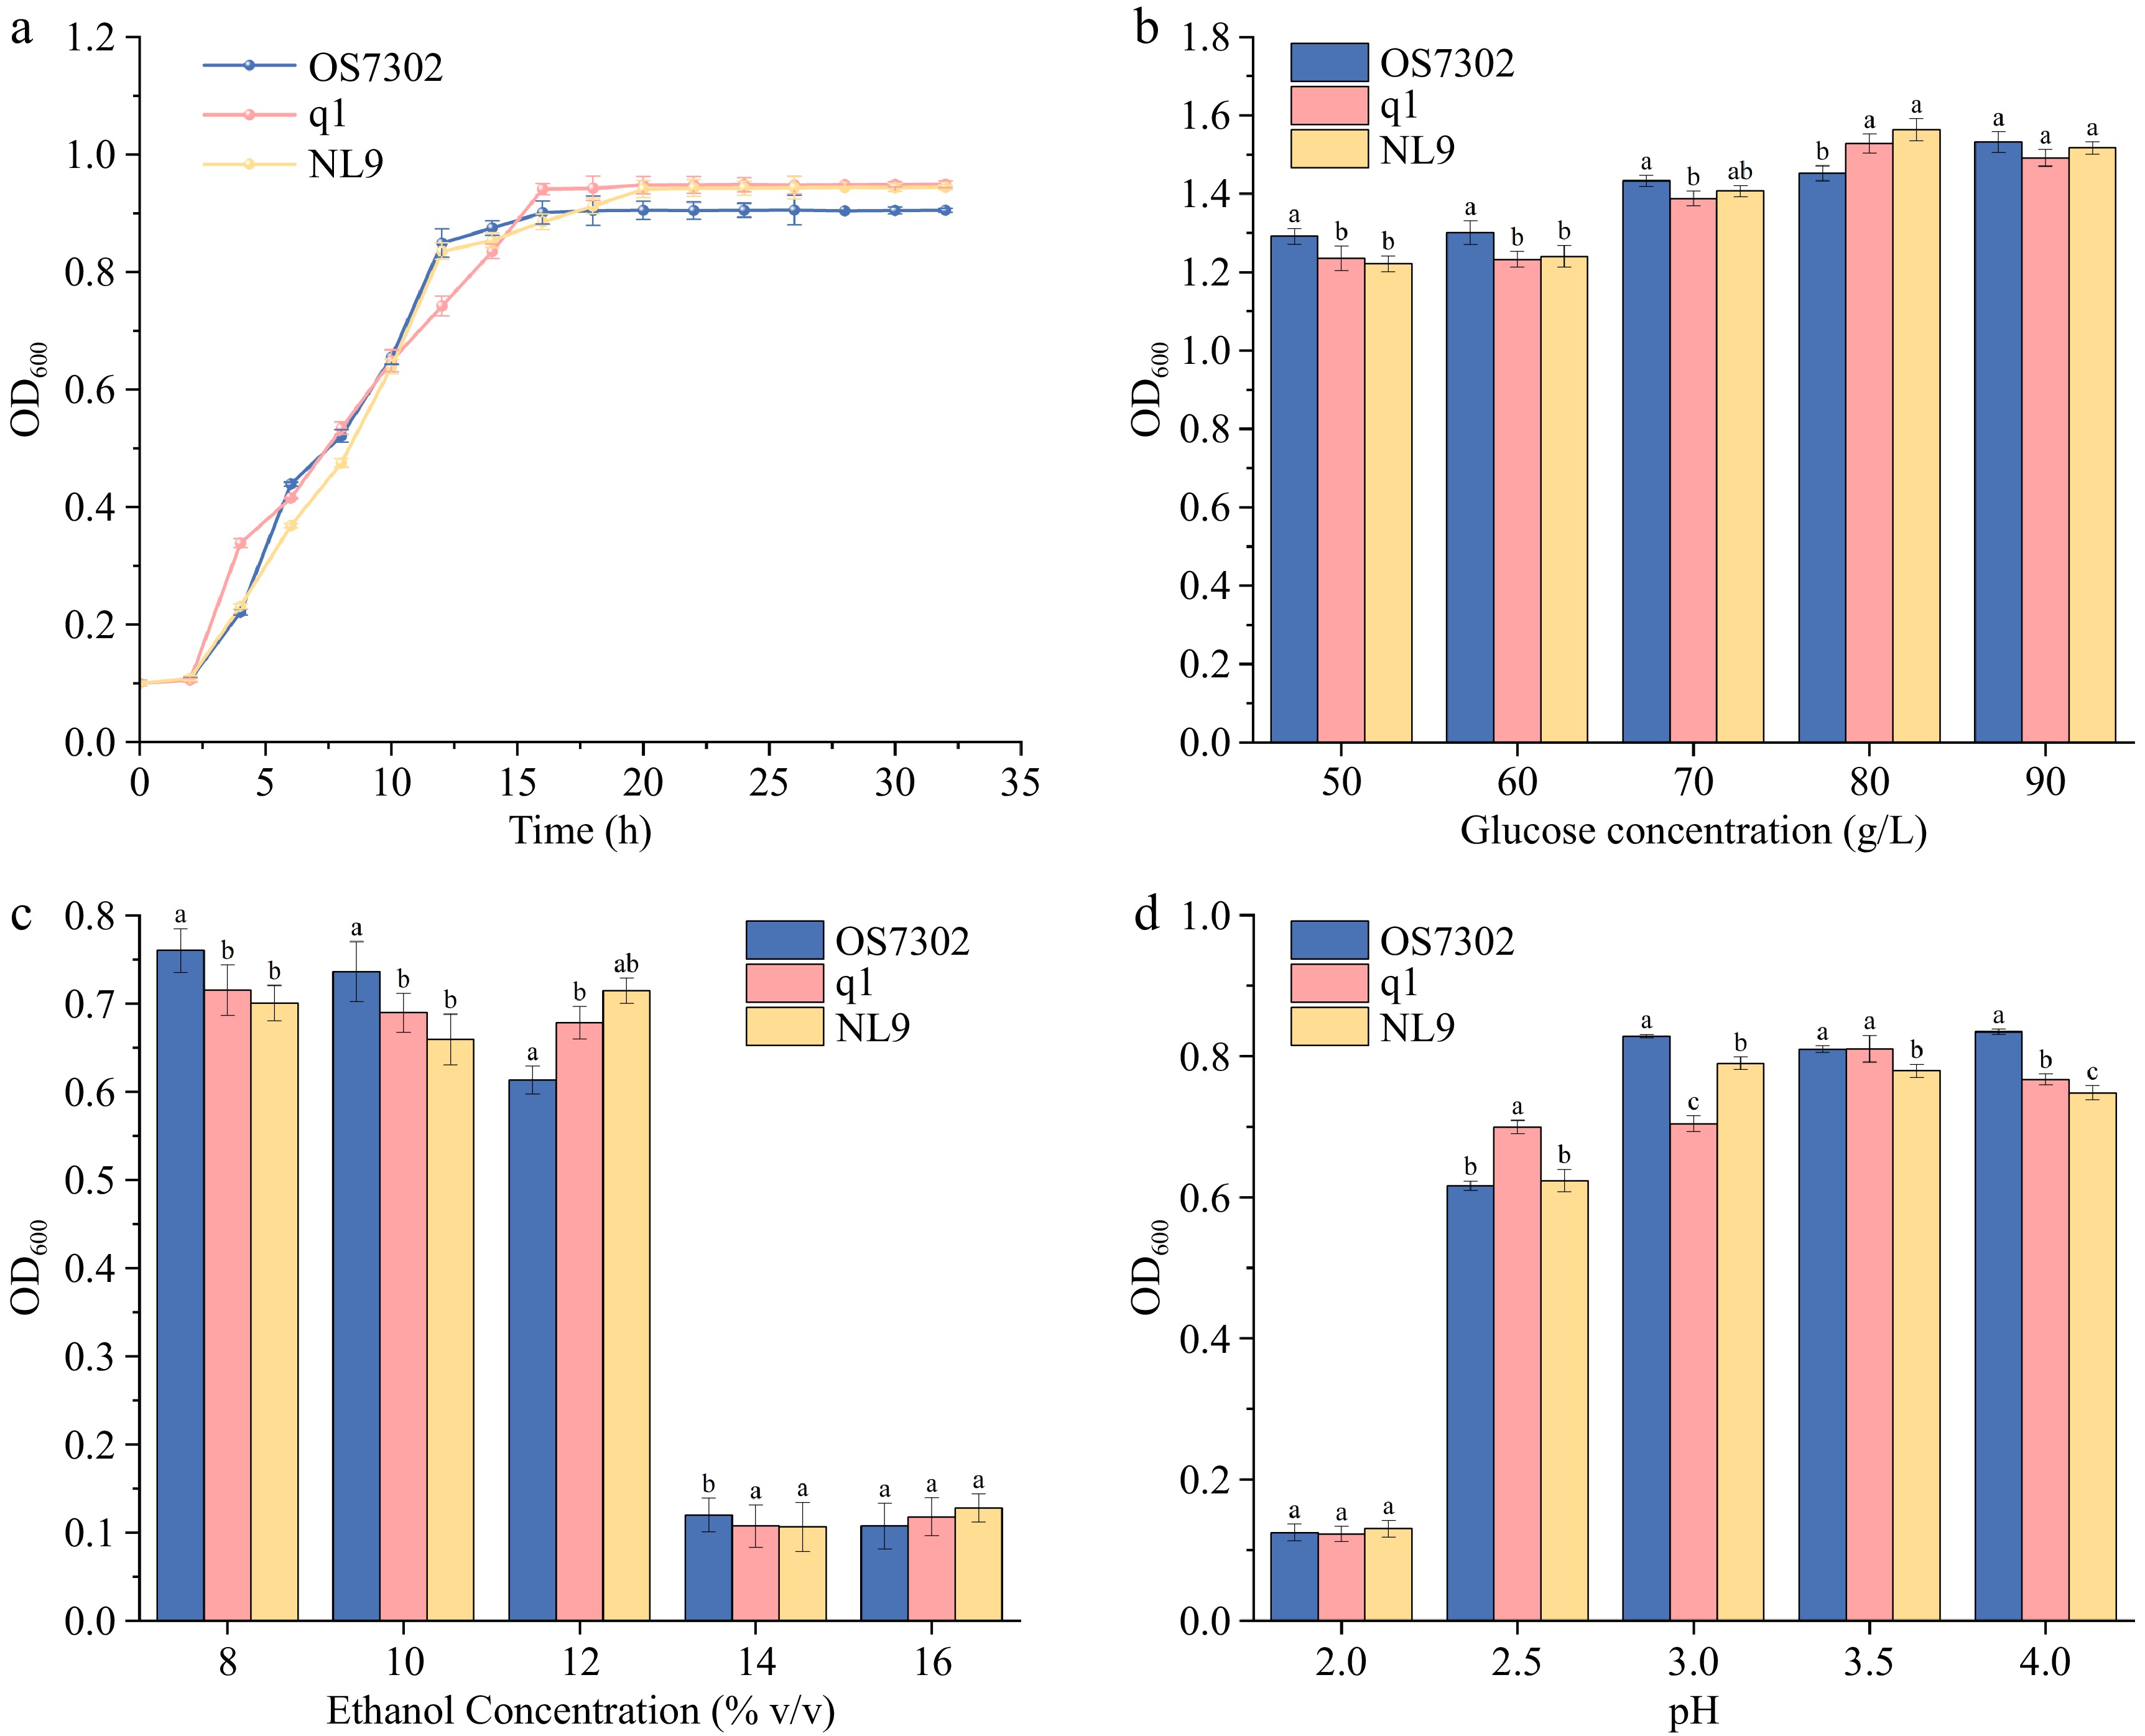
Figure 2.
Growth curves and stress tolerance analysis of S. cerevisiae strains. (a) Growth curves; (b) high-glucose tolerance; (c) ethanol tolerance; (d) pH tolerance.
-
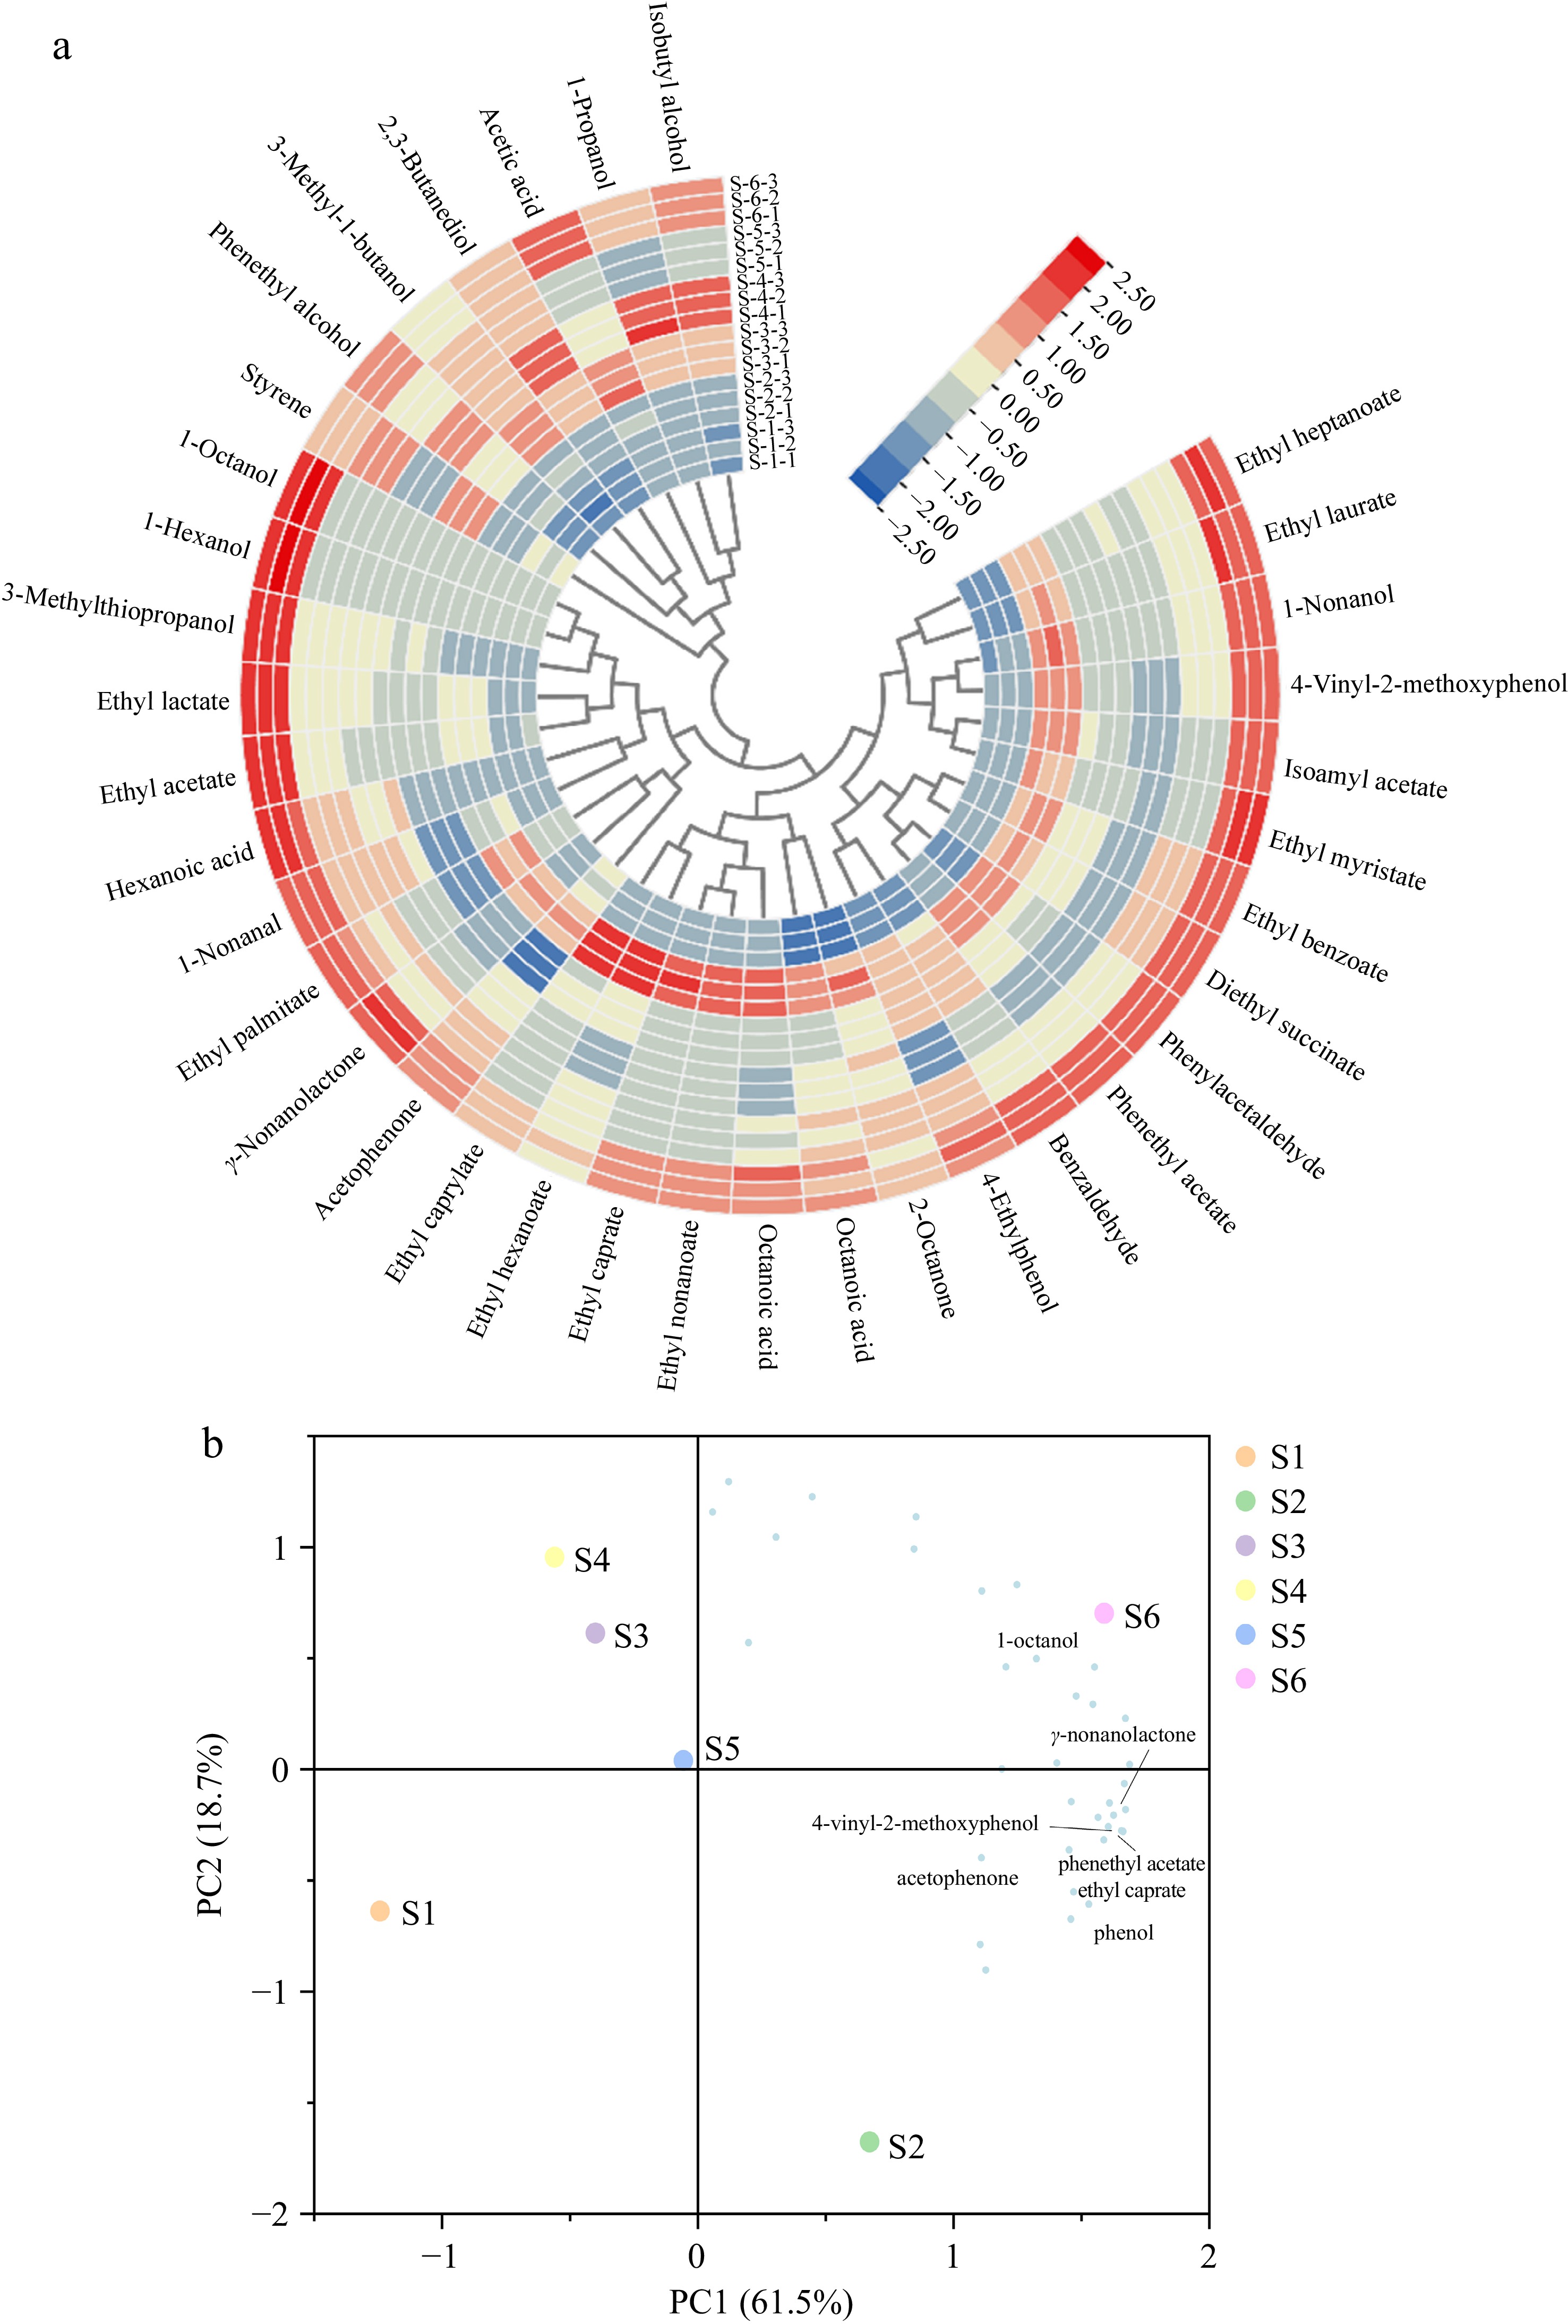
Figure 3.
The differences in volatile flavor compounds of the S1 to S6 groups. (a) Heatmap of volatile flavor compounds. (b) Principal component analysis of volatile flavor compounds and fermentation of Huangjiu with different bacterial communities.
-
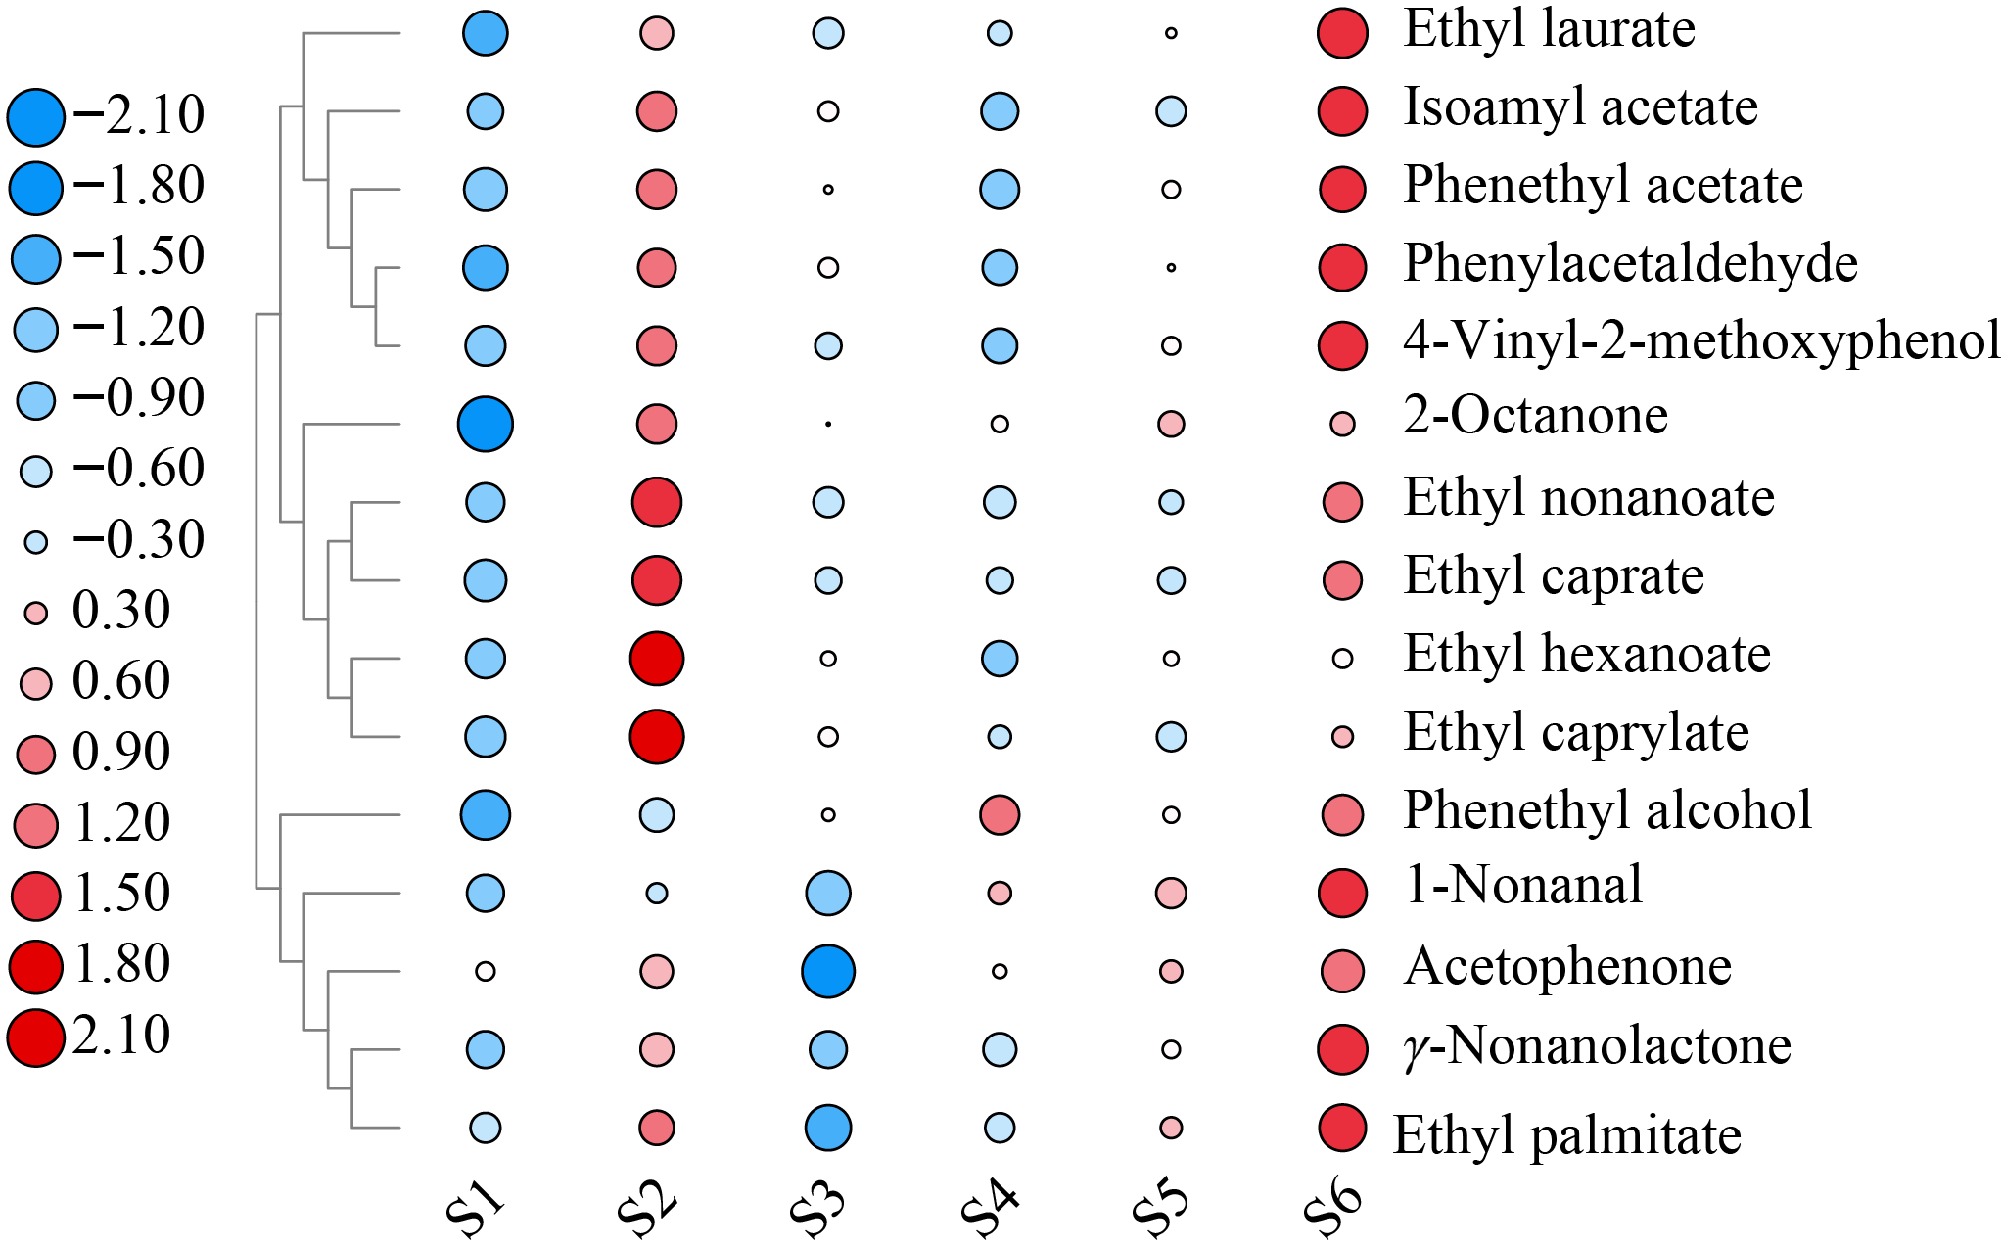
Figure 4.
Heatmap showing the concentration of compounds with OAV ≥ 1. The 15 key aroma compounds were selected from the 36 detected aroma compounds based on an OAV ≥ 1. (Compounds with an OAV ≥ 1 were considered key aroma components in the sample).
-
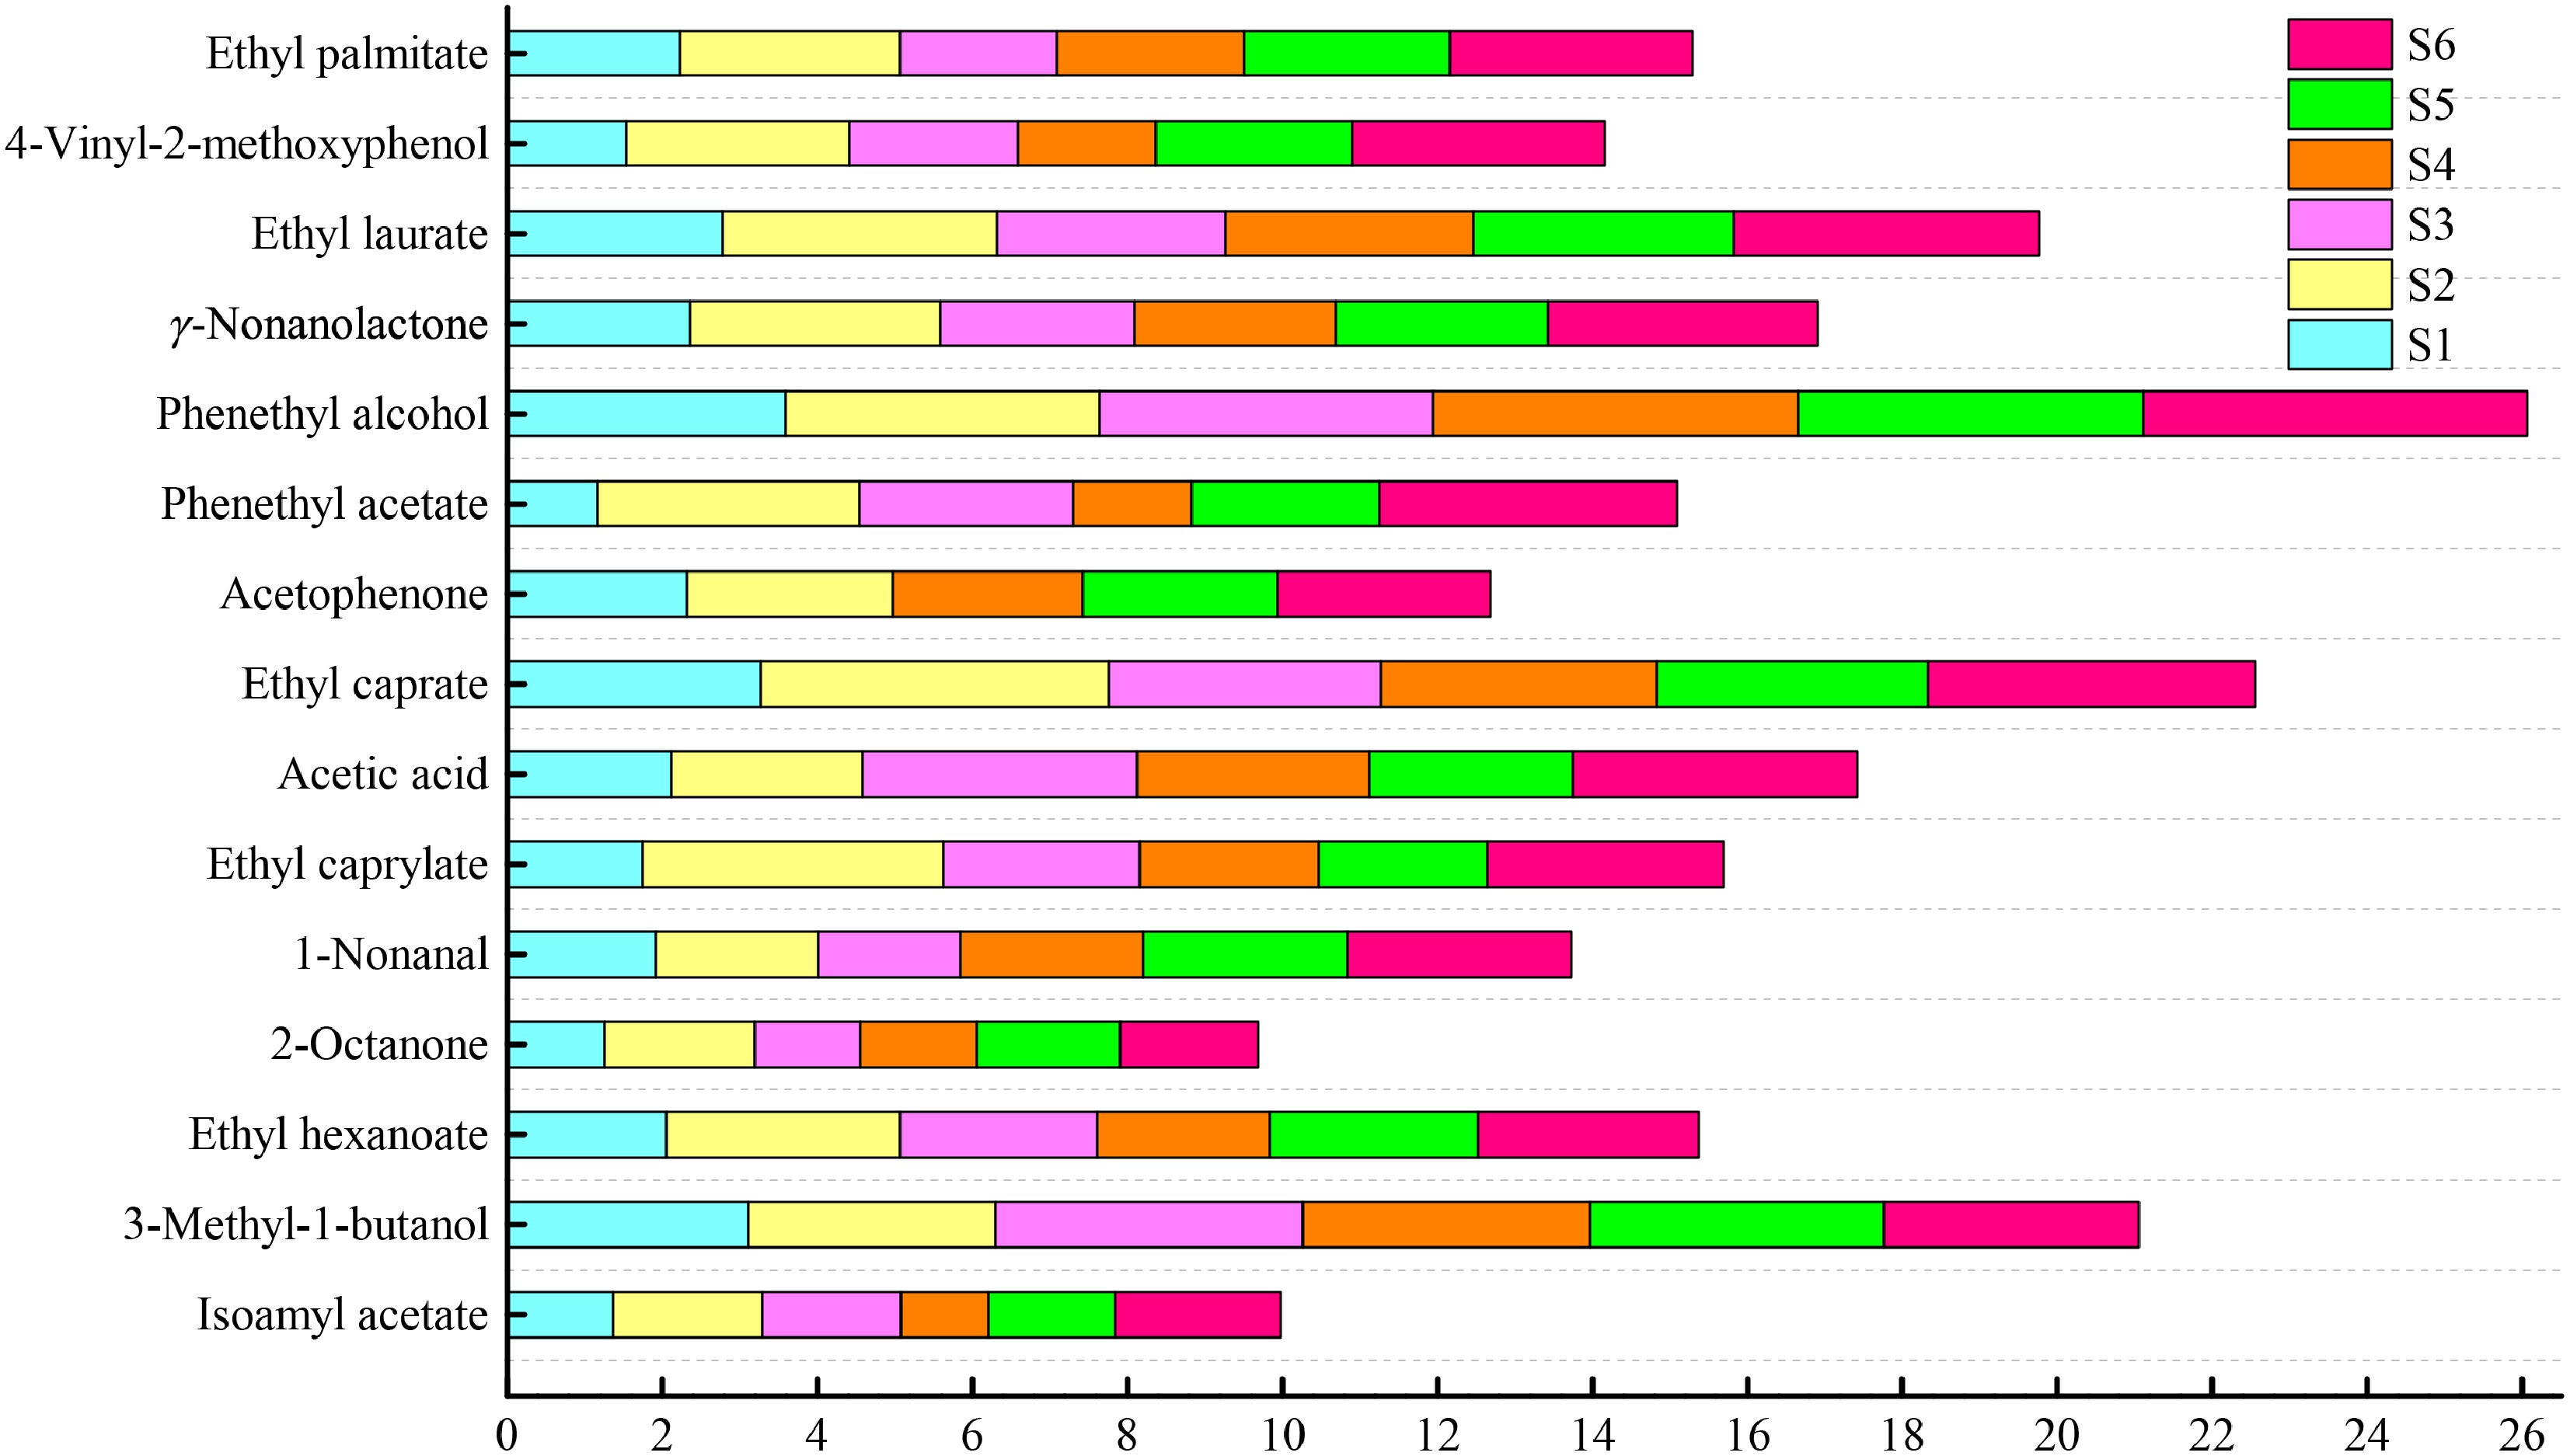
Figure 5.
GC–O aroma intensity comparison chart.
-
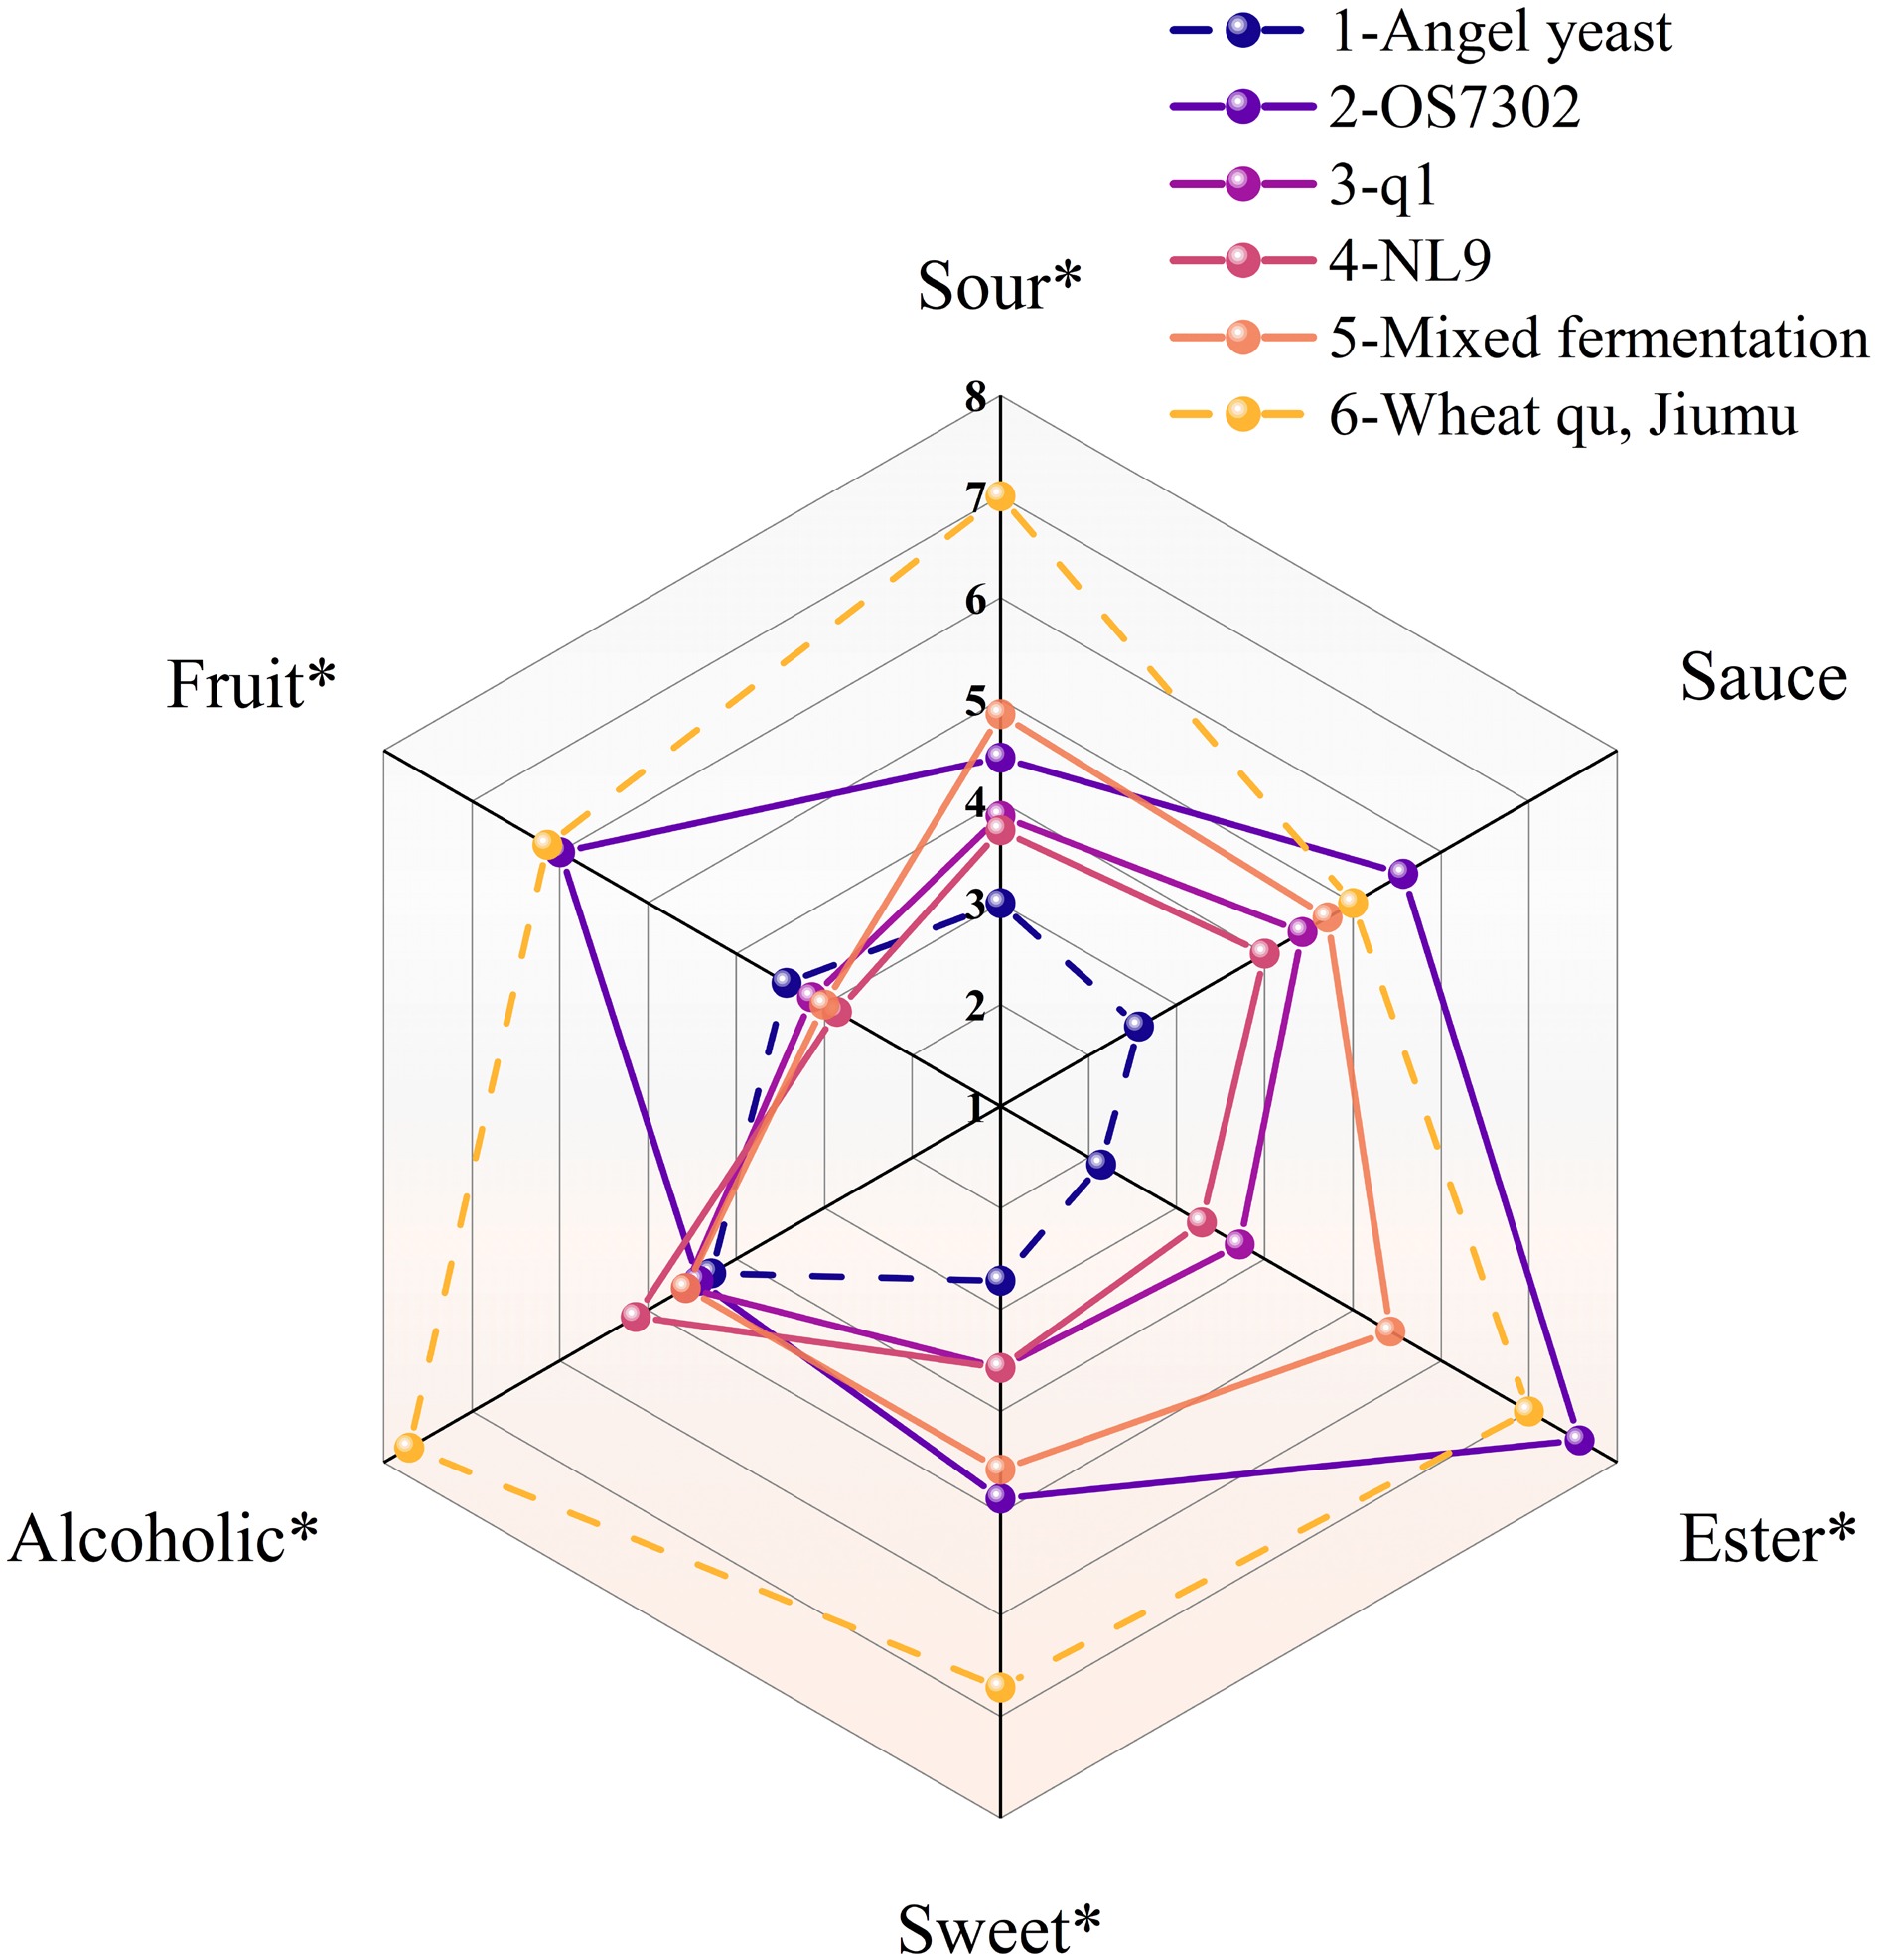
Figure 6.
Radar chart of aroma sensory evaluation of Huangjiu fermented by different strains.
-
Number S. cerevisiae strains GenBank accession numbers 1 TC9 PX904676 2 YI19 PX904677 3 AA2 PX904678 4 YNCA9006 PX904679 5 UMCC PX904680 6 C296 PX904681 7 OS7302 PX904682 8 YLL20 PX904683 9 5 PX904684 10 ML3 PX904685 11 1 PX904686 12 1590 PX904687 13 YLL20-2 PX904688 14 q1 PX904689 15 6 PX904690 16 NP-7-5 PX904691 17 4 PX904692 18 NL9 PX904693 19 TC10 PX904694 20 422 PX904695 21 NL25 PX904696 22 2 PX904697 23 NL8 PX904698 24 YL1 PX904699 25 ZB120 PX904700 26 L1225 PX904701 Table 1.
Identification list of Saccharomyces cerevisiae strains.
-
Group Total acidity (g/L) Amino acid
nitrogen (g/L)Total sugar (g/L) pH S1 6.29 ± 0.01c 0.31 ± 0.01d 4.40 ± 0.56bc 3.56 ± 0.03b S2 5.37 ± 0.07e 0.33 ± 0.02cd 5.40 ± 0.28b 3.58 ± 0.06b S3 5.59 ± 0.04d 0.36 ± 0.01bc 3.80 ± 0.28c 3.68 ± 0.05a S4 5.15 ± 0.04f 0.37 ± 0.010b 4.80 ± 0.57bc 3.76 ± 0.03a S5 6.74 ± 0.04b 0.39 ± 0.02b 4.00 ± 0.57c 3.55 ± 0.01b S6 6.92 ± 0.05a 0.60 ± 0.01a 11.00 ± 0.28a 3.75 ± 0.01a 1 Values with different letters (a−d) in the same column indicate significant differences (p < 0.05). Table 2.
Differences in the physicochemical indices of fermented Huangjiu among different groups.
Figures
(6)
Tables
(2)