-
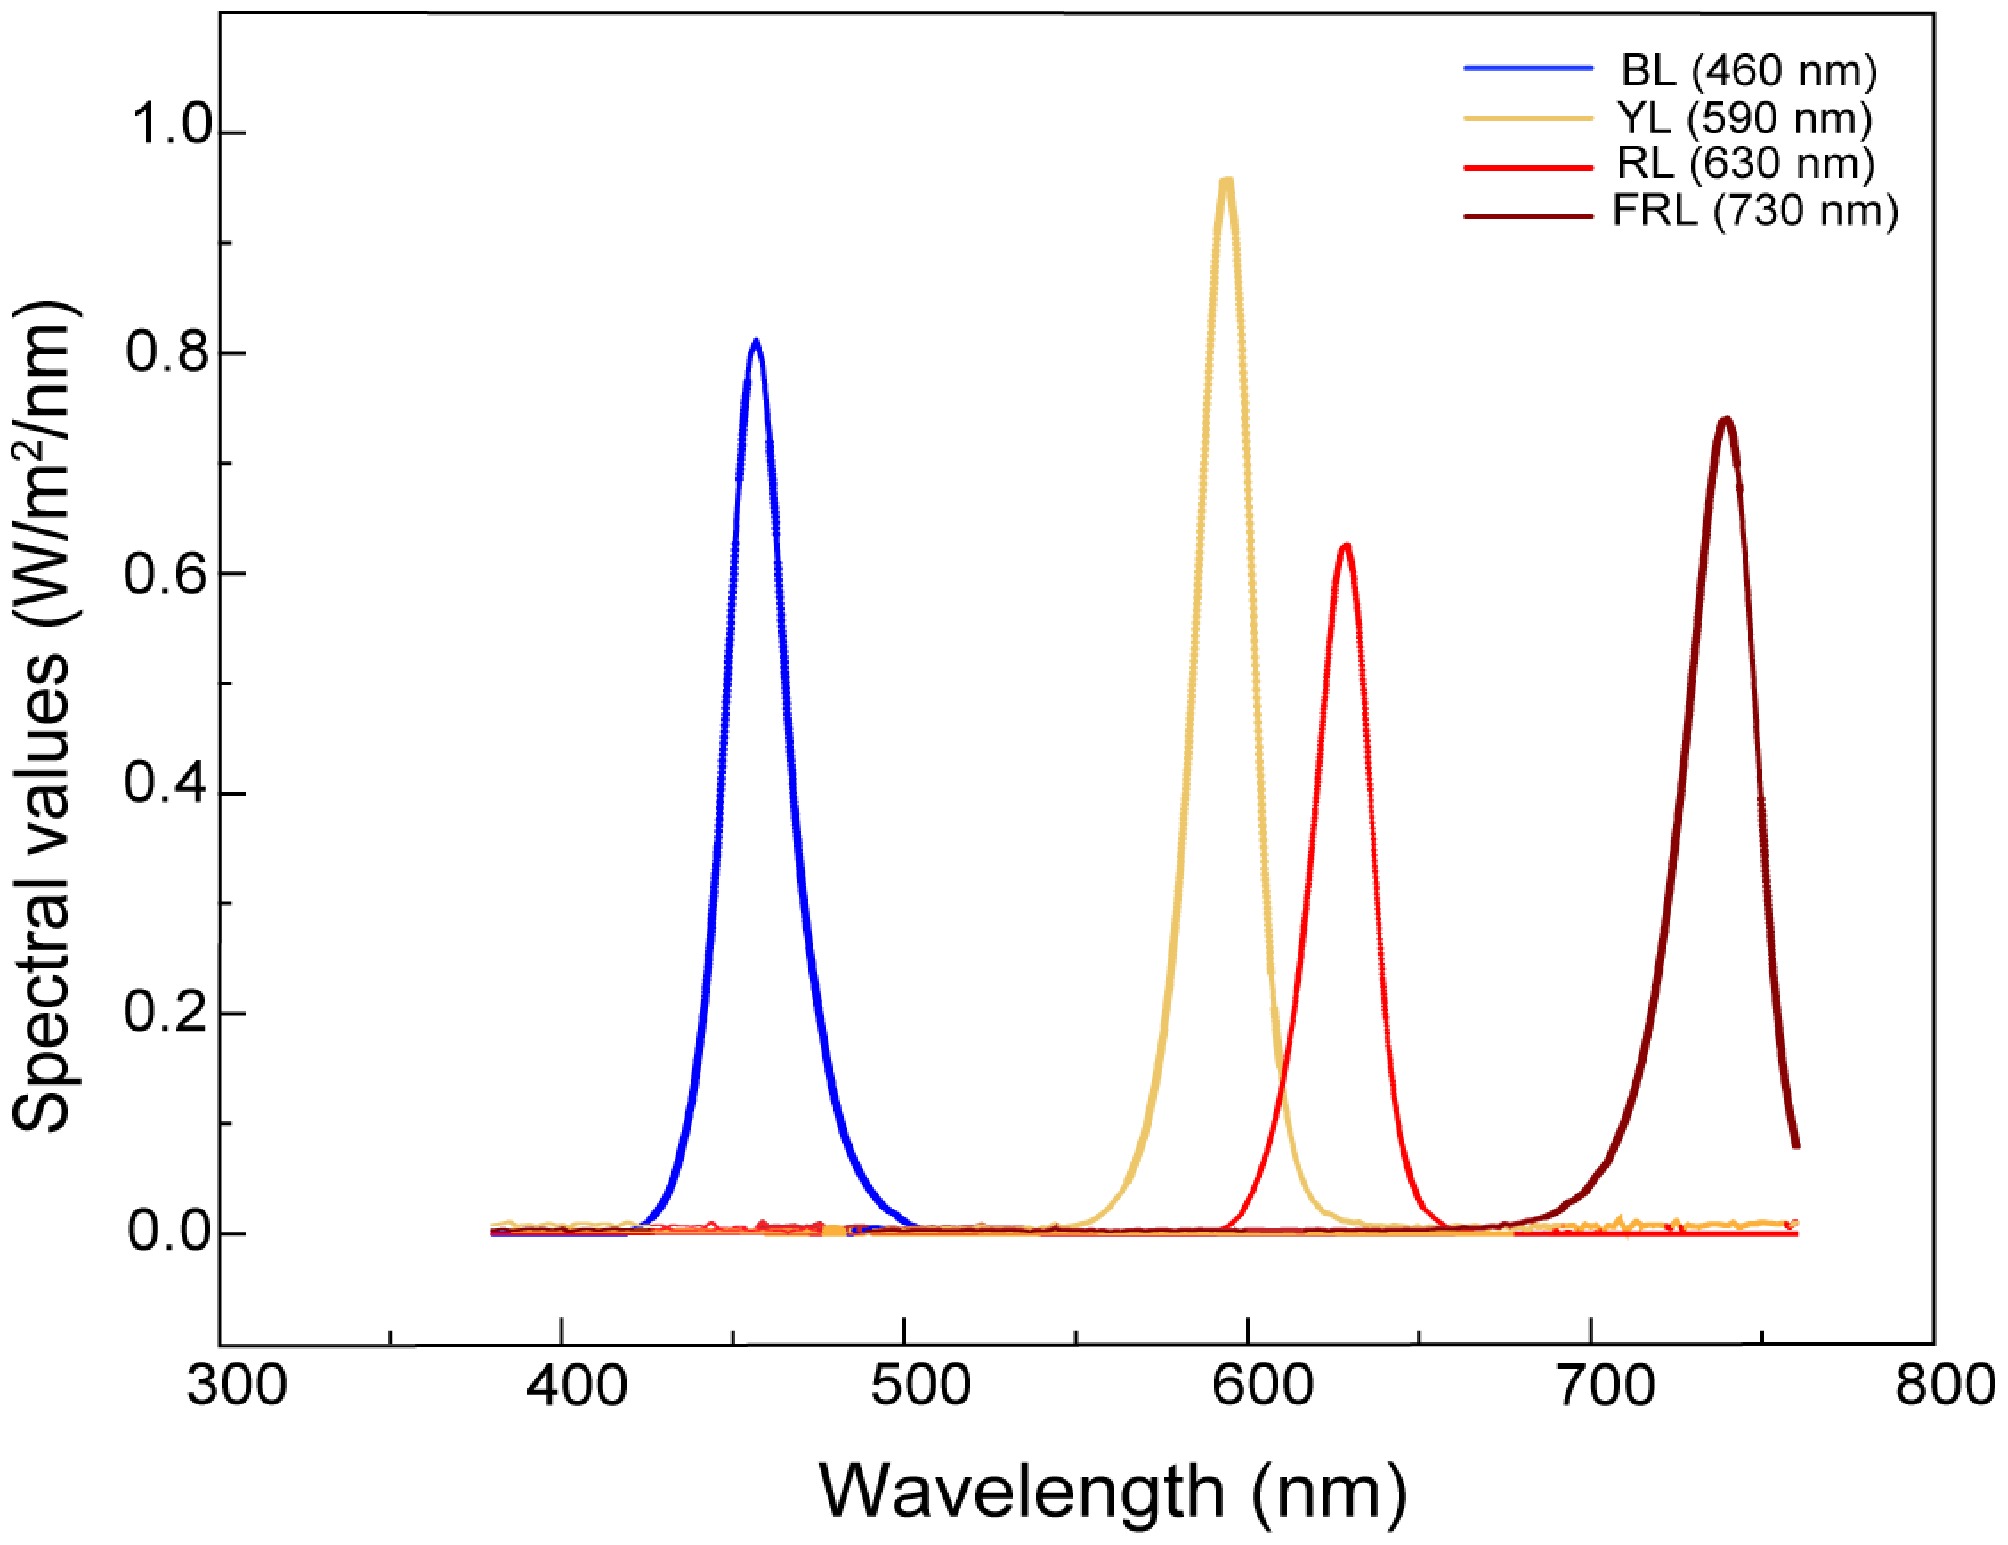
Figure 1.
Spectral photon distribution (SPD) of LED. The SPD was calculated from the spectral energy distribution of the light source, which was measured with a spectroradiometer (UPR-tek PG-200 N, Shanghai, China).
-
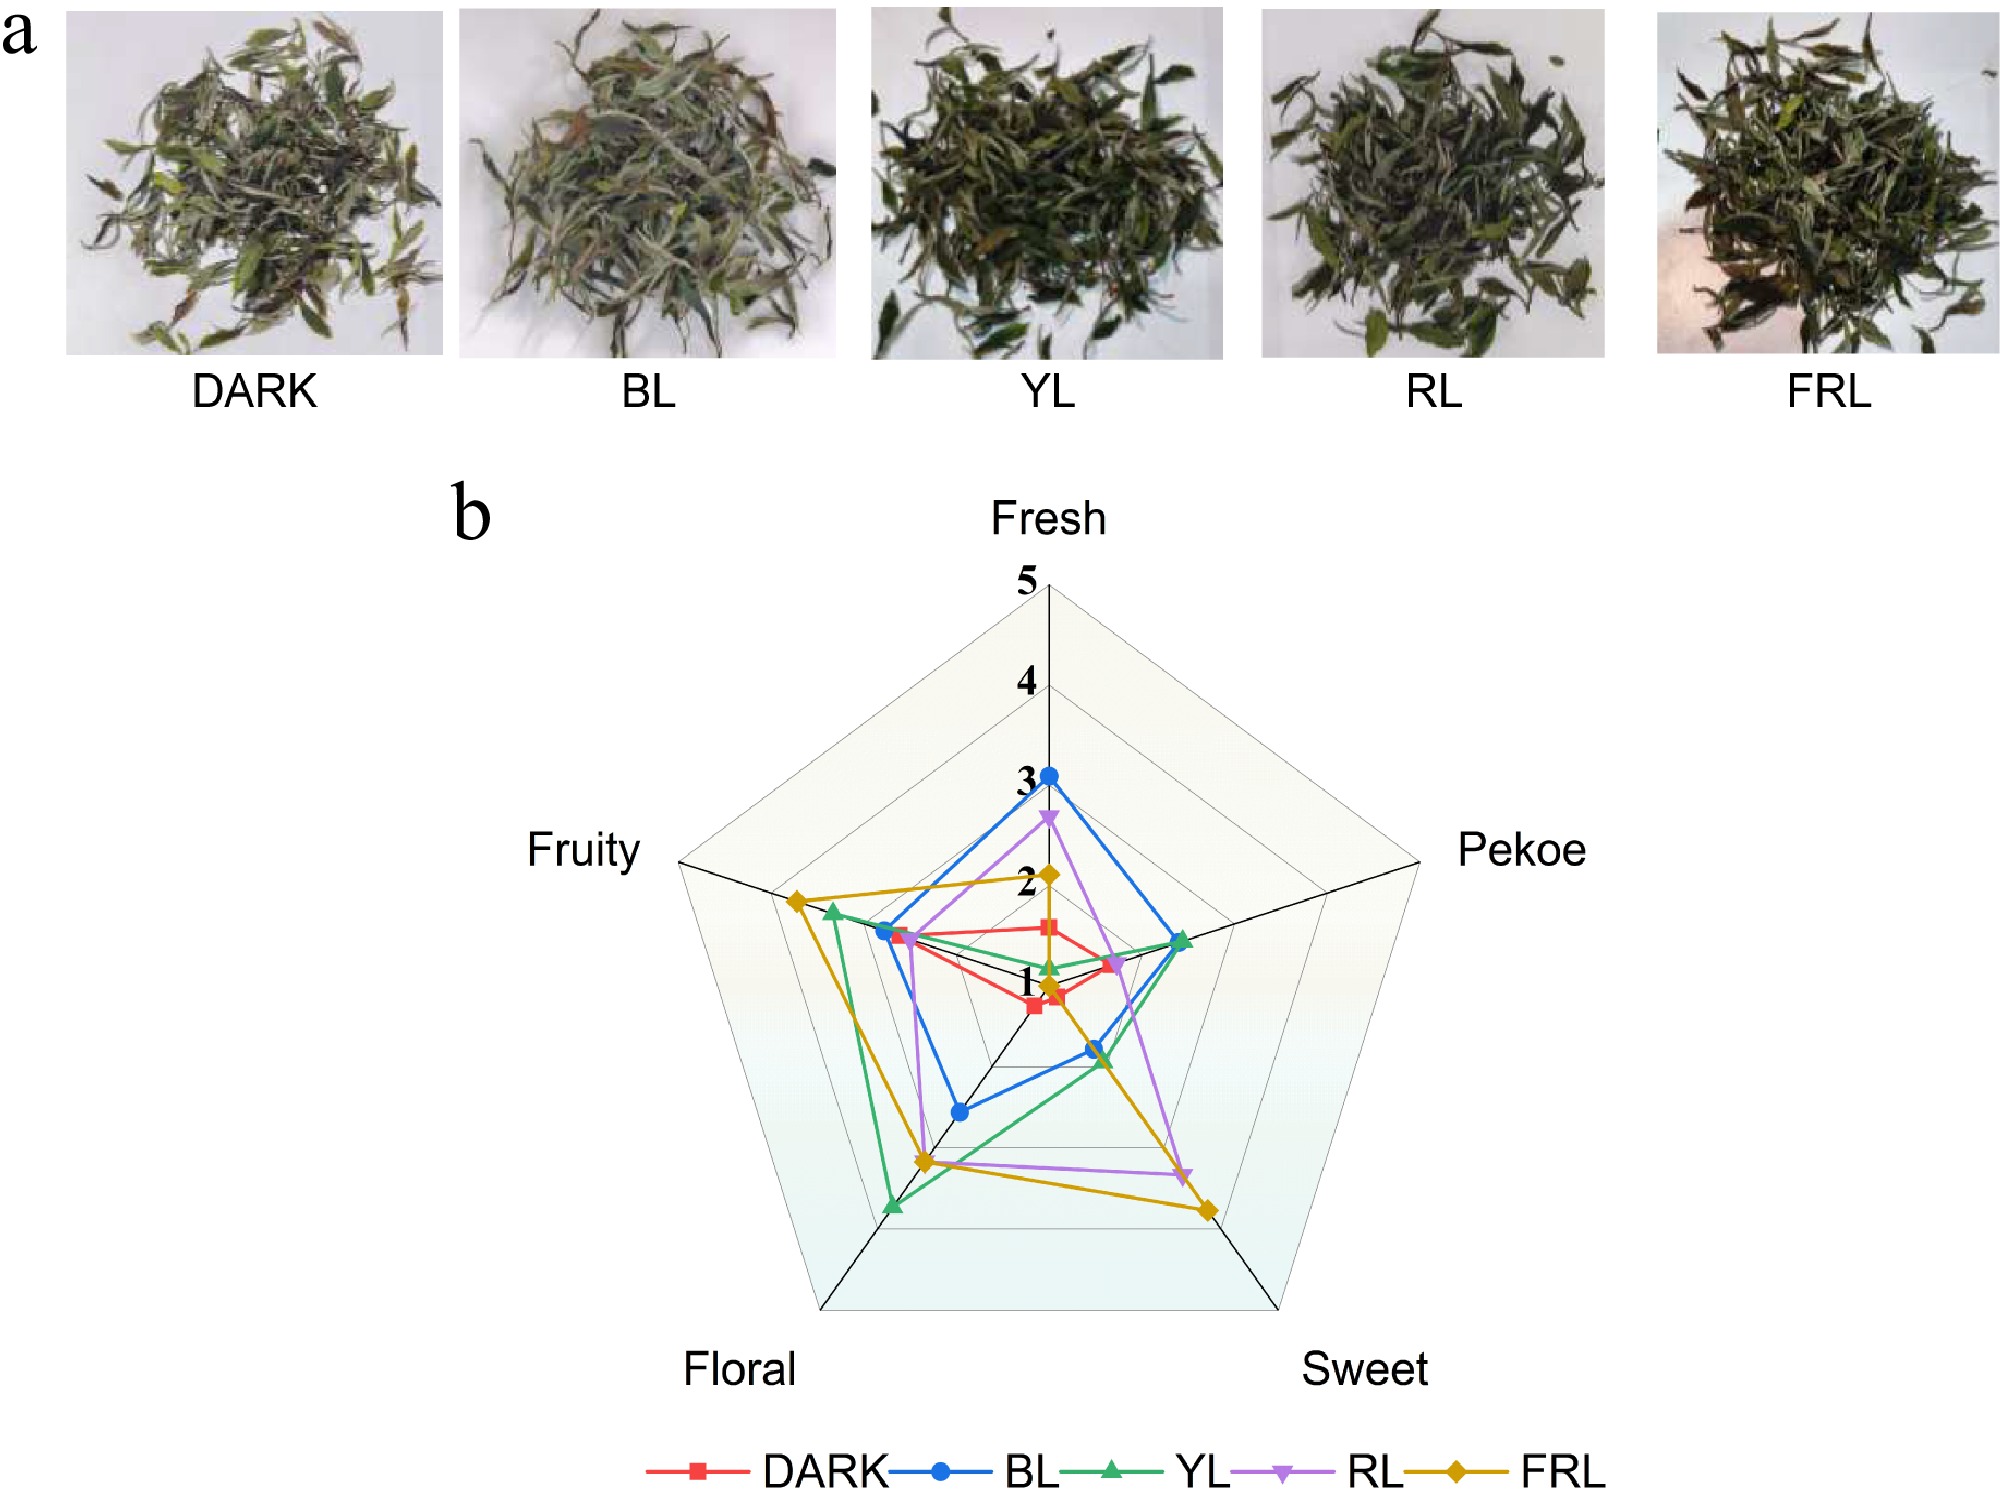
Figure 2.
Sensory evaluation results. (a) Appearance of SWT (Sangzhi white tea). (b) Radar chart of sensory evaluation of SWT under five light treatments. Data were from three independent experiments (n = 3) and are expressed as means ± SD. DARK (dark treatment); BL (460 nm treatment); YL (590 nm treatment); RL (630 nm treatment); FRL (730 nm treatment).
-
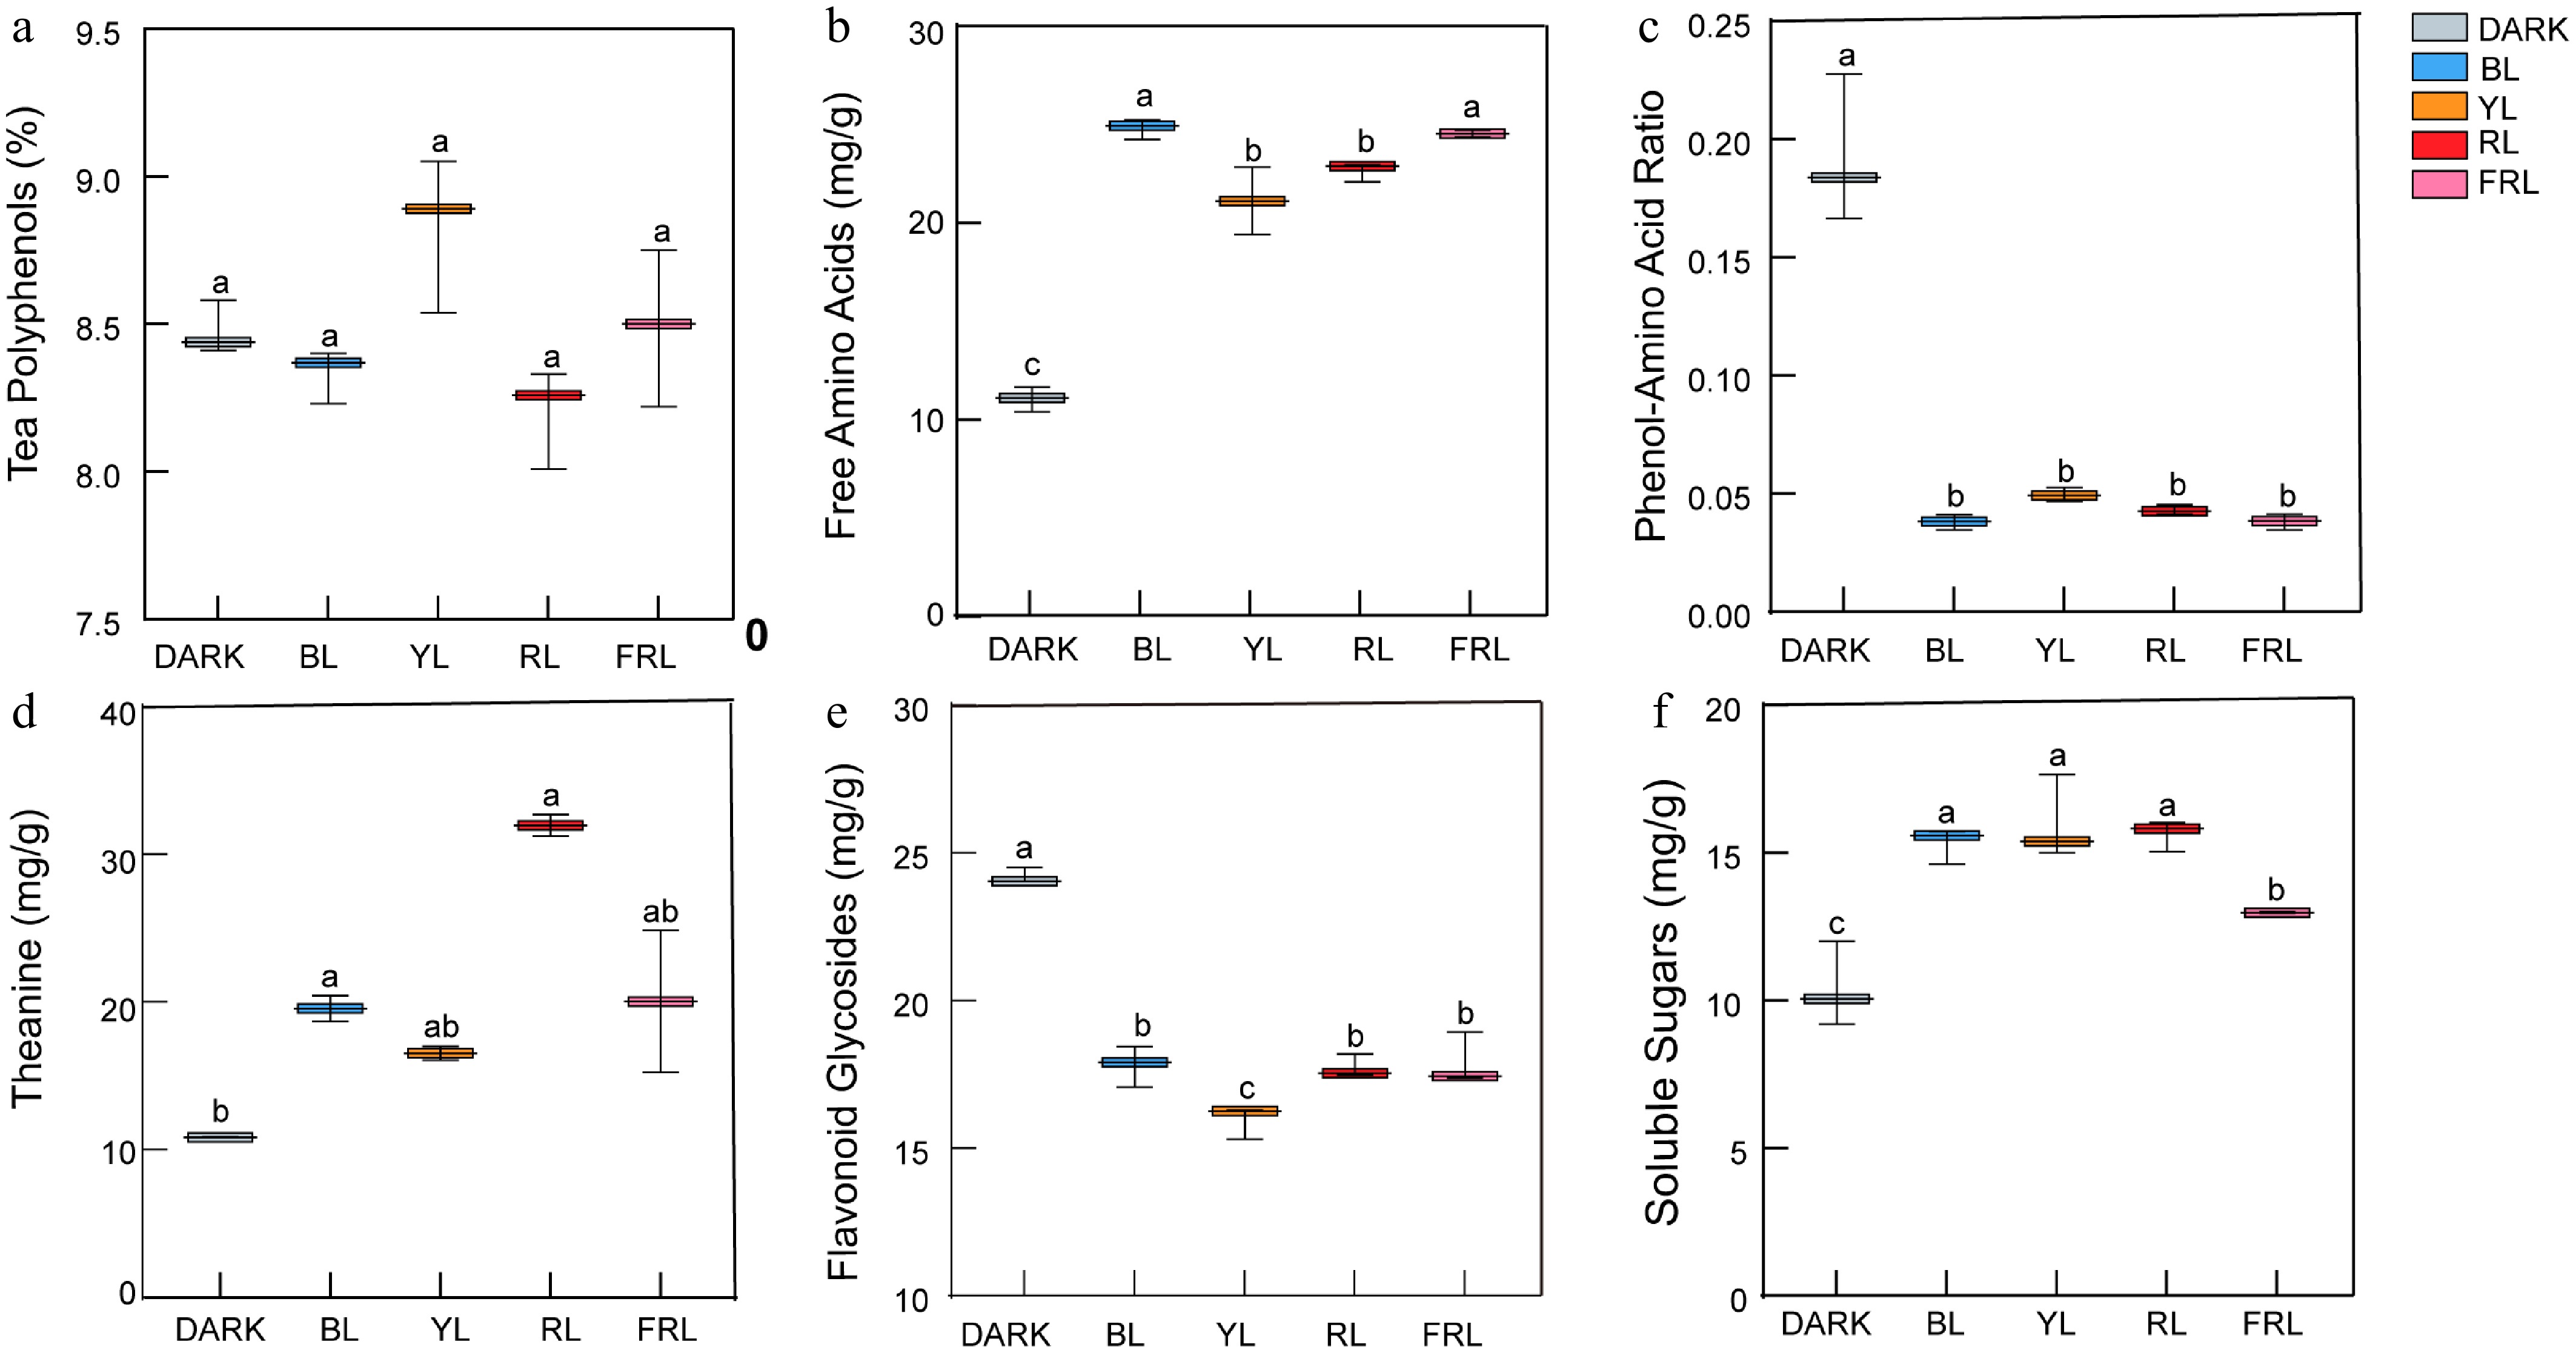
Figure 3.
Nonvolatile content in SWT under different light quality treatments. (a) Polyphenol, (b) free amino acid content, (c) phenol-ammonia ratio, (d) theanine content, (e) content of flavonoid glycosides, and (f) soluble sugar content. Data were from three independent experiments (n = 3) and are expressed as means ± SD. All data were subjected to analysis of variance (ANOVA), and different lowercase letters (a, b, c) indicate significant differences at the p < 0.05 level.
-
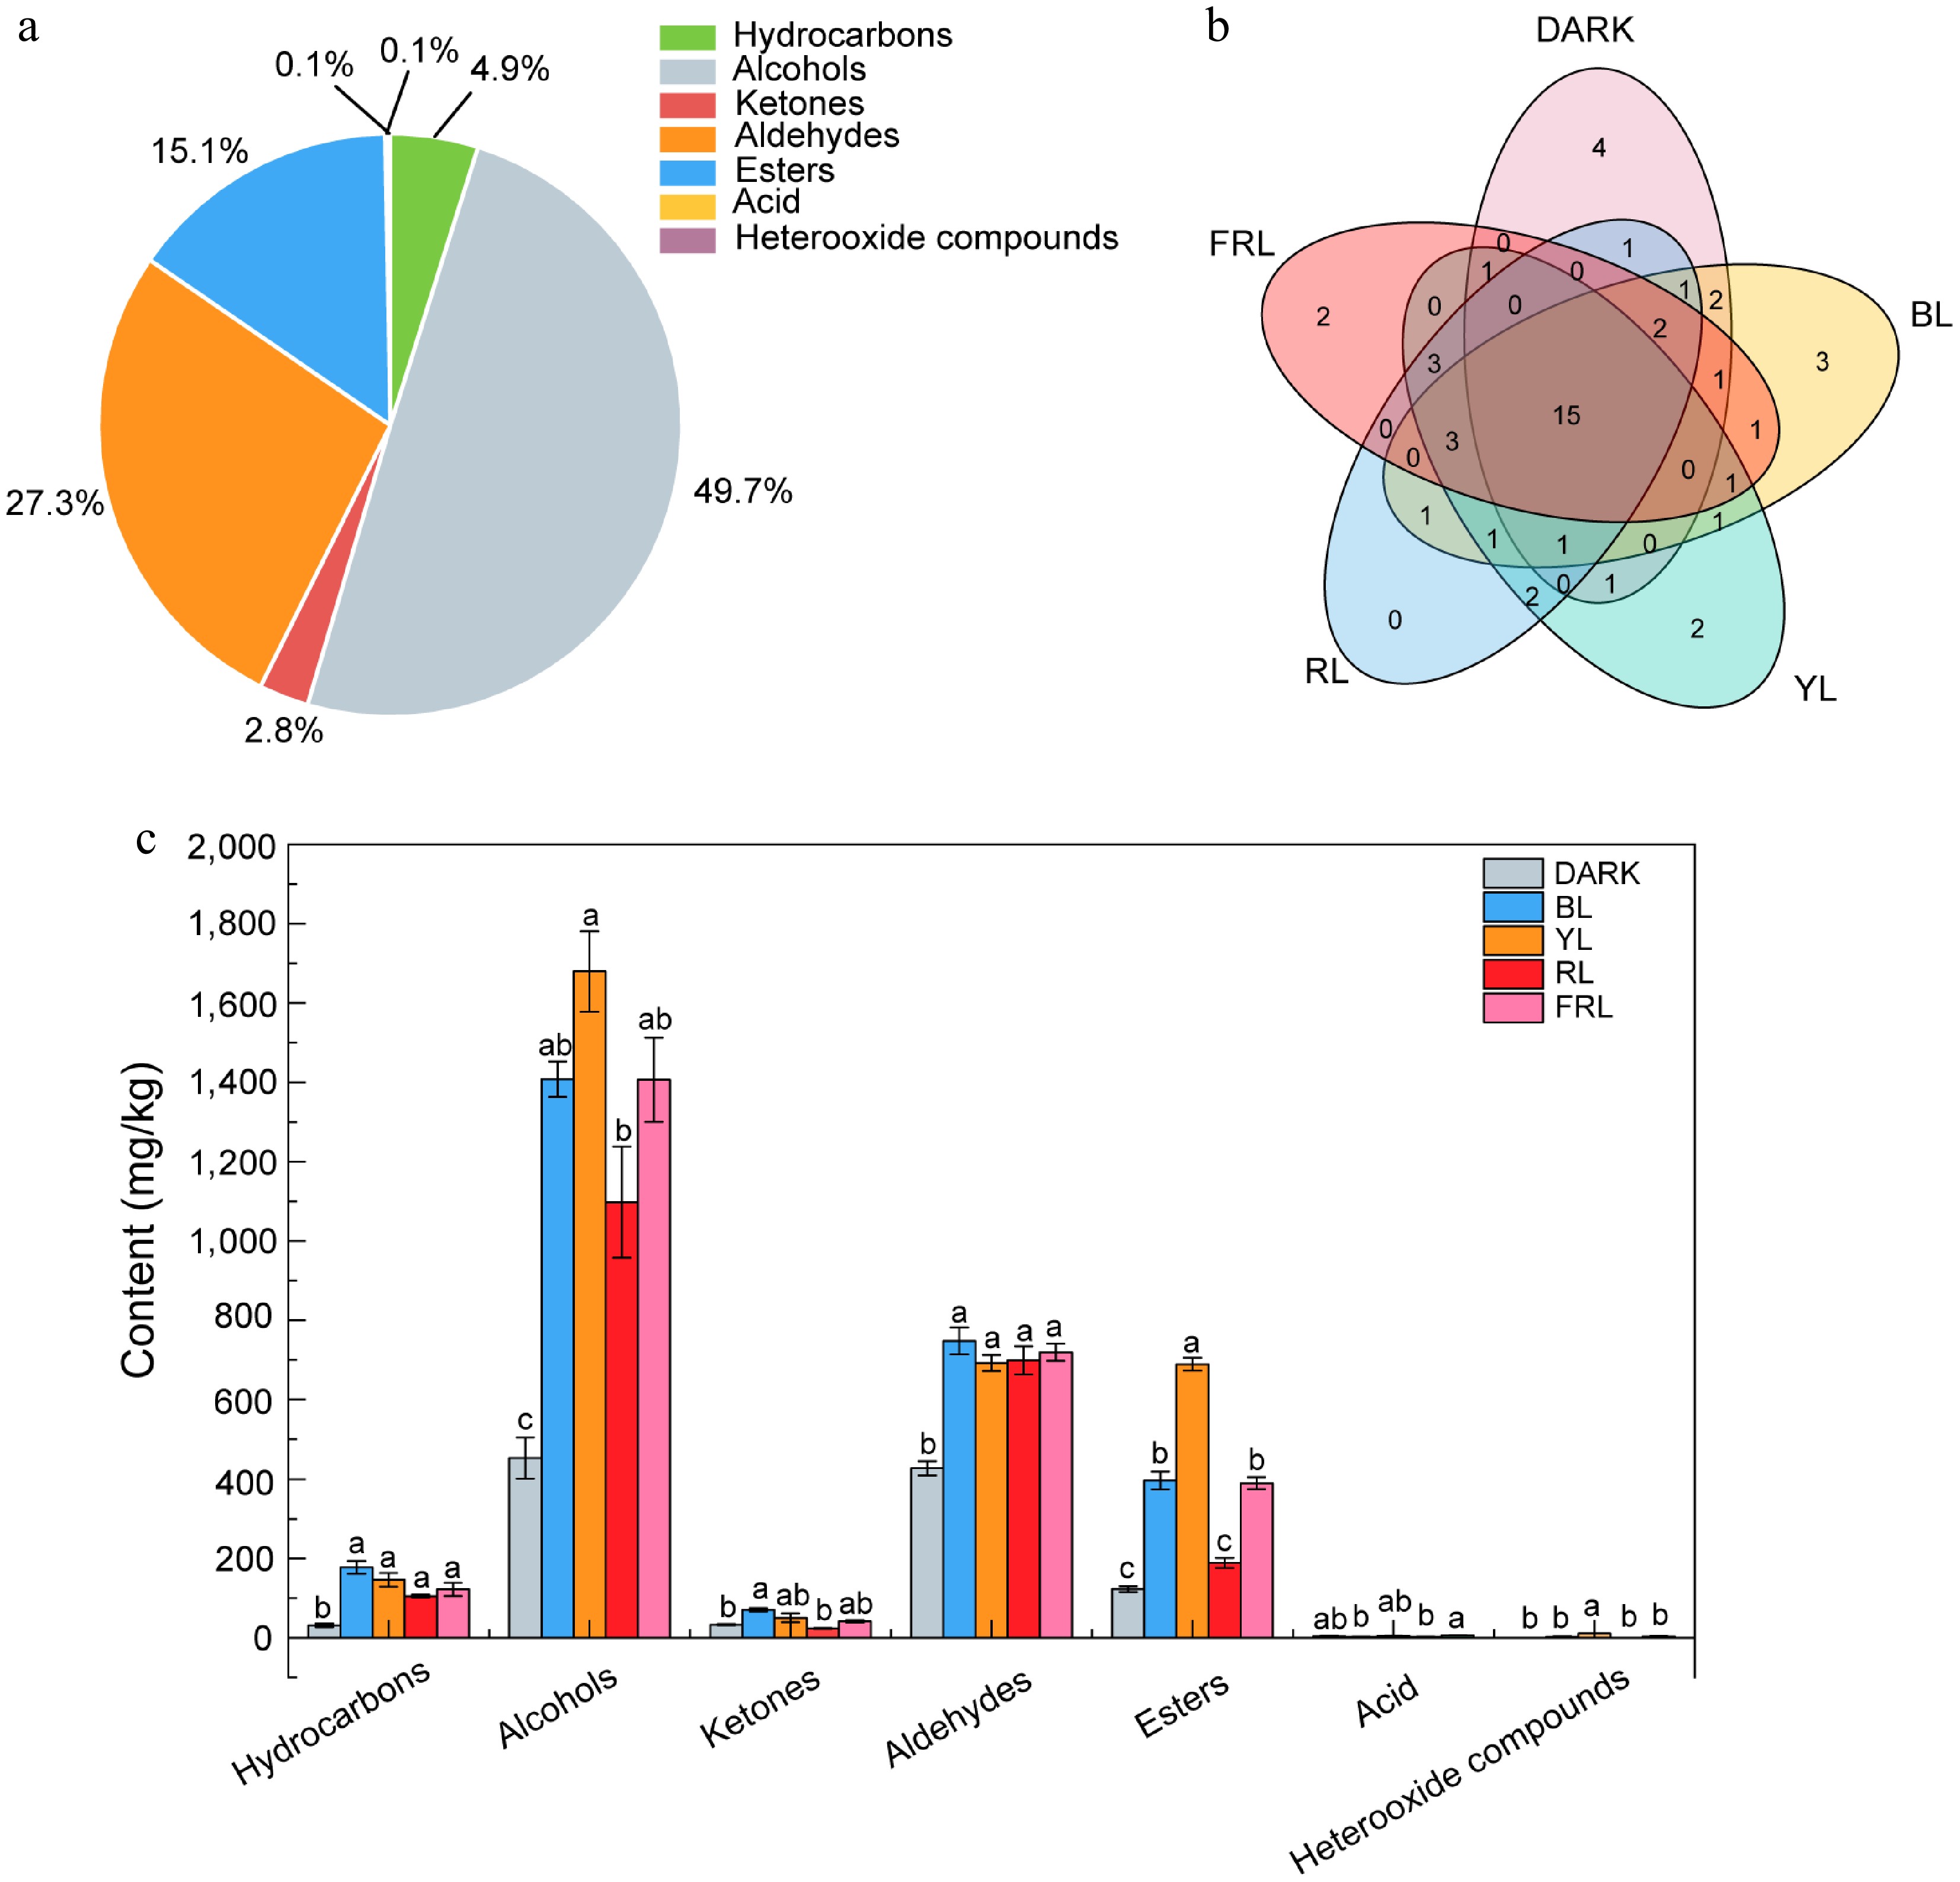
Figure 4.
Variation trend of aroma compounds. (a) The proportion of various volatile compounds in SWT. (b) Venn diagram different aroma compounds. (c) The contents of aroma compounds in SWT spread under different light conditions. Data were from three independent experiments (n = 3), and are expressed as means ± SD. All data were subjected to analysis of variance (ANOVA), and different lowercase letters (a, b, c) indicate significant differences at the p < 0.05 level.
-
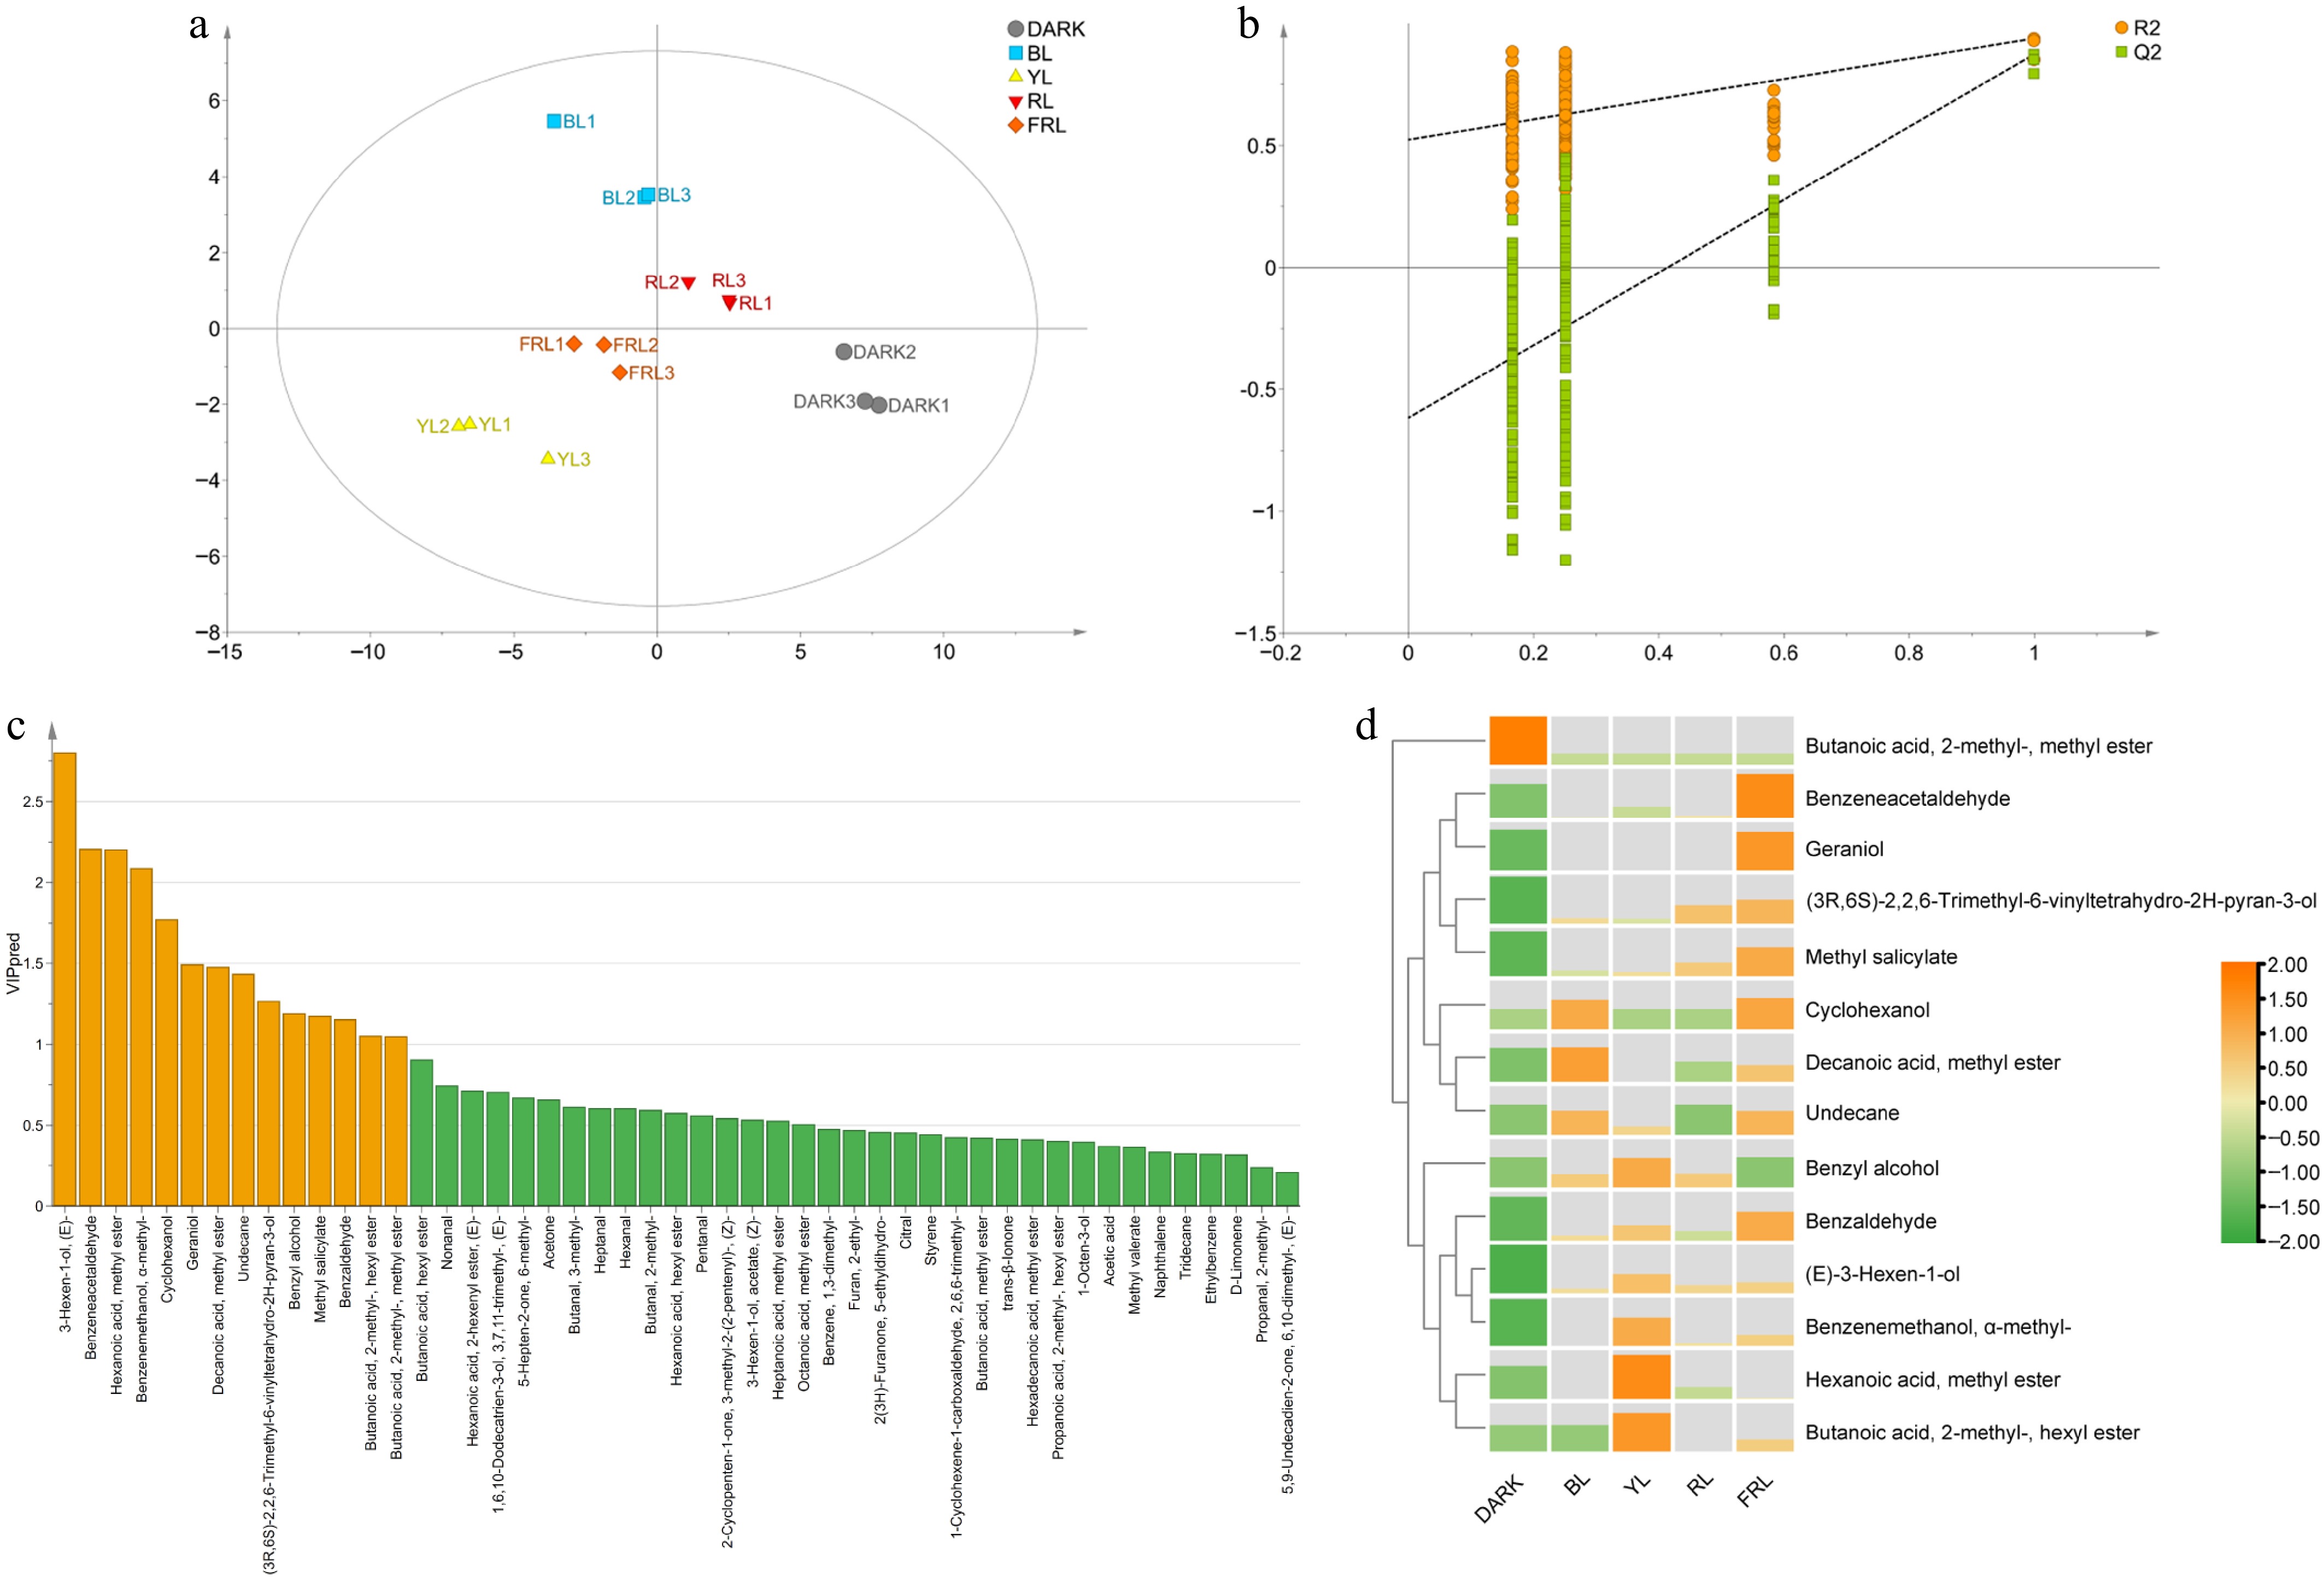
Figure 5.
Comparative analysis of differences in aroma quality of SWT under different light quality withering treatments. (a) OPLS-DA analysis of volatile components. (b) Cross-validation of the OPLS-DA model for volatile components. (c) VIP prediction (VIP pred) of volatile components. (d) Heatmap analysis of key aroma compounds with VIP >1. Data were from three independent experiments (n = 3), and are expressed as means ± SD.
-
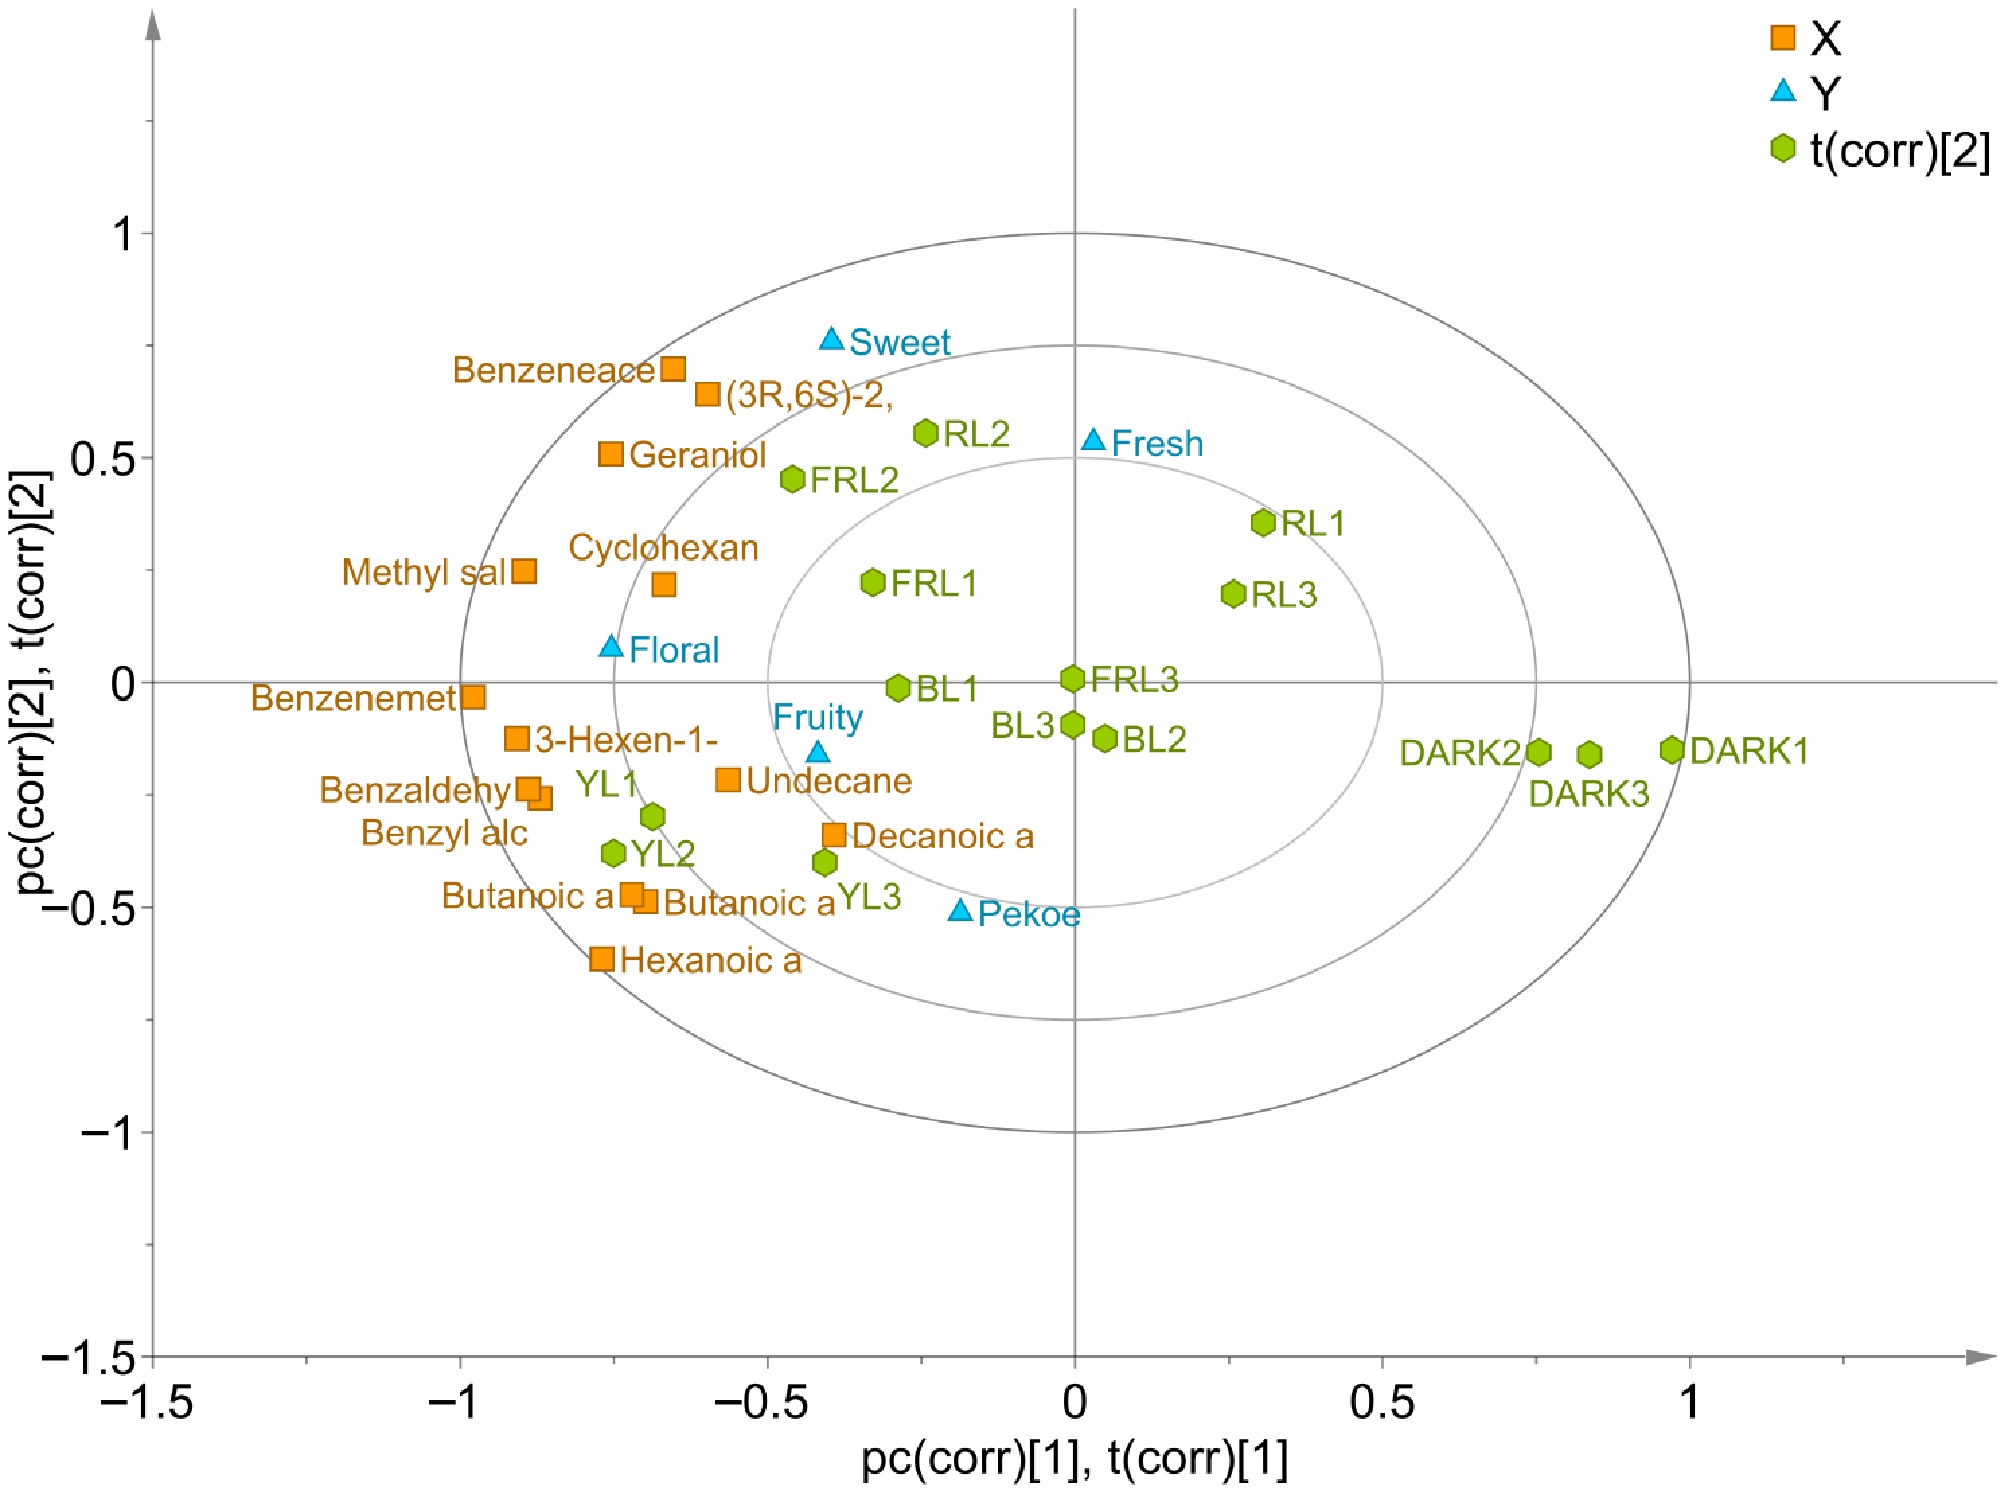
Figure 6.
PLS plots for SWT, the sensory attributes and key volatile compounds. Data were from three independent experiments (n = 3), and are expressed as means ± SD.
Figures
(6)
Tables
(0)