-
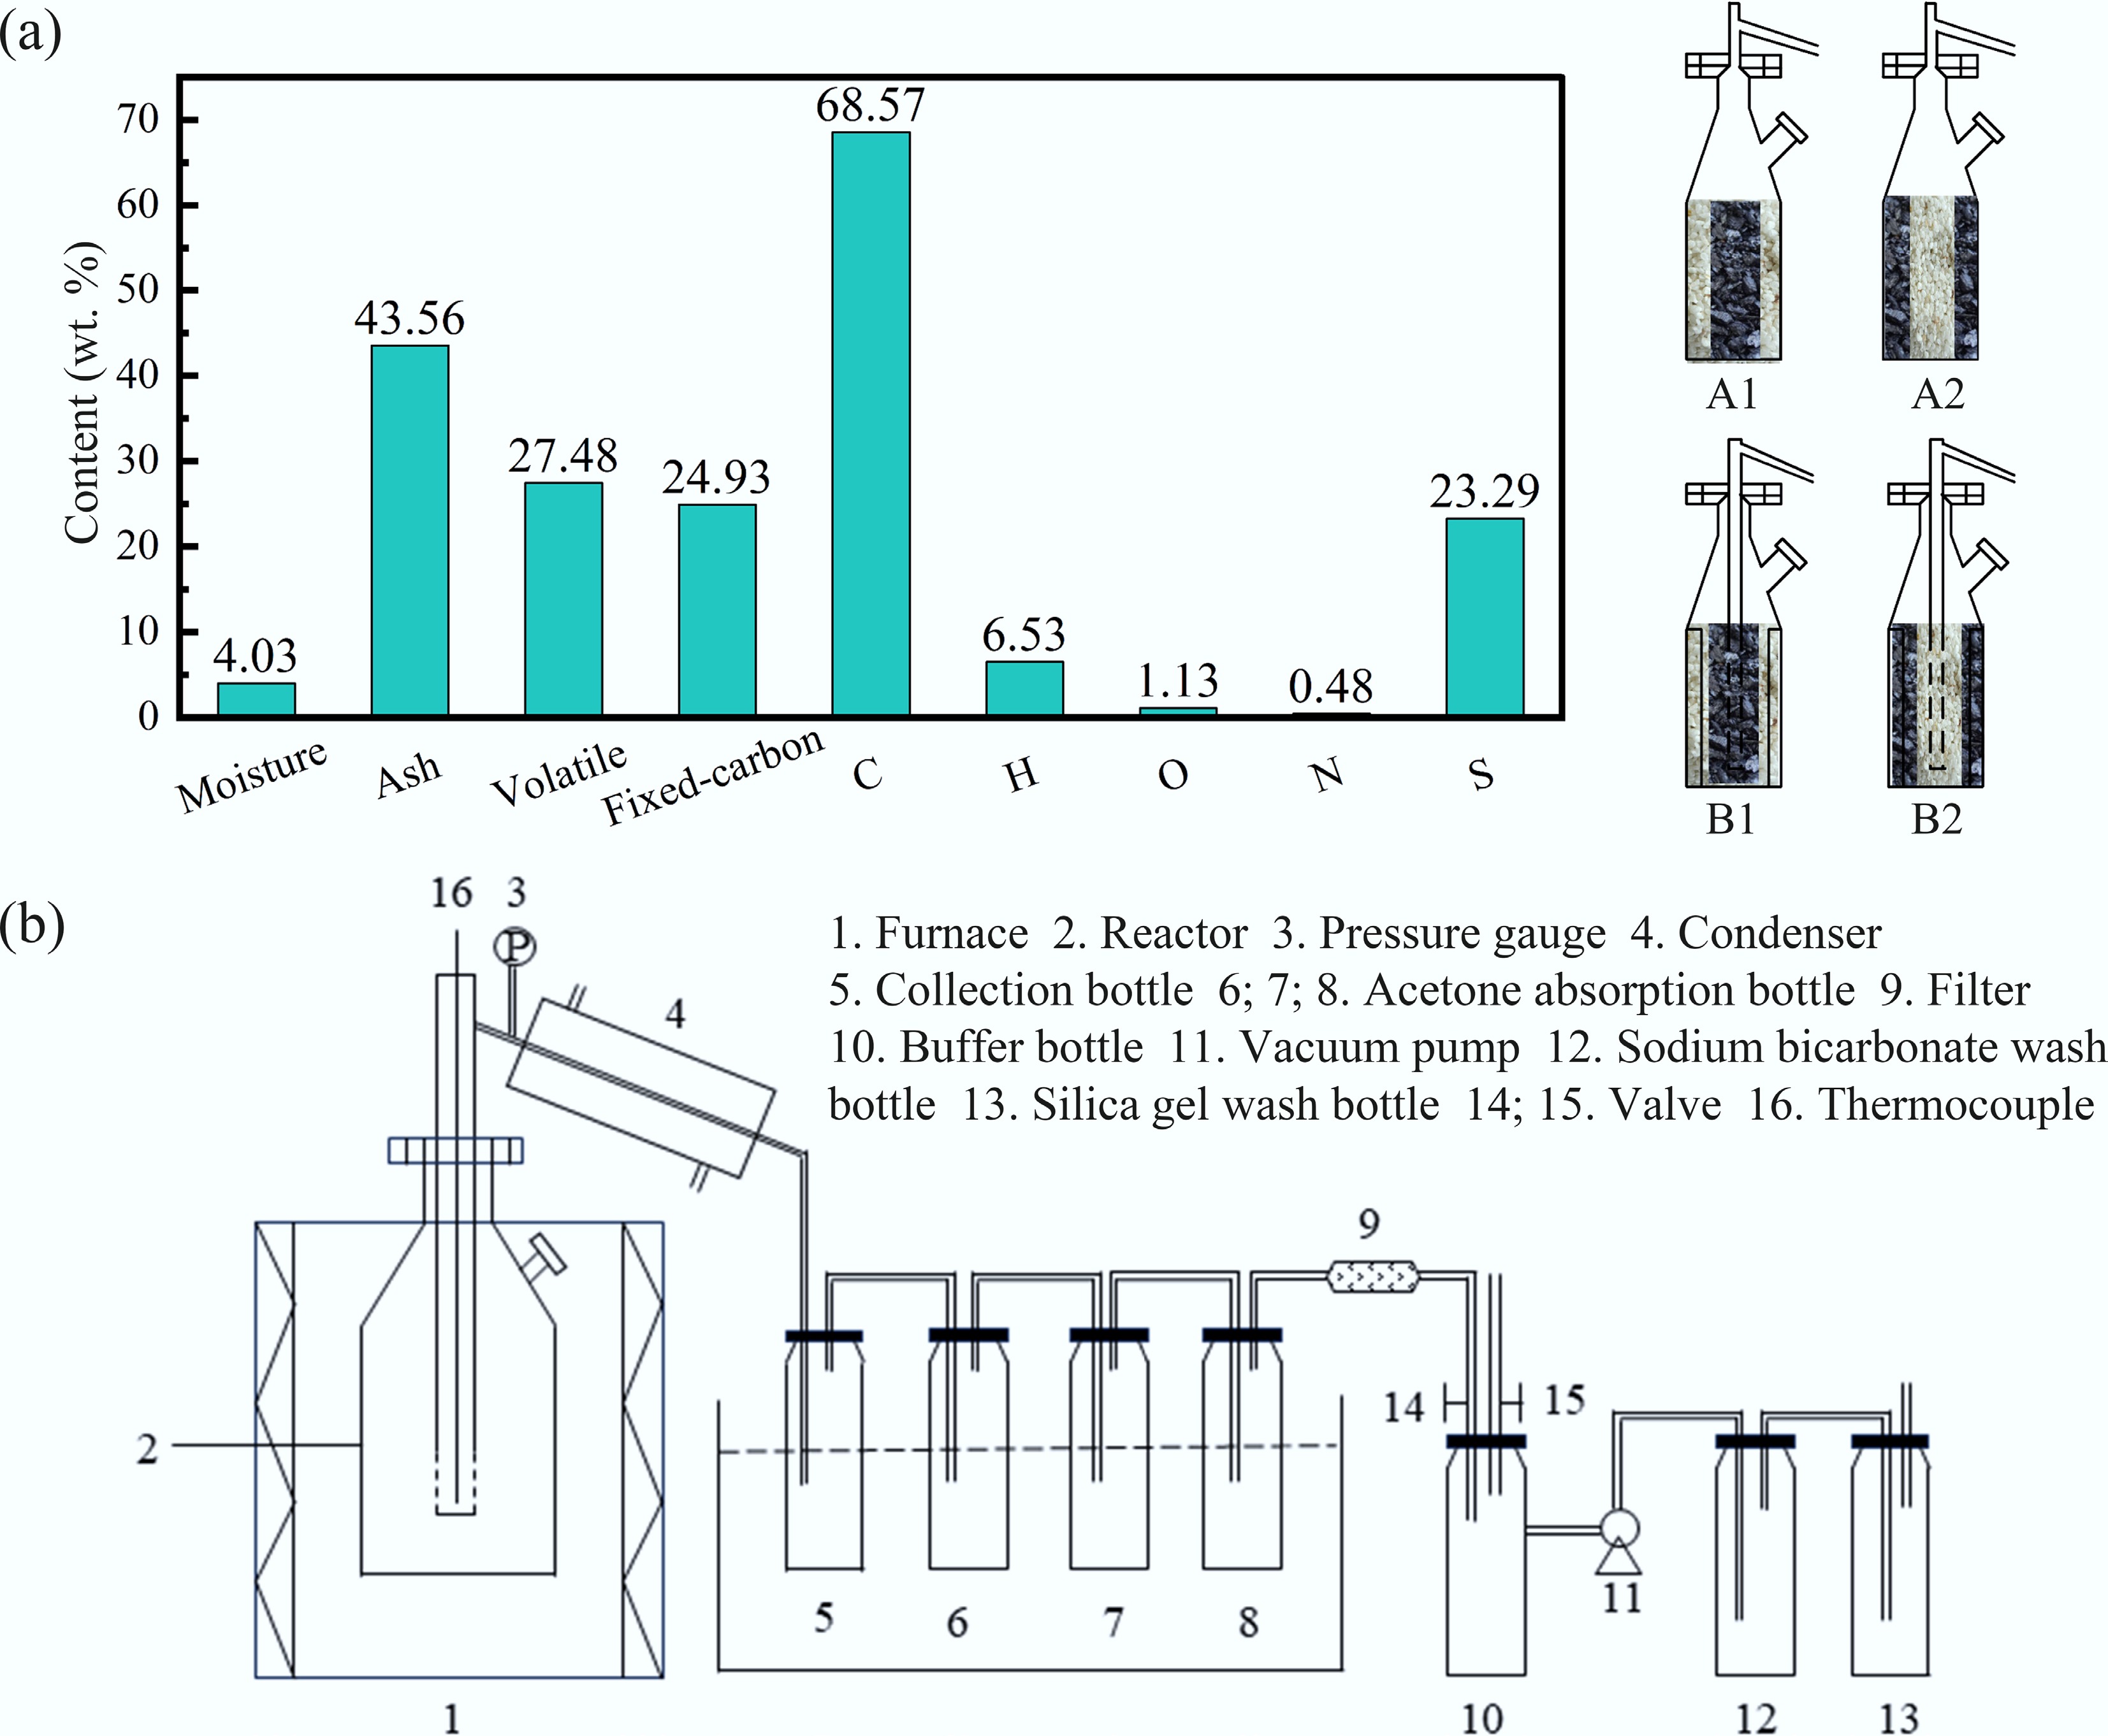
Figure 1.
(a) Proximate and ultimate analyses of coal sample; (b) feeding modes of coal and quartz and schematic diagram of the pyrolysis apparatus.
-
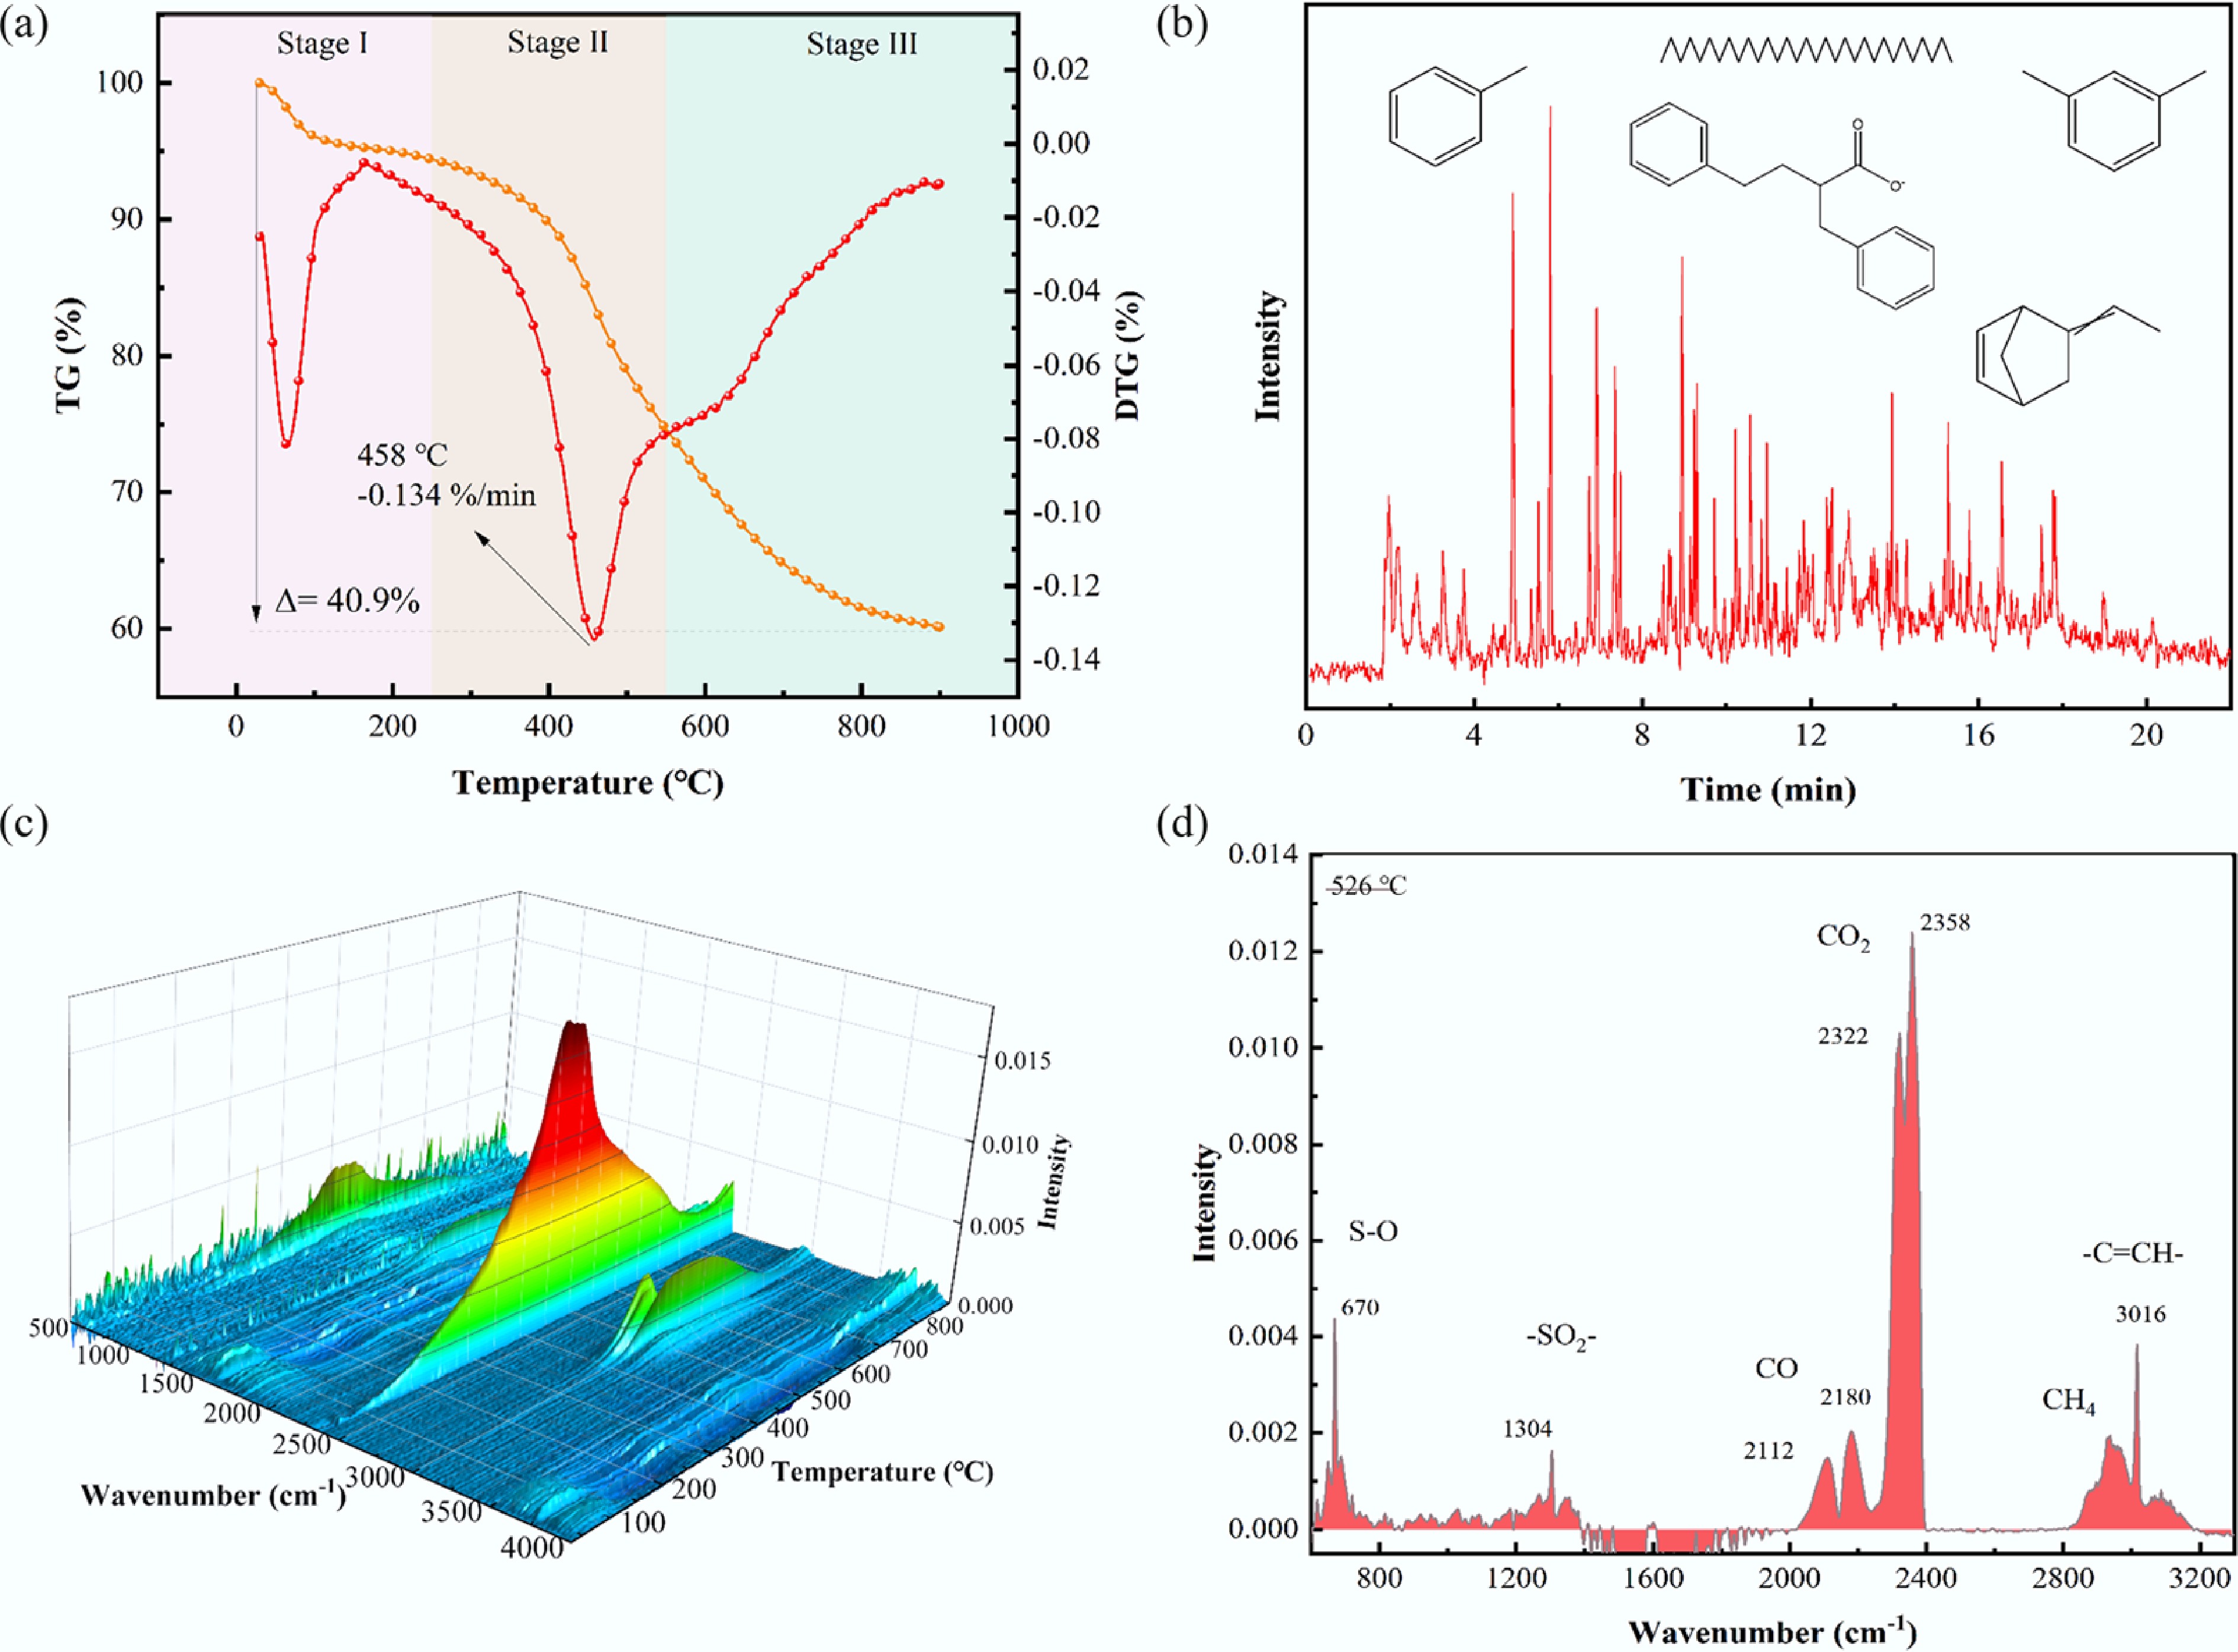
Figure 2.
The TG curves of (a) coal at 20 °C/min, (b) GC-MS of volatiles at DTG peak, (c) 3D FTIR spectrum of volatiles with temperature, (d) FTIR spectrum of volatiles at 526 °C.
-
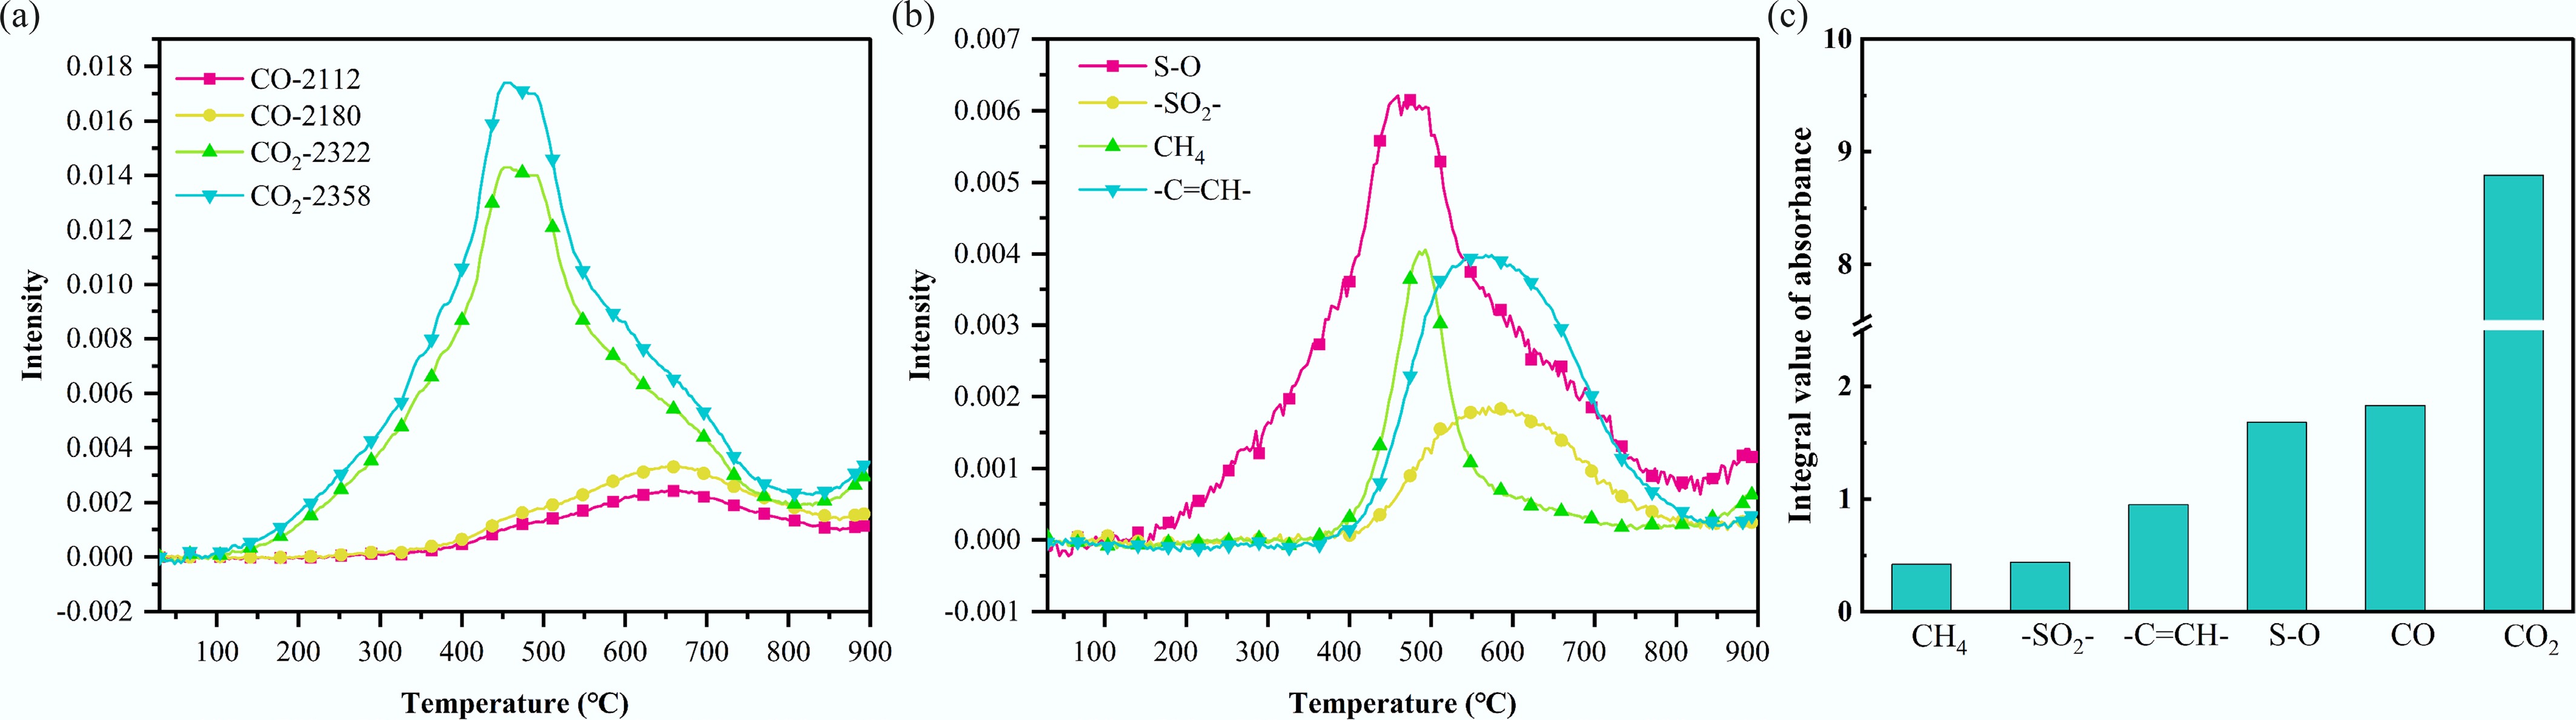
Figure 3.
The evolution of functional groups with (a), (b) temperature, and (c) the integral value of absorbance.
-
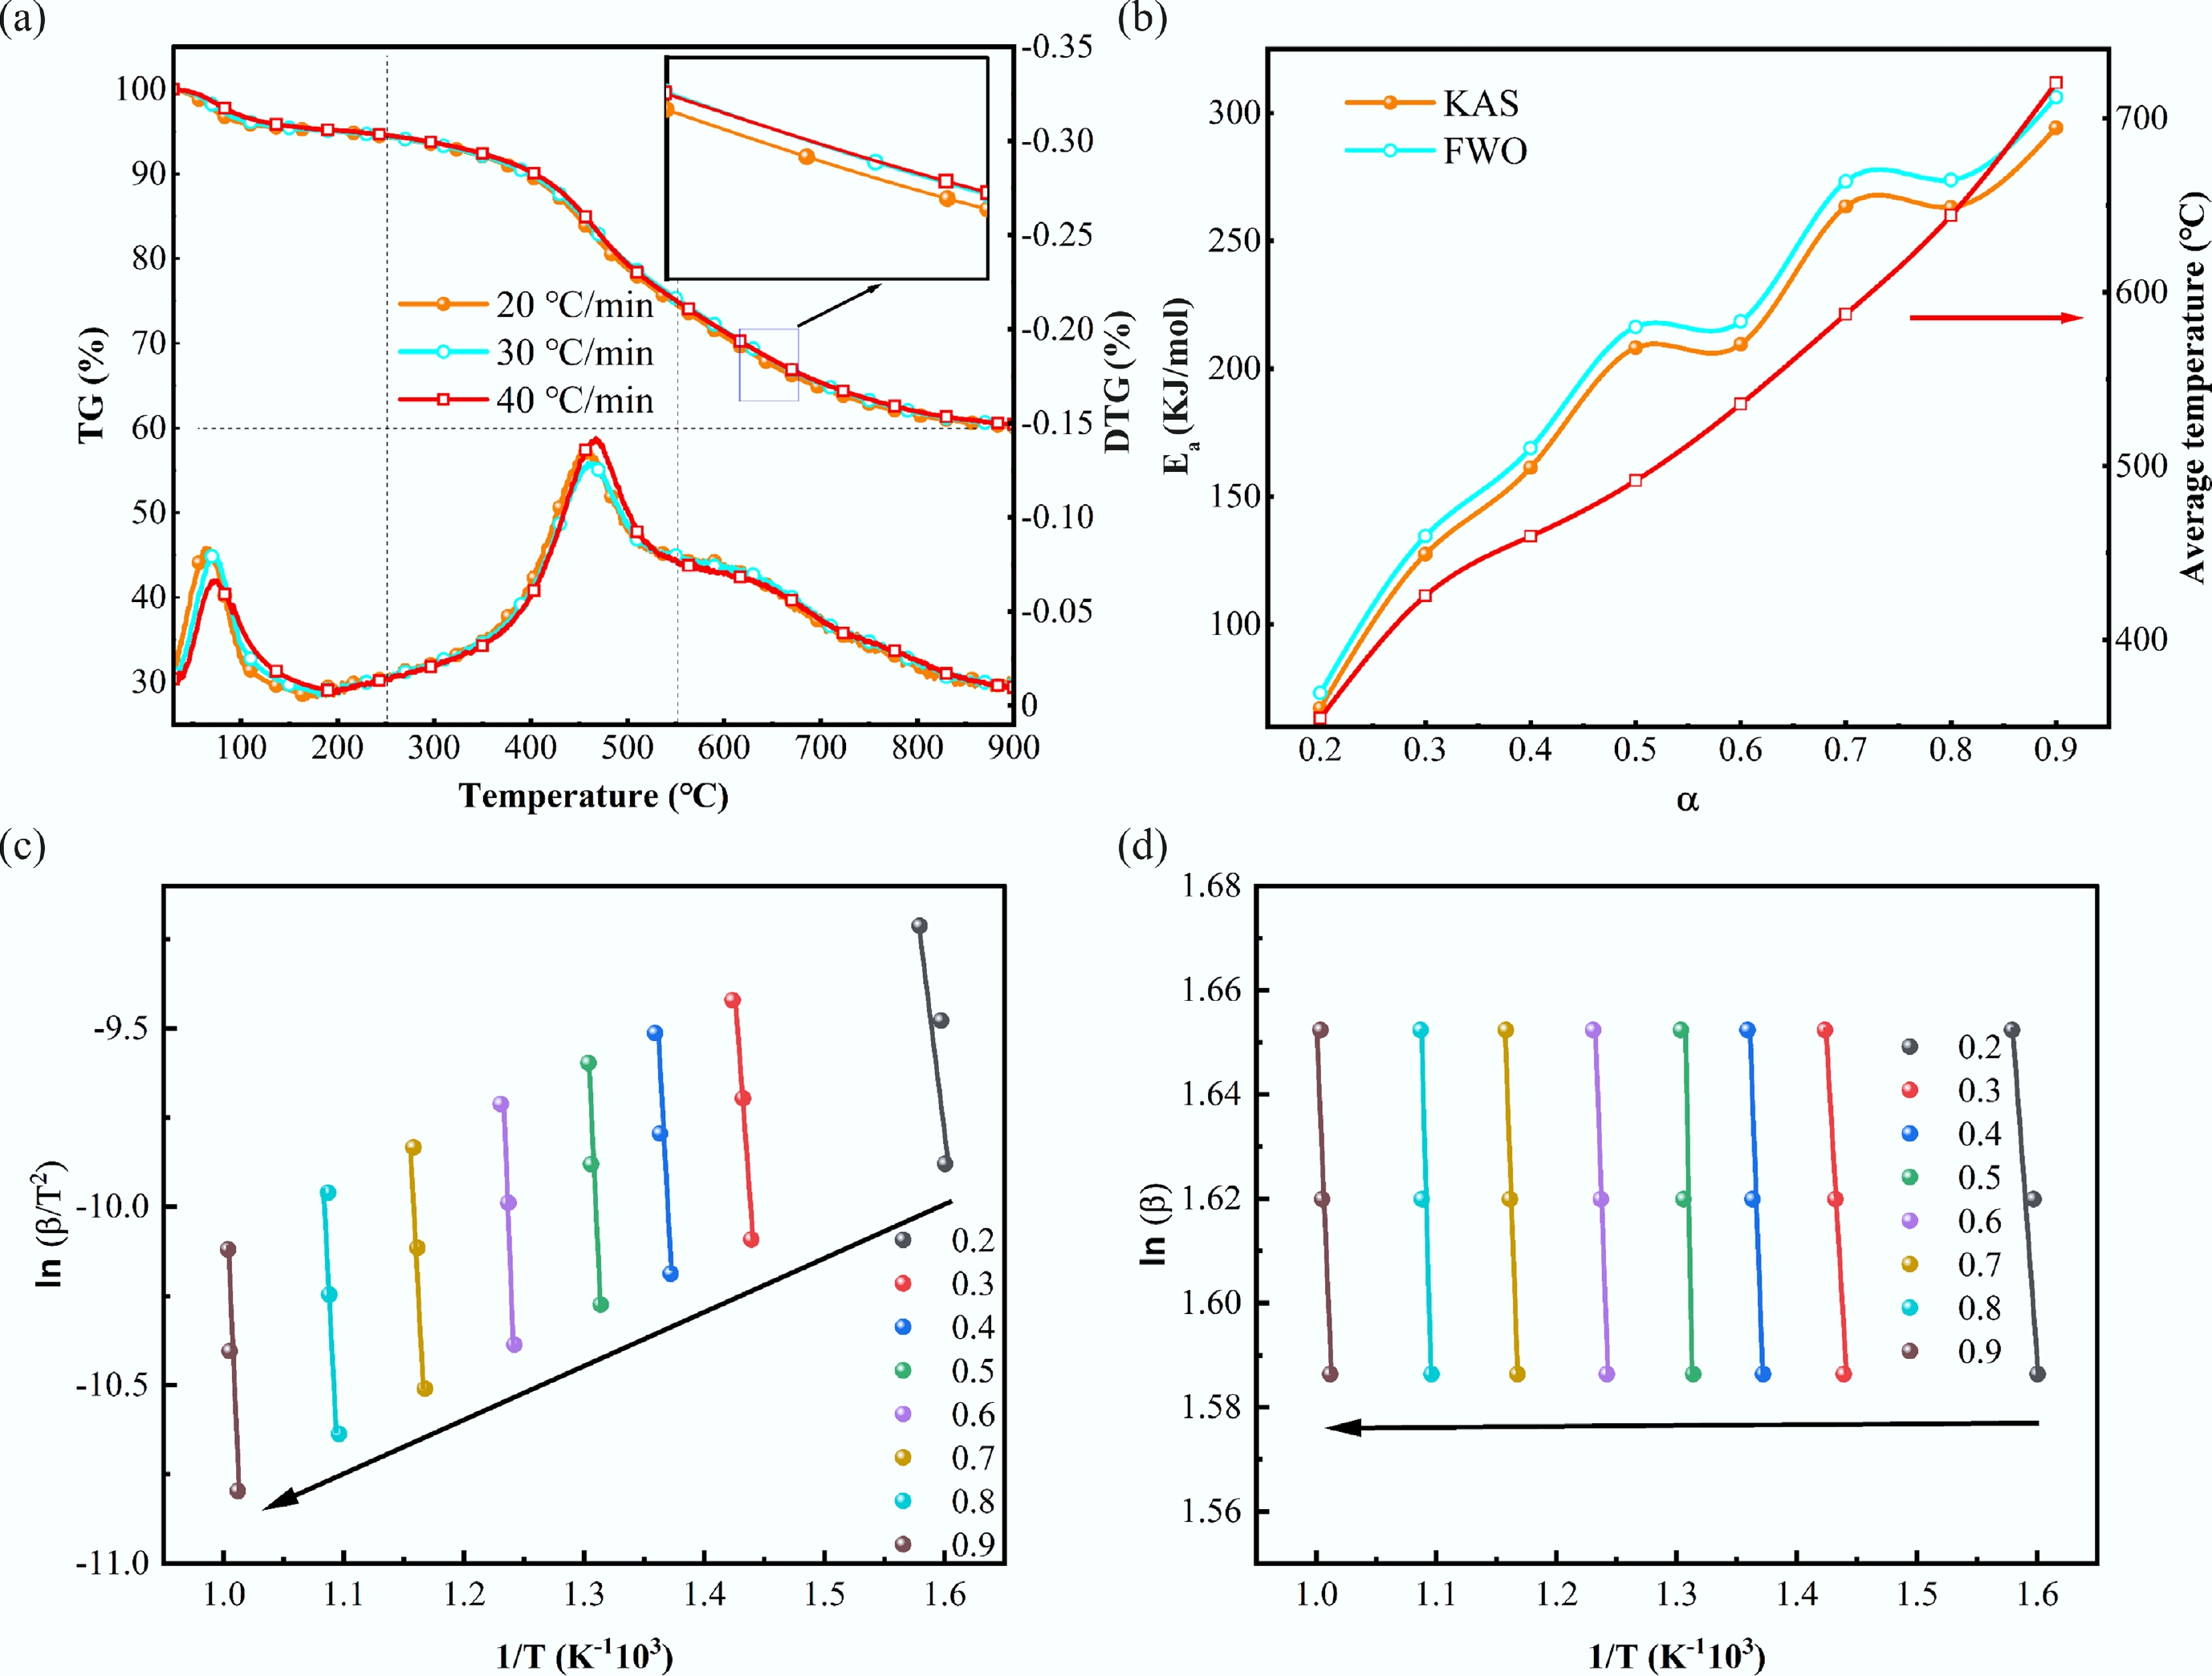
Figure 4.
TG and DTG curves of (a) long flame coal at various temperatures and (b) the active energies from KAS and FWO models; (c) KAS and (d) FWO fitting curves from the decomposition of long flame coal at different conversions.
-
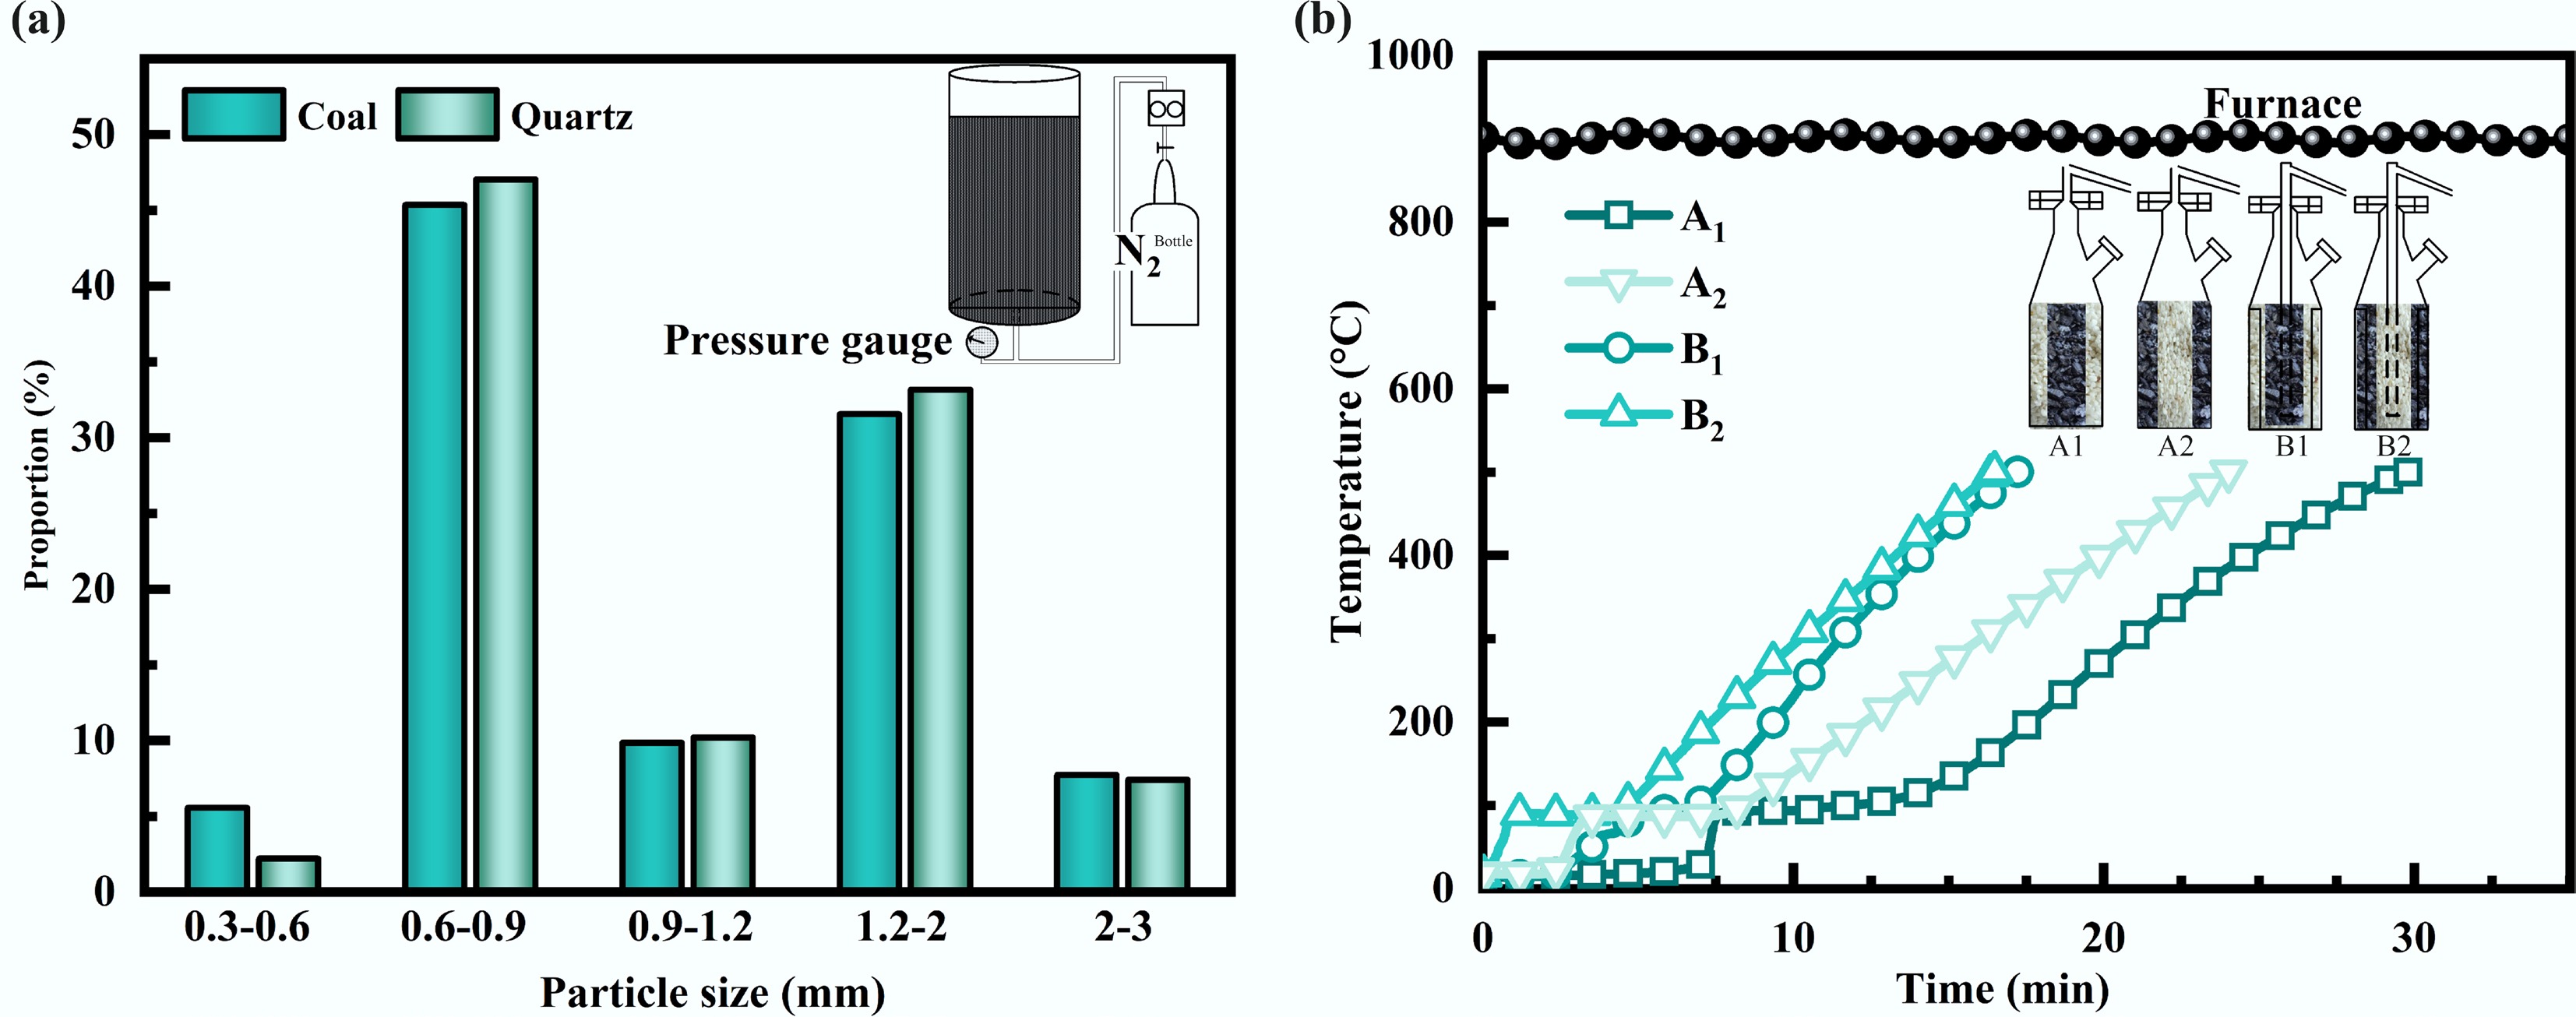
Figure 5.
Particle size distributions of (a) coal and quartz, and (b) heating curves in center bed of reactors.
-
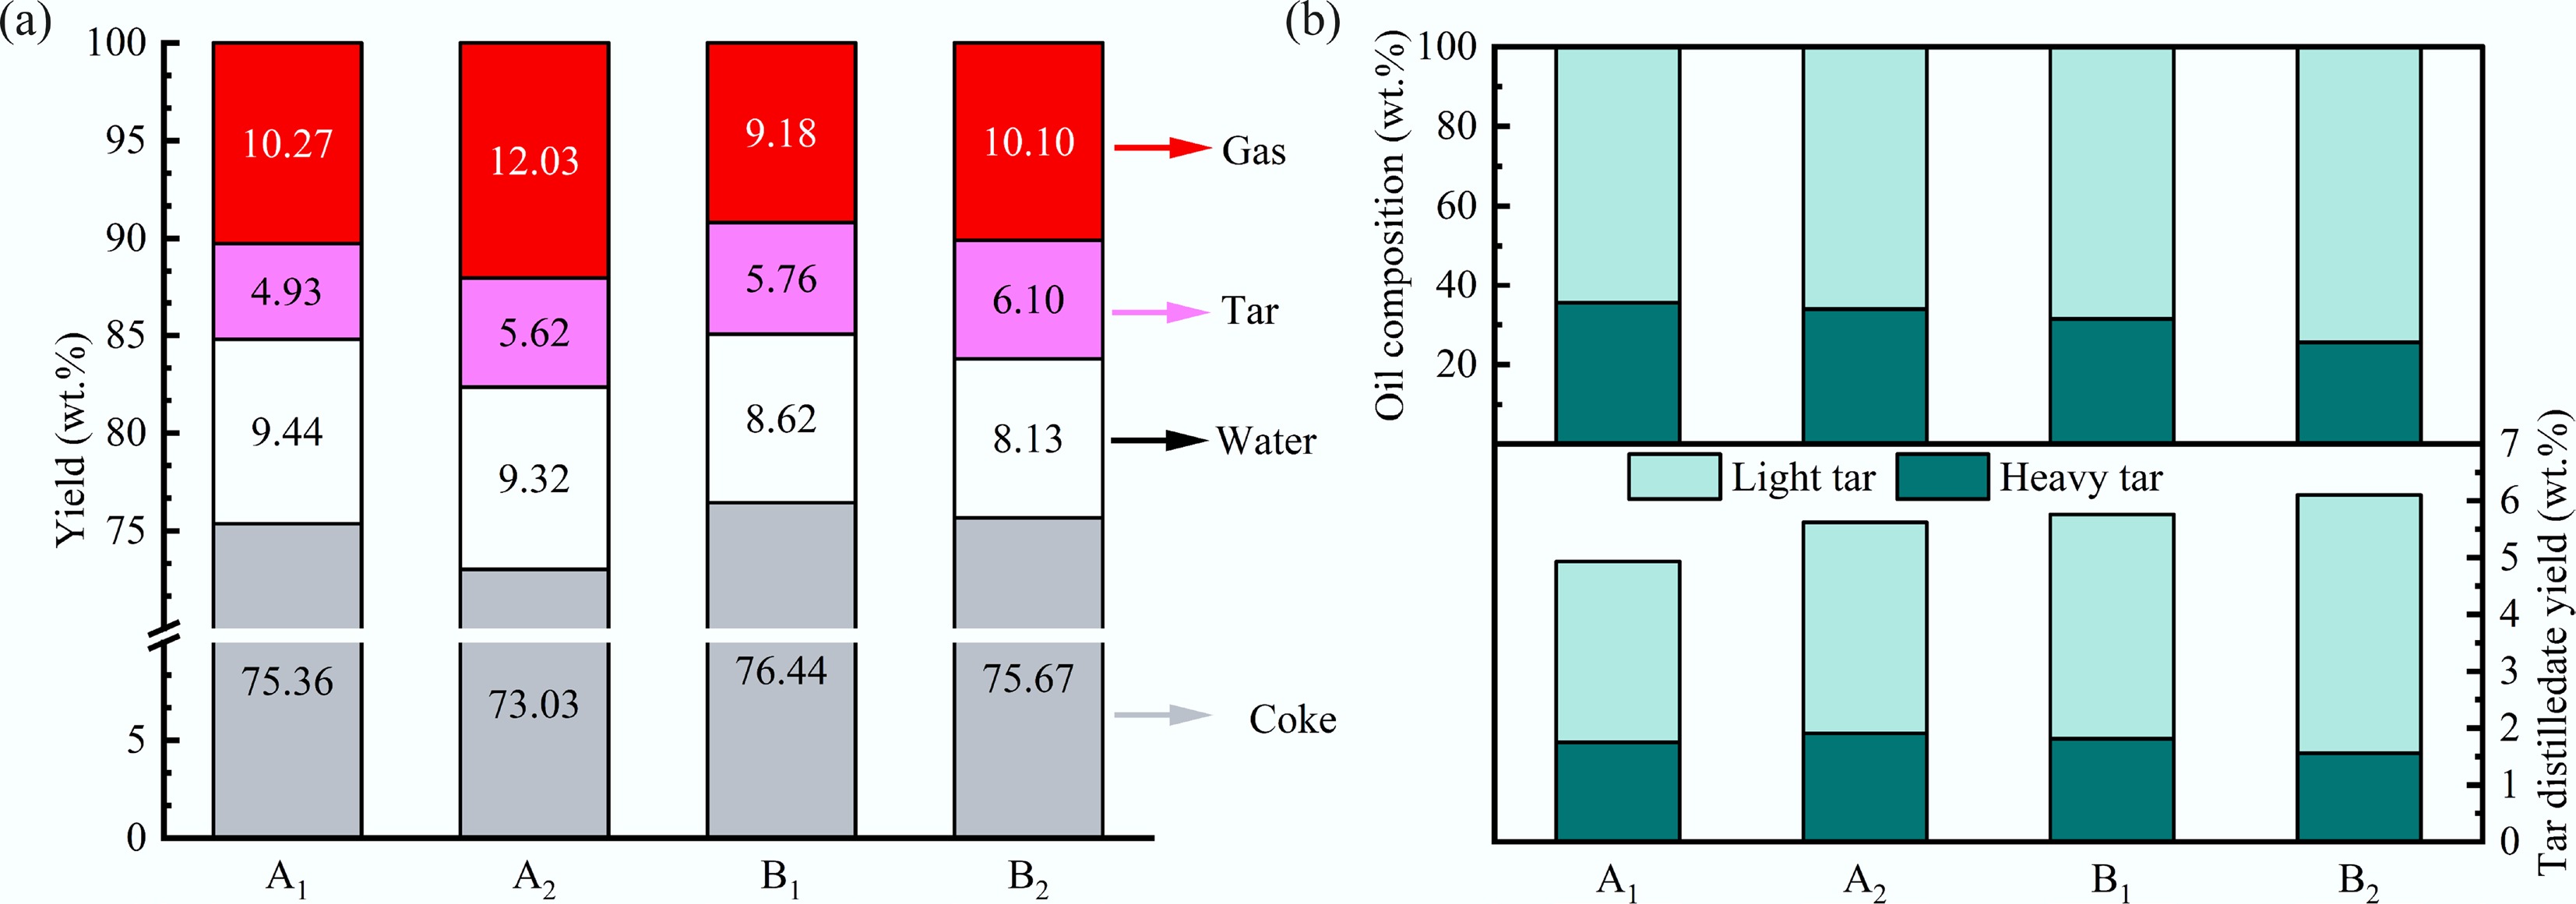
Figure 6.
(a) Pyrolysis product distribution in reactors with and without internals, and (b) variation of yield of light tar.
-
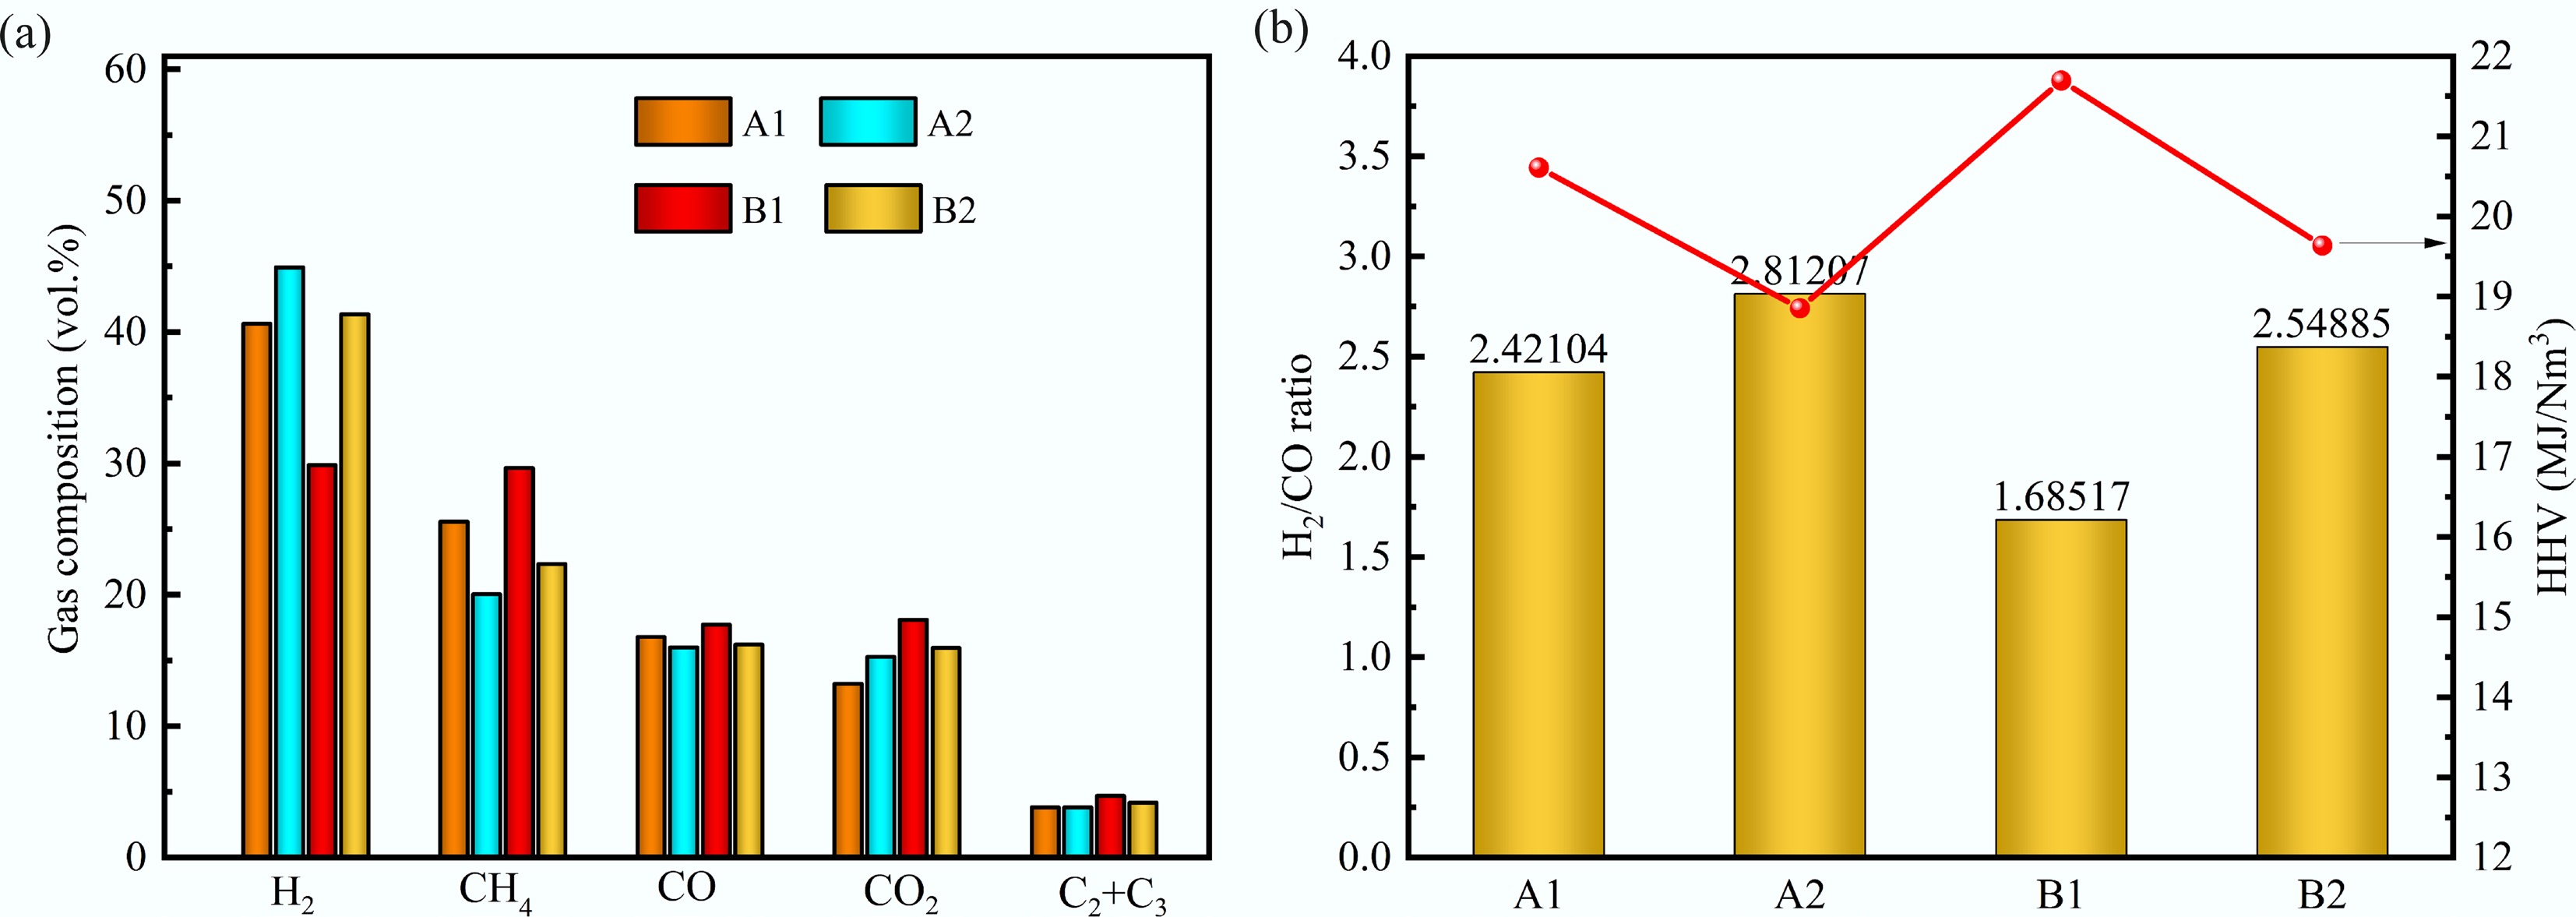
Figure 7.
(a) Effects of feeding modes on the average gas composition in reactor with and without internals; (b) the higher heating value (HHV) of mixed gas and H2/CO ratio.
-
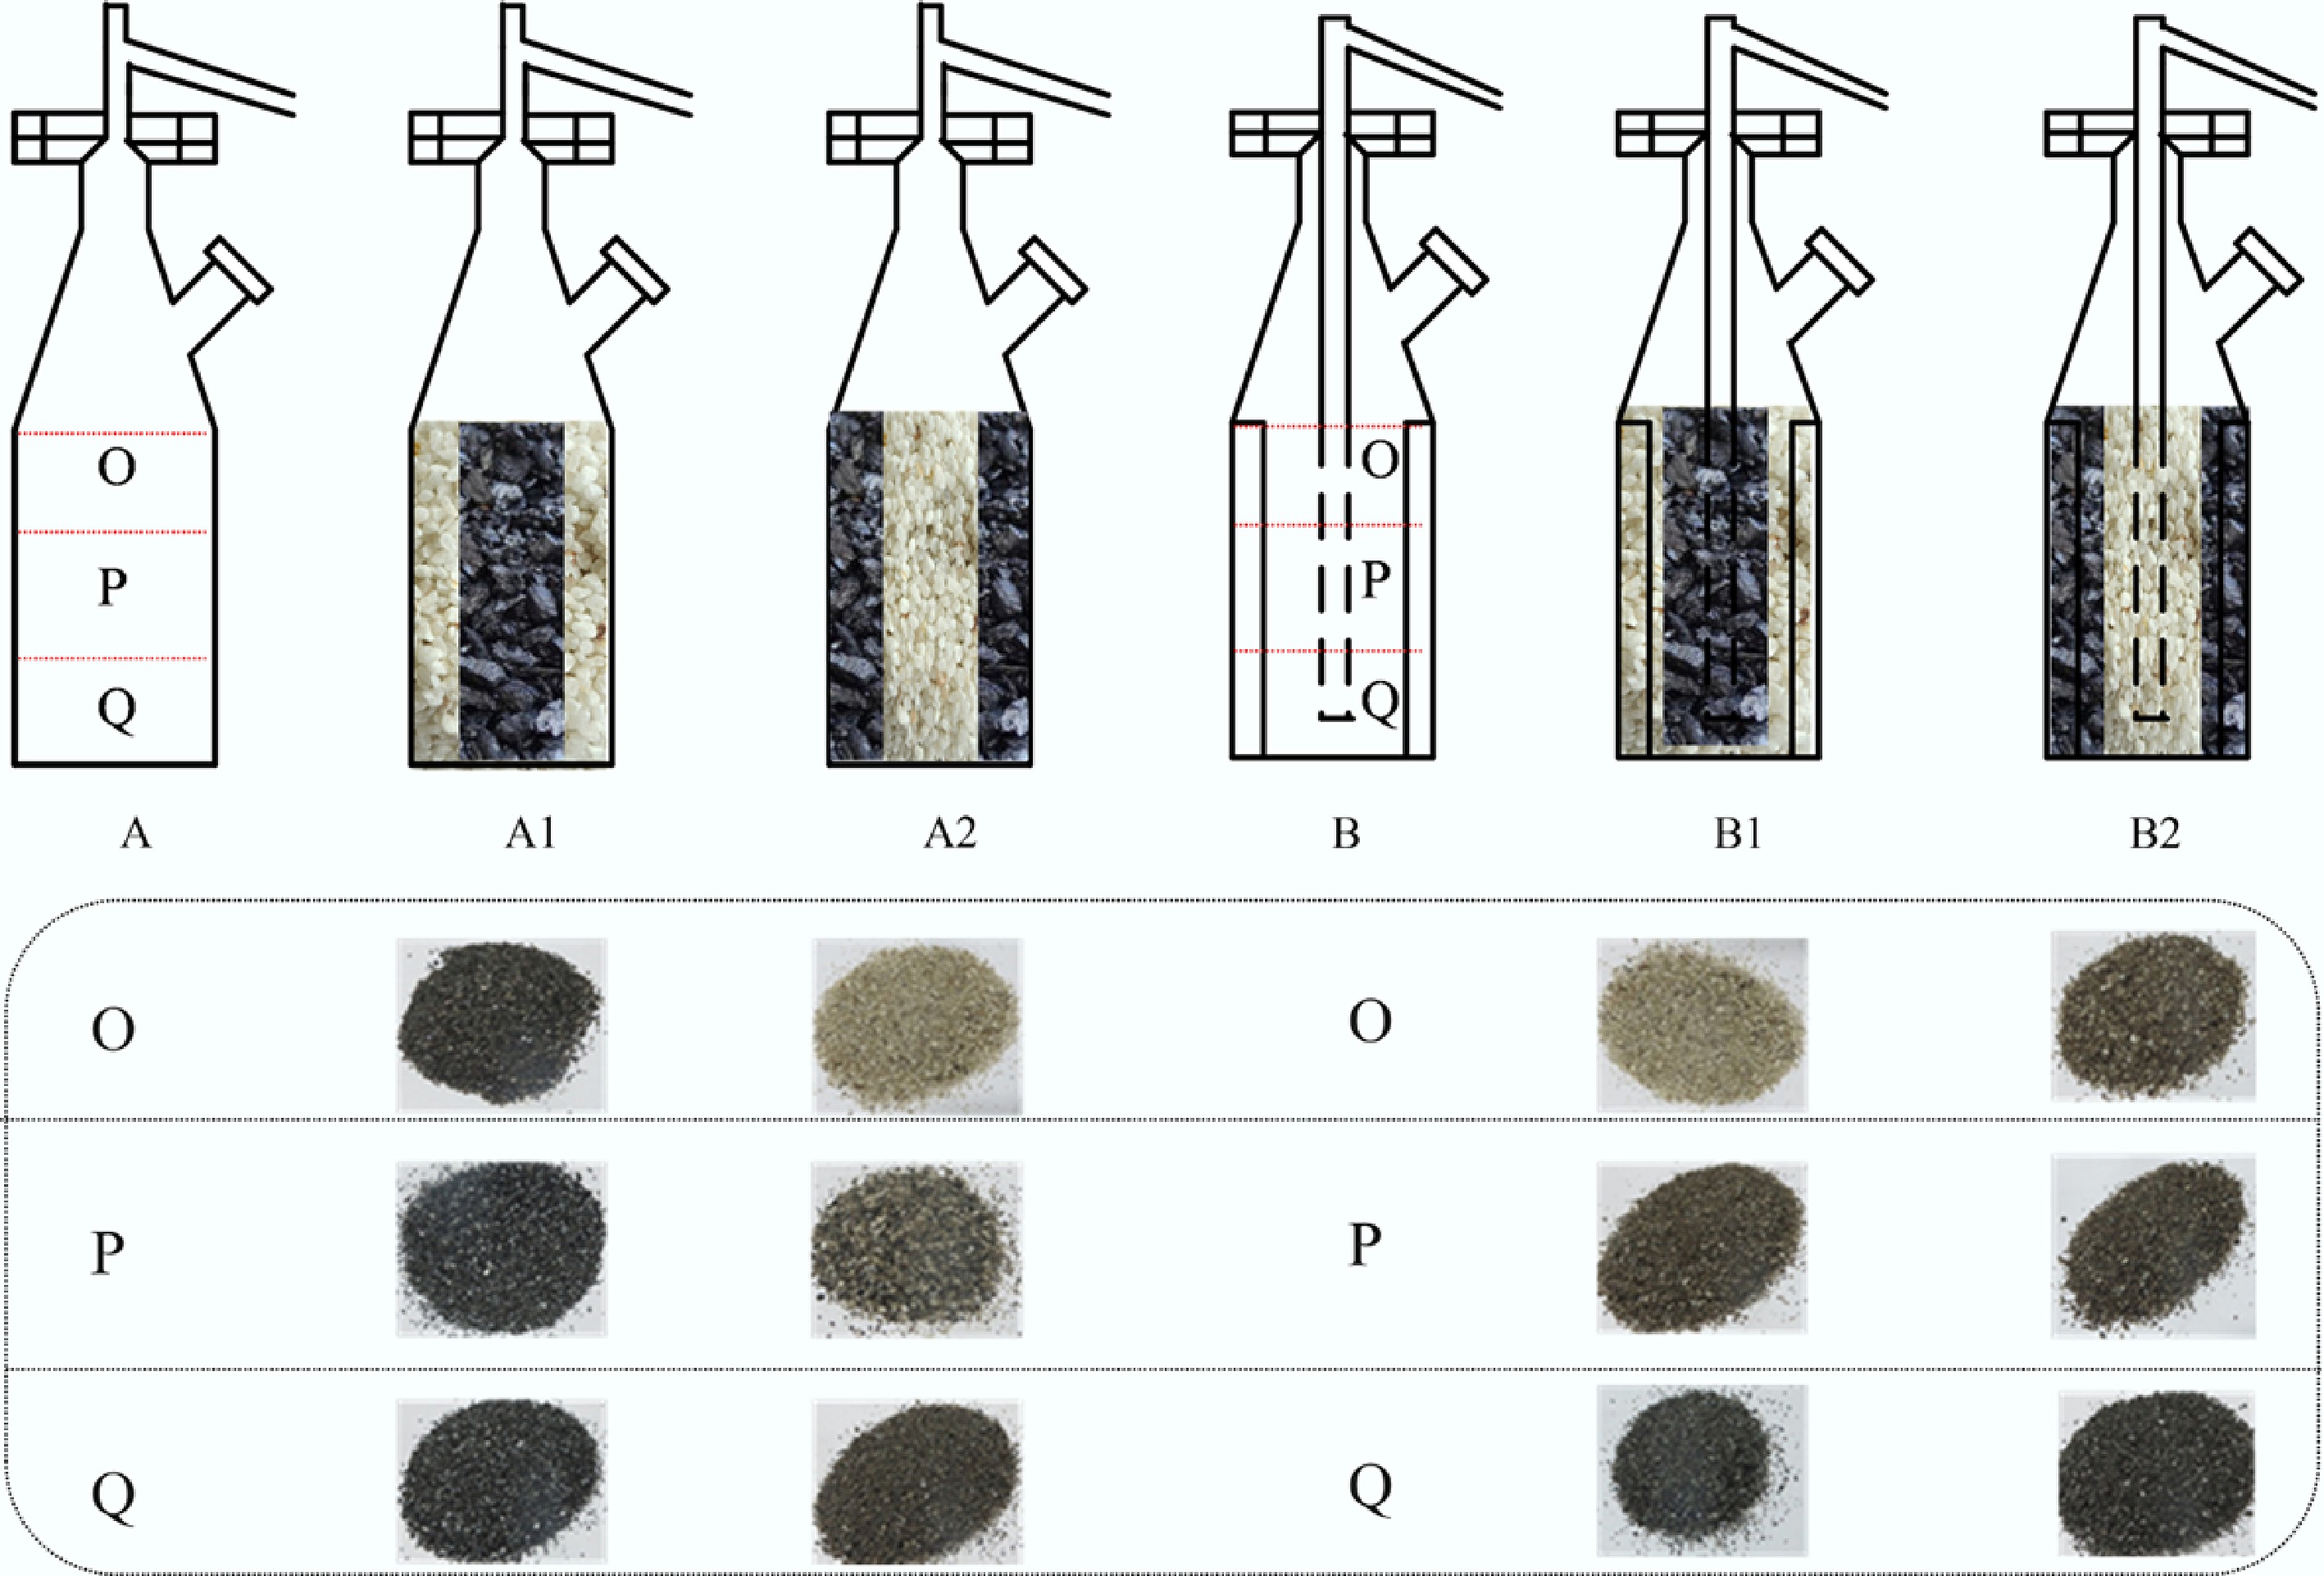
Figure 8.
Effects of tar vapor on quartz color at different axial positions.
-
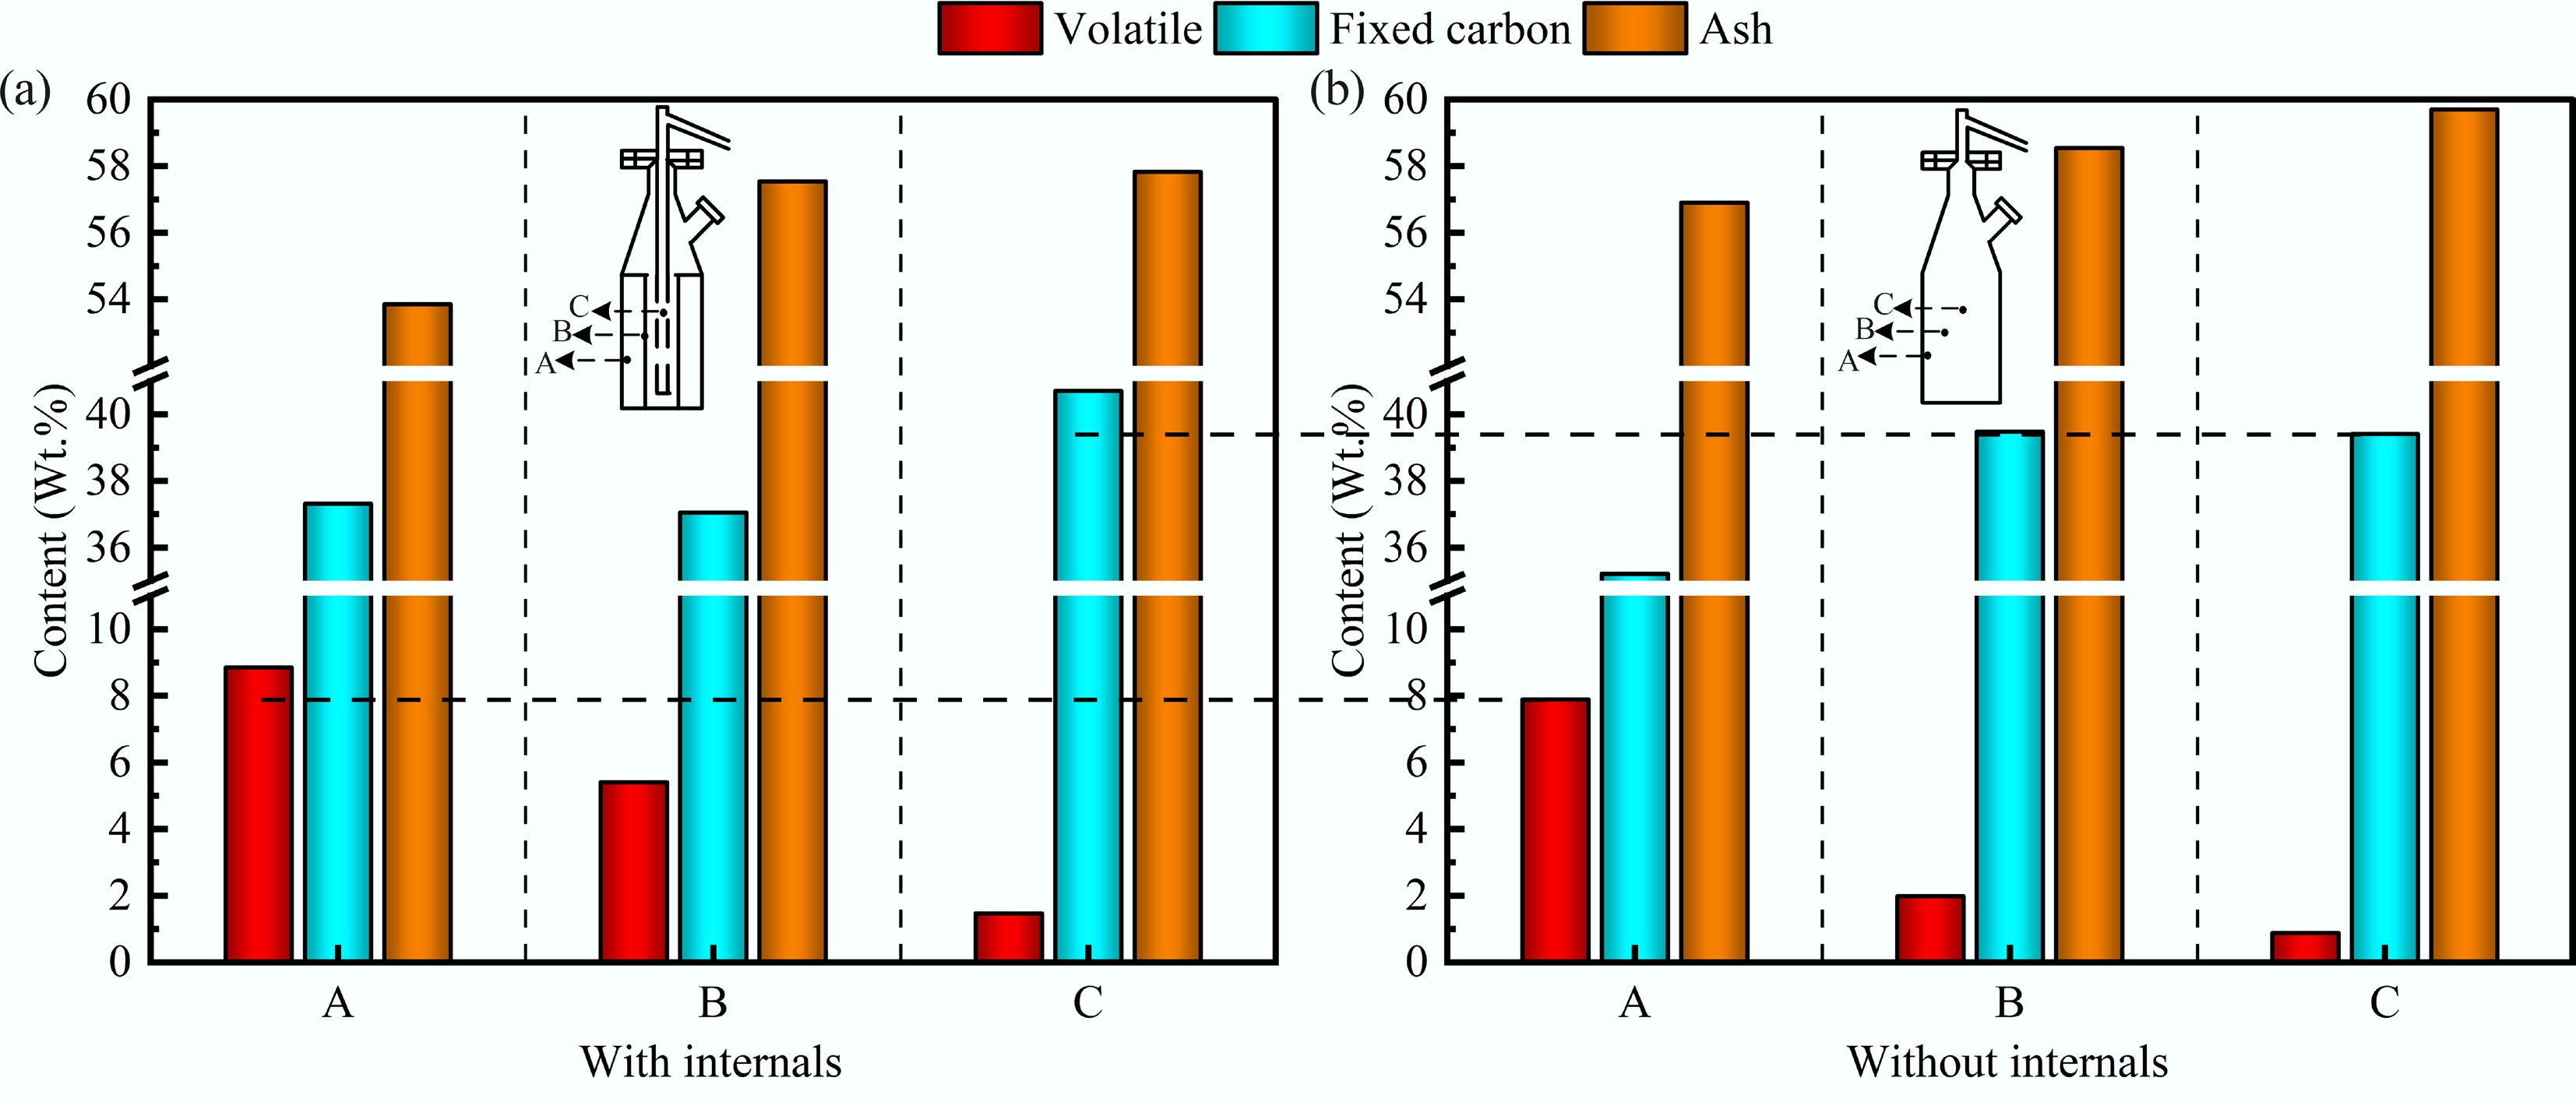
Figure 9.
Ultimate analysis of char in both reactors.
-
Heating rate (°C/min) Stage Ts
(°C)Te
(°C)Tm
(°C)DTGm (wt.%/min) Mass change rate (wt.%) 20 I 30.3 198 64 −1.68 4.96 II 281.3 807.3 458 −2.73 32.5 30 I 30.5 157 72.5 −2.39 4.63 II 279 815.5 459 −3.87 32.46 40 I 30.7 174.7 75.3 −2.66 4.64 II 292 817.3 467.3 −5.69 32.32 Ts, Te, Tm, and DTGm refer to the initial pyrolysis temperature (°C), the termination pyrolysis temperature (°C), the maximum weight-loss temperature (°C), and the maximum weight-loss rate (wt.%/min), respectively. I and II refer to the first and the second weight-loss stage, respectively. Table 1.
Pyrolysis characteristic parameters
-
α KAS FWO Temperature
(°C)Eα R2 Eα R2 0.2 67.22 0.995 73.14 0.994 354.88 0.3 127.42 0.997 134.49 0.996 425.33 0.4 161.29 0.998 168.92 0.998 459.61 0.5 208.13 0.998 216.29 0.997 491.55 0.6 209.53 0.997 218.44 0.996 535.61 0.7 263.42 0.995 273.17 0.994 587.27 0.8 263.07 0.992 273.77 0.991 644.11 0.9 294.21 0.988 306.17 0.986 720.55 Table 2.
Pyrolysis kinetic parameters
Figures
(9)
Tables
(2)