


-
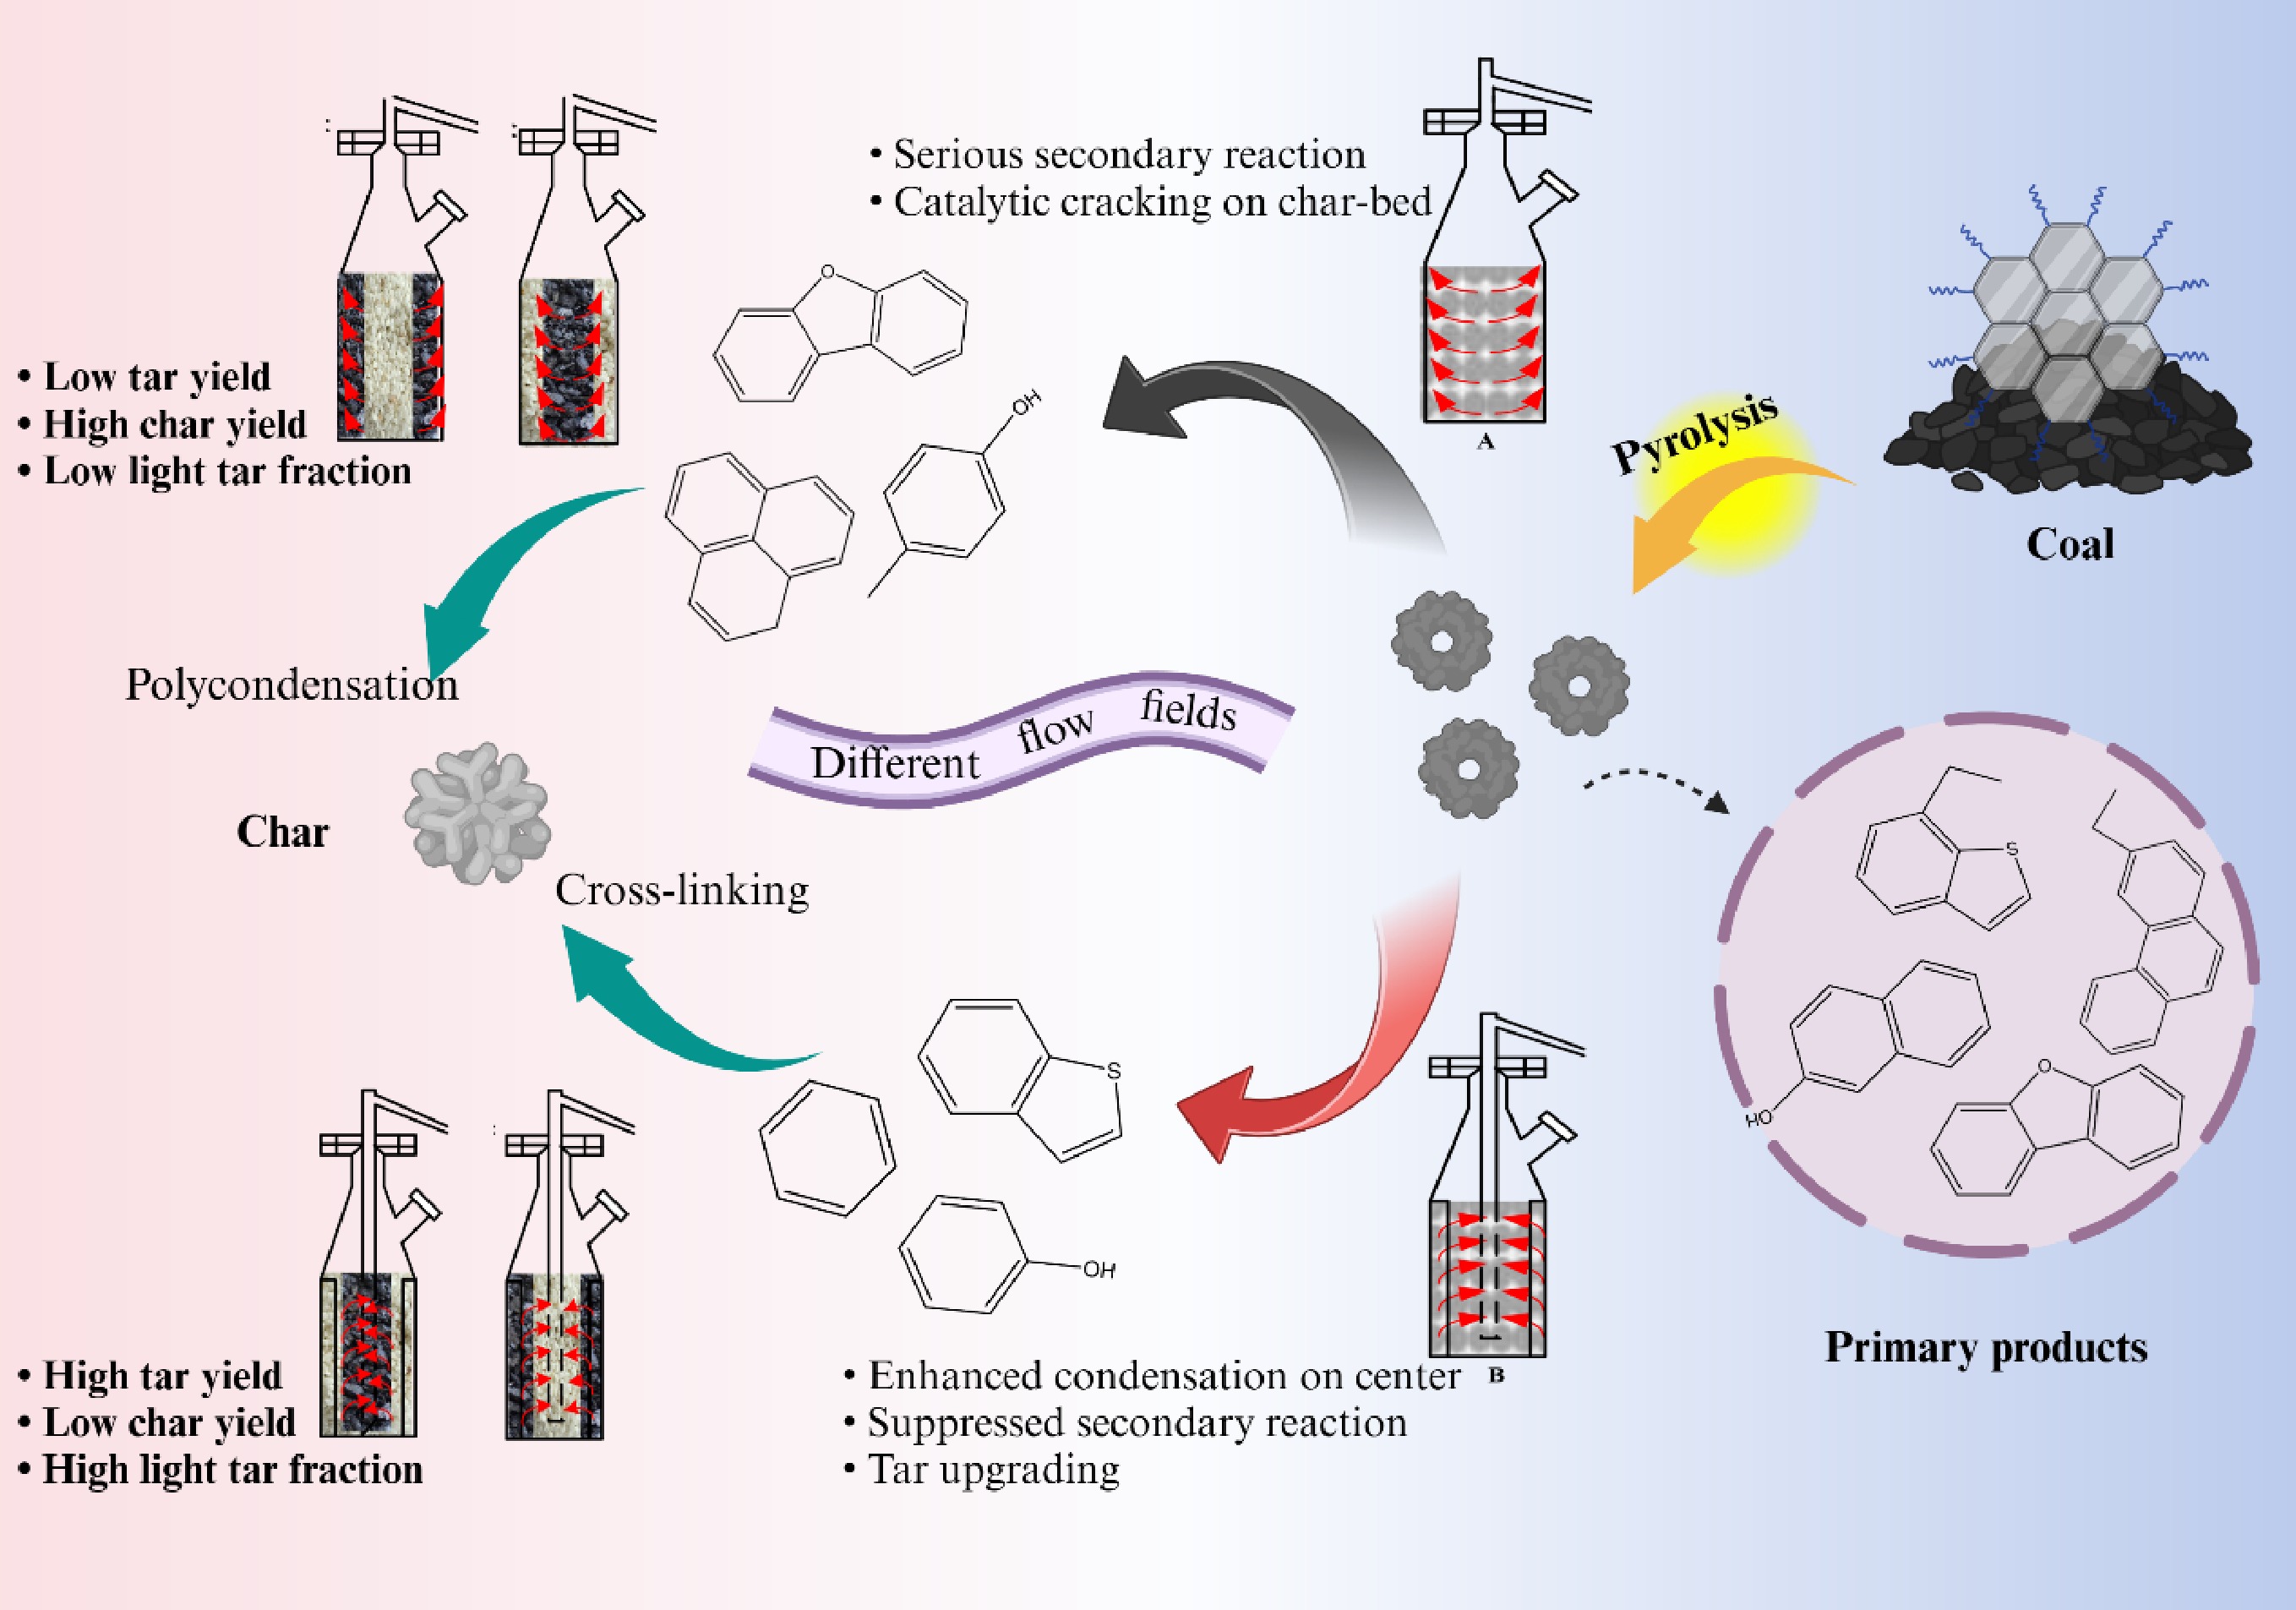
Pyrolysis converts coal volatiles into tar and gas, enabling the clean and efficient utilization of low-rank coal. Considerable attention has been given to coal pyrolysis[1], and previous studies have demonstrated that coal rank[2], particle size[3,4], mineral composition[5], atmosphere[6], heating rate[7,8], pressure[9,10], and operating conditions all influence pyrolysis behavior and product distribution[11−16]. These fundamental studies have promoted the development of coal pyrolysis technologies, mainly including indirectly and directly heated processes. Indirect-heating technologies, such as Toscoal, Long flame coal (LFC), and Encoal, are characterized by relatively high tar yield and good product quality[17−19], whereas directly heated processes often suffer from fine particle entrainment and tar quality deterioration. Nevertheless, indirectly heated reactors still face challenges such as limited heat transfer efficiency and pronounced secondary reactions. At present, an efficient pyrolysis technology for fine fuel particles (< 10 mm) remains lacking.
Selection of the appropriate pyrolysis reactors and catalysts is essential to control product distribution and yield. Much research is focused on optimizing reaction conditions, using catalysts, and designing reactors to enhance coal tar yield and quality. Currently, Chen et al.[20] have proposed an indirectly heating fixed-bed reactor attached with internals, consisting of a central gas gathering tube and numerous metal plates, which can control the flow field, heat and gas conditions to coordinate the secondary reaction of pyrolysis gaseous volatiles by heating transfer plates and gas collection pipes, and further avoid the excessively high temperature of gas volatiles to prevent the polycondensation reaction between volatile gas molecules, and promote the secondary cracking reaction of macromolecules. Hu et al.[21] studied the influence of coal moisture level upon pyrolysis characteristics in reactors with and without internals, revealing that the reactor with internals could promote the process of condensation and produce more light tar. Cheng et al.[22] found the suppression of secondary reactions by reducing pressing conditions in reactors with internals. Similar results were obtained in research on waste tyres and oil shale pyrolysis fields. Xu et al.[23] revealed the pyrolysis behavior of used tyres in fixed reactors added with internals. Lin et al.[24] initially reported the pyrolysis of oil shale using this new configured reactor, and the impact of a solid heat carrier on the oil shale decomposition process was investigated by Lai et al.[25]. Siramard et al.[26] observed a greater tar yield of shale under lower pyrolysis pressure. However, most previous studies on reactors with internals have primarily focused on overall product yields and three-phase distribution, while systematic mechanistic understanding of how internals regulate volatile flow fields and thereby influence secondary reactions remains limited.
The objective of this work is to research pyrolysis behaviors, kinetics, and flow field insights by co-processing coal and quartz in fixed-bed reactors with internals. TG-FTIR-GCMS analyses were also adopted to quantitatively identify the generated gas types and functional groups, which were combined with kinetic models to provide a detailed understanding of the thermal dynamics, behaviors, and characteristics of pyrolysis volatiles. The flow field effect on tar production and char characteristics in scale-up experiments was also researched, and the working mechanism of the flow field in the fixed reactor attached with internals was discussed and compared with the microscopic findings, providing a theoretical basis for large-scale application of the highly efficient clean utilization of low-rank coal.
-
Pure quartz from a market and long flame coal obtained from Heilongjiang (China) were chosen as the samples for the co-pyrolysis experiments. Prior to experiments, both coal and quartz were sieved to similar particle size ranges below 3 mm, resulting in comparable particle size distributions and bed porosities. Therefore, the permeability and gas flow behavior among different feeding modes are considered comparable, ensuring reasonable comparison of experimental results. The proximate and ultimate analysis results of coal are depicted in Fig. 1a.
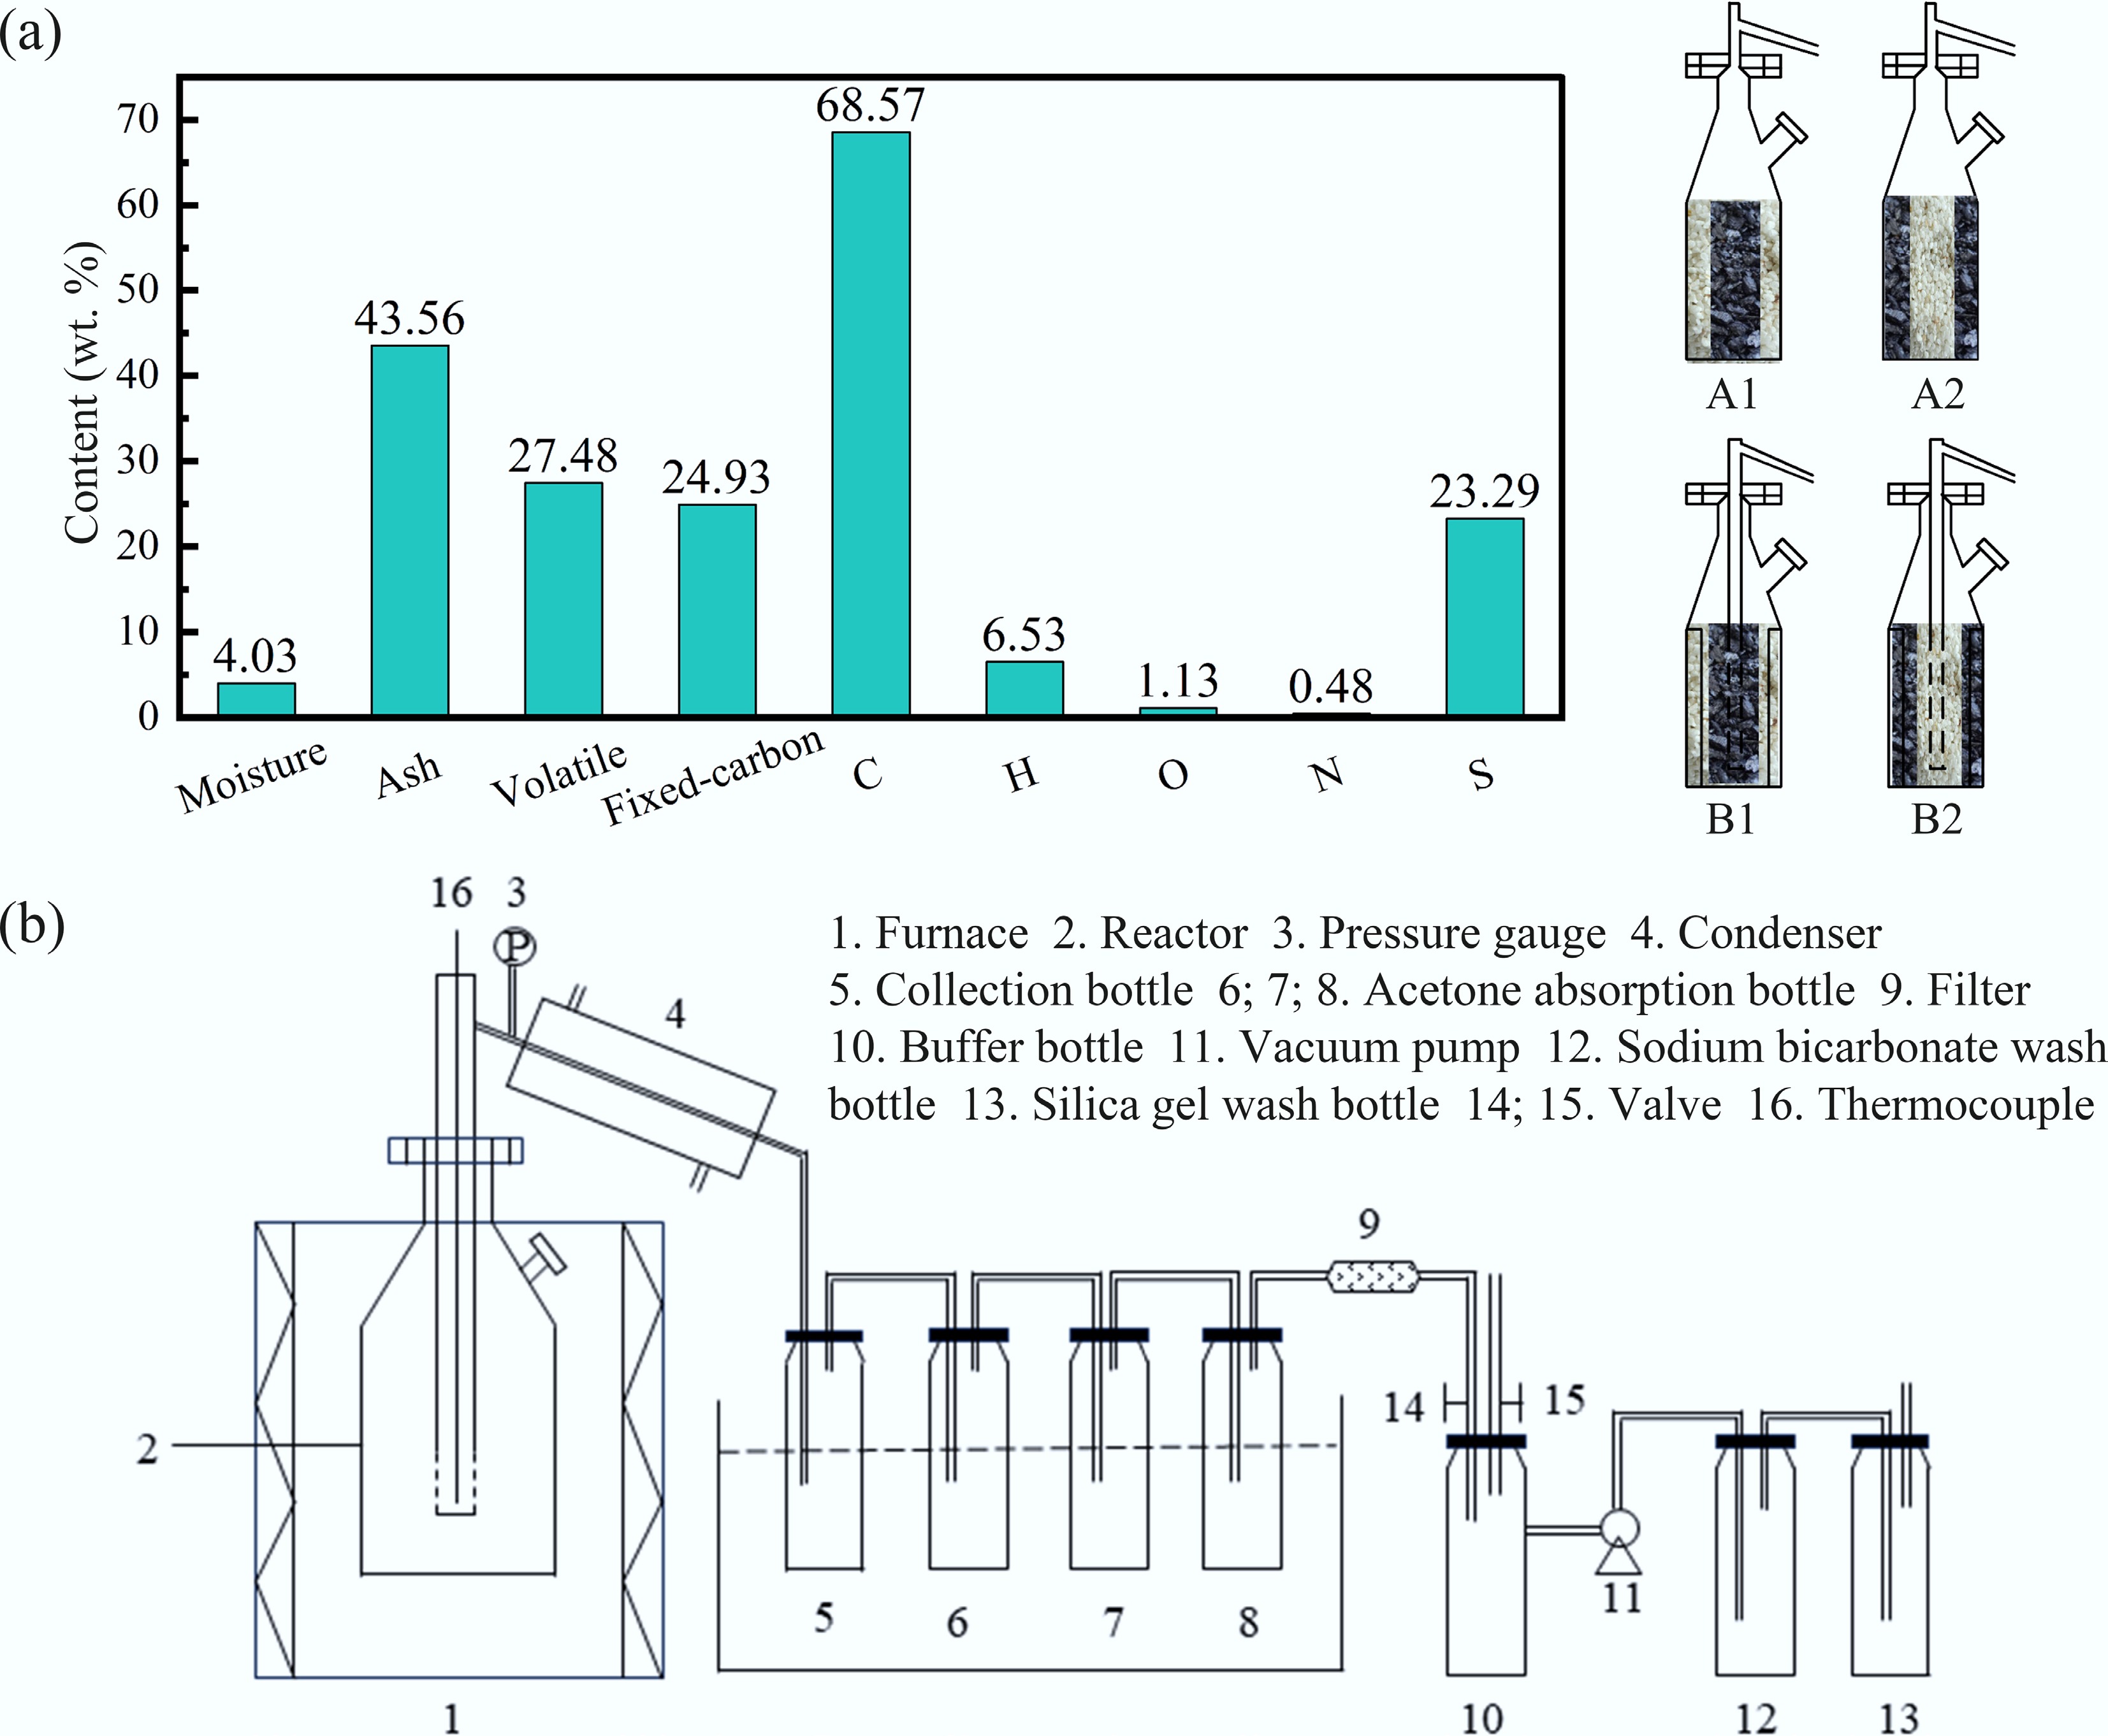
Figure 1.
(a) Proximate and ultimate analyses of coal sample; (b) feeding modes of coal and quartz and schematic diagram of the pyrolysis apparatus.
Experiment and product analysis
-
The schema of pyrolysis devices is shown in Fig. 1b. Prior to each run, the samples were loaded in the reactor, air was removed from the reactor by passing 250 mL/min of N2 for 5 min. Thereafter, the reactor connected to the collection system was placed into the furnace when the heating temperature reached 900 °C. A thermocouple was placed in the center to monitor the temperature, and the volatiles generated in the pyrolysis process were condensed in a cold trap at −10 °C. The uncondensed gases were measured by a wet gas meter, and collected in a gasbag for analysis. Pyrolysis experiments were terminated when the sample in the reactor center reached 500 °C. A thermocouple was located at the center of the reactor to monitor the temperature, and all experiments were terminated when the central temperature reached 500 °C. Although certain radial and axial temperature gradients may exist in fixed-bed reactors, all runs were carried out under identical heating conditions, reactor dimensions, and sample loadings. Thus, the relative comparison among different feeding modes is considered reliable. All pyrolysis liquid products were collected, and the tar in the condenser was washed with acetone. The product yields in this study are reported on a dry coal basis.
The fixed-bed reactors with or without internals were applied in the experiments, as shown in Fig. 1, and the feeding modes of coal and quartz were numbered A1, A2, B1, and B2, respectively. The reactor had a height of 35 mm, and an inner diameter of 50 mm. The internals used in this work comprised four heating plates and a gas-gathering tube. A metal pipe with an inner diameter of 30 mm, and a height of 25 mm was used to load coal and quartz together. The quartz color showed a pronounced change when the produced volatiles passed through the quartz bed, indicating the flow mode of gaseous products and thus verifying the macroscopic track of the flow field in the two kinds of reactors. It should be noted that the color change of quartz in this work was employed as a qualitative inert-particle tracer to visualize the macroscopic transport pathway of pyrolysis volatiles. Although this method did not provide quantitative flux information, it offered a direct and intuitive indication of the dominant volatile flow direction inside the reactor.
A thermogravimetric analyzer, a Fourier infrared spectrometer, and a mass spectrometer (PerkinElmer, USA) that were linked by gas transmission cables were used to identify and analyze the evolution properties of the pyrolysis gaseous product. The crucible containing the 10 mg samples was heated at a rate of 20 °C/min from ambient temperature to 900 °C. High-purity N2 (99.999%) at a flow rate of 100 mL/min was used as the carrier gas to maintain an inert atmosphere. Featuring a spatial resolution of 0.4 cm−1 and a scanning rate of 32 times/s, the FTIR could monitor wavenumber between 4,000 and 400 cm−1. Thermogravimetric analysis (TGA) was conducted using a German STA449F3 integrated thermal analyzer. In order to keep the atmosphere inert throughout the experiment, high-quality N2 (99.999%) with a velocity of 50 mL/min was fed into the reactor along with 5 mg of sample for each experiment. The samples were heated from ambient temperature to 900 °C at heating rates of 20, 30, and 40 °C/min and held for 10 min at 900 °C. Kinetic parameters were calculated using both KAS and FWO methods[27]. It should be noted that coal pyrolysis is a complex multi-step reaction involving parallel and consecutive reactions. Therefore, the activation energies obtained by the KAS and FWO methods represent apparent activation energies corresponding to overall decomposition behavior at different conversions. Nevertheless, these iso-conversional methods are widely accepted for describing the thermal degradation characteristics and comparing reaction difficulty in complex solid-state systems.
The water-toluene distillation method was used to determine the amount of water in tar. Simulated distillation GC (Agilent 7890) was employed to identify the different oil fractions of dehydrated tar, and micro GC (Agilent 3000A) was used to determine the relative content of major pyrolysis gaseous products, such as H2, CH4, CO, CO2, C2H4, C2H6, C3H6, and C3H8.
-
The thermogravimetric result of coal at 20 °C/min is shown in Fig. 2. Generally, the pyrolysis of long flame coal mainly consists of three stages. The devolatilization process at less than 300 °C corresponded to the elimination of water and CO2. The first peak of DTG at about 80 °C was attributed to the release of moisture. All samples began to release minor quantities of water from breaking down phenolic structures and carbon oxides from carboxylic and carbonyl groups when the moisture was lost at 200–300 °C[28]. The crucial pyrolysis of coal occurred, and the weight loss reached the maximum in the temperature range of 300 to 600 °C, which was caused by the emission of carbon-containing volatiles. In this stage, tar and gaseous products were released, and char was formed[29]. The third stage of secondary degasification, with the temperature from 600 to 900 °C was attributed primarily to polycondensation reaction, causing the production of coke. Generally, the breakage of macromolecular networks leads to the breakdown of bridge bonds connecting aromatic ring systems, which removes heteroatom functional groups and produces more smaller fragments as temperatures rise[30]. The GC/MS result of volatiles at the DTG peak is displayed in Fig. 2b. Due to the cracking of macromolecular aromatic structures in coal, a large number of aromatics and aliphatic compounds were generated during the pyrolysis process of long flame coal, such as toluene, benzene,1,3-dimethyl-, 2-phenethyl-β-phenylpropionate, and hentriacontane.
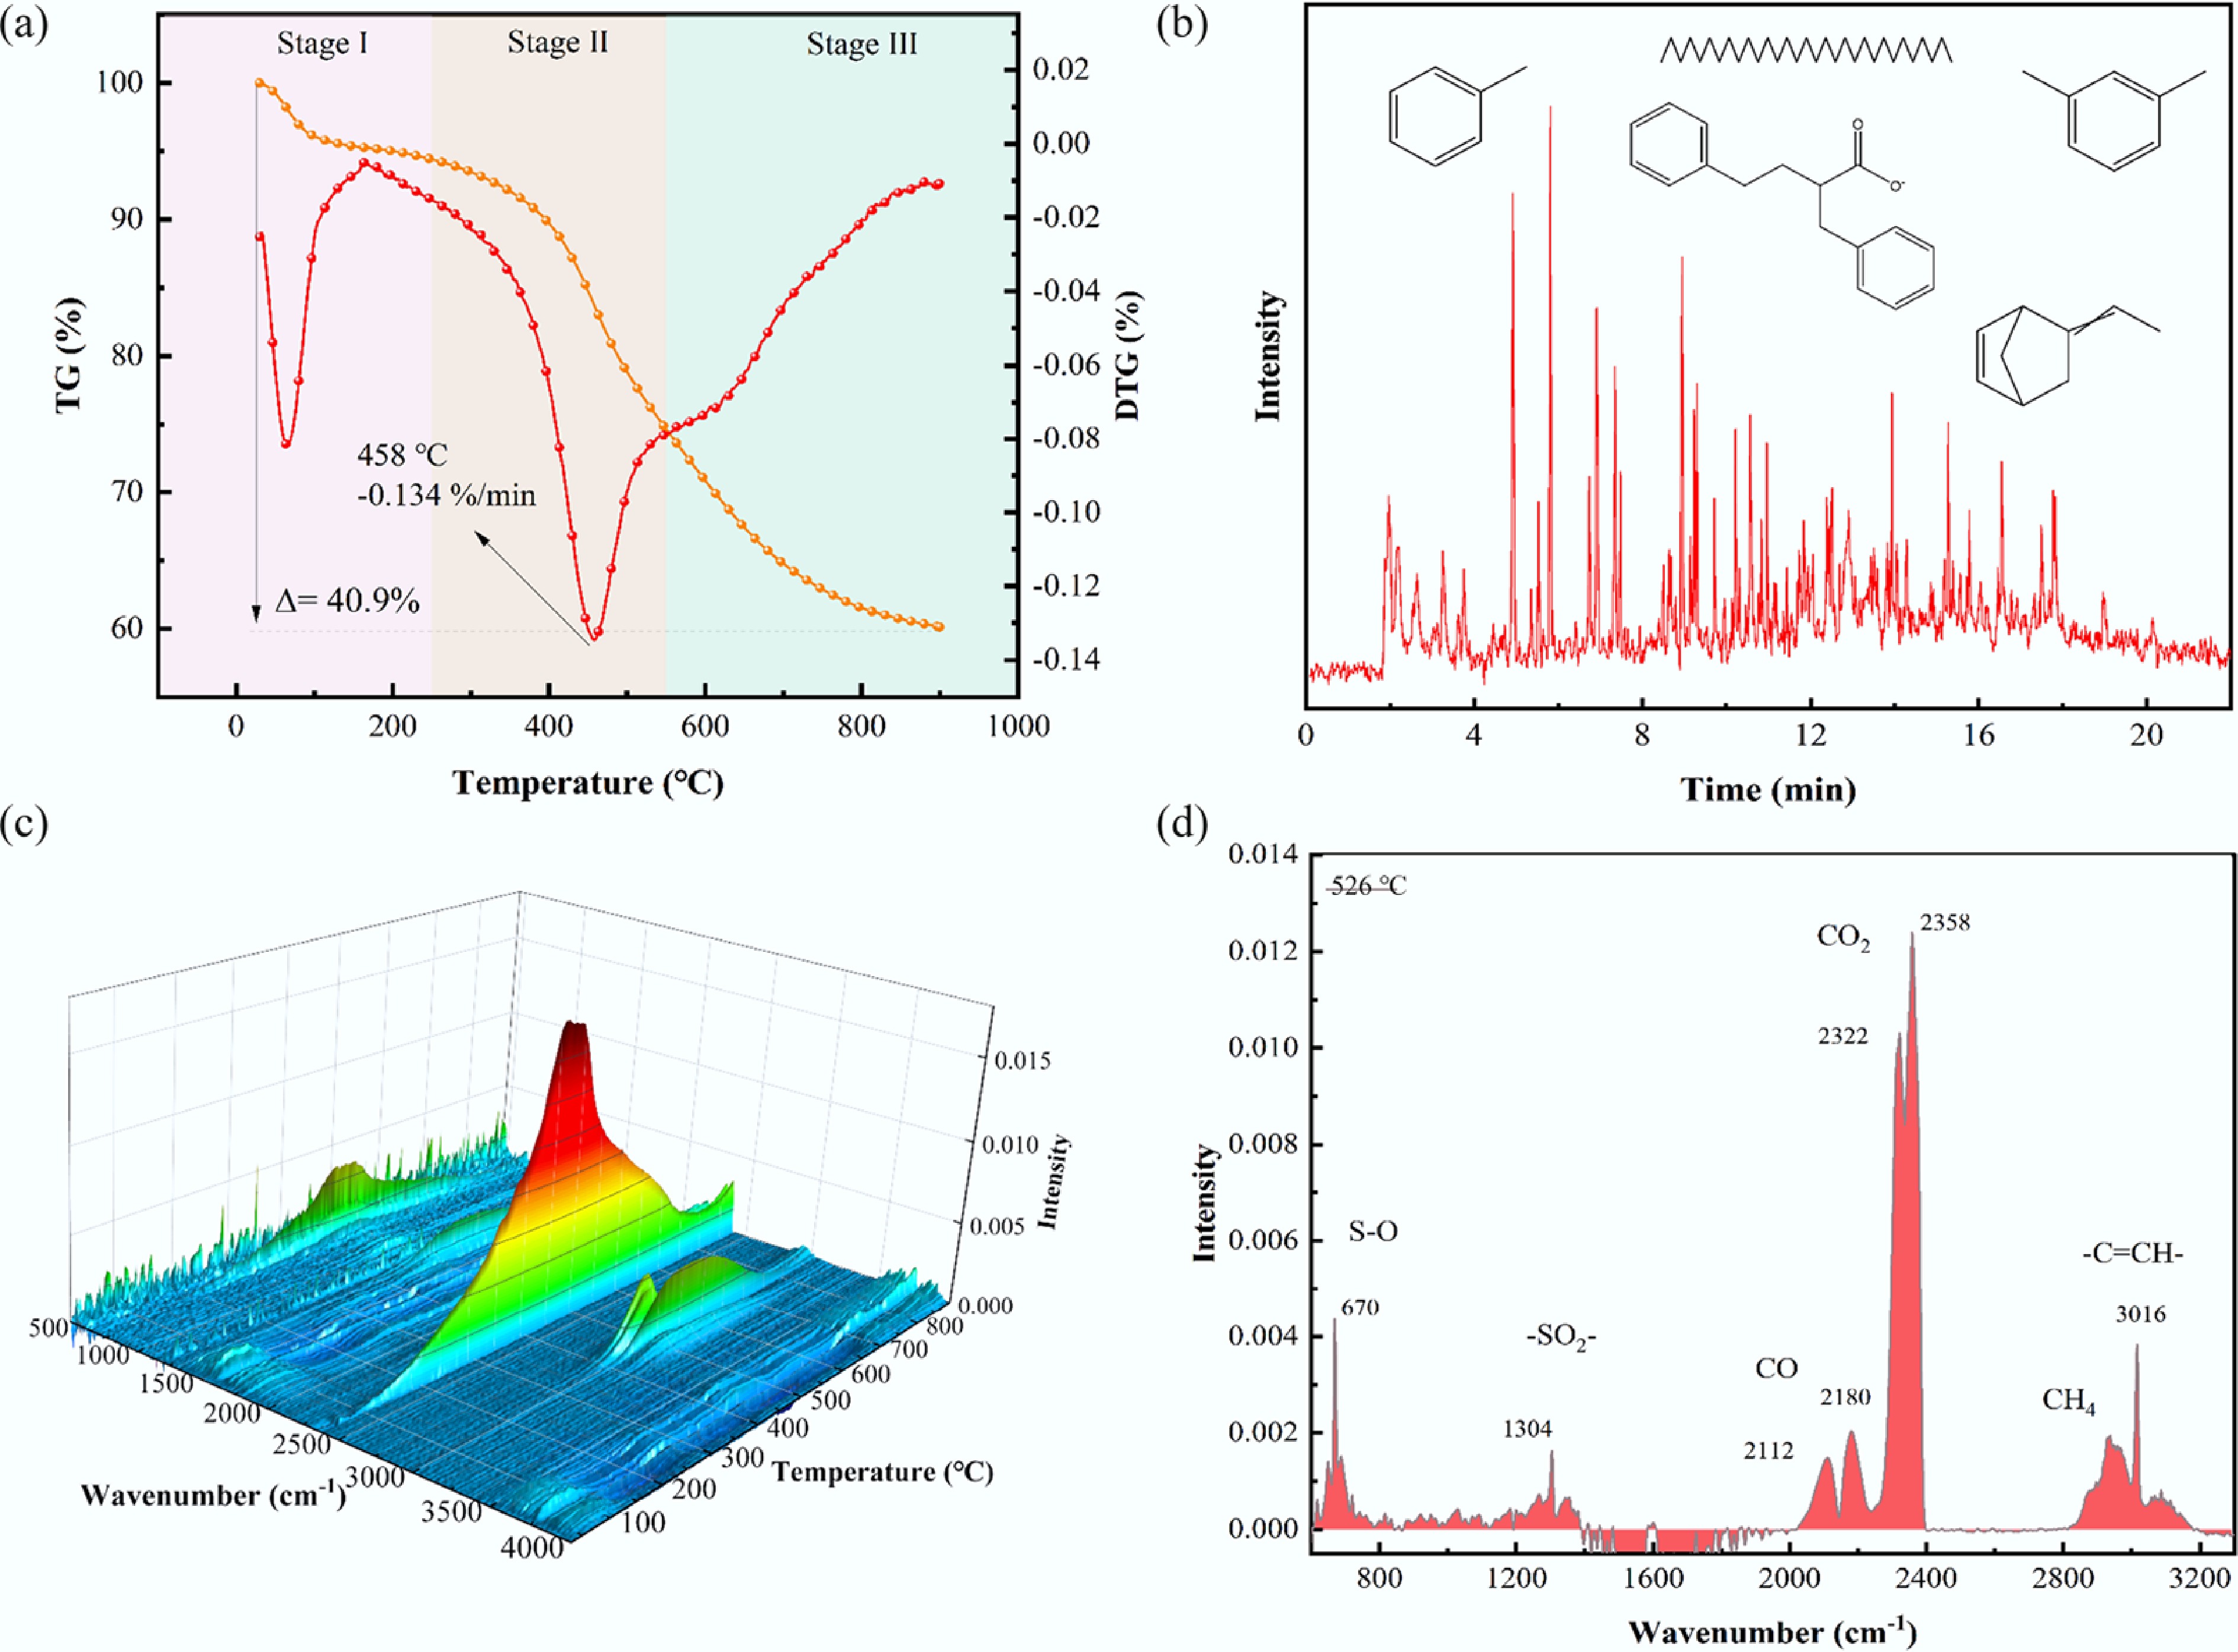
Figure 2.
The TG curves of (a) coal at 20 °C/min, (b) GC-MS of volatiles at DTG peak, (c) 3D FTIR spectrum of volatiles with temperature, (d) FTIR spectrum of volatiles at 526 °C.
The volatiles created during the thermo-gravimetric procedure were transferred to the infrared spectrometer via the gas transmission tube. The result of the FTIR spectrum is shown in Fig. 2c, d. There were two significant peaks at 2,322 and 2,358 cm−1, suggesting the release of CO2. The peaks of 2,112 and 2,180 cm−1 represented the release of CO. The evident peak was observed at 3,016 cm−1, indicating the aromatics appearance (–C=CH–). The stretching vibrations of methyl, methylene, and hypomethyl at 2,968, 3,936, and 2,876 cm−1, respectively, denoted the emission of CH4[31]. It is worth noting that two peaks at 670 and 1,304 cm−1 corresponded to S–O stretching vibration and –SO2– asymmetric stretching vibration, which denoted the existence of sulfonic acid in the pyrolysis process[32].
As shown in Fig. 3, the release of CO2 began at about 100 °C, and reached a peak near 500 °C. This behavior is attributed to the progressive decomposition of carbonate and oxygen-containing functional groups with increasing temperature. When the temperature rose to 300 °C, CO started to evolve and achieved a peak at roughly 700 °C. CO was generated by the breakdown of quinone ether and the oxygenated heterocycles, and the reaction between CO2 and char at high temperatures can also form CO[33]. The release of methane and aromatic hydrocarbons both started at approximately 400 °C, and methane reached its maximum at 500 °C, while aromatics reached their maximum at about 580 °C. The emission of CH4 was due to the decomposition of aliphatic and aromatic side chains with methyl functional groups[34], and the evolution of aromatics was attributed to the degradation and recombination of macromolecules in the long flame coal. At the initial temperature of 400 °C, sulfonic acid evolved gradually and attained an absorbance peak at around 600 °C. The absorbance integral of all pyrolysis gas products is depicted in Fig. 3c. The relative release intensity of gaseous products could be reflected by the absorbance integral value. Based on the results of the integral, CO2 has the highest intensity, followed by CO, S–O, –C=CH–, and CH4 during the total pyrolysis processing. Its pyrolysis kinetic parameters and main loss weights are shown in Tables 1 and 2.
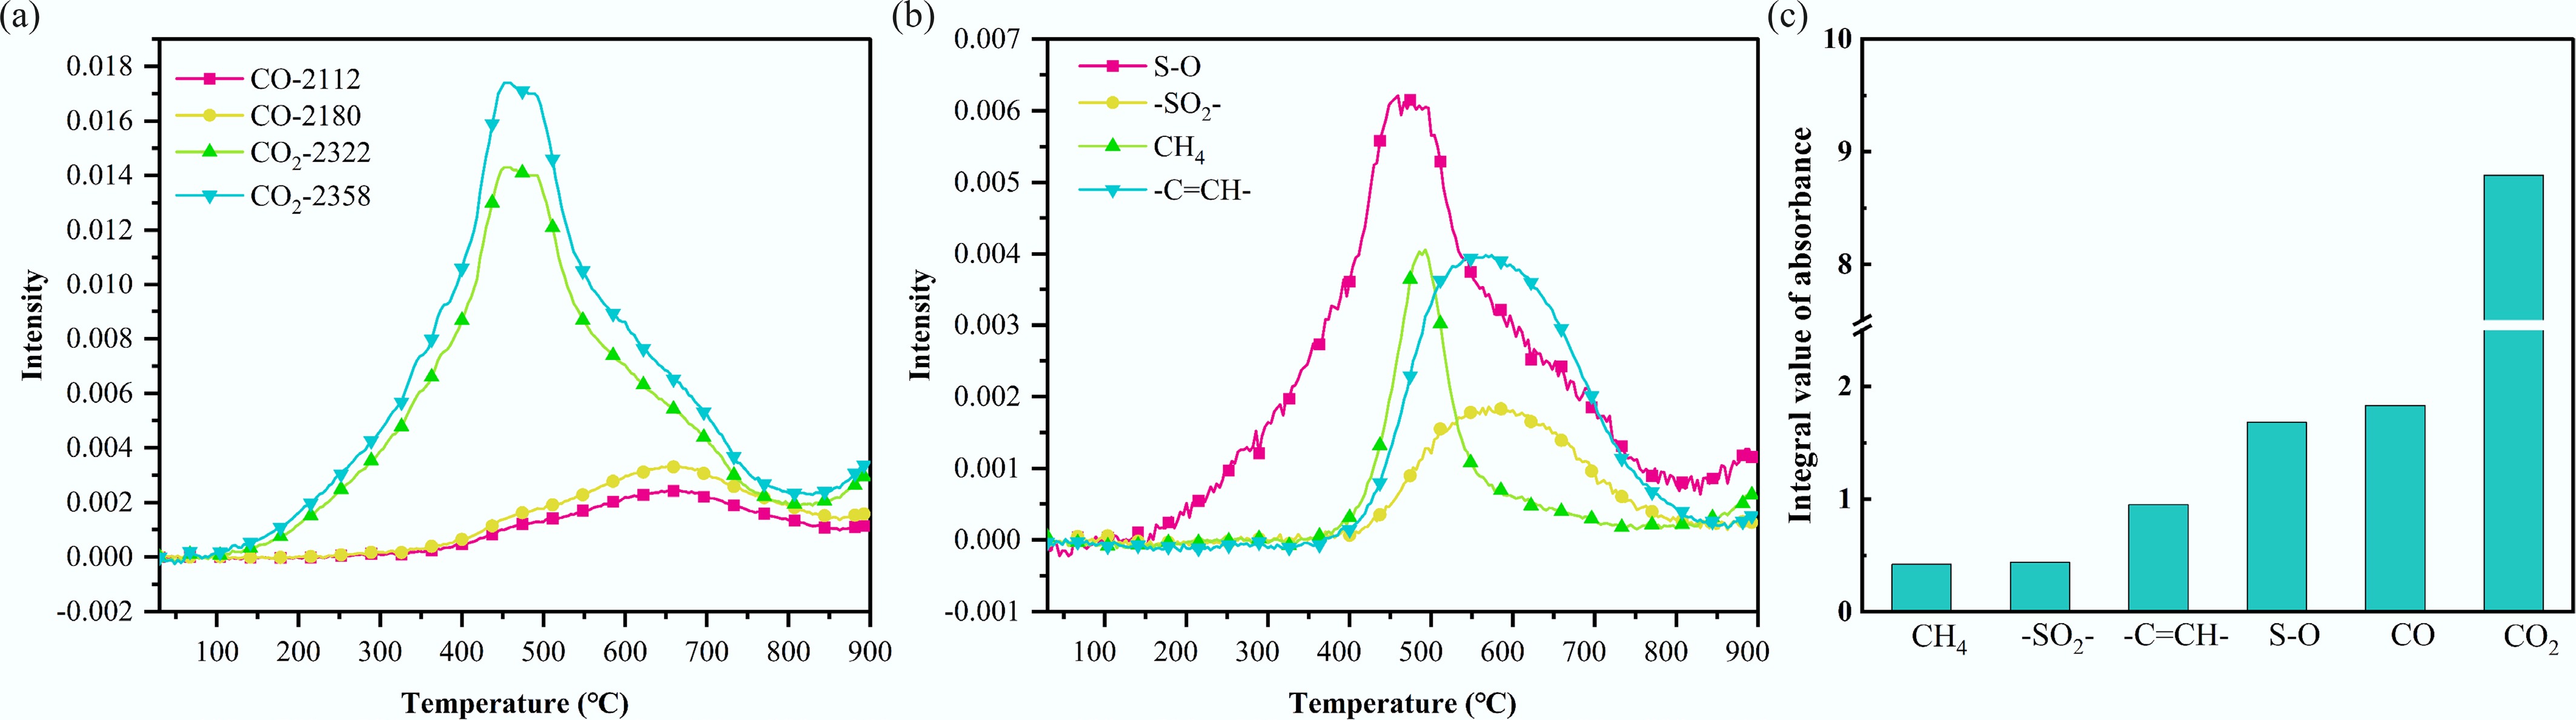
Figure 3.
The evolution of functional groups with (a), (b) temperature, and (c) the integral value of absorbance.
Table 1. Pyrolysis characteristic parameters
Heating rate (°C/min) Stage Ts
(°C)Te
(°C)Tm
(°C)DTGm (wt.%/min) Mass change rate (wt.%) 20 I 30.3 198 64 −1.68 4.96 II 281.3 807.3 458 −2.73 32.5 30 I 30.5 157 72.5 −2.39 4.63 II 279 815.5 459 −3.87 32.46 40 I 30.7 174.7 75.3 −2.66 4.64 II 292 817.3 467.3 −5.69 32.32 Ts, Te, Tm, and DTGm refer to the initial pyrolysis temperature (°C), the termination pyrolysis temperature (°C), the maximum weight-loss temperature (°C), and the maximum weight-loss rate (wt.%/min), respectively. I and II refer to the first and the second weight-loss stage, respectively. Table 2. Pyrolysis kinetic parameters
α KAS FWO Temperature
(°C)Eα R2 Eα R2 0.2 67.22 0.995 73.14 0.994 354.88 0.3 127.42 0.997 134.49 0.996 425.33 0.4 161.29 0.998 168.92 0.998 459.61 0.5 208.13 0.998 216.29 0.997 491.55 0.6 209.53 0.997 218.44 0.996 535.61 0.7 263.42 0.995 273.17 0.994 587.27 0.8 263.07 0.992 273.77 0.991 644.11 0.9 294.21 0.988 306.17 0.986 720.55 The weight loss characteristics of long flame coal at different temperatures, as well as the activation energy from KAS and FWO models, are depicted in Fig. 4. The kinetic curves of coal pyrolysis at the conversion of 0.2 to 0.9 are shown in Fig. 4c, d, which were obtained by the iso-conversional methods of KAS and FWO. The fact that the correlation R2 of fitting curves is almost higher than 0.9 indicates most points were well fitted. The activation energies calculated with the KAS and FWO methods are fairly similar (less than 5%). The above facts show that the calculation results of activation energy are considered acceptable. As shown in Fig. 4b, the activation energy, 67.23–294.22 kJ/mol by the KAS method, and 73.15–306.18 kJ/mol by the FWO method, elevated gradually with the rise in temperature and conversion rate. This is because, as the temperature rises, more stable chemical bonds break to release carbon volatiles, which is consistent with the above thermogravimetric analysis. Significant variance in the activation energy (up to 77%), indicates that complex pyrolysis processes were engaged in the thermal degradation of long flame coal.
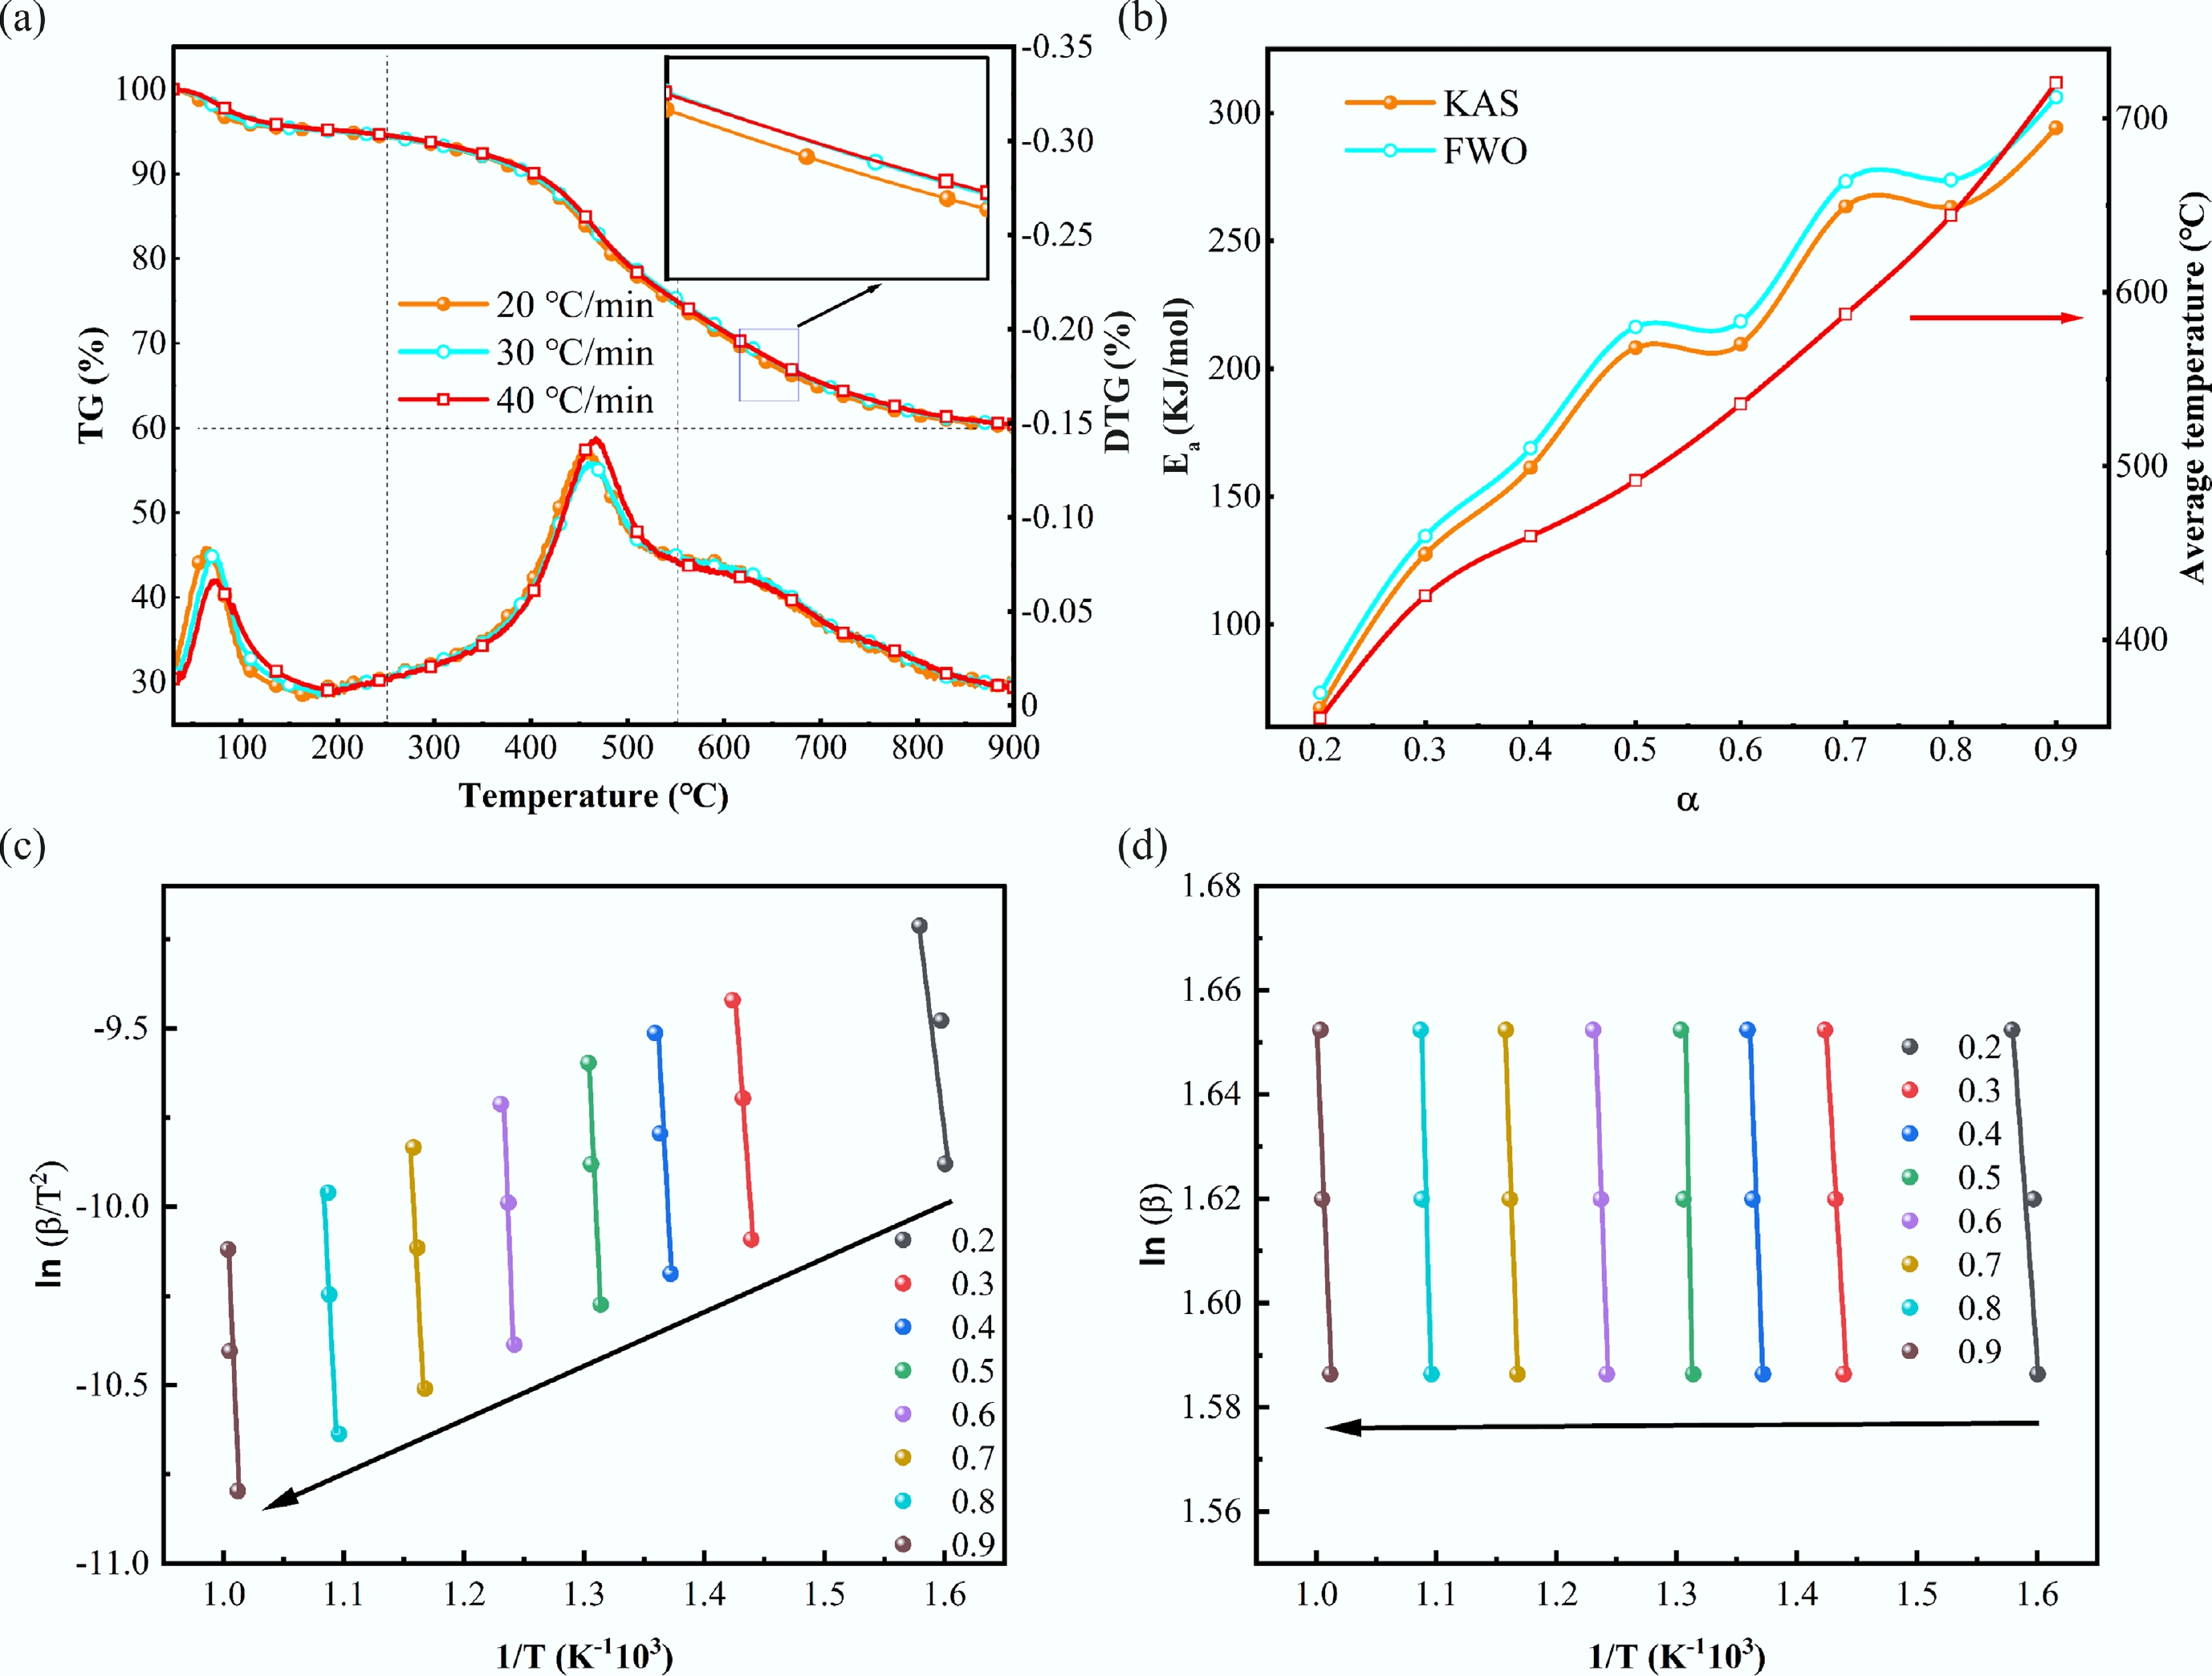
Figure 4.
TG and DTG curves of (a) long flame coal at various temperatures and (b) the active energies from KAS and FWO models; (c) KAS and (d) FWO fitting curves from the decomposition of long flame coal at different conversions.
Particle size distribution and heating
-
The particle size distribution of samples is shown in Fig. 5. The fractions of coal and quartz with particle sizes between 0.6 and 2 mm accounted for 86.7% and 90.4% of the total, respectively. Although the particle size difference from 0.3 to 0.6 mm was 3.5% for coal and quartz, the value difference from 0.6 to 3 mm was below 2%, suggesting a similar size distribution, and therefore, this provided an identical permeability for gaseous products in the reactor with and without internals. The heating trends in the reactor's center bed are depicted in Fig. 5b. The heating rate of A1 was slower than that of A2, and the heating rate of B1 was slower than that of B2. There were two heating methods between particles in reactors, namely convection and heat conduction. The quartz has low thermal conductivity, which is unbeneficial to heat conduction, thus causing a lower heating rate of A1 and B1. Additionally, quartz with low thermal conductivity also caused the center bed of A1, A2, and B1 to remain below 100 °C for a longer period. The heating rate of B2 reached 100 °C quickly as a result of the rapid release of volatiles from coal close to the reactor heating wall and the forced transfer of the sensible heat of pyrolysis gaseous products into the center bed of reactor B, consequently increasing the heating rate of B2. A2 had the same feeding modes as B2, but due to rapid heat transfer, the coal close to the reactor wall was initially cracked into high-temperature char, and coal volatiles escaped from the char bed with high gas permeability, which further reduced the heating rate of A2.
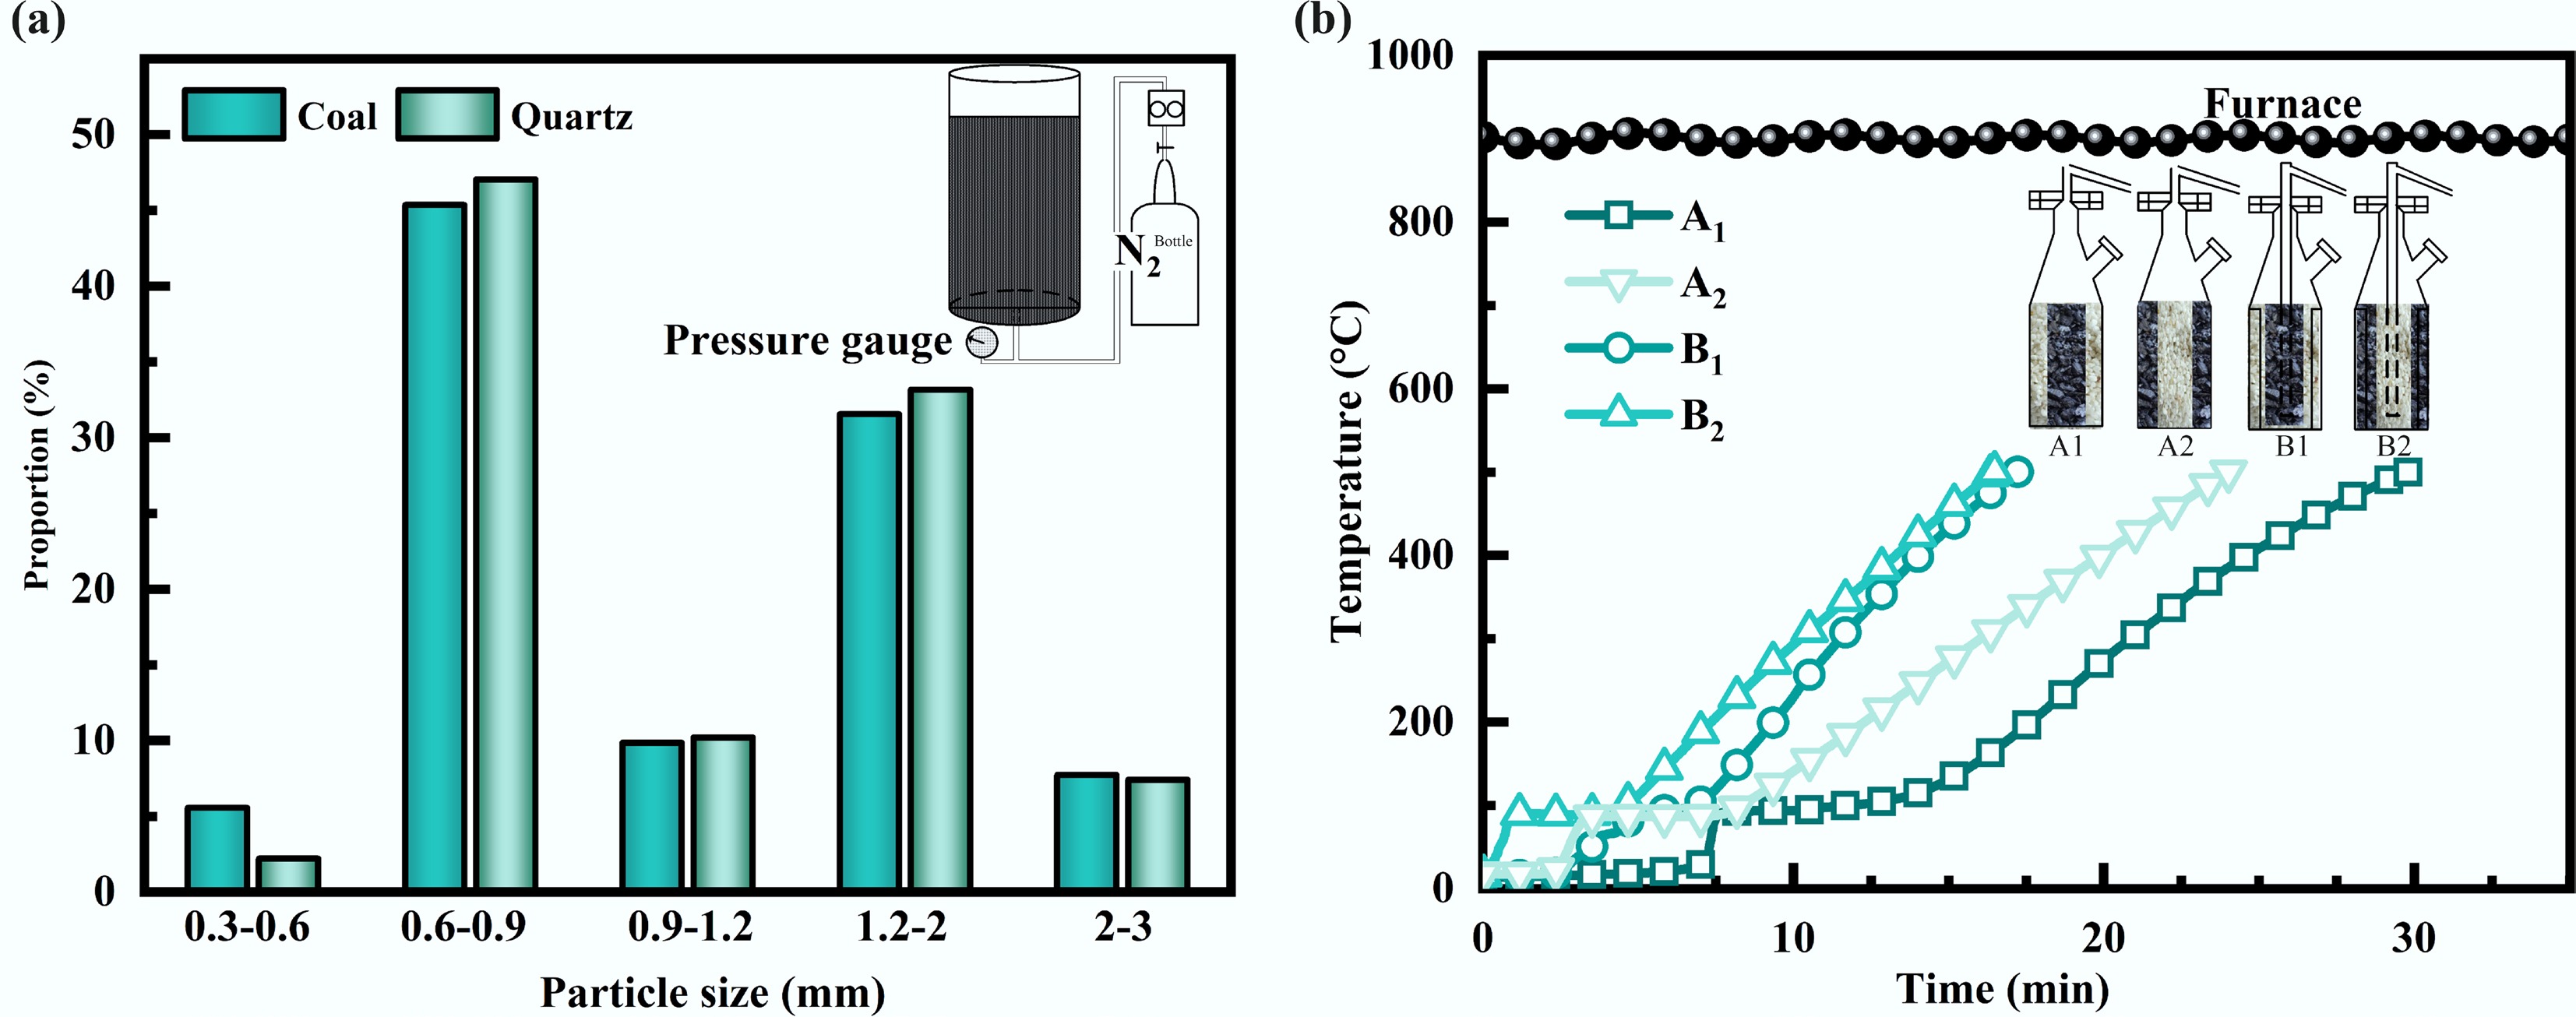
Figure 5.
Particle size distributions of (a) coal and quartz, and (b) heating curves in center bed of reactors.
Pyrolysis product distribution
-
The product distribution of coal and quartz pyrolysis is listed in Fig. 6. The tar and gas yields of reactor B2 were higher than those of reactor B1. This was because the coal in reactor B2 contacted the reactor wall directly, which experienced a high pyrolysis temperature and further released more volatiles, thus increasing the tar and gas yields. On the contrary, the quartz contacting the reactor wall decreased the central coal pyrolysis temperature due to the low thermal conductivity of quartz, finally reducing the tar and gas yields. Likewise, the reactor A2 presented a higher tar and gas yield than the reactor A1. Comparing the results of B1 with those of A1 showed that internals increased the yield of tar while decreasing the gas and water yield. The yield of tar increased from 4.93 wt.% of A1 to 5.76 wt.% of B1 when the reactor was filled with coal inside and quartz outside, while the yields of gas and water decreased from 10.27 wt.% and 9.44 wt.% of A1 to 9.18 wt.% and 8.62 wt.% of B1, respectively. At the same time, for the reactor filled with coal outside and quartz inside, A2 presented a lower tar yield but higher gas and water yields than B2, and the content of tar in A2 increased from 5.62 wt.% to 6.10 wt.% in B2. The internals in the reactor changed the gas flow direction, which further decreased the secondary cracking reaction of volatiles, thus enhancing the content of tar and reducing the water yield.
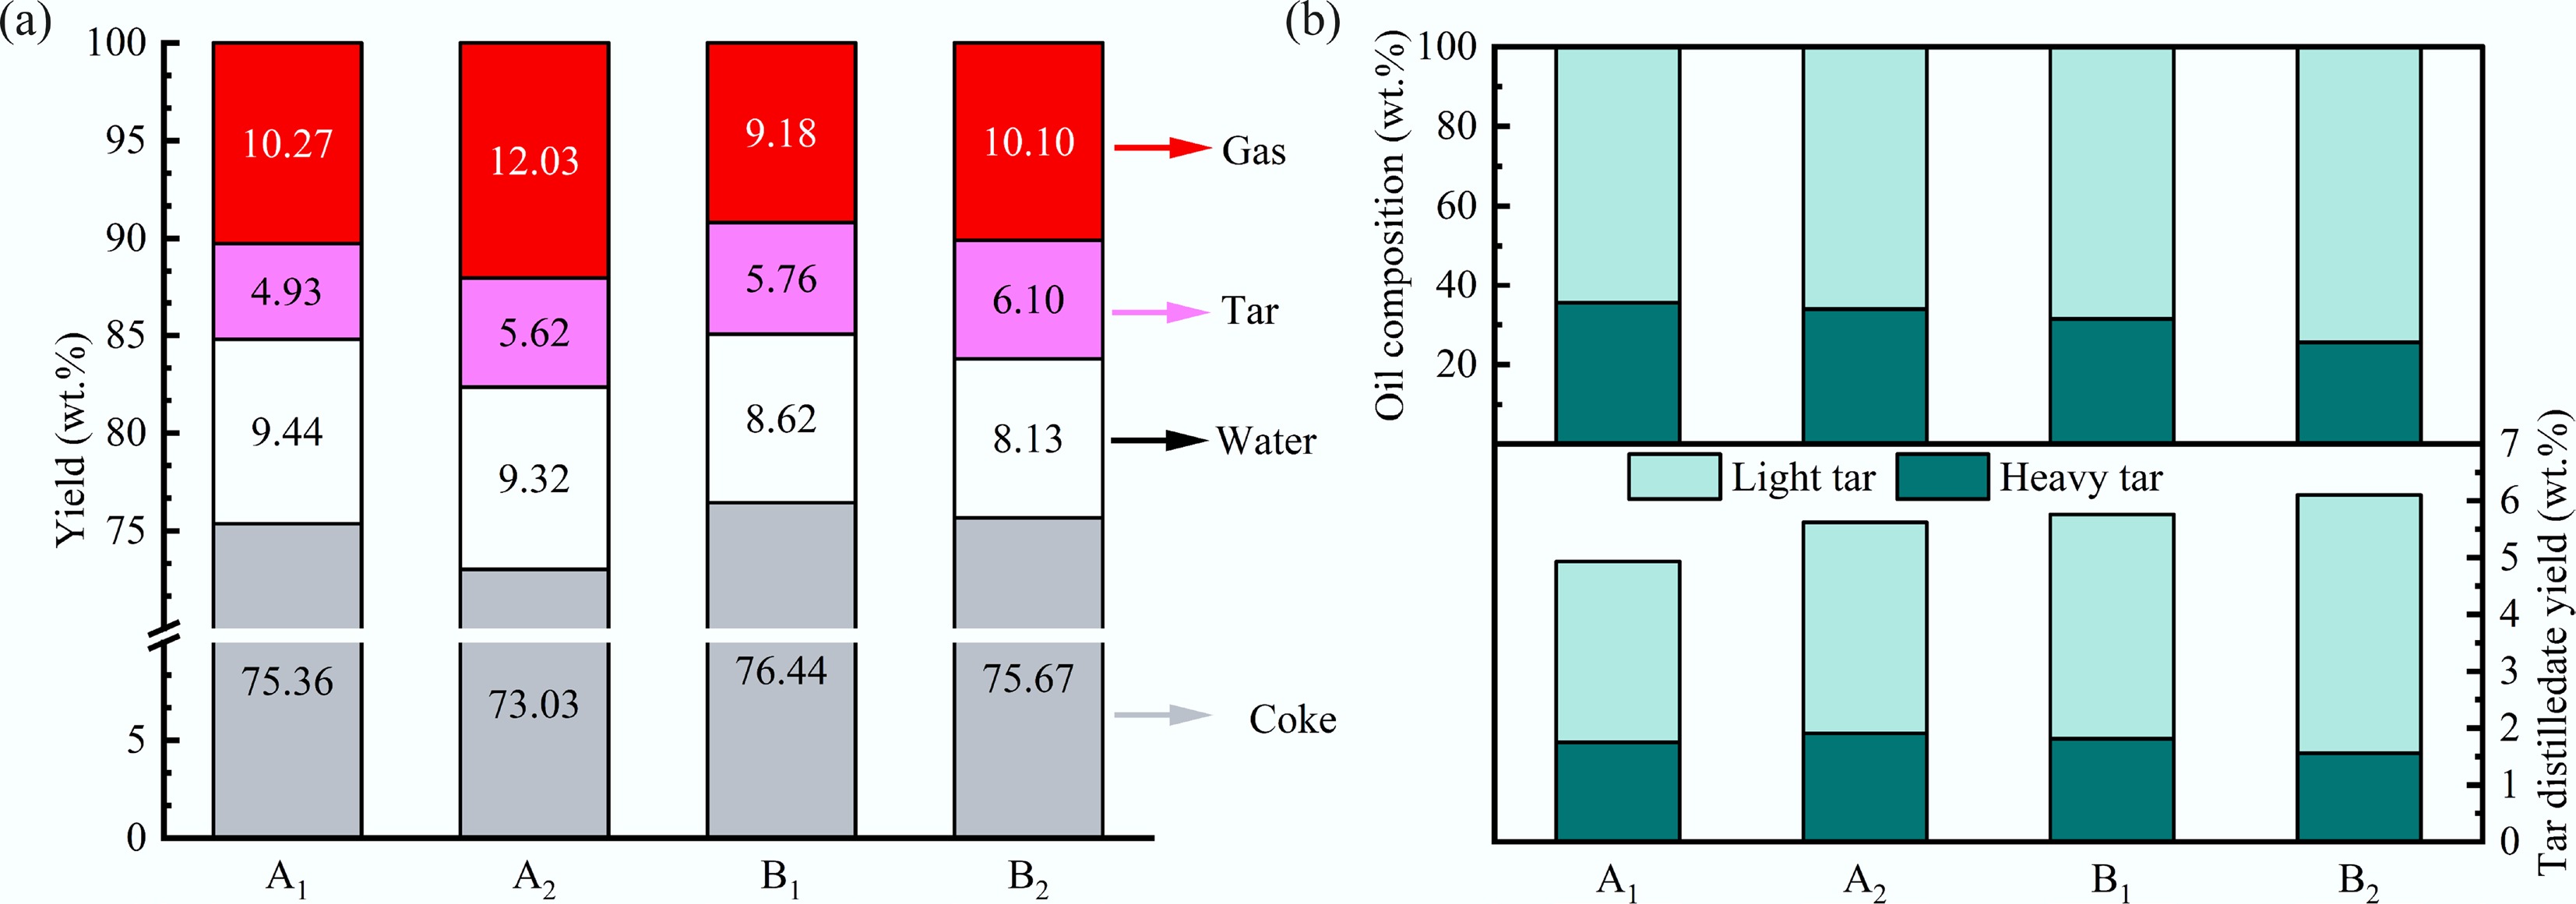
Figure 6.
(a) Pyrolysis product distribution in reactors with and without internals, and (b) variation of yield of light tar.
The components of pyrolysis tar obtained from different reactors are depicted in Fig. 6b. The light tar fraction content of reactor B1 was 68.49%, which was significantly lower than that of reactor B2 at 74.42%. The direct contact of the coal layer with the reactor wall resulted in higher pyrolysis temperatures and heating rates, which led to the release of a large amount of volatiles in a short period, and the shorter residence time inhibited the aggregation of these small molecular fragments at high temperatures, thereby improving the light component content of pyrolysis oil. On the contrary, when the reactor was filled with coal inside and quartz outside, the heat was transferred from outside to inside, and the heating rate was slower, leading to slower escape of volatiles and longer reaction time, which intensified the aggregation reaction of small radical fragments to form large compounds and increased the content of the heavy fraction in the tar. Similarly, the light tar content of reactor A1 (64.5%) was lower than that of reactor A2 (66.05%). Moreover, it was found that the reactor with internals contained more light tar content than the reactor without internal components. This was because in the reactor with internals, the pyrolytic volatile fraction flowed from the outer higher temperature region to the inner lower temperature region, and many heavy tar volatiles condensed in the inner layer of coal due to the different boiling points of tar components. With the increase of temperature in the low-temperature zone of the inner layer, these heavy tar fractions underwent the secondary cracking reaction to generate light tar, which played a role in upgrading the quality of tar.
The effects of feeding modes on the average gas composition in the reactor with and without internals are illustrated in Fig. 7. The reactor filled with coal inside and quartz outside (A1 and B1) contained less H2 but more CH4 than the reactor filled with coal outside and quartz inside (A2 and B2). The coal in A2 and B2 experienced a high pyrolysis temperature and produced much H2.
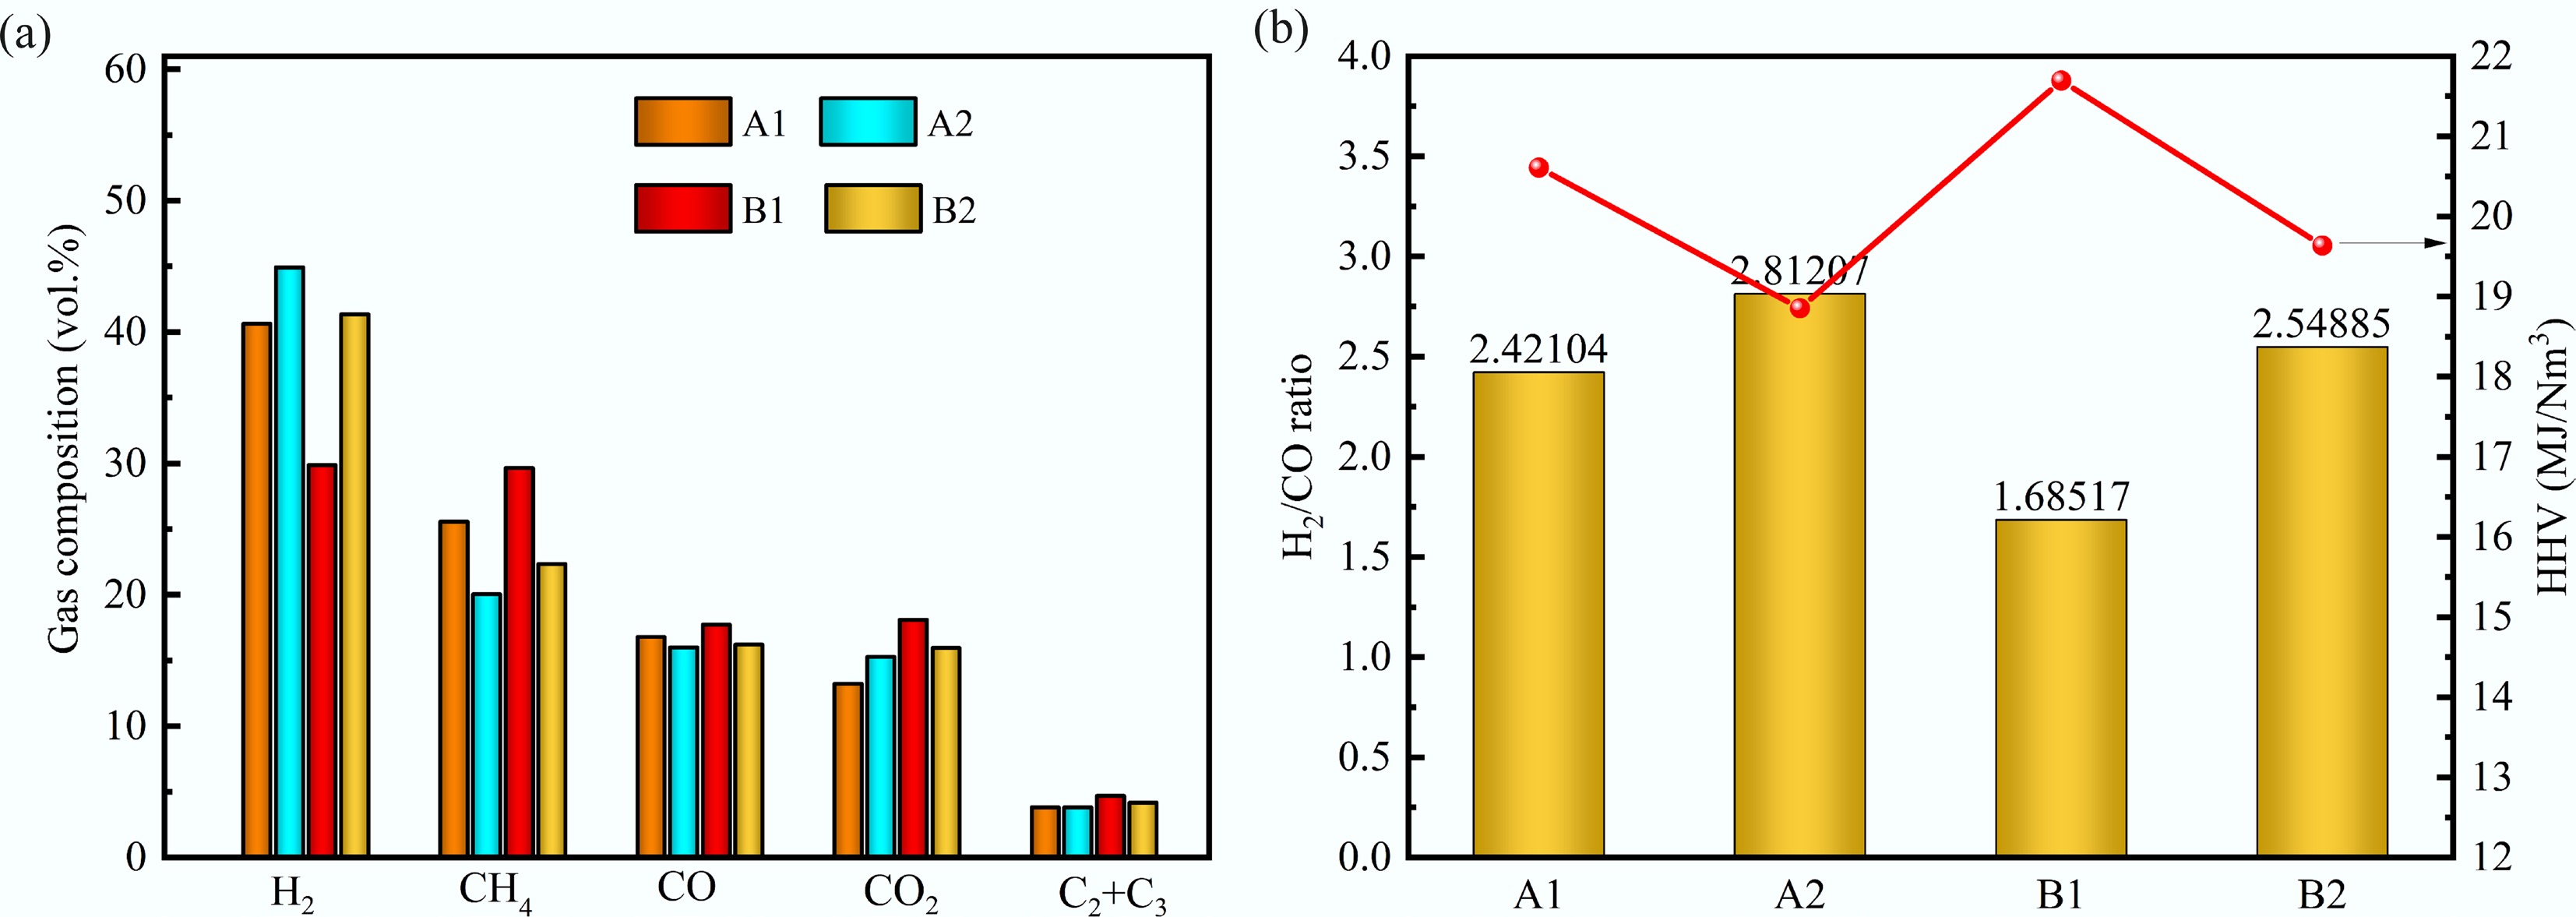
Figure 7.
(a) Effects of feeding modes on the average gas composition in reactor with and without internals; (b) the higher heating value (HHV) of mixed gas and H2/CO ratio.
CH4 was primarily formed at the early stage of volatile removal and is relatively stable. However, the high-temperature environment in A2 and B2 promoted severe secondary thermal cracking of heavy hydrocarbons into large amounts of H2 and CO, which substantially increased the total gas production. Consequently, the relative volume fraction of CH4 in A2 and B2 decreased due to this dilution effect. Comparing the results of the reactor with and without internal components, the reactor without internals had a higher H2 concentration as well as a lower CH4 content. The H2 contents of A1 and A2 decreased from 40.63% and 44.91%, to 29.86% and 41.33% of B1 and B2, respectively, showing that the internals forced the gases to escape into the core lower-temperature layer, thereby suppressing the severe secondary thermal cracking and reforming reactions of primary heavy tars into light non-condensable gases (such as H2). The decrease in H2 and increase in CH4 observed in reactors with internals could be attributed to the shortened residence time of volatiles in high-temperature zones and the suppressed secondary cracking of hydrocarbons, thereby preserving more primary CH4 while limiting further H2 formation. The HHV and H2/CO ratio of pyrolysis gas are shown in Fig. 7b. The HHV values of A1 and B1 were 20.6 and 21.69 MJ/Nm3, higher than those of A2 and B2 at 18.85 and 19.63 MJ/Nm3, which was related to the content of CH4. A2 and B2 had a higher H2/CO ratio than A1 and B1. These results agreed with the quartz color variation and pyrolysis product distribution, clarifying the direction of gas flow in the reactors with and without internal components.
Char properties and volatile flow paths
-
The tar vapor passed through the high-temperature quartz sand, the heavy components in tar left along with accumulated carbon on the quartz surface, and therefore dyed the quartz color and exhibited the flow field variation, as shown in Fig. 8. The quartz color variation is mainly attributed to carbon deposition and tar coking on the quartz surface when volatiles pass through the high-temperature zone, rather than any chemical interaction between quartz and pyrolysis products. Letters O, P, and Q represent the sampling locations of quartz in the axial direction. The quartz colors at the O, P, and Q positions of A1 were black, suggesting the coal volatiles passed through the quartz bed. However, the quartz color at the O position of A2 remained white, while the colors at P and Q presented as black. This indicates that the volatiles did not flow inward through the entire central quartz bed; instead, they primarily escaped upward through the outer coal layer, where flow resistance was lower. Comparing the results of A1 and A2, the colors at the P and Q positions were both dark; this was because the coal volatiles produced at P and Q did not escape from the reactors in time, and part of the volatiles spread out and turned the quartz black. Similar comparative results corresponding to the volatile flow paths could be seen from the quartz sand at the P and Q positions when comparing B1 to A1, and B2 to A2. The quartz colors at O, P, and Q were black in reactor B2, revealing that the volatiles passed through the quartz bed in reactor B2. The quartz color at O in reactor B1 remained white, suggesting no penetration of volatiles. We also found that the darkest color of quartz presented an L shape. The tar vapor significantly dyed the quartz color, not only through volatile condensation but also through coking reaction. The quartz in the L-shape experienced a higher temperature; the high temperature exacerbated the coking reaction on the quartz surface, and its reaction degree intensified with increasing temperature. The intensity of quartz coloration is influenced by the condensation and coking of heavy tar components on the quartz surface and therefore reflects the cumulative exposure of quartz to tar-rich vapors. Nevertheless, the present approach is intended for qualitative visualization rather than precise quantification of tar deposition. Future work combining surface carbon analysis or image-based grayscale evaluation could further enable semi-quantitative assessment of volatile deposition behavior.
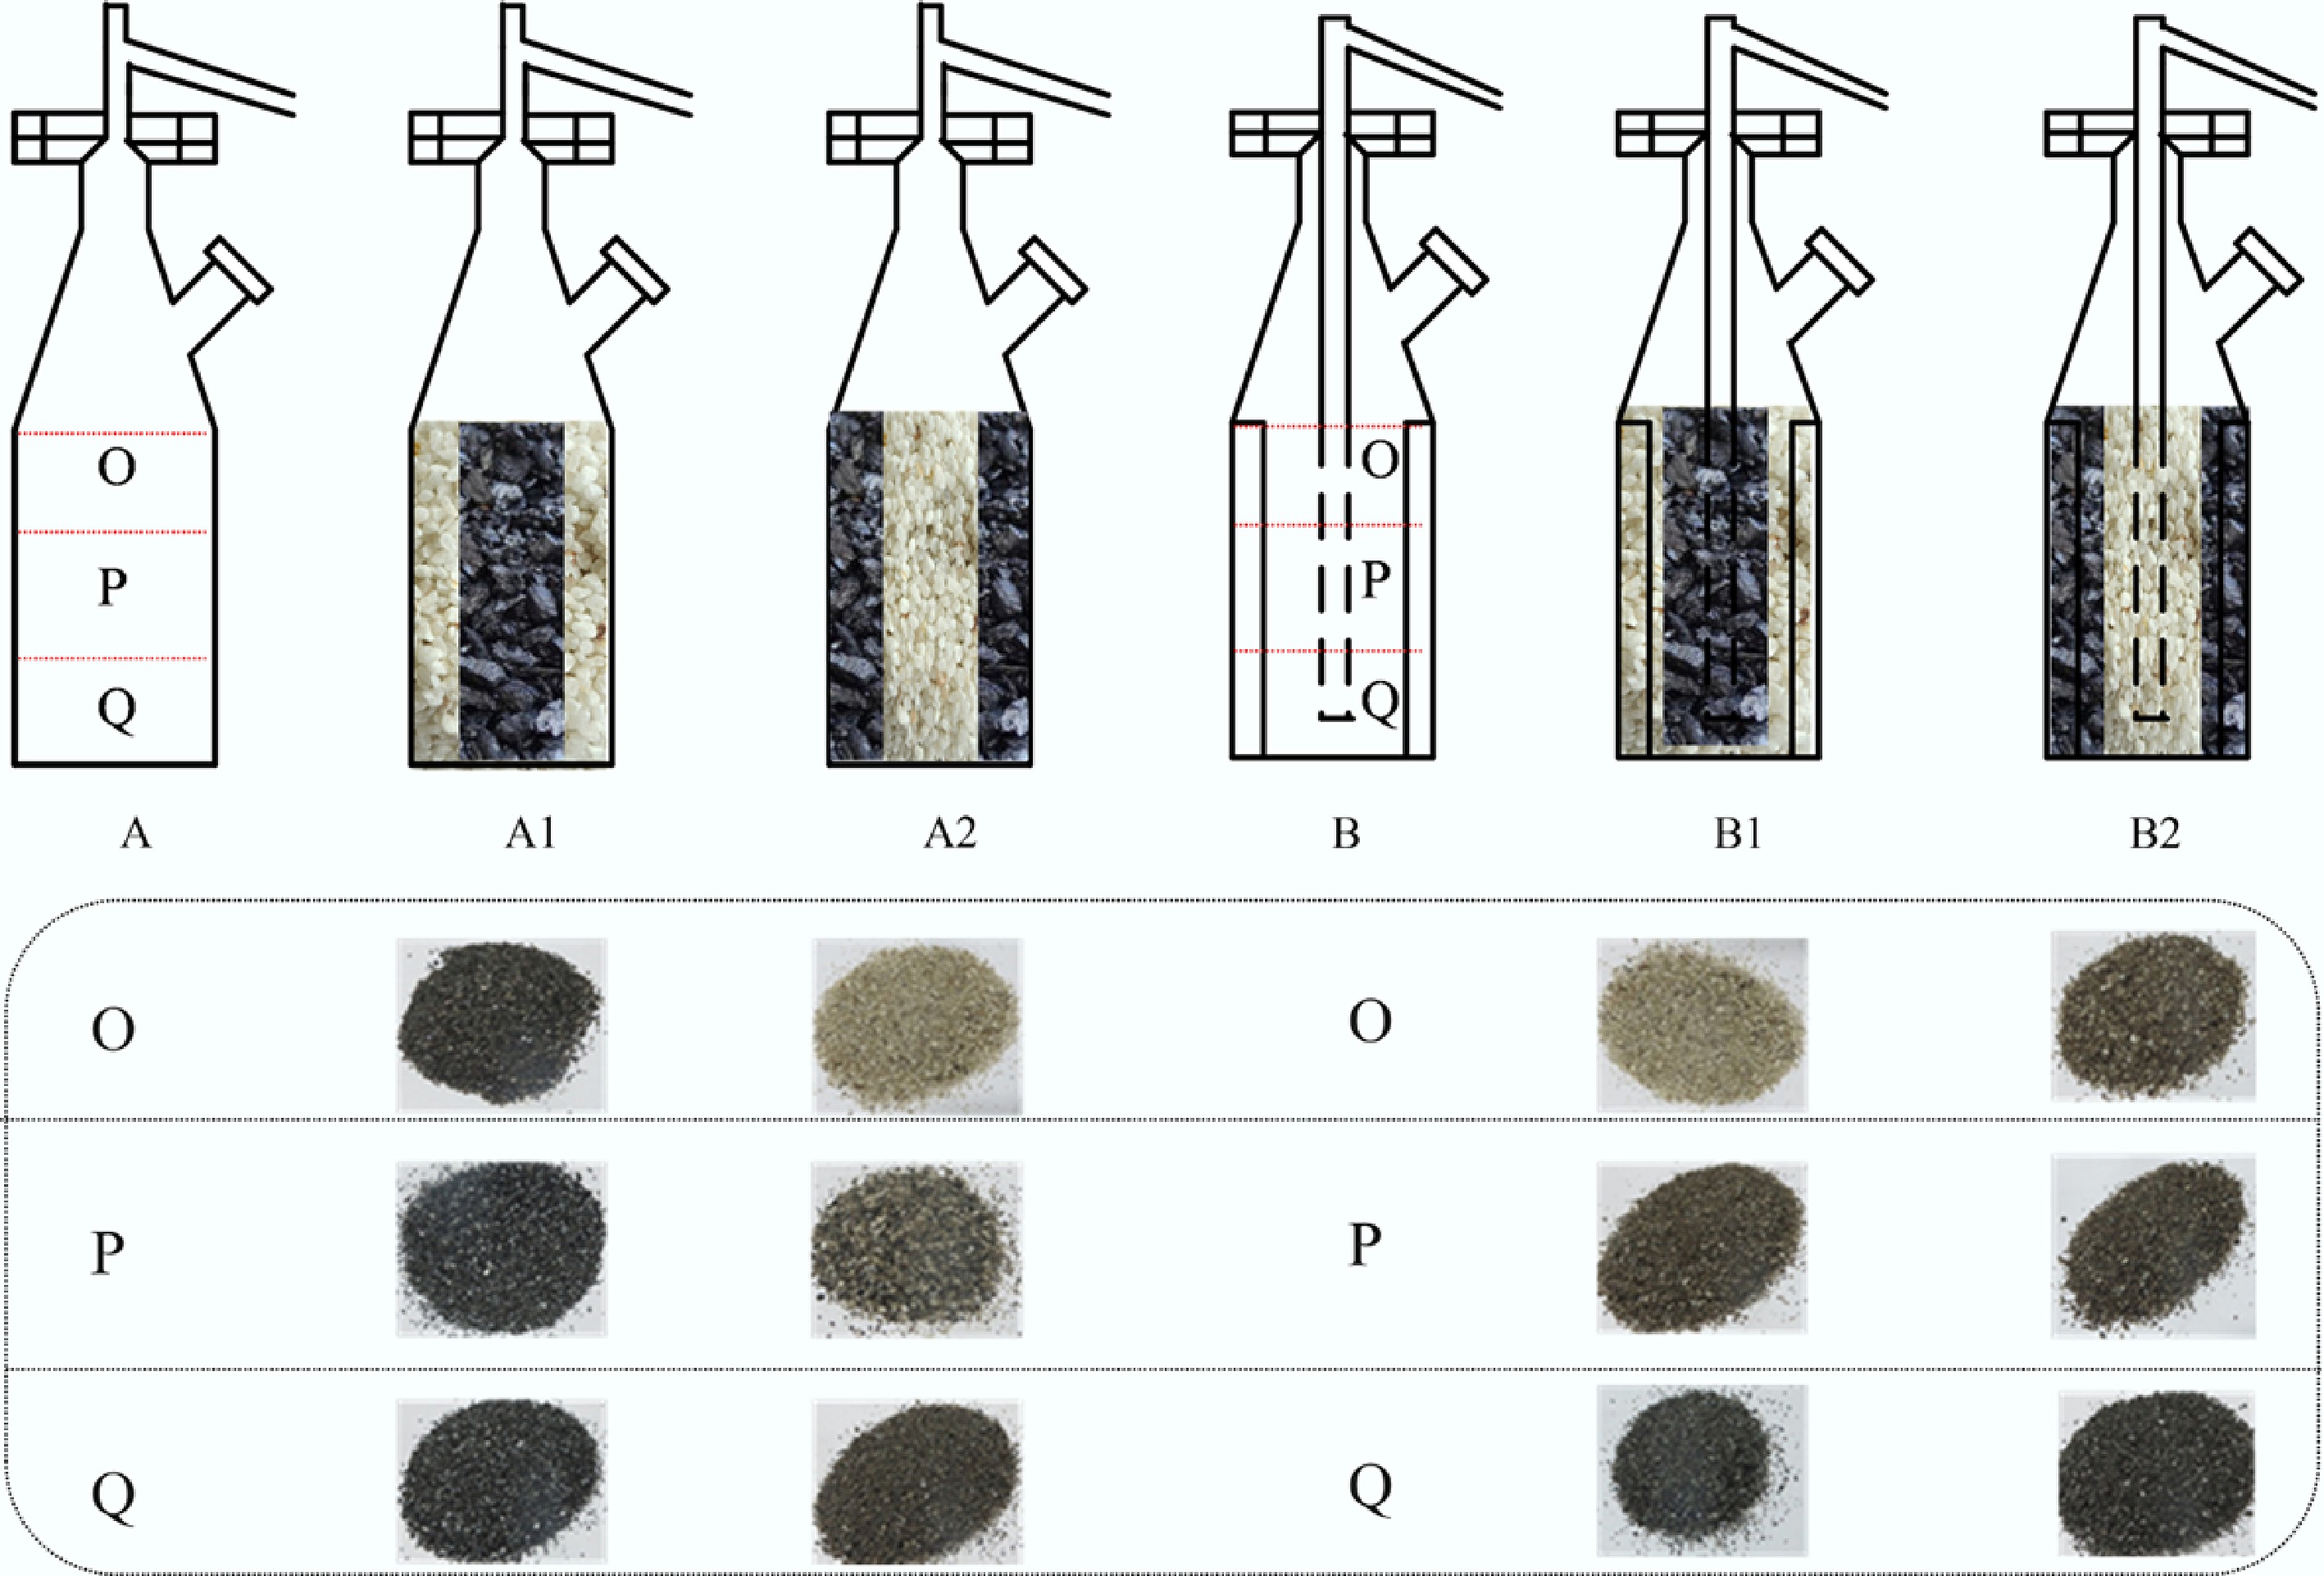
Figure 8.
Effects of tar vapor on quartz color at different axial positions.
Coal was described as an endless grid of clumps of merged aromatic rings linked by aliphatic bridge bonds. Main pyrolysis products such as monocyclic and polycyclic aromatics and aliphatic compounds were generated in the first pyrolysis stage, which is primarily attributed to the cracking of bridge bonds in the coal molecular structure, producing a large number of volatile species. Primary pyrolysis products further underwent different reactions in both reactors.
In the reactor without internals (reactor A), these primary products experienced serious secondary reactions due to the catalytic cracking effect of the high-temperature char bed. Specifically, the well-developed porous structure of the hot char provides a prolonged residence time and abundant active sites, while inherent alkali and alkaline earth metals (AAEMs) in the ash catalyze the dehydrogenation and cracking of primary heavy tar molecules. This environment was highly favorable for the formation of more heavy polycyclic aromatic hydrocarbons (PAHs), leading to a lower yield of total tar and light components. In contrast, the core low-temperature bed was condensed more in the reactor with internals (reactor B), trapping many primary products in the center. The internals, including heating plates and a central gas-gathering tube, enhance radial heat transfer and promote the redistribution of sensible heat carried by pyrolysis vapors, which is consistent with previous studies reporting modified temperature gradients in fixed-bed reactors equipped with internals[35]. The condensed volatiles were re-evaporated as the coal samples were gradually heated in the core low-temperature layer, and in turn, this suppressed the secondary reaction and raised the yield of tar and light components. In both reactors, these primary products underwent thermal decomposition and could subsequently undergo polycondensation and cross-linking reactions, evolving into stable char. It has been widely reported that secondary reactions of pyrolysis products have a remarkable effect on the formation of large PAH and char, and, therefore, a higher yield of char was formed in reactor A. To further validate these flow field effects and the subsequent impact on solid products at a larger scale, tests were conducted in a scale-up reactor with a diameter of 200 mm.
The proximate analysis of char located at A, B, and C in reactors with a diameter of 200 mm is depicted in Fig. 9. The volatile contents of char in both reactors gradually decreased in the following order: A > B > C, and in the reactor equipped with internals, the char at the same position contained more volatiles than in the reactor without internal components. Conversely, the ash content of char in both reactors increased in the following order: A < B < C, and the char presented a lower ash content in the reactor equipped with internal components. Both the pyrolysis reaction process and the direction of tar vapor had an impact on the volatile content of char. In the reactor without internals, the char experienced a deep pyrolysis reaction process and released many volatiles. The reactor with internals shows faster heat transfer and a different gas flow direction from the pyrolysis site to the central gas gathering tube, thus affecting the physicochemical properties of char at different positions. The tar stream in the reactor with internals flowed into the center, making the heavy tar components condense on the core lower-temperature char surface. Thus, the char in the reactor with internals presented a higher volatile content but a lower ash content, agreeing well with the color variation of quartz and macroscopic track study.
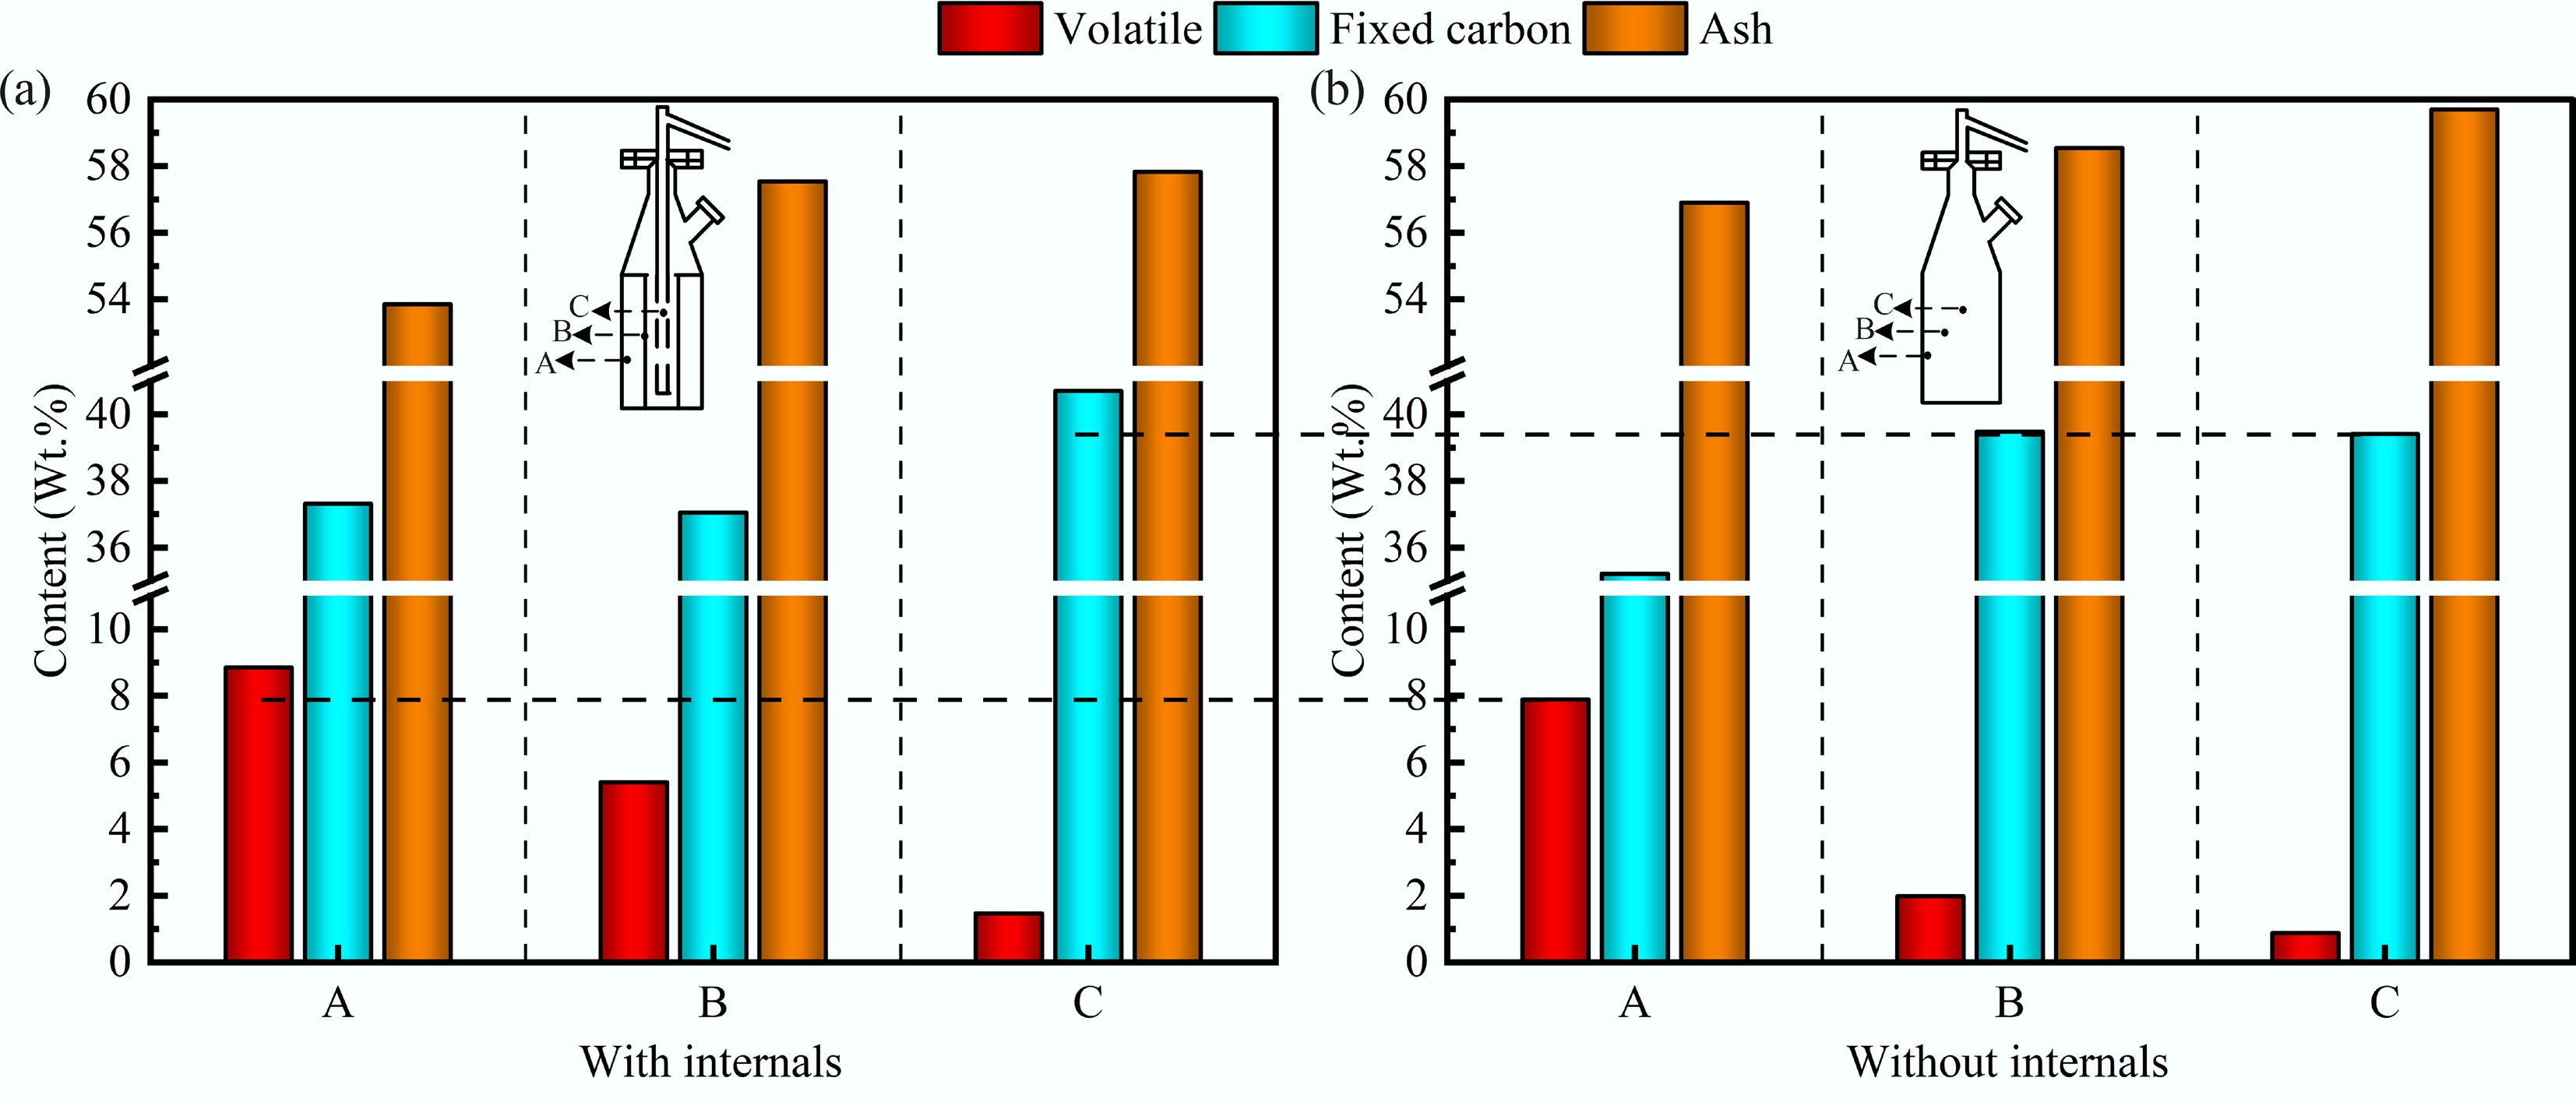
Figure 9.
Ultimate analysis of char in both reactors.
-
This study introduces an inert-particle tracing method to visually elucidate the active regulation of volatile flow patterns by internal baffles in a fixed-bed coal pyrolysis reactor. The results demonstrate that the baffles redirect volatiles from the hot wall region toward the cooler core, a controlled transport that effectively suppresses secondary cracking and promotes the condensation and mild recracking of heavy tar components in the low-temperature zone. Consequently, this strategy enhanced the total tar yield by approximately 8.5%, and significantly increased the light tar fraction to 74.42%. Simultaneously, flow-field restructuring improved the gas composition, reducing H2 content while increasing CH4 concentration, thereby raising the higher heating value of the pyrolysis gas by up to 15%. The distinct L-shaped deposition pattern observed on the quartz bed provided direct morphological evidence for this redirected volatile pathway. In summary, this work provides novel visual insights into mass and heat transfer within fixed-bed reactors and establishes reactor geometry design as an effective tool for steering pyrolysis product distribution, offering a promising approach for the valorization of low-rank coal.
The deepest gratitude goes to Qin Shijiang of the Analytical and Testing Center of Chongqing University.
-
Not applicable.
-
The authors confirm their contributions to the paper as follows: Yongfu Zeng: conceptualization, methodology, data curation, writing – original draft; Moshan Li: methodology, writing – review & editing; Erfeng Hu: supervision, writing – review & editing, funding acquisition; Youcai Ma: writing – review & editing; Fan Xu: investigation, data curation; Run Dong: investigation, data curation. All authors reviewed the results and approved the final version of the manuscript.
-
All data generated or analyzed during this study are included in this published article.
-
The authors gratefully acknowledge the financial support provided by the National Natural Science Foundation of China (22578038, 52104245), National Key R&D Program of China (2024ZD1004402), and Fundamental Research Funds of Chongqing City (Nos 2021XM3073, 2019LY41, and Z20240346).
-
The authors declare that they have no competing interests.
-
Full list of author information is available at the end of the article.
- Copyright: © 2026 by the author(s). Published by Maximum Academic Press, Fayetteville, GA. This article is an open access article distributed under Creative Commons Attribution License (CC BY 4.0), visit https://creativecommons.org/licenses/by/4.0/.
-
About this article
Cite this article
Zeng Y, Li M, Hu E, Ma Y, Xu F, et al. 2026. Inert particle tracking of flow fields for selective tar enhancement in a fixed-bed reactor with internals. Sustainable Carbon Materials 2: e024 doi: 10.48130/scm-0026-0019 

Inert particle tracking of flow fields for selective tar enhancement in a fixed-bed reactor with internals
- Received: 25 December 2025
- Revised: 12 March 2026
- Accepted: 12 April 2026
- Published online: 27 May 2026
Abstract: This study introduces an innovative inert particle tracking method to directly visualize and regulate volatile flow patterns within a fixed-bed coal pyrolysis reactor equipped with internal baffles. Unlike conventional studies focusing solely on product yields, we employed coal-quartz co-pyrolysis coupled with colorimetric analysis of quartz to map real-time volatile transport. Results demonstrated that internals redirected volatiles from the hot reactor wall toward the cooler core, significantly altering temperature profiles and reaction pathways. This controlled flow field suppressed secondary cracking and promoted condensation of heavy tar components in the low-temperature zone, thereby increasing total tar yield by approximately 8.5%, and enhancing light tar fraction content to 74.42%. Notably, the flow redirection also improved gas fuel quality by reducing H2 content and increasing CH4 proportion, raising the higher heating value (HHV) from 20.60 MJ/Nm3 (in the reactor without internals, A1) to 21.69 MJ/Nm3 (in the reactor with internals, B1). Kinetic analysis via TG-FTIR-GC/MS indicated dominant volatile release at ~500 °C, with activation energies ranging from 67–306 kJ/mol. This work provides a visually validated strategy for reactor design that selectively enhances tar yield and quality, offering a scalable pathway for efficient conversion of low-rank coal.
-
Key words:
- Coal pyrolysis /
- Internals /
- Flow field control /
- Volatile transport visualization /
- TG-FTIR-GC/MS