-
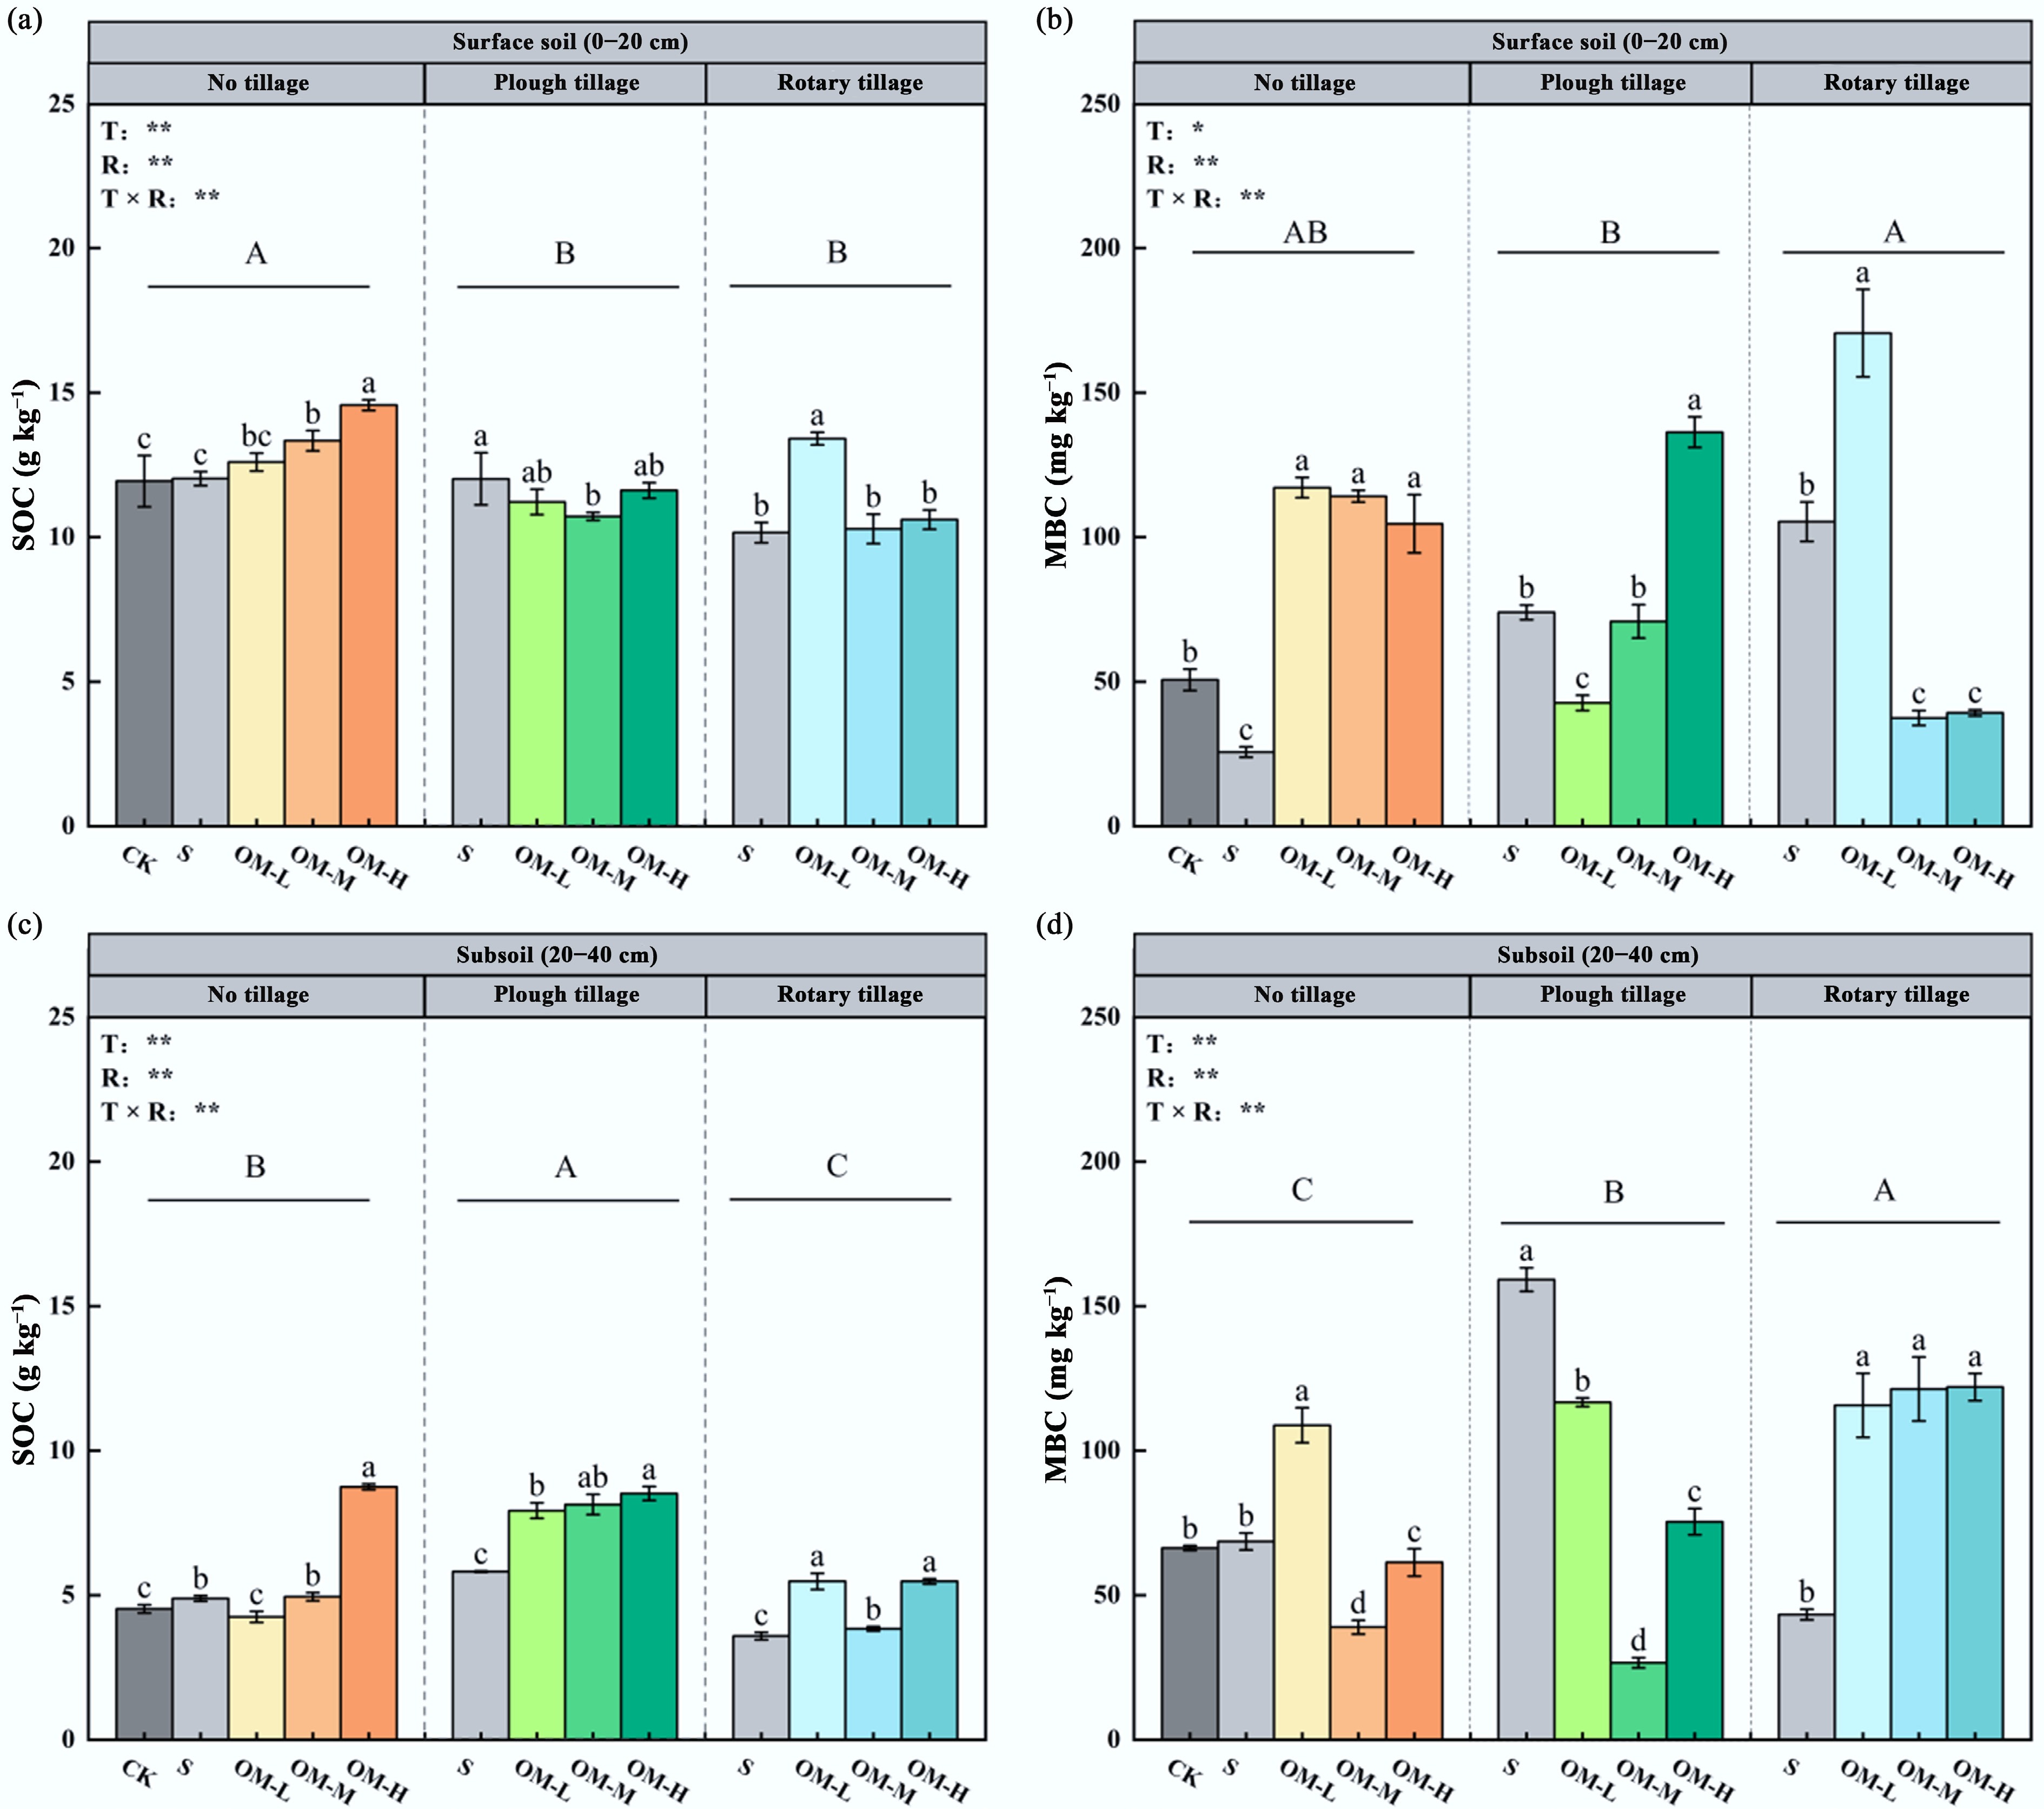
Figure 1.
Effects of different fertilizer inputs on SOC and MBC in the topsoil and subsoil, including (a) topsoil SOC content, (b) topsoil MBC content, (c) subsoil SOC content, and (d) subsoil MBC content. Different uppercase letters indicate significant differences among tillage methods, and lowercase letters show significant differences between treatments (p < 0.05). Error bars represent the standard deviation of three replicates (n = 3). *, ** represent p < 0.05, p < 0.01, respectively.
-
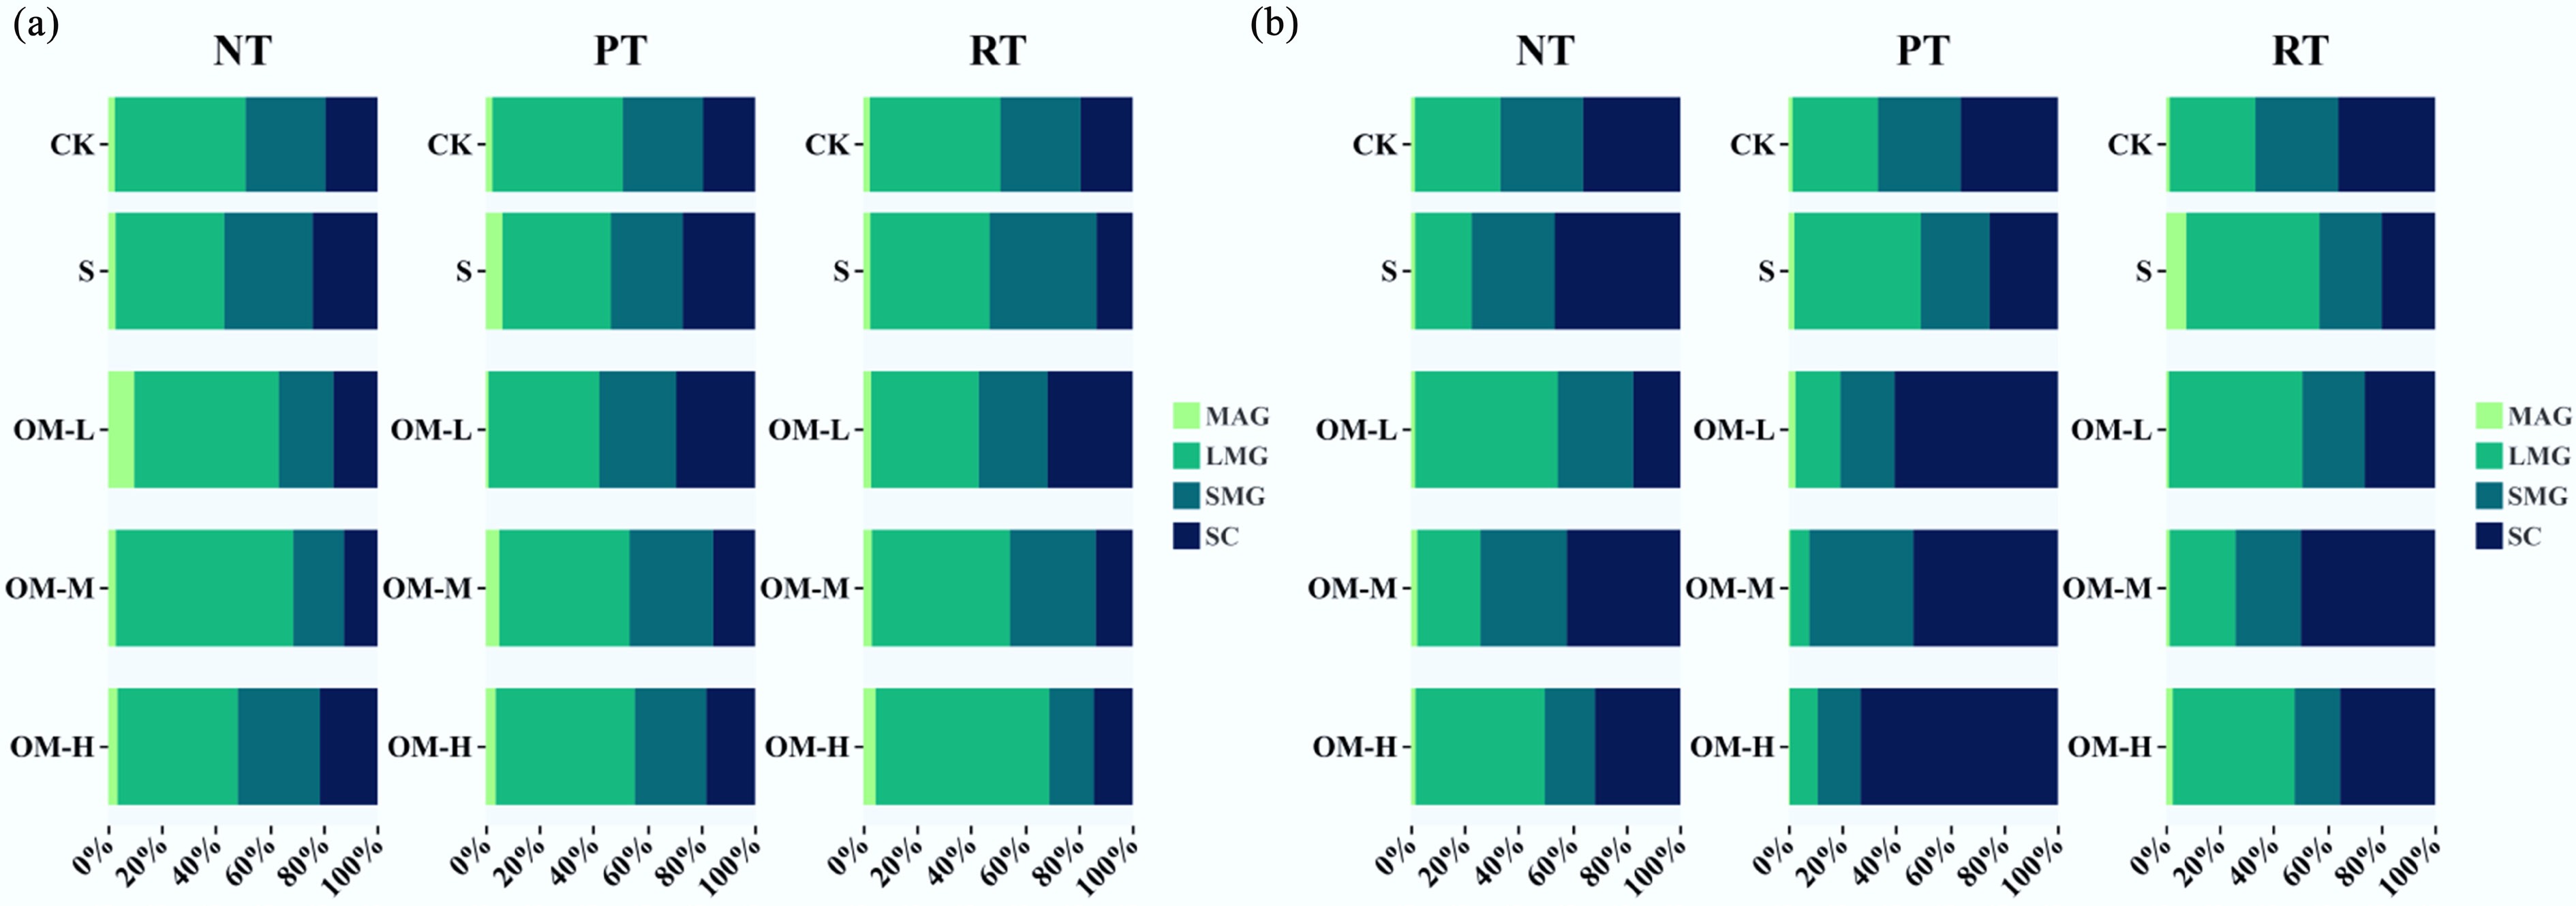
Figure 2.
Effects of different fertilizer inputs on aggregate-size distribution in the (a) topsoil, and (b) subsoil. MAG indicates large macroaggregates, LMG indicates small macroaggregates, SMG indicates microaggregates, and SC indicates silt-clay fractions. S indicates only straw return; OH-L indicates low fertilizer input; OH-M indicates medium fertilizer input; OH-H indicates high fertilizer input.
-
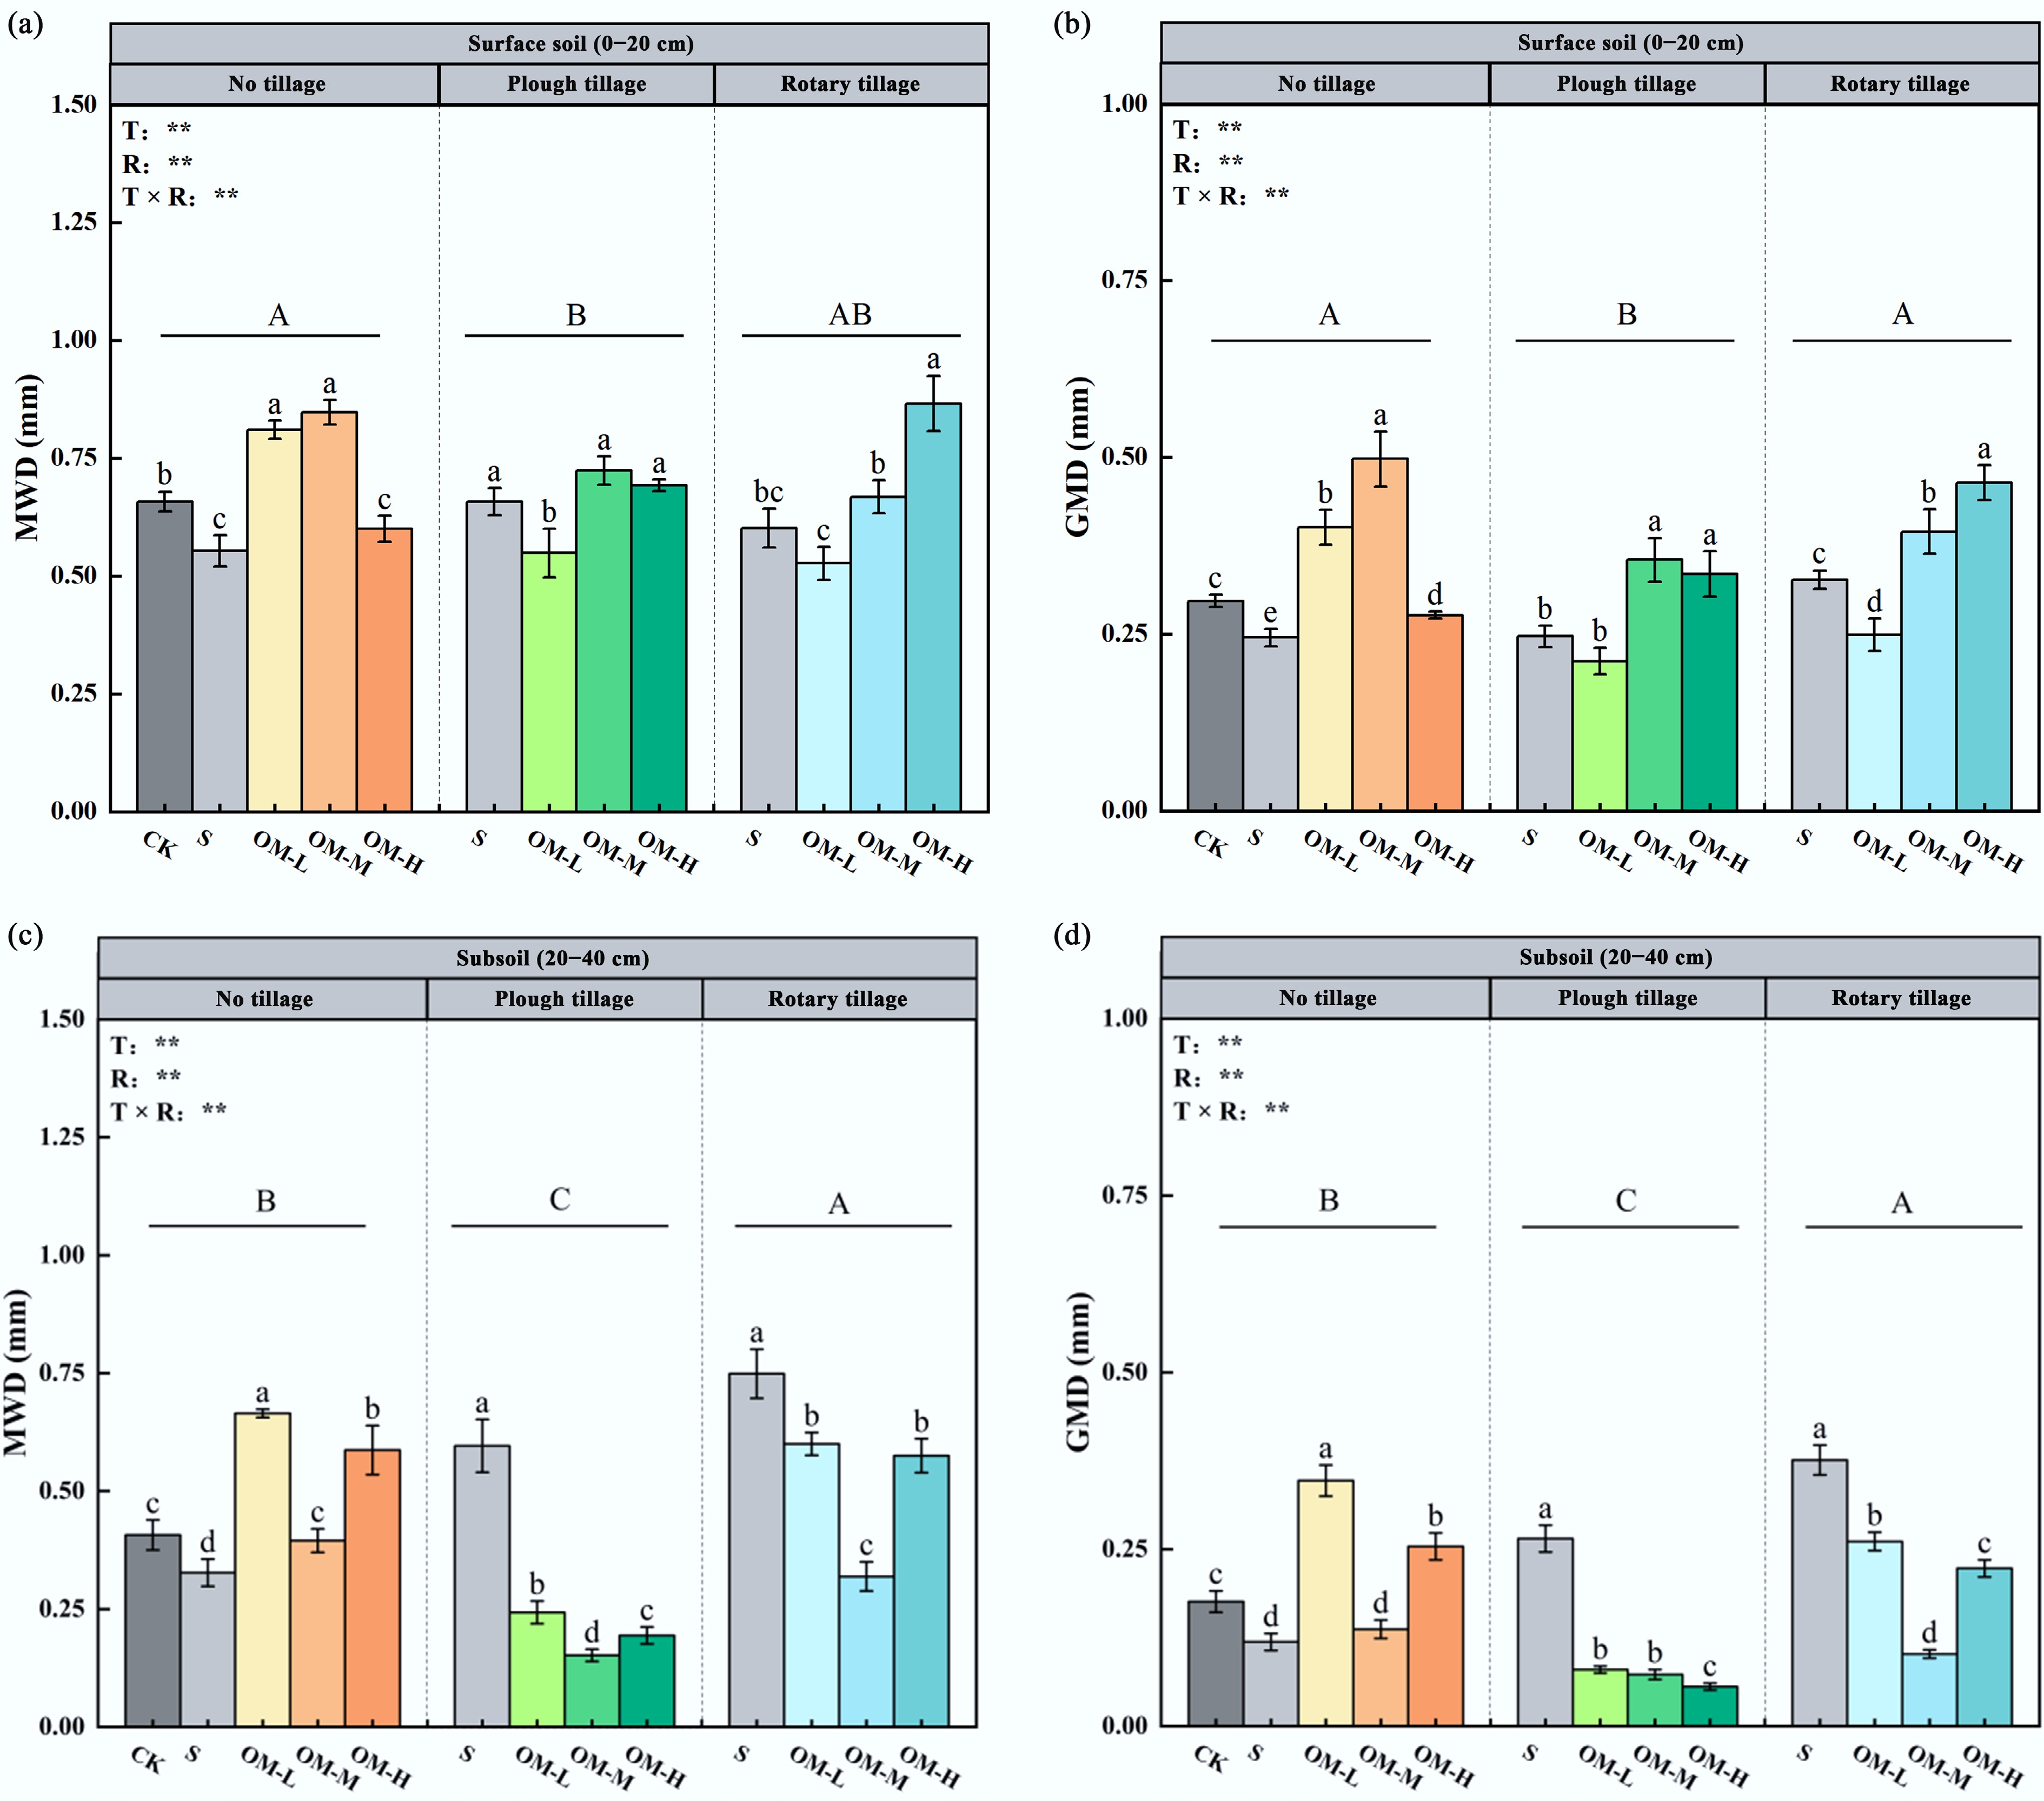
Figure 3.
Effects of different fertilizer inputs on soil aggregate stability, including (a) topsoil MWD, (b) topsoil GMD, (c) subsoil MWD, and (d) subsoil GMD. ** represents p < 0.01. Different lowercase letters show significant differences between treatments (p < 0.05). Different uppercase letters indicate the differences between tillage methods (p < 0.05). Error bars represent the standard deviation of three replicates (n = 3).
-
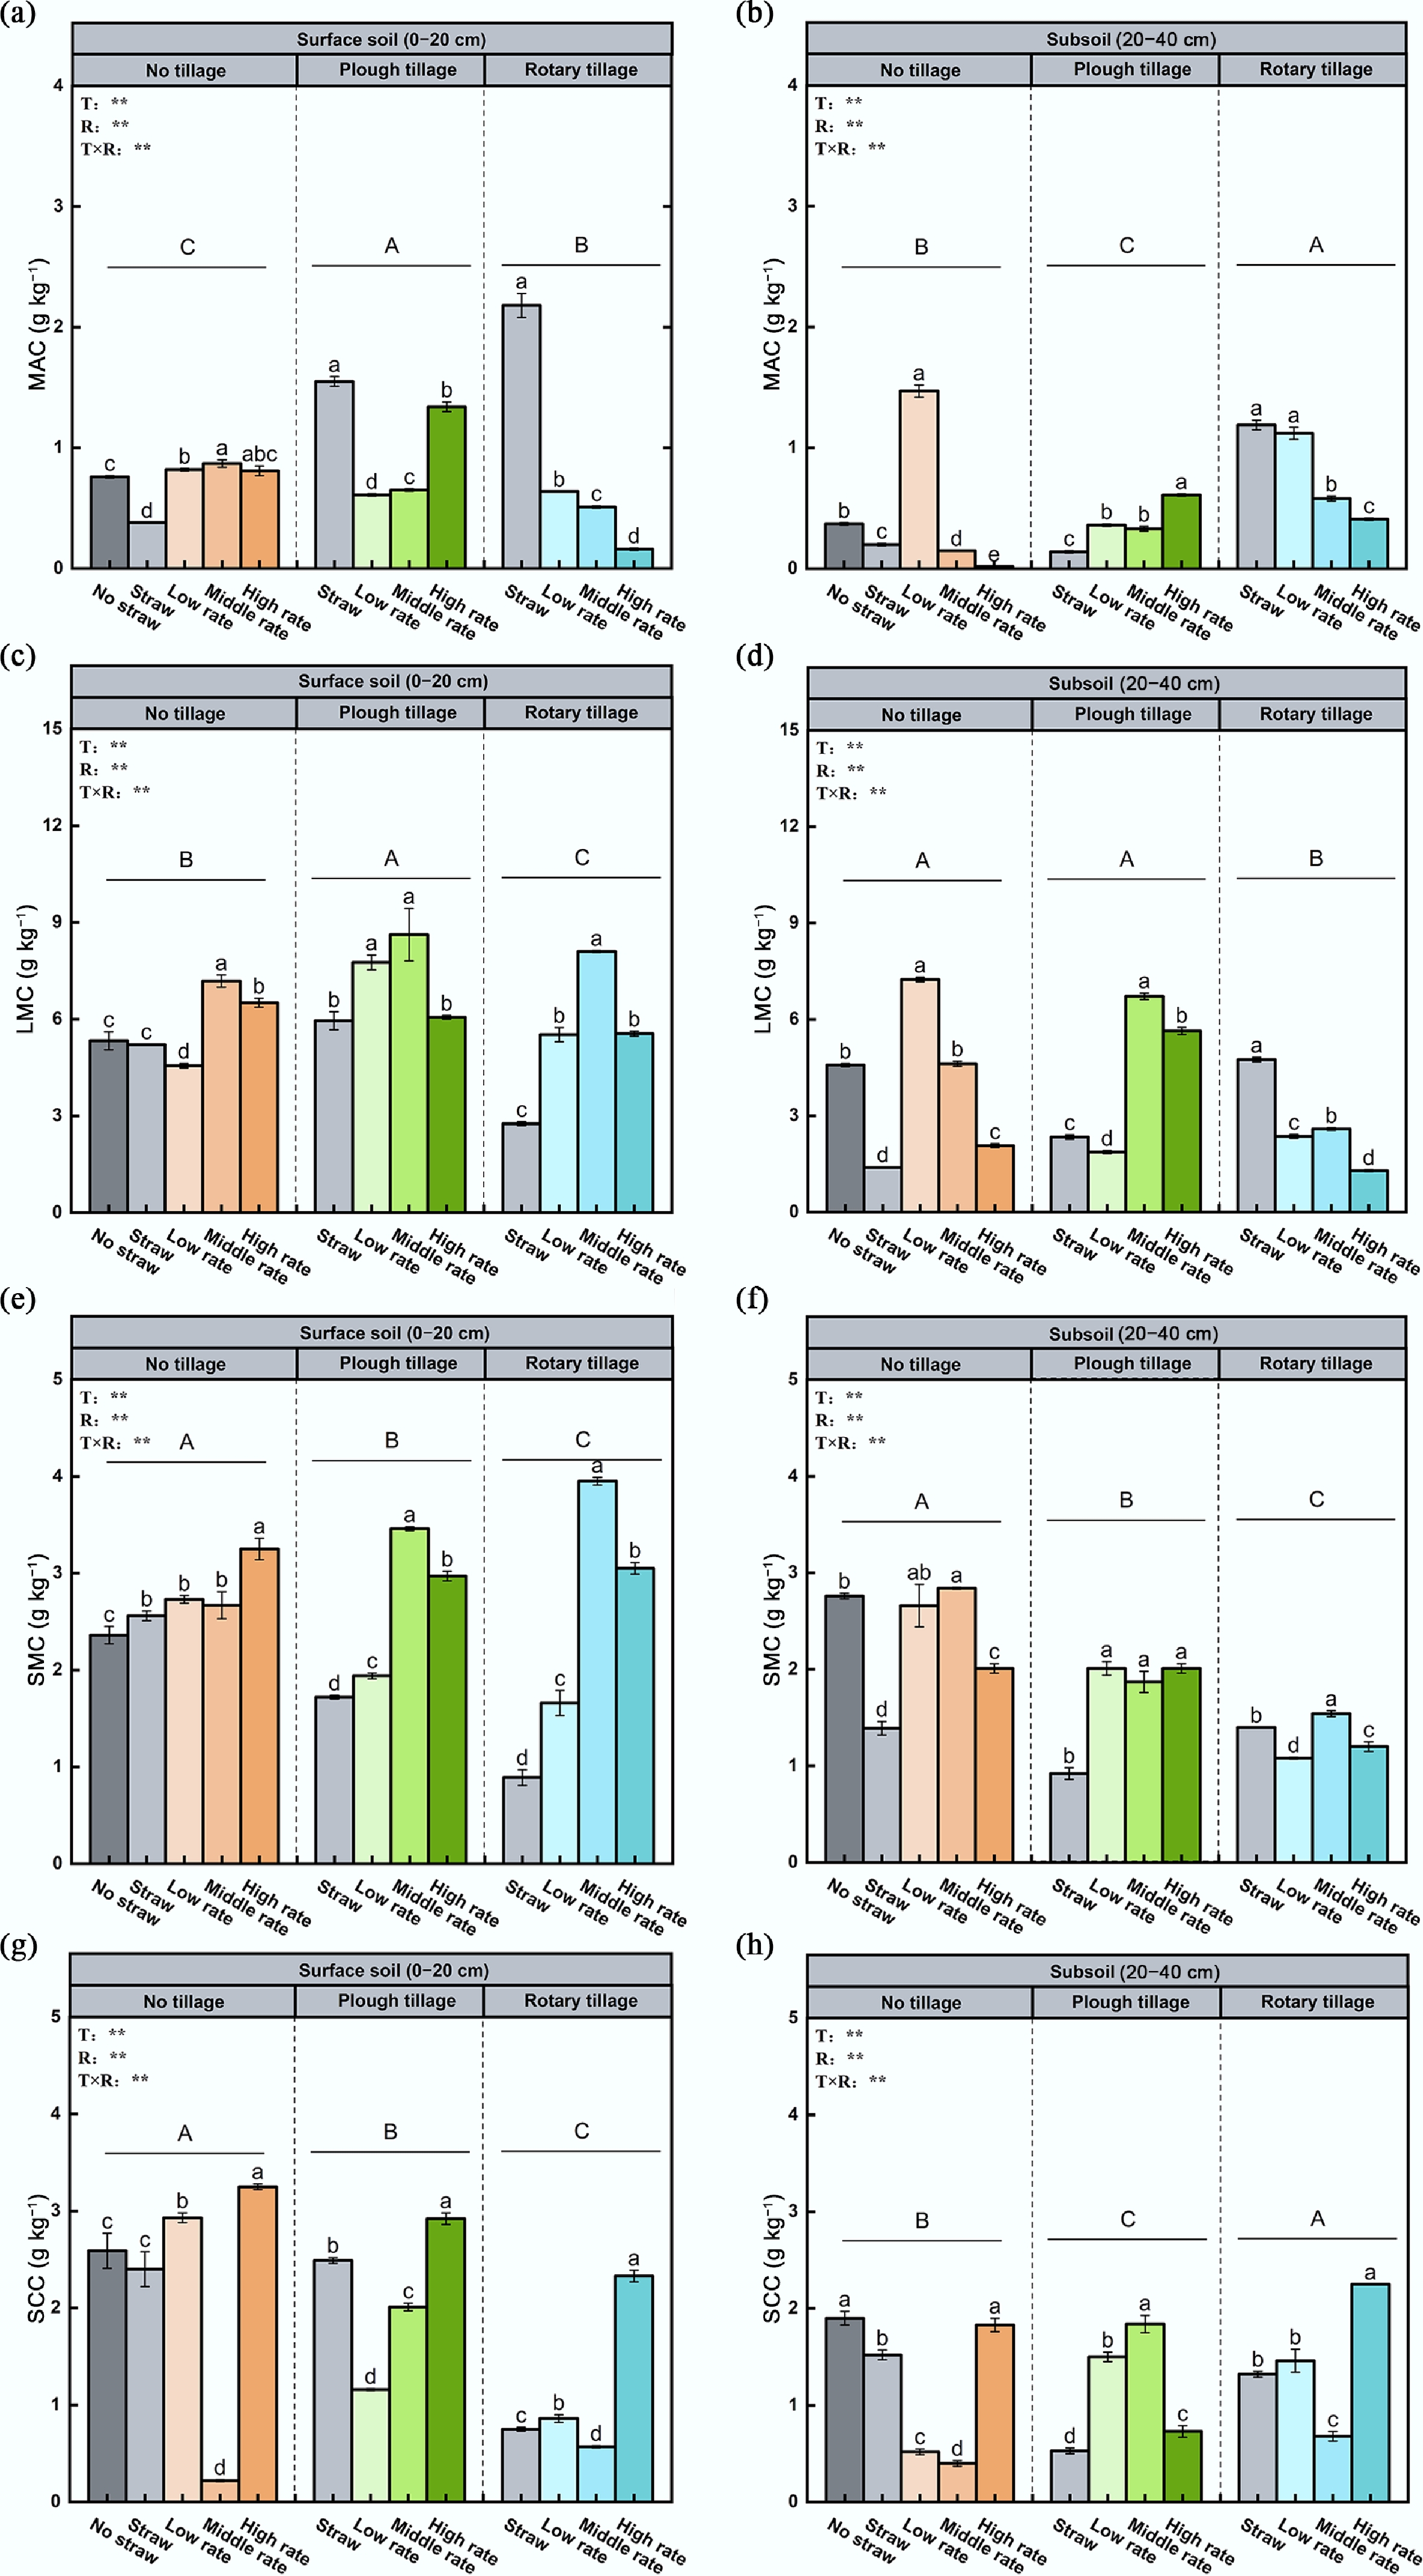
Figure 4.
Effects of different fertilizer inputs on aggregate-associated carbon in the (a), (c), (e), (g) topsoil, and (b), (d), (f), (h) subsoil. MAC indicates the carbon content in mega macroaggregates, LMC indicates the carbon content in large macroaggregates, SMC indicates the carbon content in small microaggregates, and SCC indicates carbon content in silt-clay fractions. Different lowercase letters show significant differences between treatments (p < 0.05). Different uppercase letters indicate the differences between tillage methods (p < 0.05). Error bars represent the standard deviation of three replicates (n = 3).
-
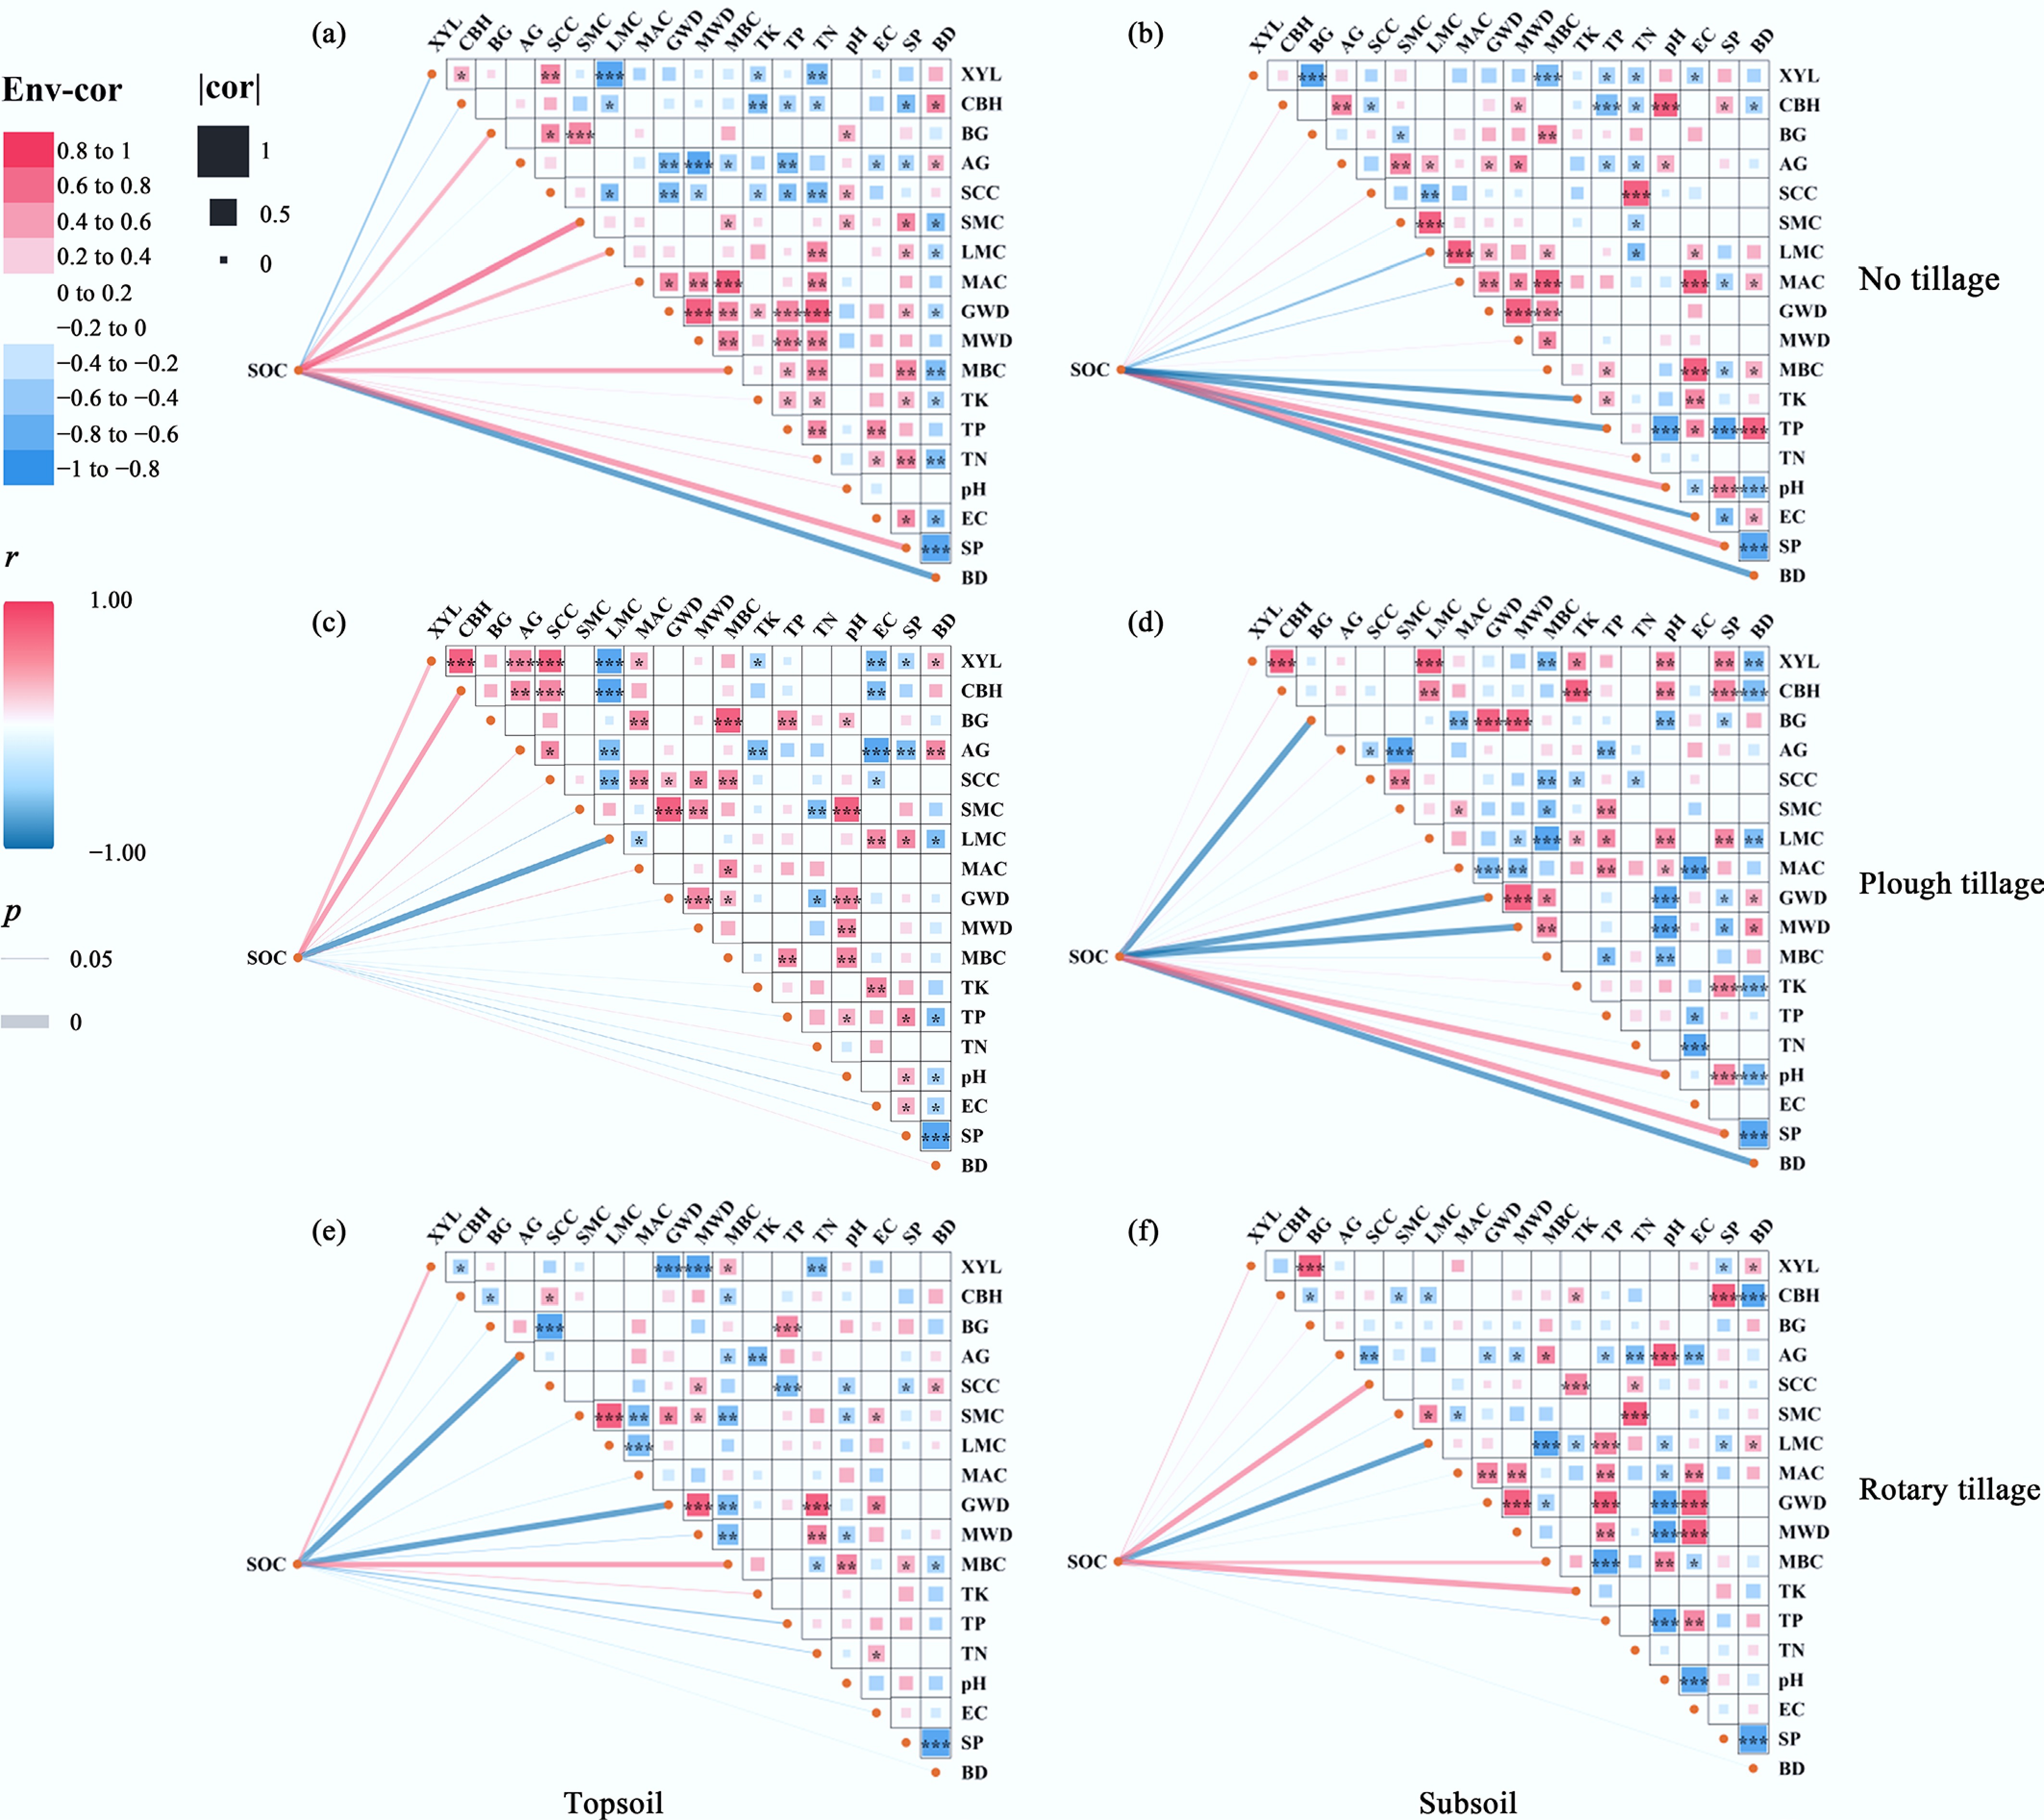
Figure 5.
Correlation network analysis of SOC in relation to tillage methods and microbial organic fertilizer application rates in the topsoil and subsoil. (a) and (b) represent NT topsoil and subsoil; (c) and (d) represent PT; (e) and (f) represent RT. The color scale ranges from −1 (blue, strong negative correlation) to +1 (red, strong positive correlation). Statistical significance is indicated by * (p < 0.05) , ** (p < 0.01), and *** (p < 0.001).
-
Soil layer
(cm)BD
(g cm−3)pH
(1:2.5)SOC TN TP TK Sand Silt Clay (g kg−1) (%) 0–20 1.4 5.4 11.1 0.83 1.04 12.5 37.3 44.2 18.5 20–40 1.6 5.8 4.9 0.86 0.7 12.9 37.1 41.0 21.9 Table 1.
Basic properties of the experimental soil
-
Layer (cm) Treatment BD (g cm−3) SP (%) EC (μS cm−1) pH TN TP TK (g kg−1) 0–20 NTN 1.48 ± 0.05a 44.03 ± 1.94c 93.67 ± 4.07c 5.43 ± 0.12b 0.70 ± 0.05c 0.96 ± 0.08b 12.57 ± 0.31c NTS 1.42 ± 0.01ab 46.29 ± 0.44bc 102.87 ± 2.00b 5.61 ± 0.10ab 0.61 ± 0.03d 1.09 ± 0.11ab 14.53 ± 1.10ab NTOM-L 1.36 ± 0.01bc 48.55 ± 0.44ab 104.40 ± 4.19ab 5.50 ± 0.22ab 0.86 ± 0.06b 1.25 ± 0.09a 13.77 ± 1.00bc NTOM-M 1.32 ± 0.02c 50.19 ± 0.65a 106.70 ± 0.95a 5.38 ± 0.08b 1.29 ± 0.02a 1.33 ± 0.03a 16.00 ± 1.30a NTOM-H 1.33 ± 0.05c 49.81 ± 1.96a 100.53 ± 0.70b 5.71 ± 0.03a 0.89 ± 0.04b 1.01 ± 0.06b 14.10 ± 0.98bc PTS 1.33 ± 0.07ab 49.81 ± 2.61ab 105.50 ± 1.15a 5.47 ± 0.08b 1.01 ± 0.02a 1.26 ± 0.03b 15.43 ± 0.76a PTOM-L 1.37 ± 0.07a 48.43 ± 2.73b 105.90 ± 0.92a 5.44 ± 0.07b 0.99 ± 0.06a 1.24 ± 0.03b 13.97 ± 0.32bc PTOM-M 1.24 ± 0.03b 53.33 ± 0.95a 106.10 ± 1.25a 6.43 ± 0.10a 0.73 ± 0.03c 1.26 ± 0.01b 14.67 ± 1.17ab PTOM-H 1.33 ± 0.04ab 49.81 ± 1.51ab 96.43 ± 4.25b 6.47 ± 0.02a 0.88 ± 0.03b 1.38 ± 0.03a 12.87 ± 0.15c RTS 1.27 ± 0.02ab 51.95 ± 0.87ab 96.87 ± 1.43b 5.84 ± 0.05a 0.77 ± 0.05bc 1.19 ± 0.01b 12.67 ± 0.61a RTOM-L 1.21 ± 0.07b 54.21 ± 2.46a 98.87 ± 7.34ab 5.82 ± 0.37a 0.69 ± 0.05c 1.10 ± 0.07c 14.43 ± 1.39a RTOM-M 1.35 ± 0.07a 48.93 ± 2.78b 104.17 ± 0.67ab 5.55 ± 0.04a 0.83 ± 0.06ab 1.30 ± 0.02a 12.70 ± 0.75a RTOM-H 1.31 ± 0.08ab 50.44 ± 3.16ab 105.60 ± 0.80a 5.47 ± 0.06a 0.87 ± 0.05a 1.09 ± 0.09c 13.53 ± 1.15a 20–40 NTN 1.62 ± 0.02a 38.96 ± 0.77b 83.77 ± 3.36c 5.44 ± 0.03a 0.96 ± 0.08a 0.76 ± 0.08a 13.80 ± 0.60cd NTS 1.59 ± 0.02a 40.07 ± 0.65b 91.00 ± 1.35b 5.51 ± 0.04a 0.95 ± 0.05a 0.71 ± 0.05a 15.67 ± 0.76a NTOM-L 1.61 ± 0.03a 39.09 ± 1.27b 102.37 ± 0.93a 5.57 ± 0.02a 0.72 ± 0.02b 0.68 ± 0.06a 15.27 ± 0.71ab NTOM-M 1.55 ± 0.02b 41.69 ± 0.85a 79.87 ± 4.51cd 5.75 ± 0.09a 0.60 ± 0.02c 0.40 ± 0.00b 14.30 ± 0.53bc NTOM-H 1.53 ± 0.02b 42.45 ± 0.57a 77.13 ± 2.55d 5.84 ± 0.03a 0.98 ± 0.03a 0.36 ± 0.02c 12.90 ± 0.44d PTS 1.57 ± 0.01a 40.60 ± 0.46b 98.30 ± 0.87b 5.29 ± 0.03b 0.95 ± 0.07b 0.54 ± 0.03c 15.13 ± 0.59b PTOM-L 1.59 ± 0.04a 40.10 ± 1.33b 90.27 ± 3.99c 5.65 ± 0.32a 0.86 ± 0.08b 0.57 ± 0.05bc 12.97 ± 0.57c PTOM-M 1.47 ± 0.03b 44.37 ± 0.94a 102.27 ± 0.47a 6.14 ± 0.02a 0.62 ± 0.05c 0.65 ± 0.03b 15.20 ± 0.53b PTOM-H 1.47 ± 0.03b 44.52 ± 1.00a 65.23 ± 3.02d 6.02 ± 0.05b 1.19 ± 0.11a 0.75 ± 0.03a 17.17 ± 0.60a RTS 1.60 ± 0.03ab 39.74 ± 0.95ab 103.27 ± 0.46a 5.10 ± 0.02c 0.51 ± 0.04a 1.26 ± 0.05a 12.60 ± 0.79b RTOM-L 1.62 ± 0.02a 38.74 ± 0.58c 94.67 ± 0.81b 5.41 ± 0.02bc 0.51 ± 0.05a 0.67 ± 0.04b 13.53 ± 0.25b RTOM-M 1.57 ± 0.02b 40.71 ± 0.92b 65.97 ± 3.03d 6.00 ± 0.18a 0.40 ± 0.03b 0.40 ± 0.00c 12.60 ± 0.79b RTOM-H 1.53 ± 0.02c 42.43 ± 0.72a 86.63 ± 6.74c 5.60 ± 0.16ab 0.56 ± 0.02a 0.43 ± 0.03c 16.27 ± 0.50a ANOVA
(0–20)T ** ** * ** ** ** ** R ** ** ** ** ** ** ** T × R ns ns ** ** ** ** ** ANOVA
(20–40)T ** ** * ** ** ** ** R ** ** ** ** ** ** ** T × R ns ns ** ** ** ** ** Different letters in the same column indicate significant differences between treatments at p < 0.05 according to Duncan's multiple range test. Values are means ± the standard error (n = 3). *, ** represent p < 0.05, p < 0.01, respectively, and 'ns' represents p > 0.05. T represents tillage methods (main plot), R represents organic input rate level (subplot), and T × R represents the interaction. Table 2.
Effect of different fertilizer inputs on soil physicochemical properties
-
Layer (cm) Treatment AG BG CBH XYL (μmol d−1 g−1) 0–20 NTN 22.88 ± 0.48a 22.80 ± 1.10c 2.03 ± 0.09ab 47.58 ± 3.48b NTS 22.04 ± 0.68a 25.92 ± 0.63b 1.69 ± 0.22ab 50.90 ± 2.80b NTOM-L 16.77 ± 0.60c 36.32 ± 3.60a 1.82 ± 0.29ab 58.15 ± 3.42a NTOM-M 17.93 ± 0.34b 22.96 ± 1.11c 1.46 ± 0.11b 26.24 ± 4.13d NTOM-H 22.61 ± 3.26a 40.40 ± 4.02a 1.58 ± 0.10a 38.18 ± 0.72c PTS 19.70 ± 0.68b 30.40 ± 2.01b 1.83 ± 0.02ab 42.71 ± 1.13a PTOM-L 19.45 ± 0.30b 26.08 ± 2.57bc 1.49 ± 0.12ab 29.44 ± 3.54b PTOM-M 19.19 ± 0.60b 25.44 ± 2.29c 1.44 ± 0.02b 27.72 ± 4.49b PTOM-H 21.83 ± 1.00a 41.36 ± 4.02a 1.98 ± 0.23a 47.18 ± 2.10a RTS 31.58 ± 3.83a 44.96 ± 4.43ab 1.89 ± 0.11ab 42.89 ± 0.77a RTOM-L 10.40 ± 0.45c 38.16 ± 3.74b 1.78 ± 0.13ab 52.89 ± 2.84a RTOM-M 30.25 ± 1.98a 44.32 ± 1.60a 1.90 ± 0.10b 45.52 ± 1.57a RTOM-H 19.66 ± 0.73b 28.40 ± 2.77c 2.00 ± 0.12a 30.63 ± 2.34a 20–40 NTN 12.69 ± 0.66b 29.44 ± 2.04b 1.20 ± 0.08d 32.74 ± 2.55b NTS 7.37 ± 0.59c 37.36 ± 3.61a 1.43 ± 0.14c 29.19 ± 2.71b NTOM-L 15.96 ± 0.70a 38.48 ± 3.81a 2.07 ± 0.13b 23.62 ± 1.22c NTOM-M 16.76 ± 0.57a 23.52 ± 2.29c 2.28 ± 0.31ab 58.15 ± 3.42a NTOM-H 15.53 ± 0.52a 36.80 ± 2.98a 2.28 ± 0.06a 32.52 ± 4.08b PTS 21.77 ± 0.55a 30.00 ± 2.95a 1.40 ± 0.08b 31.53 ± 2.91b PTOM-L 16.88 ± 0.69c 21.20 ± 2.01b 1.00 ± 0.12c 25.32 ± 3.64b PTOM-M 19.69 ± 0.40b 23.68 ± 1.56b 1.78 ± 0.10a 45.52 ± 3.79a PTOM-H 17.13 ± 0.52c 20.08 ± 1.74b 1.98 ± 0.22a 42.31 ± 3.39a RTS 13.88 ± 0.28c 25.20 ± 2.44c 1.48 ± 0.03b 28.18 ± 2.72b RTOM-L 14.57 ± 0.43c 40.96 ± 4.09a 1.31 ± 0.07c 44.41 ± 2.88a RTOM-M 19.92 ± 0.63a 33.44 ± 3.24b 1.44 ± 0.13bc 27.42 ± 2.98b RTOM-H 15.50 ± 0.43b 25.52 ± 2.43c 1.78 ± 0.02a 27.09 ± 2.91b ANOVA (0–20) T ** ** ** ** R ** ** ** ** T × R ** ** ** ** ANOVA (20–40) T ** ** ** ** R ** ** ** ** T × R ** ** ** ** AG, BG, CBH, and XYL indicate the activities of α-glucosidase, β-glucosidase, cellobiohydrolase, and endo-1,4-β-xylanase, respectively. Different lowercase letters show significant differences between treatments (p < 0.05). ** represent p < 0.01, respectively. Table 3.
Effect of tillage methods and microbial organic fertilizer inputs on soil enzyme activities
Figures
(5)
Tables
(3)