


-
Soil organic carbon (SOC) stabilization is a key pathway for mitigating climate change, as it enhances soil fertility and promotes soil improvement methods[1−3]. As a vital component of soil, SOC performs multiple functions: regulating soil structure, facilitating nutrient cycling, enhancing water retention capacity, and ultimately increasing soil productivity. However, significant variations exist in carbon storage potential across different soil types (e.g., albic soils ≈ 9.2 g SOC kg−1, ~ 35% below national mean; China Soil Survey, 2020), primarily due to their inherent physicochemical properties. Albic soils exhibit severely impaired aerobic decomposition of organic matter due to their compact structure and restricted aeration. This physiological constraint substantially reduces the rate of soil organic carbon accumulation. According to the China Soil Survey, 2020 (Bulletin No. 2020-05) and Lu et al.[4], albic soil covers 26.7 million hm2, accounting for 14.6% of the province's total soil area. Cultivated land of this soil type spans 50.3 hm2, representing 9.4% of the province's total cultivated land area. Albic soil is the third dominant soil type in the region, highlighting its significance in regional soil composition. Consequently, there is an urgent need to develop and implement specialized management strategies specifically tailored to enhance carbon concentration efficiency in albic soils.
Intensive tillage and chemical fertilization often accelerate SOC mineralization and disrupt soil aggregates, thereby reducing long-term carbon storage[5,6]. In contrast, conservation tillage methods, such as no tillage practice, minimize soil disturbance, preserve soil moisture, and promote the formation of macro-aggregates (> 0.25 mm)[5]. These macro-aggregates physically protect organic matter from microbial decomposition, significantly lowering SOC mineralization rates. Deep plough tillage has the potential to significantly disrupt the existing soil structure. This disruption can exert adverse effects on the soil environment. In the short term, it may accelerate the decomposition of organic carbon[7]. However, when deep plough tillage is combined with straw mulching, it can bring about positive changes in certain soil types. In albic soils, this combination can effectively break through the plow pan. The plow pan is a compacted layer that restricts root growth and water movement[8]. By breaking it, the combination improves soil aeration, which is beneficial for soil organisms and plant roots[9]. Nevertheless, when applying this combined approach, it is necessary to add organic materials. This is because the process may raise the risk of increased mineralization. The addition of organic materials helps to balance this risk and maintain a favorable carbon balance in the soil[10]. Rotary tillage can lead to a short-term increase in soil carbon content, particularly when crop residues are returned to the field[11]. However, prolonged application of rotary tillage tends to accelerate the mineralization and decomposition of soil organic carbon[12]. This is especially detrimental to the stability of deep soil aggregates, which are crucial for maintaining overall soil structure and carbon concentration capacity. Furthermore, the repeated use of rotary tillage contributes to the formation of shallow plow layers and the development of a plow pan. These changes restrict root penetration and water movement, ultimately inhibiting the long-term accumulation and concentration of soil carbon.
Microbial fertilizers, comprising Bacillus subtilis, Bacillus amyloliquefaciens, and Trichoderma harzianum Rifai, critically regulate microbial metabolic processes that drive SOC concentration[13−18]. For instance, the combined application of conservation tillage (no-tillage) and microbial fertilizers elevates key enzyme activities[19], such as β-glucosidase (by 63.1%) and polyphenol oxidase, which facilitate lignin-mineral binding and promote the formation of stable organic carbon complexes. This synergy also optimizes microbial carbon-nitrogen stoichiometry. By reducing the β-glucosidase/peroxidase (BG/PER) ratio, the Combined Microbial and Straw (CMS) treatment alleviates microbial C–N imbalance, thereby suppressing co-metabolic mineralization of SOC. Long-term field investigations provide compelling evidence supporting the effectiveness of these integrated agricultural methods. Specifically, in albic soils, the application of CMS treatments significantly elevated Soil Organic Carbon (SOC) levels to 17.0 g kg−1. This represents a substantial 28.3% increase relative to the conventional fertilization method (chemical fertilizer only, without straw mulching), and enhanced the proportion of carbon stored in macro-aggregate-pathway carbon physical (aggregate protection) and biological (microbial metabolic modulation) pathways to stabilize SOC. Nevertheless, the persistence of these benefits over decadal scales remains underexplored, highlighting a key research gap. The specificity of albic soils demands tailored solutions. Their low porosity and high acidity inhibit organic matter decomposition and microbial activity. Strategies such as deep plough tillage can mitigate compaction by breaking up hardened subsoil layers, while humus-enriched microbial fertilizers enhance carbon fixation under acidic conditions. Additionally, lignin-degrading microbial inoculants paired with no-tillage methods show potential for enhancing SOC accumulation by leveraging the protective role of aggregates.
The synergistic integration of tillage and microbial fertilizers presents a transformative short-term management strategy to enhance soil organic carbon concentration in albic soils. This approach simultaneously addresses physical constraints (through the improvement of soil aggregation and structure) and biological limitations (via the regulation of microbial metabolic regulation), thereby enhancing soil health and contributing to climate change mitigation. Previous studies have rarely compared the effects of three different tillage intensities combined with microbial fertilizer application on improving the carbon concentration capacity of albic cultivated soils. We hypothesize that high microbial fertilizer inputs with no-tillage maximizes macro-aggregate-protected SOC, whereas plough tillage with the same rate increases subsoil C but intensifies mineralization. Therefore, the objectives of this study were as follows: (1) to systematically investigate the changes in SOC concentration under the synergistic effects of different tillage practices and microbial organic fertilizer application rates; (2) to provide a feasible and preliminary short-term verification scheme for improving the carbon concentration potential of albic soils through controlled field experiments.
-
A field experiment was established in the autumn of 2023 in Sanliang Village, Shulan City, Jilin Province, China (44°31' N, 126°42' E). The experiment area has a temperate continental monsoon climate, with four distinct seasons and concurrent rain and heat. During the maize growing season, the precipitation was 628.4 mm, and the mean air temperature was 17.1 °C. The annual mean effective accumulated temperature was 2,700 °C, and the frost-free period was 140 d. The tested soil is albic soil (Chinese Soil Taxonomy [2001]). The basic physicochemical properties are presented in Table 1.
Table 1. Basic properties of the experimental soil
Soil layer
(cm)BD
(g cm−3)pH
(1:2.5)SOC TN TP TK Sand Silt Clay (g kg−1) (%) 0–20 1.4 5.4 11.1 0.83 1.04 12.5 37.3 44.2 18.5 20–40 1.6 5.8 4.9 0.86 0.7 12.9 37.1 41.0 21.9 Tillage and fertilization practice
-
A two-factor split-plot design was employed, with tillage methods assigned to the main plots and organic input rate level to the subplots, resulting in 13 treatments. Each subplot comprised six rows with a 0.65 m row spacing (3.9 m × 24 m). Maize (Zea mays L.) cultivar 'Fumin 985' was planted at a density of 72,000 plants ha−1, sown in early May, and harvested in early October.
Except for the control, all treatments received organic inputs annually after maize harvest, with crop stubble retained. Under no-tillage, straw and organic inputs were left on the soil surface as mulch. Under plough tillage and rotary tillage, straw and organic inputs were mechanically incorporated into the tilled layer to depths of 0–40 cm and 0–15 cm, respectively. The bio-organic fertilizer was a uniform granular product manufactured from fully composted livestock and poultry manure and inoculated with soil-derived strains of Bacillus subtilis, B. amyloliquefaciens, and Trichoderma harzianum, with viable counts ≥ 0.5 × 10⁸ CFU g−1, meeting the maturity standards for use as organic fertilizer in China (NY/T 525-2021). The bio-organic fertilizer contained 423.0 g kg−1 SOC, 38.3 g kg−1 N, 3.1 g kg−1 P2O5, and 8.5 g kg−1 K2O. Mineral fertilizers were applied at sowing at rates equivalent to 156 kg N ha−1, 75 kg P2O5 ha−1, and 72 kg K2O ha−1. Field management during the crop-growing season followed the local conventional high-yield cultivation practices.
Soil sampling and measurements
-
In October 2024, after maize harvest, soil samples were collected at two depths (0–20 and 20–40 cm). For each plot and depth, five soil cores were taken from evenly distributed positions across the plot (avoiding plot borders by ~ 0.5 m) and composited. Visible stones and plant residues (including roots and stubble fragments) were removed manually in the field, and any remaining coarse debris was further picked out in the laboratory prior to processing. The composite sample was homogenized and split into two subsamples: one subsample was gently passed through an 8-mm sieve for soil aggregate fractionation. The other subsample was air-dried at room temperature under ventilation and then sequentially sieved through 2-, 1-, and 0.25-mm meshes for the determination of soil physicochemical properties. In addition, intact soil cores were collected using a stainless-steel cutting ring (100 cm3) to determine soil bulk density and porosity.
Soil physicochemical analyses
-
Soil bulk density (BD) was measured by the core method of using a ring knife (volume 100 cm3). Soil porosity (SP) was determined as follows:
$ \mathrm{Soil}~\mathrm{porosity}~(\mathrm{SP})(\text{%})=\left[1-\frac{\mathrm{Soil}~\mathrm{bulk}~\text{density}\ (\mathrm{g}\; \text{cm}^{-3})}{\mathrm{Soil}~\mathrm{particle}~\text{density}\ (\mathrm{g}\; \text{cm}^{-3})}\right]\times100 $ (1) The soil particle density is commonly adopted with a standard value of 2.65 g cm−3.
Soil pH was measured by using a pH meter (PB-10, Sartorius, Goettingen, Germany) with a soil : water ratio of 1:2.5 (w/v). Soil EC was measured using an electrical conductivity meter (DDS-307, Inesa Scientific Instrument Co., Ltd, Shanghai, China). SOC and TN were measured by the dry-combustion method using an elemental analyzer (Elementar Analysensysteme GmbH, Langenselbold, Germany). TP and TK were measured by NaOH-soil co-melting method using a Spectramax i3x (Molecular Devices, LLC, San Jose, CA, USA) microplate reader. Soil microbial biomass carbon (MBC) was determined using the chloroform fumigation–extraction (CFE) method following the procedure of Vance et al.[20].
Soil aggregate analyses
-
Aggregate stability was determined using the wet-sieving method with a nested set of sieves (2.0, 0.25, and 0.053 mm) following Kemper and Rosenau[21]. Briefly, air-dried soil was placed on the top sieve and pre-wetted by immersion for 5 min prior to oscillation to minimize slaking. The sieve stack was then oscillated in water (amplitude 5 cm; 60 oscillations min−1) for 5 min to separate water-stable aggregates into four size classes: mega-macroaggregates (> 2 mm, MAG), large macroaggregates (0.25–2 mm, LMG), small microaggregates (0.053–0.25 mm, SMG), and the silt–clay fraction (< 0.053 mm, SC). Aggregate fractions retained on each sieve were carefully collected, oven-dried at 60 °C to constant mass, and weighed to calculate mass proportions. Dried aggregates were subsequently ground to pass a 0.25-mm sieve, and aggregate-associated carbon was determined using an elemental analyzer.
Soil enzyme analyses
-
Soil enzyme activities, including α-glucosidase (AG), β-glucosidase (BG), cellobiohydrolase (CBH), and endo-1,4-xylanase (XYL), were determined using commercial assay kits (Solarbio, Beijing, China) following the manufacturers' instructions. Specifically, AG, BG, CBH, and XYL were assayed with Solarbio kits BC2550, BC2565, BC4030, and BC5735, respectively. Substrate solutions, reagent concentrations, and mixing ratios were prepared according to the corresponding kit manuals. Reactions for AG, BG, and CBH were incubated at 37 °C for 30–60 min, whereas XYL was incubated at 50 °C for 1 h. After incubation, absorbance was measured using a SpectraMax i3x microplate reader (Molecular Devices, San Jose, CA, USA). Reaction products were quantified at 400 nm for AG, BG, and CBH, and at 540 nm for XYL.
Data analysis
-
The indices of mean weight diameter (MWD) and geometric mean diameter (GMD) were selected to describe the stability of soil aggregates, and the formulas were calculated according to the method of Kemper & Rosenau[21]:
$ \mathrm{MWD}\;(\mathrm{mm})=\sum\nolimits_{i=1}^{n}{W}_{i}{\overline{X}}_{i} $ (2) $ \mathrm{GMD}\;(\mathrm{mm})=\exp \left(\frac{\sum\nolimits_{i=1}^{n}{W}_{i}\ln \overline{{X}_{i}}}{\sum\nolimits_{i=1}^{n}{W}_{i}}\right) $ (3) where,
$\overline X_i $ Data processing was performed using Microsoft Excel 2021 (Microsoft Corp., Redmond, WA, USA), and figures were generated using OriginPro 2024 (OriginLab Corporation, Massachusetts, USA). Data were analyzed using a split-plot ANOVA, with tillage as the main-plot factor and microbial organic fertilizer rate as the subplot factor; block was treated as a random effect. The analysis was performed using SPSS software (version 27.0; SPSS Inc., Chicago, USA) with the least significant difference and Duncan's multiple range test applied at a significance level of p < 0.05 to examine the effects of soil physicochemical analysis, enzyme analysis, and microbial community analysis with their interactions.
-
The results of soil properties in the topsoil and subsoil under different tillage methods and microbial organic fertilizer application rates are shown in Table 2. In the topsoil, rotary tillage reduced BD by 7.0% compared with no-tillage, and this reduction was further enhanced with microbial organic fertilizer. Under low fertilizer input, BD decreased by 18.2% compared with the NTN, reaching 1.21 g cm−3. EC improved markedly with organic fertilizer addition, increasing by 12.8% under medium fertilizer input and by 13.9% under NT (p < 0.05). Soil pH followed the order PT > RT > NT, and under high organic fertilizer combined with plough tillage (PTOM-H), pH reached 6.47, representing a 19.1% increase compared with NTN (p < 0.01). TN, TK, and TP improved most under PT, followed by NT and RT, with medium fertilizer application producing the highest overall nutrient levels.
Table 2. Effect of different fertilizer inputs on soil physicochemical properties
Layer (cm) Treatment BD (g cm−3) SP (%) EC (μS cm−1) pH TN TP TK (g kg−1) 0–20 NTN 1.48 ± 0.05a 44.03 ± 1.94c 93.67 ± 4.07c 5.43 ± 0.12b 0.70 ± 0.05c 0.96 ± 0.08b 12.57 ± 0.31c NTS 1.42 ± 0.01ab 46.29 ± 0.44bc 102.87 ± 2.00b 5.61 ± 0.10ab 0.61 ± 0.03d 1.09 ± 0.11ab 14.53 ± 1.10ab NTOM-L 1.36 ± 0.01bc 48.55 ± 0.44ab 104.40 ± 4.19ab 5.50 ± 0.22ab 0.86 ± 0.06b 1.25 ± 0.09a 13.77 ± 1.00bc NTOM-M 1.32 ± 0.02c 50.19 ± 0.65a 106.70 ± 0.95a 5.38 ± 0.08b 1.29 ± 0.02a 1.33 ± 0.03a 16.00 ± 1.30a NTOM-H 1.33 ± 0.05c 49.81 ± 1.96a 100.53 ± 0.70b 5.71 ± 0.03a 0.89 ± 0.04b 1.01 ± 0.06b 14.10 ± 0.98bc PTS 1.33 ± 0.07ab 49.81 ± 2.61ab 105.50 ± 1.15a 5.47 ± 0.08b 1.01 ± 0.02a 1.26 ± 0.03b 15.43 ± 0.76a PTOM-L 1.37 ± 0.07a 48.43 ± 2.73b 105.90 ± 0.92a 5.44 ± 0.07b 0.99 ± 0.06a 1.24 ± 0.03b 13.97 ± 0.32bc PTOM-M 1.24 ± 0.03b 53.33 ± 0.95a 106.10 ± 1.25a 6.43 ± 0.10a 0.73 ± 0.03c 1.26 ± 0.01b 14.67 ± 1.17ab PTOM-H 1.33 ± 0.04ab 49.81 ± 1.51ab 96.43 ± 4.25b 6.47 ± 0.02a 0.88 ± 0.03b 1.38 ± 0.03a 12.87 ± 0.15c RTS 1.27 ± 0.02ab 51.95 ± 0.87ab 96.87 ± 1.43b 5.84 ± 0.05a 0.77 ± 0.05bc 1.19 ± 0.01b 12.67 ± 0.61a RTOM-L 1.21 ± 0.07b 54.21 ± 2.46a 98.87 ± 7.34ab 5.82 ± 0.37a 0.69 ± 0.05c 1.10 ± 0.07c 14.43 ± 1.39a RTOM-M 1.35 ± 0.07a 48.93 ± 2.78b 104.17 ± 0.67ab 5.55 ± 0.04a 0.83 ± 0.06ab 1.30 ± 0.02a 12.70 ± 0.75a RTOM-H 1.31 ± 0.08ab 50.44 ± 3.16ab 105.60 ± 0.80a 5.47 ± 0.06a 0.87 ± 0.05a 1.09 ± 0.09c 13.53 ± 1.15a 20–40 NTN 1.62 ± 0.02a 38.96 ± 0.77b 83.77 ± 3.36c 5.44 ± 0.03a 0.96 ± 0.08a 0.76 ± 0.08a 13.80 ± 0.60cd NTS 1.59 ± 0.02a 40.07 ± 0.65b 91.00 ± 1.35b 5.51 ± 0.04a 0.95 ± 0.05a 0.71 ± 0.05a 15.67 ± 0.76a NTOM-L 1.61 ± 0.03a 39.09 ± 1.27b 102.37 ± 0.93a 5.57 ± 0.02a 0.72 ± 0.02b 0.68 ± 0.06a 15.27 ± 0.71ab NTOM-M 1.55 ± 0.02b 41.69 ± 0.85a 79.87 ± 4.51cd 5.75 ± 0.09a 0.60 ± 0.02c 0.40 ± 0.00b 14.30 ± 0.53bc NTOM-H 1.53 ± 0.02b 42.45 ± 0.57a 77.13 ± 2.55d 5.84 ± 0.03a 0.98 ± 0.03a 0.36 ± 0.02c 12.90 ± 0.44d PTS 1.57 ± 0.01a 40.60 ± 0.46b 98.30 ± 0.87b 5.29 ± 0.03b 0.95 ± 0.07b 0.54 ± 0.03c 15.13 ± 0.59b PTOM-L 1.59 ± 0.04a 40.10 ± 1.33b 90.27 ± 3.99c 5.65 ± 0.32a 0.86 ± 0.08b 0.57 ± 0.05bc 12.97 ± 0.57c PTOM-M 1.47 ± 0.03b 44.37 ± 0.94a 102.27 ± 0.47a 6.14 ± 0.02a 0.62 ± 0.05c 0.65 ± 0.03b 15.20 ± 0.53b PTOM-H 1.47 ± 0.03b 44.52 ± 1.00a 65.23 ± 3.02d 6.02 ± 0.05b 1.19 ± 0.11a 0.75 ± 0.03a 17.17 ± 0.60a RTS 1.60 ± 0.03ab 39.74 ± 0.95ab 103.27 ± 0.46a 5.10 ± 0.02c 0.51 ± 0.04a 1.26 ± 0.05a 12.60 ± 0.79b RTOM-L 1.62 ± 0.02a 38.74 ± 0.58c 94.67 ± 0.81b 5.41 ± 0.02bc 0.51 ± 0.05a 0.67 ± 0.04b 13.53 ± 0.25b RTOM-M 1.57 ± 0.02b 40.71 ± 0.92b 65.97 ± 3.03d 6.00 ± 0.18a 0.40 ± 0.03b 0.40 ± 0.00c 12.60 ± 0.79b RTOM-H 1.53 ± 0.02c 42.43 ± 0.72a 86.63 ± 6.74c 5.60 ± 0.16ab 0.56 ± 0.02a 0.43 ± 0.03c 16.27 ± 0.50a ANOVA
(0–20)T ** ** * ** ** ** ** R ** ** ** ** ** ** ** T × R ns ns ** ** ** ** ** ANOVA
(20–40)T ** ** * ** ** ** ** R ** ** ** ** ** ** ** T × R ns ns ** ** ** ** ** Different letters in the same column indicate significant differences between treatments at p < 0.05 according to Duncan's multiple range test. Values are means ± the standard error (n = 3). *, ** represent p < 0.05, p < 0.01, respectively, and 'ns' represents p > 0.05. T represents tillage methods (main plot), R represents organic input rate level (subplot), and T × R represents the interaction. In the subsoil, tillage and fertilizer rates significantly affected soil properties. Tillage improved bulk density and porosity in the order PT > NT > RT, with no significant interaction between tillage and fertilizer rate. The application of organic fertilizer notably increased EC at low input levels, and further enhancement occurred under tillage; under RTS, EC reached 103.27 μS cm−1, a 23.3% increase compared with CK. pH, TN, TP, and TK generally followed the order PT > NT > RT order (except for TP, which followed RT > PT > NT). TN and TK reached their maximum under high organic fertilizer combined with PTOM-H, while TP peaked under high organic fertilizer combined with RTOM-H.
Soil organic carbon concentration
-
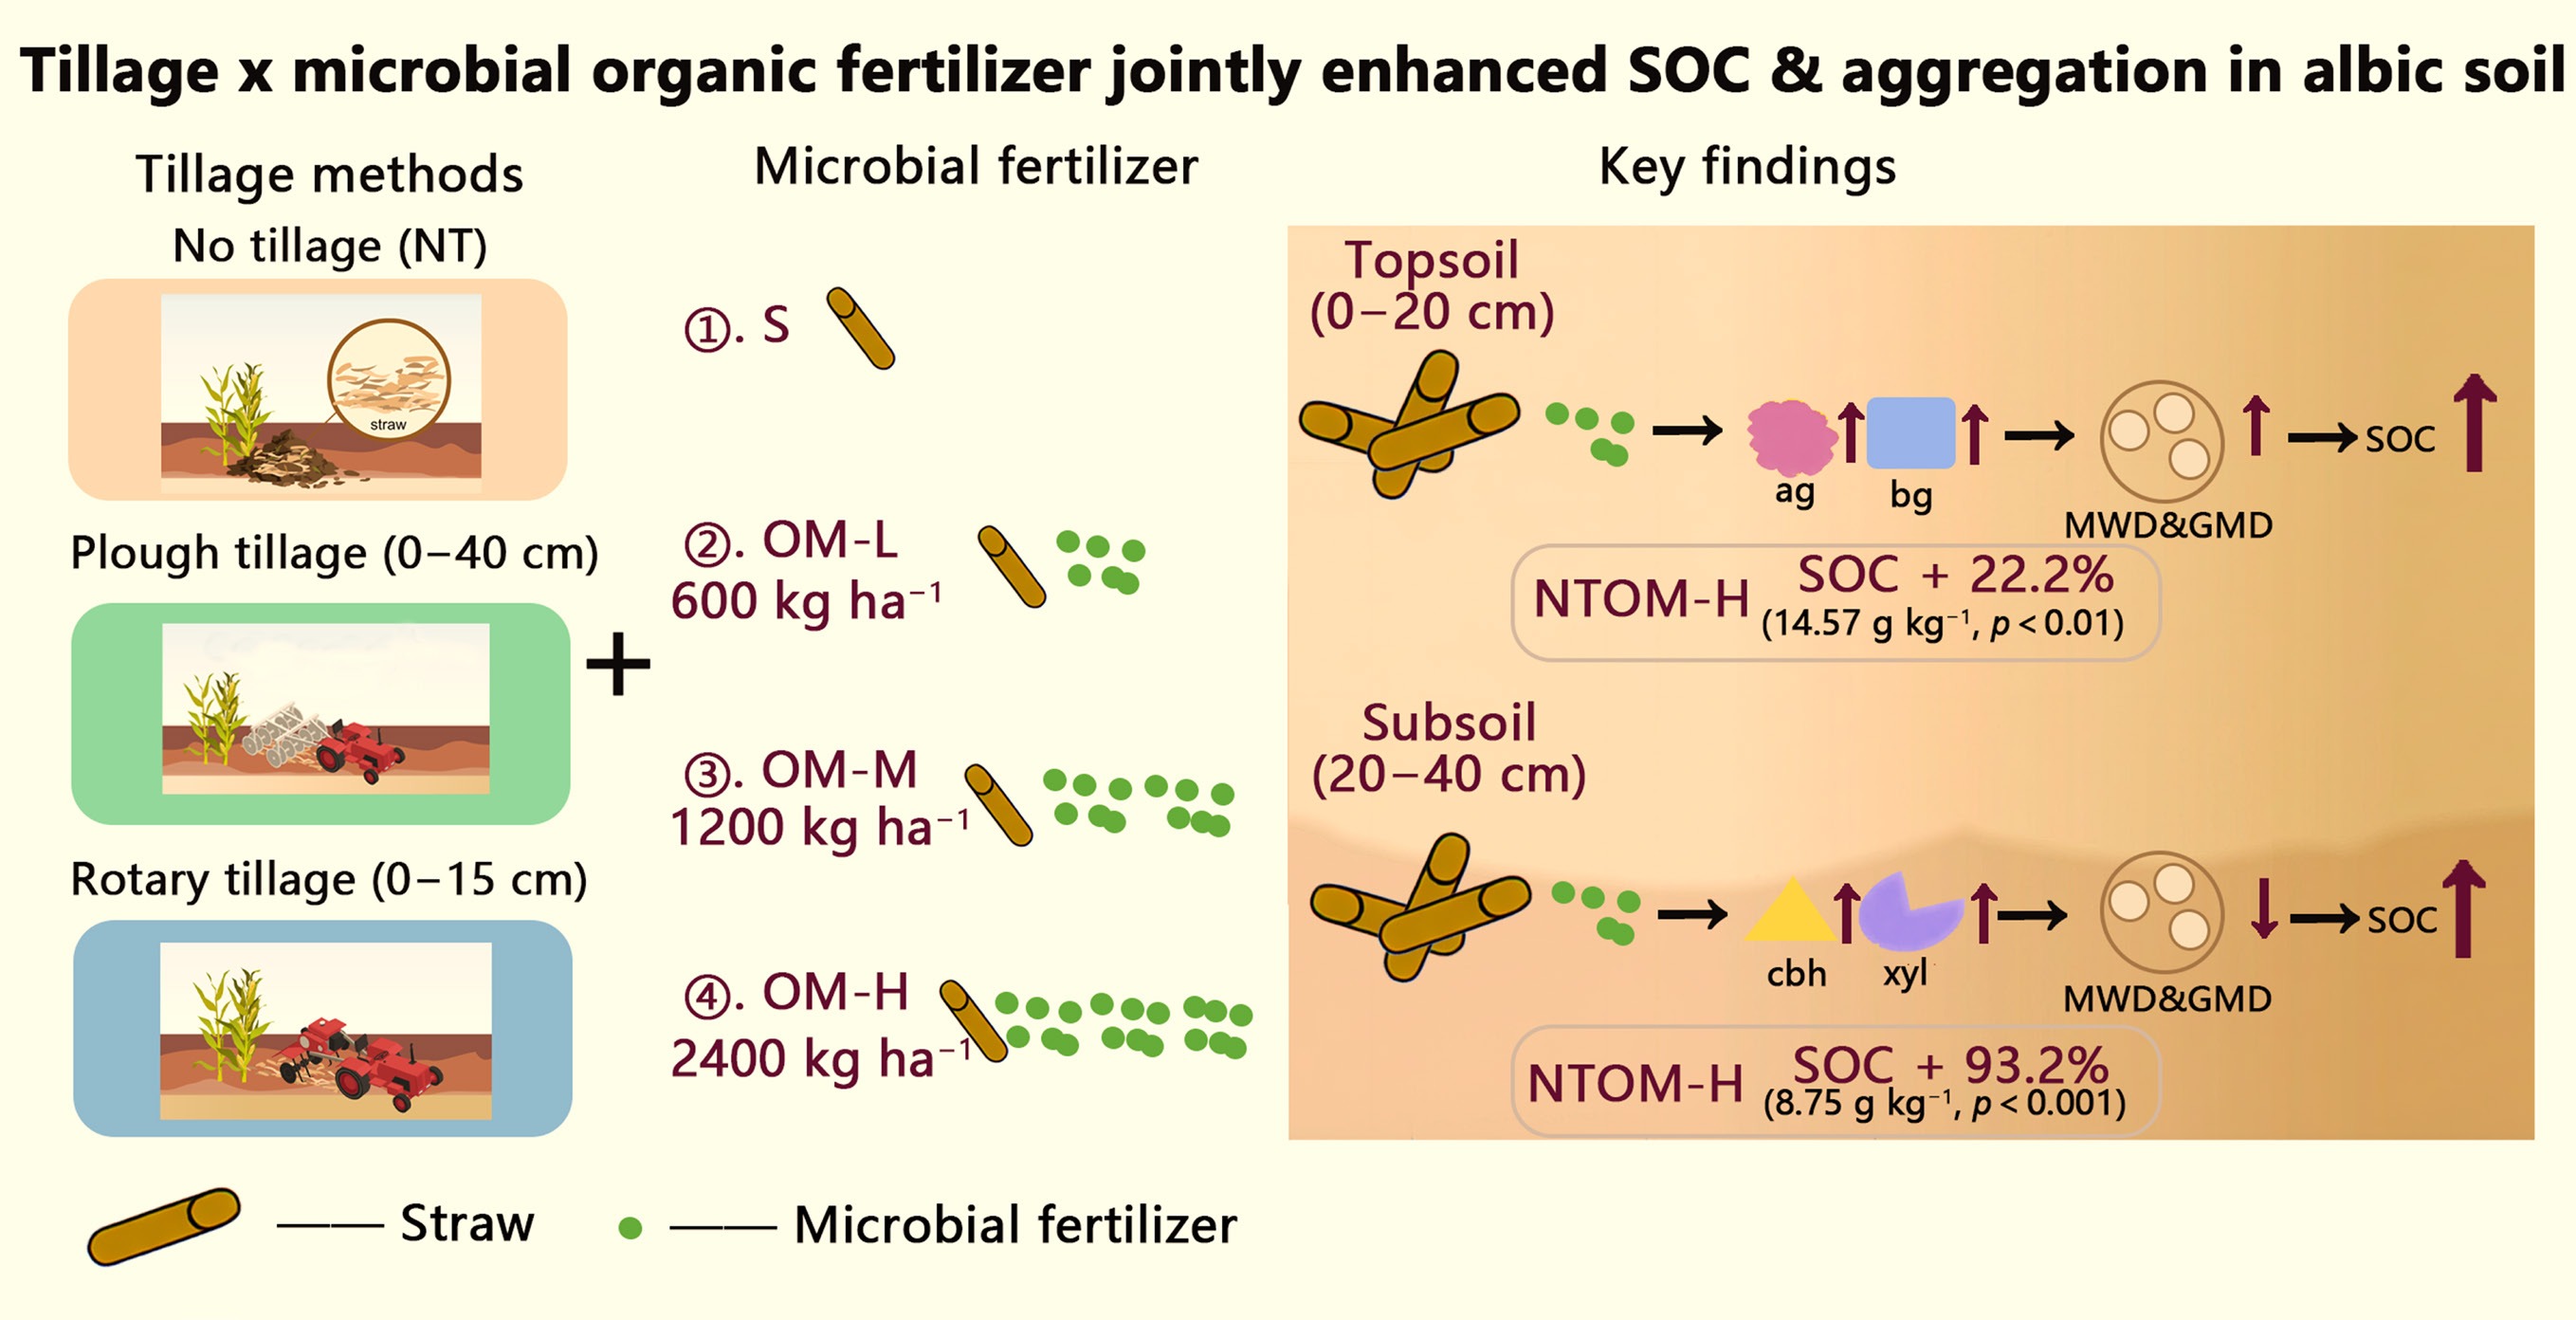
The results of soil carbon concentration measurements in the topsoil and subsoil under different tillage methods and microbial organic fertilizer application rates are shown in Fig. 1. In the topsoil, the interaction between tillage and fertilizer rate significantly affected SOC concentration. The highest SOC content was observed under NT, increasing progressively with fertilizer input, reaching 14.57 g kg−1 at the high fertilizer rate—22.0% higher than NTN (p < 0.01).
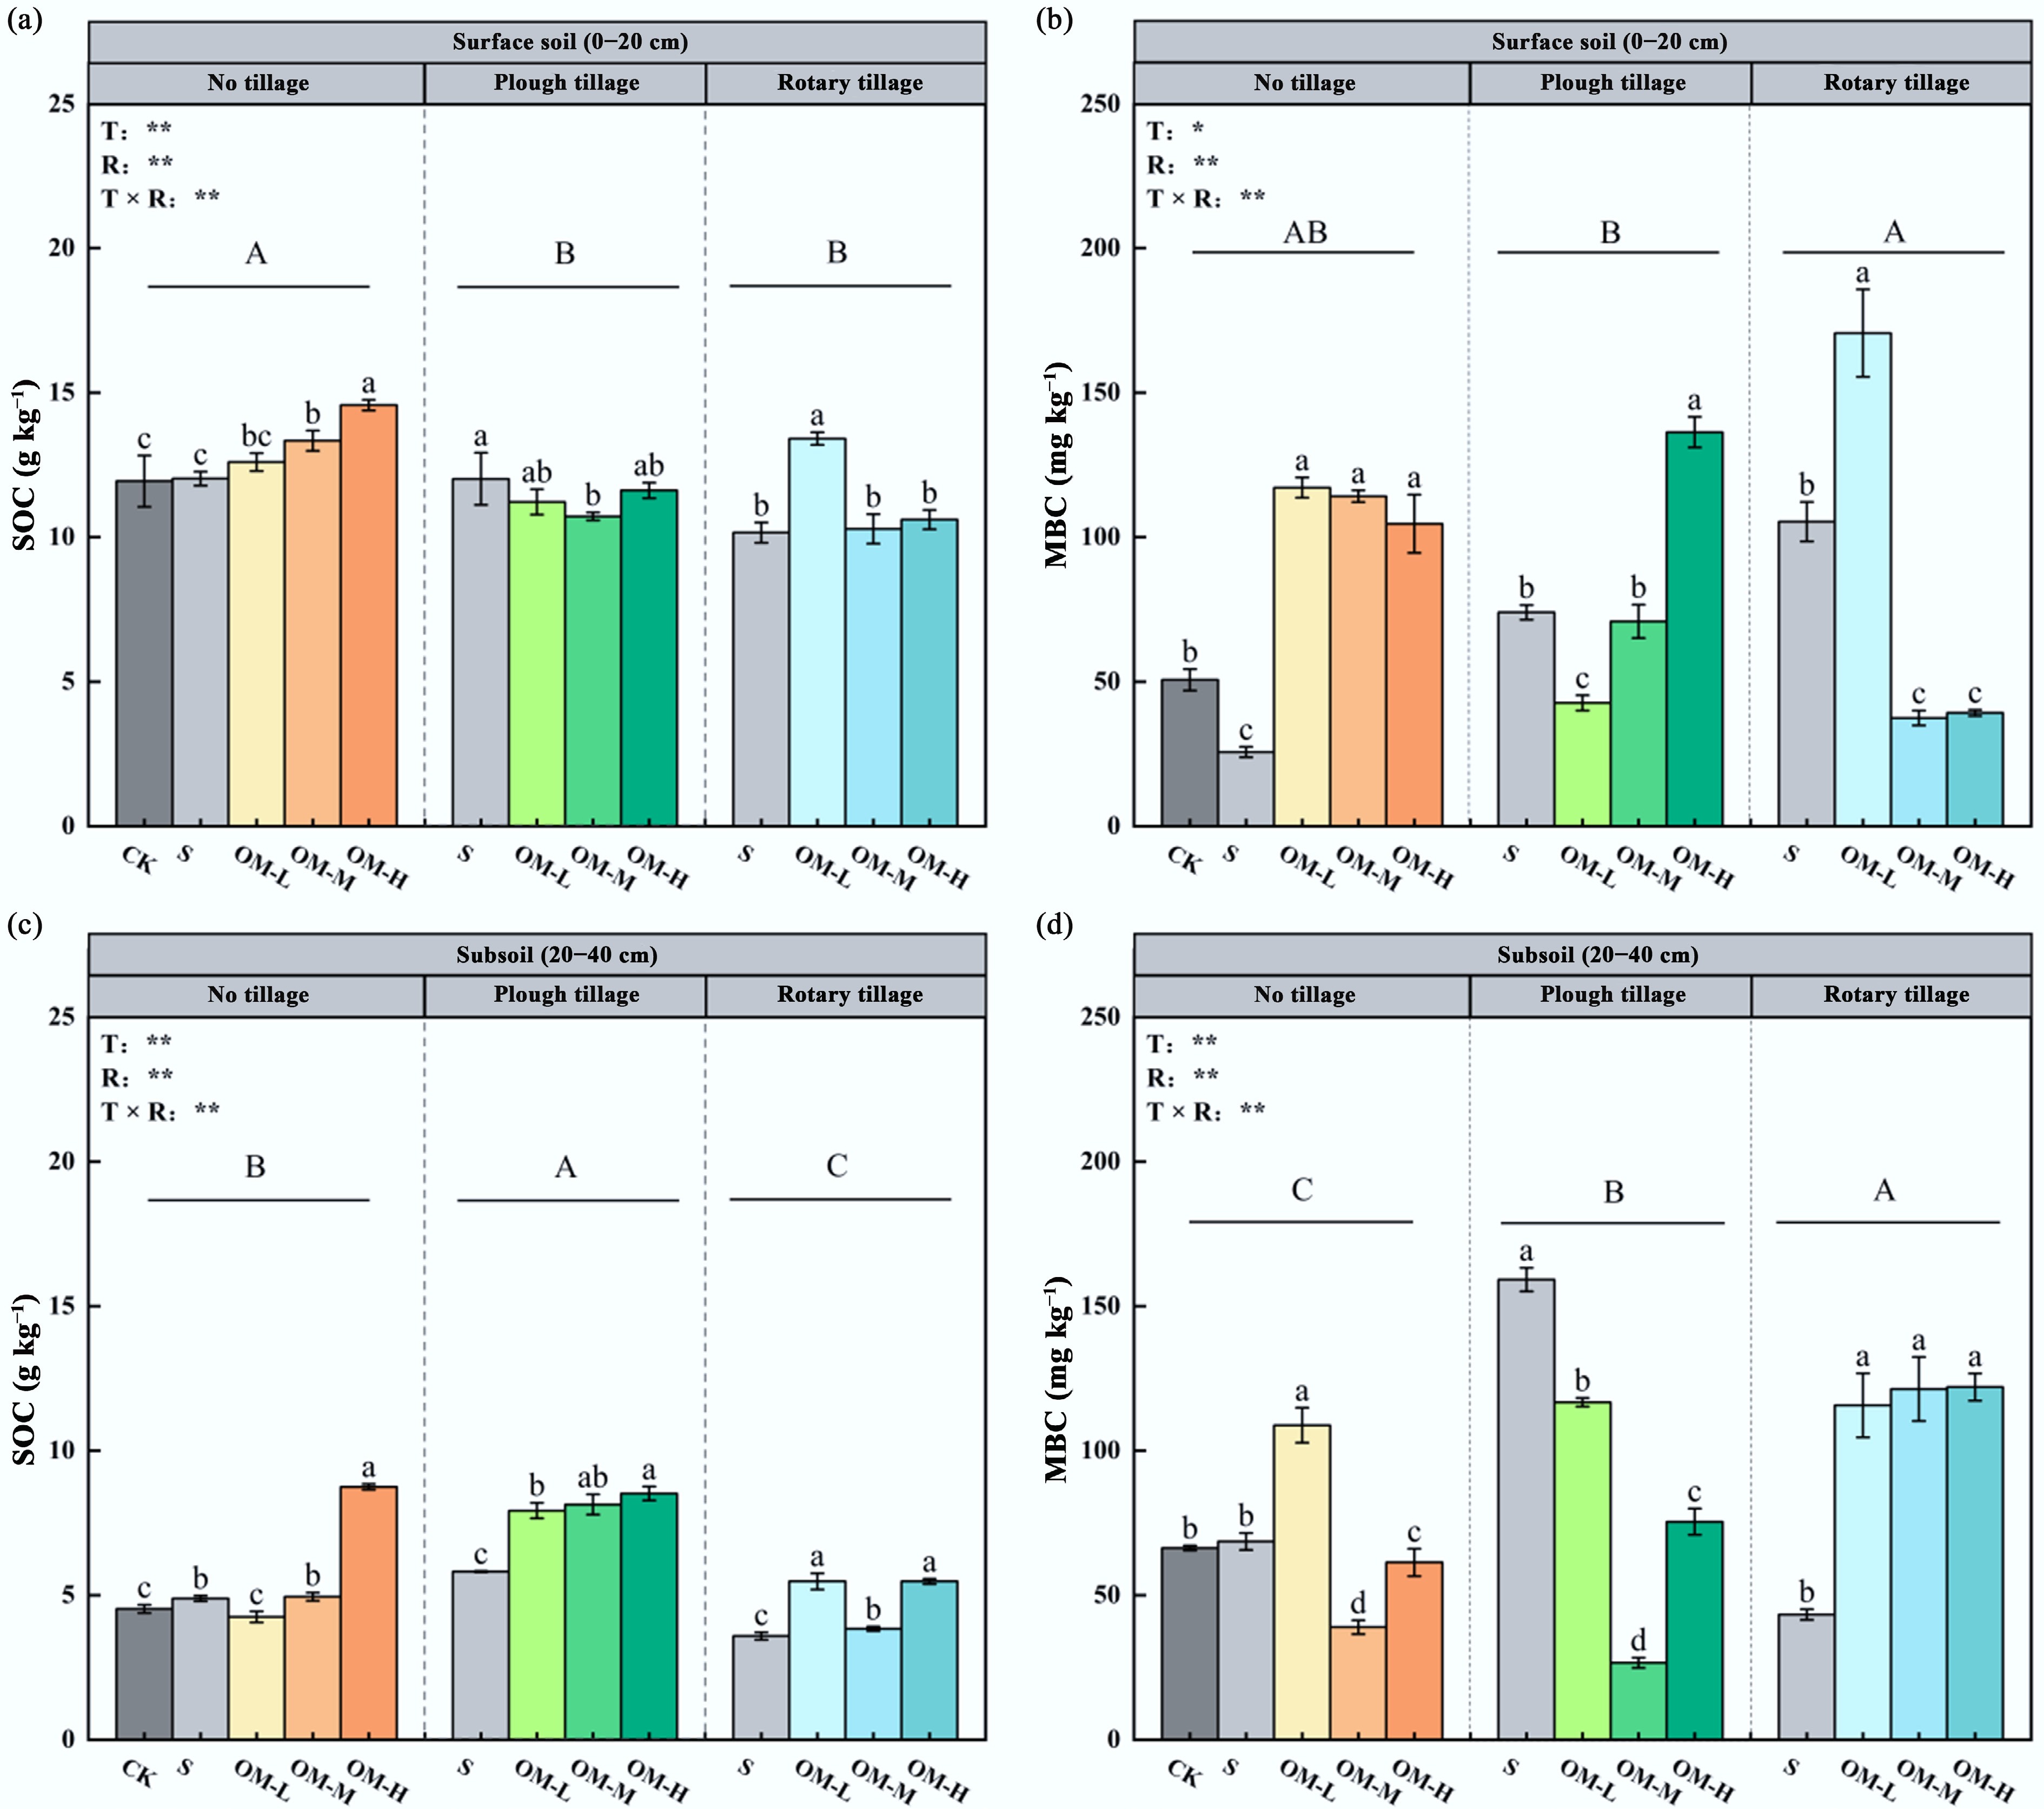
Figure 1.
Effects of different fertilizer inputs on SOC and MBC in the topsoil and subsoil, including (a) topsoil SOC content, (b) topsoil MBC content, (c) subsoil SOC content, and (d) subsoil MBC content. Different uppercase letters indicate significant differences among tillage methods, and lowercase letters show significant differences between treatments (p < 0.05). Error bars represent the standard deviation of three replicates (n = 3). *, ** represent p < 0.05, p < 0.01, respectively.
In the subsoil, the interaction also significantly influenced SOC concentration. SOC followed the order PT > NT > RT, increasing significantly under NT with higher fertilizer, reaching 8.75 g kg−1 at the high application rate—93.2% higher than CK (p < 0.001).
Soil aggregate and the associated carbon distribution
-
The results of soil aggregate stability and carbon distribution in the topsoil and subsoil under different tillage practices and microbial organic fertilizer application rates are presented in Figs 2−4. In the topsoil, the interaction between tillage and fertilizer rate significantly affected aggregate formation and stability. The proportion of large aggregates ranked NT > RT > PT, while silt-clay content followed the opposite trend (PT > NT > RT). The MWD ranked NT > RT > PT. Under NT and PT, MWD initially increased and then decreased with increasing fertilizer rate, whereas under RT, it increased consistently. High fertilizer input raised MWD to 0.87 mm, a 31.8% increase relative to NTN (p < 0.05). The GMD was positively correlated with MWD. The carbon content of large aggregates followed the order PT > NT > RT, peaking at medium fertilizer levels.
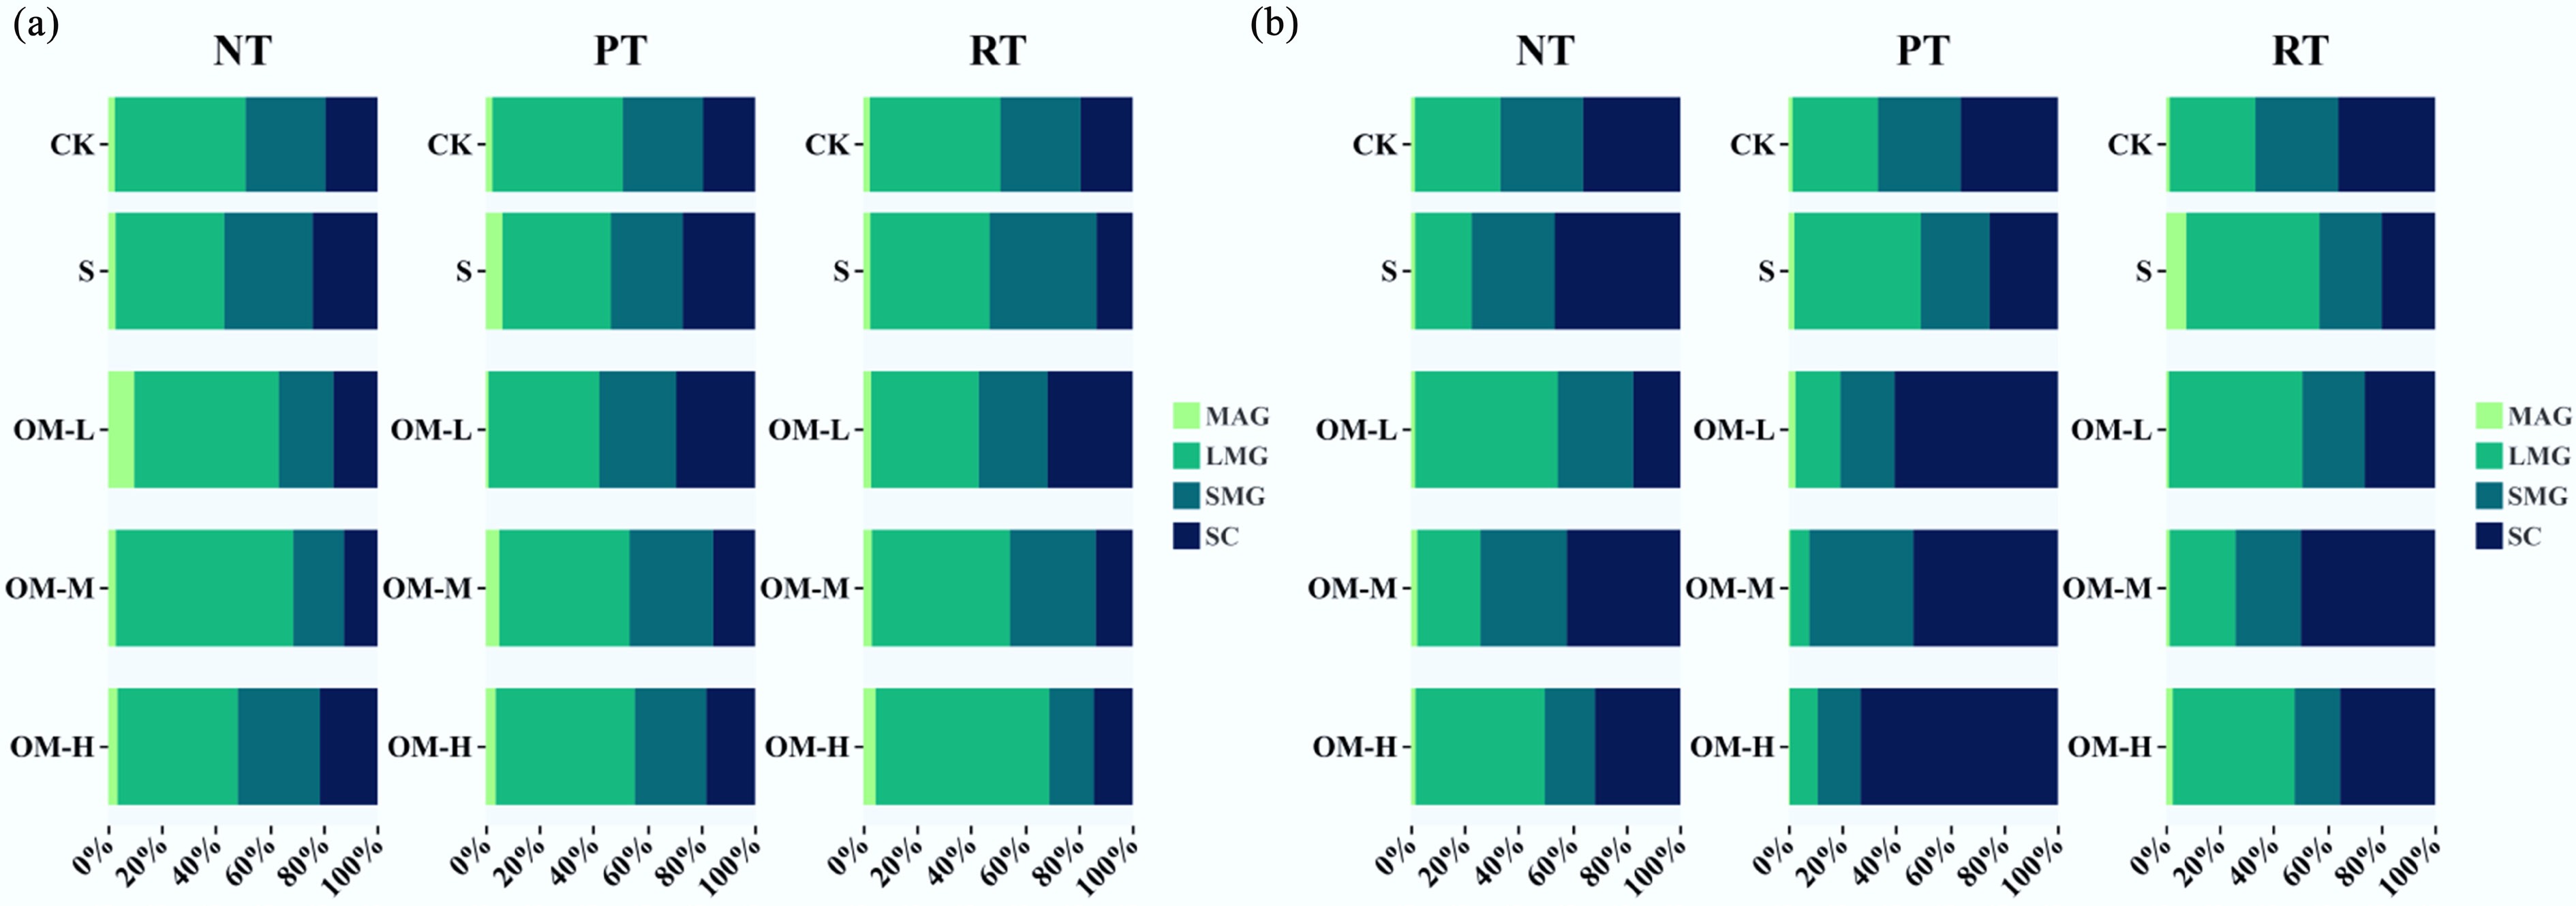
Figure 2.
Effects of different fertilizer inputs on aggregate-size distribution in the (a) topsoil, and (b) subsoil. MAG indicates large macroaggregates, LMG indicates small macroaggregates, SMG indicates microaggregates, and SC indicates silt-clay fractions. S indicates only straw return; OH-L indicates low fertilizer input; OH-M indicates medium fertilizer input; OH-H indicates high fertilizer input.
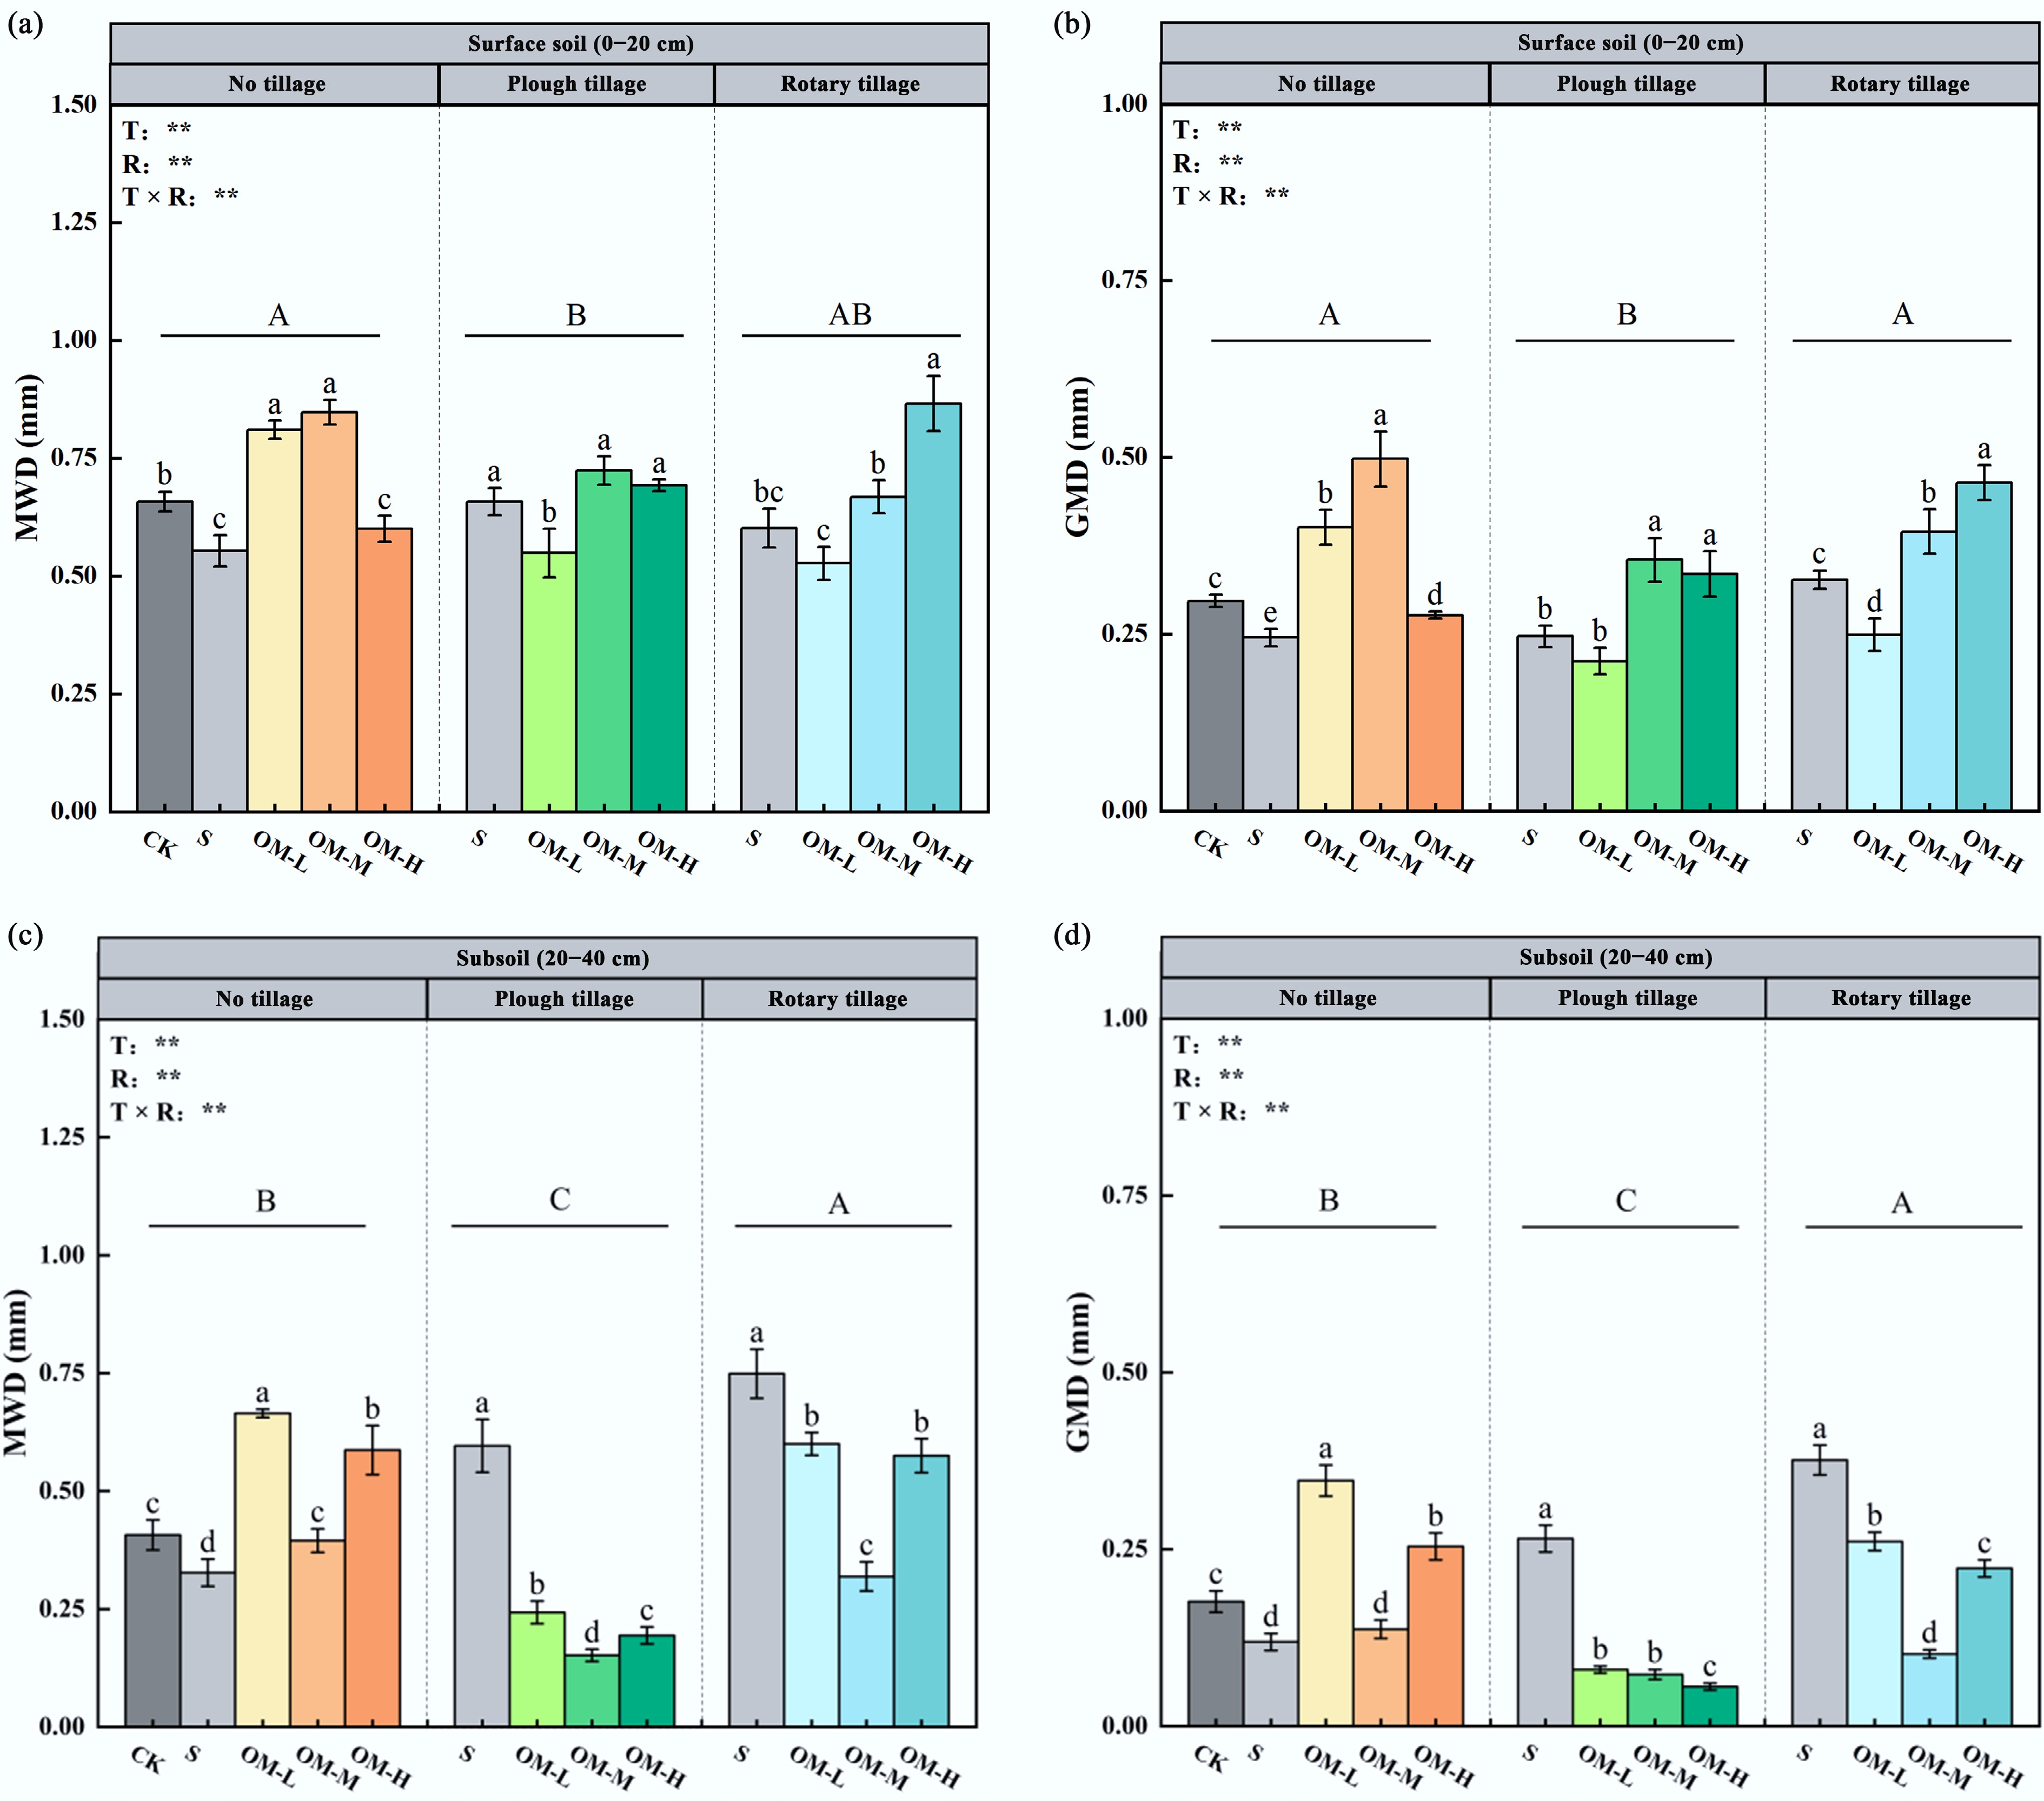
Figure 3.
Effects of different fertilizer inputs on soil aggregate stability, including (a) topsoil MWD, (b) topsoil GMD, (c) subsoil MWD, and (d) subsoil GMD. ** represents p < 0.01. Different lowercase letters show significant differences between treatments (p < 0.05). Different uppercase letters indicate the differences between tillage methods (p < 0.05). Error bars represent the standard deviation of three replicates (n = 3).
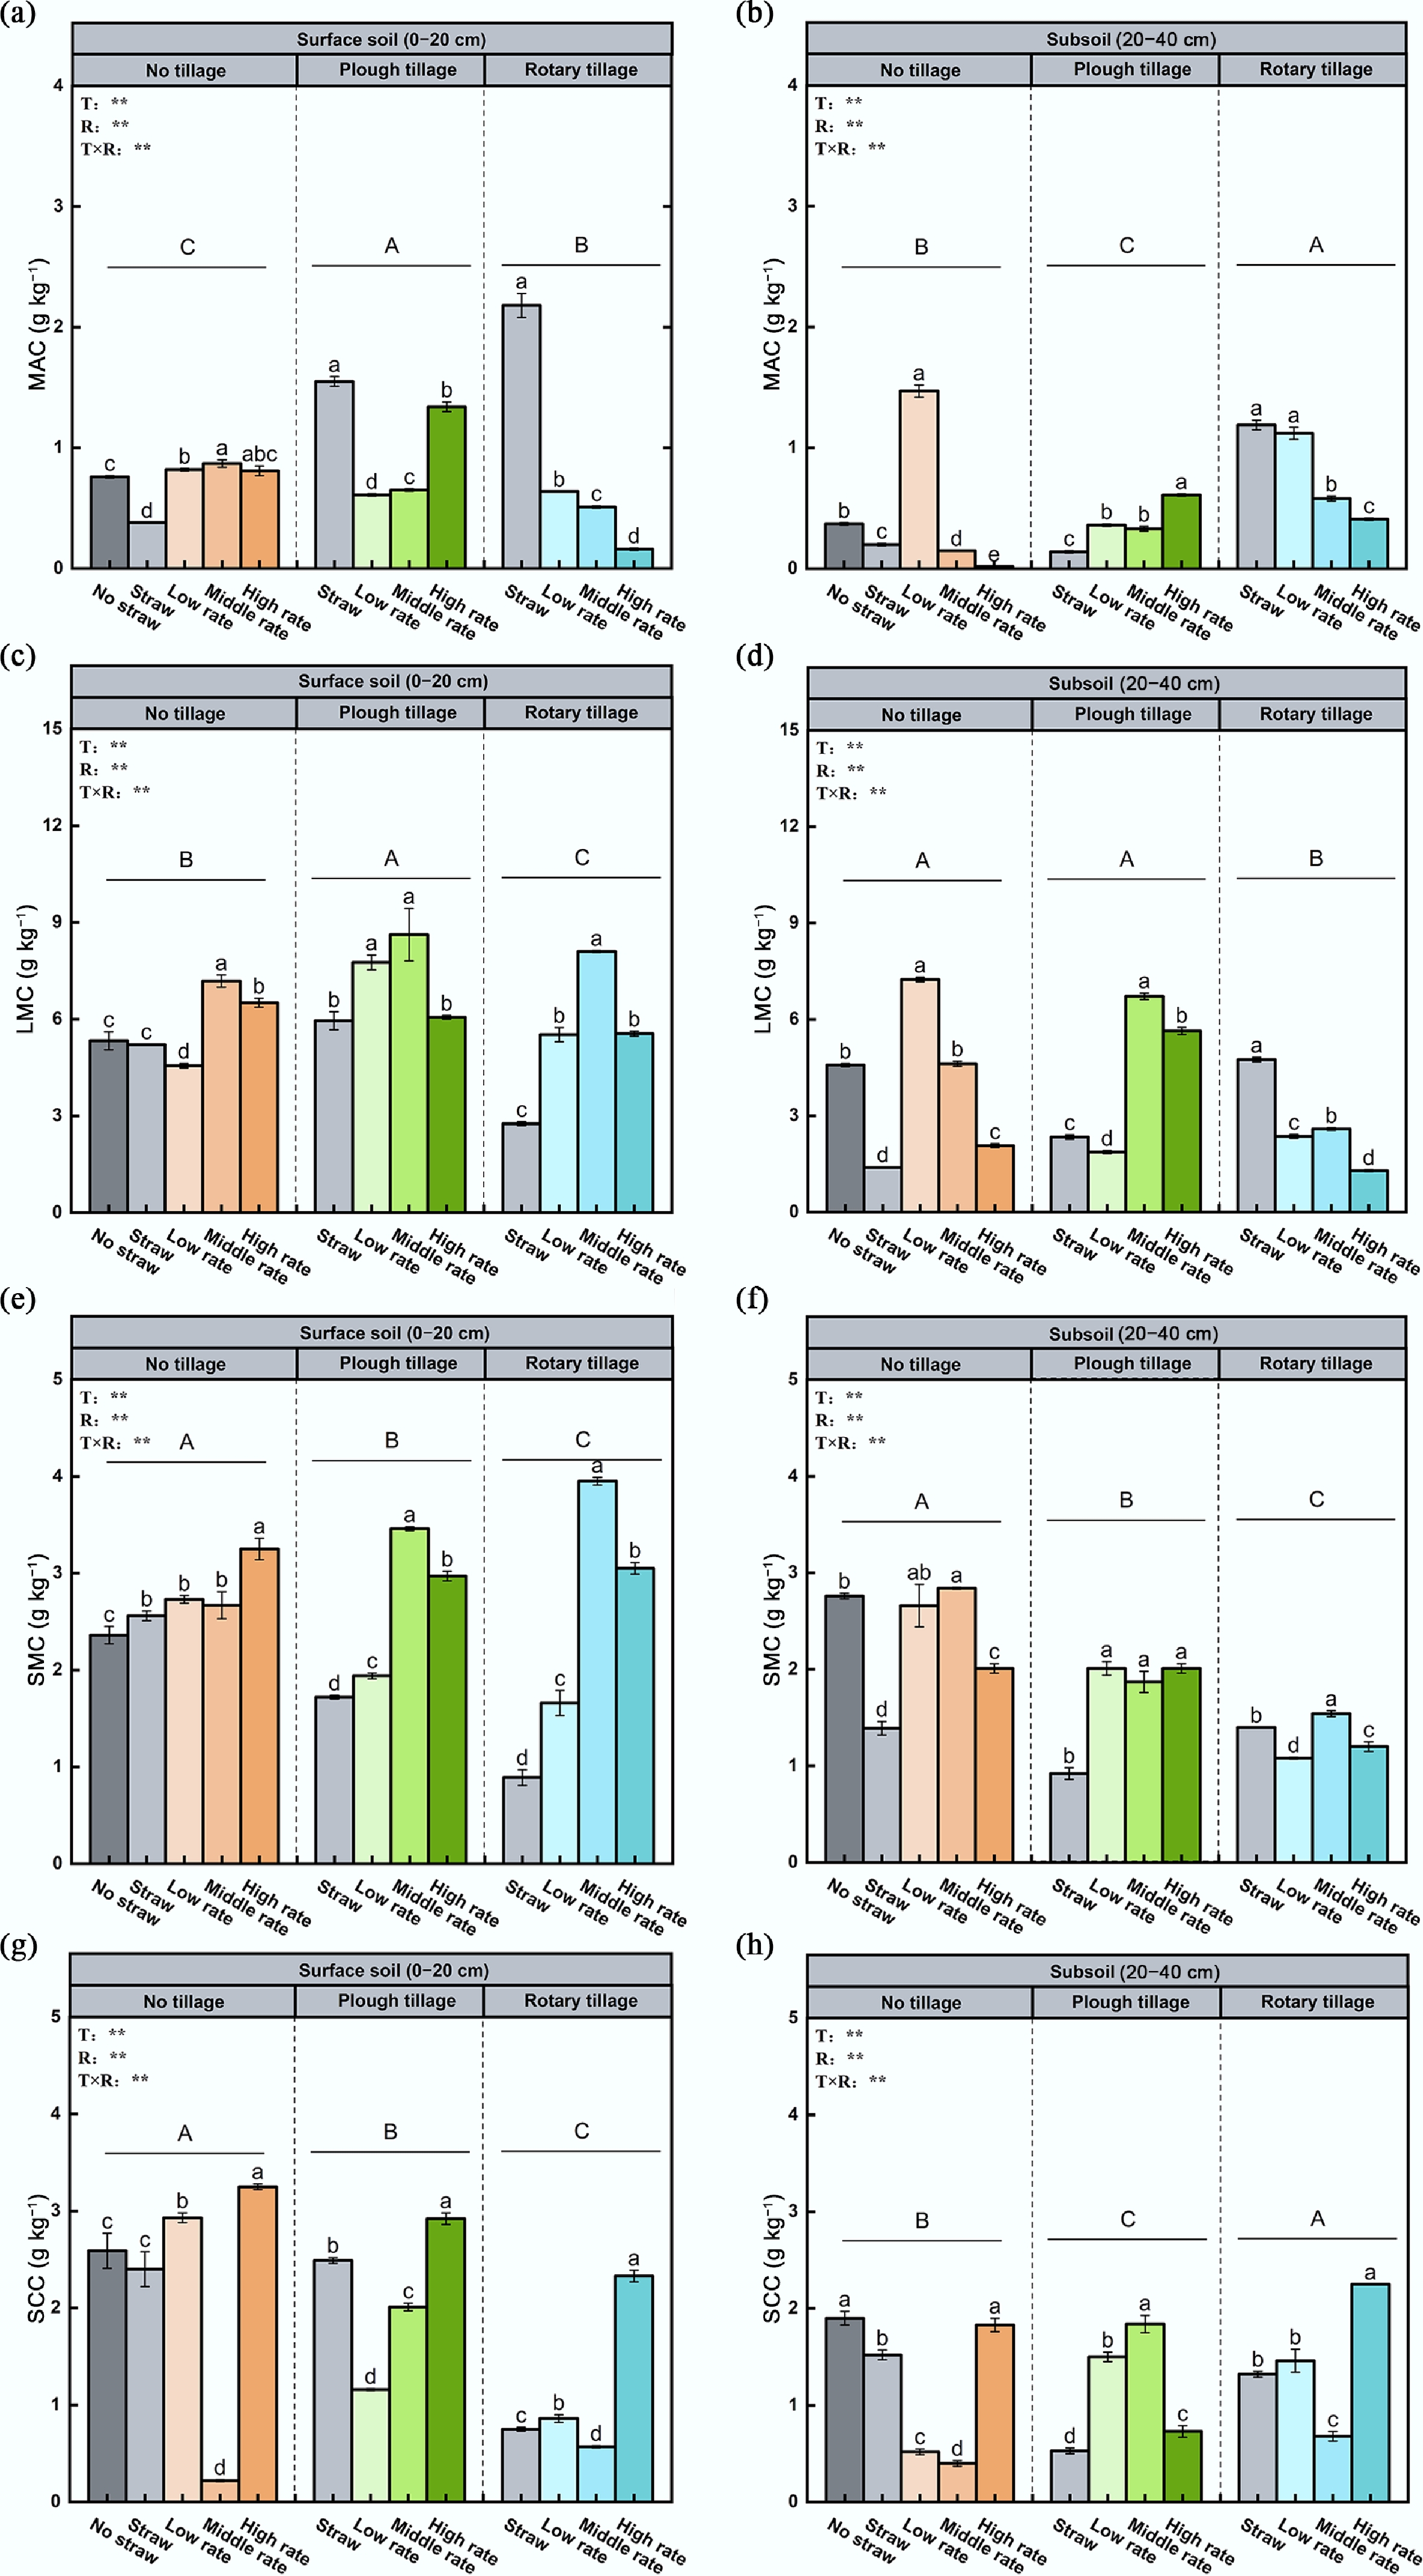
Figure 4.
Effects of different fertilizer inputs on aggregate-associated carbon in the (a), (c), (e), (g) topsoil, and (b), (d), (f), (h) subsoil. MAC indicates the carbon content in mega macroaggregates, LMC indicates the carbon content in large macroaggregates, SMC indicates the carbon content in small microaggregates, and SCC indicates carbon content in silt-clay fractions. Different lowercase letters show significant differences between treatments (p < 0.05). Different uppercase letters indicate the differences between tillage methods (p < 0.05). Error bars represent the standard deviation of three replicates (n = 3).
In the subsoil, tillage–fertilizer interactions followed a similar pattern but with overall lower carbon contents. The proportion of large aggregates followed NT > RT > PT, while clay-silt content ranked PT > RT > NT. MWD was ordered RT > NT > PT, first decreasing and then increasing with fertilizer input. Under RTS, MWD increased to 0.75 mm, an 82.9% rise compared with NTN (p < 0.05). The carbon content of large aggregates was higher under PT and NT, peaking at medium fertilizer rates, with medium PT input increasing it by 42.4% relative to NTN.
Enzyme activity related to soil carbon cycling
-
The results of enzyme activity measurements in the topsoil and subsoil under different tillage methods and microbial organic fertilizer application rates are shown in Table 3. In the topsoil, both tillage and fertilizer rates significantly affected enzyme activity, with RT treatments showing the highest overall activity levels. AG activity showed the highest variation under RT, peaking at 31.58 μmol d−1 g−1. BG activity was highest under RT and lowest under NT. CBH activity increased with fertilizer rate under RT but remained lower than under NT. XYL activity varied most under NT, showing first a decrease and then an increase, similar to PT, where it decreased with higher fertilizer rates.
Table 3. Effect of tillage methods and microbial organic fertilizer inputs on soil enzyme activities
Layer (cm) Treatment AG BG CBH XYL (μmol d−1 g−1) 0–20 NTN 22.88 ± 0.48a 22.80 ± 1.10c 2.03 ± 0.09ab 47.58 ± 3.48b NTS 22.04 ± 0.68a 25.92 ± 0.63b 1.69 ± 0.22ab 50.90 ± 2.80b NTOM-L 16.77 ± 0.60c 36.32 ± 3.60a 1.82 ± 0.29ab 58.15 ± 3.42a NTOM-M 17.93 ± 0.34b 22.96 ± 1.11c 1.46 ± 0.11b 26.24 ± 4.13d NTOM-H 22.61 ± 3.26a 40.40 ± 4.02a 1.58 ± 0.10a 38.18 ± 0.72c PTS 19.70 ± 0.68b 30.40 ± 2.01b 1.83 ± 0.02ab 42.71 ± 1.13a PTOM-L 19.45 ± 0.30b 26.08 ± 2.57bc 1.49 ± 0.12ab 29.44 ± 3.54b PTOM-M 19.19 ± 0.60b 25.44 ± 2.29c 1.44 ± 0.02b 27.72 ± 4.49b PTOM-H 21.83 ± 1.00a 41.36 ± 4.02a 1.98 ± 0.23a 47.18 ± 2.10a RTS 31.58 ± 3.83a 44.96 ± 4.43ab 1.89 ± 0.11ab 42.89 ± 0.77a RTOM-L 10.40 ± 0.45c 38.16 ± 3.74b 1.78 ± 0.13ab 52.89 ± 2.84a RTOM-M 30.25 ± 1.98a 44.32 ± 1.60a 1.90 ± 0.10b 45.52 ± 1.57a RTOM-H 19.66 ± 0.73b 28.40 ± 2.77c 2.00 ± 0.12a 30.63 ± 2.34a 20–40 NTN 12.69 ± 0.66b 29.44 ± 2.04b 1.20 ± 0.08d 32.74 ± 2.55b NTS 7.37 ± 0.59c 37.36 ± 3.61a 1.43 ± 0.14c 29.19 ± 2.71b NTOM-L 15.96 ± 0.70a 38.48 ± 3.81a 2.07 ± 0.13b 23.62 ± 1.22c NTOM-M 16.76 ± 0.57a 23.52 ± 2.29c 2.28 ± 0.31ab 58.15 ± 3.42a NTOM-H 15.53 ± 0.52a 36.80 ± 2.98a 2.28 ± 0.06a 32.52 ± 4.08b PTS 21.77 ± 0.55a 30.00 ± 2.95a 1.40 ± 0.08b 31.53 ± 2.91b PTOM-L 16.88 ± 0.69c 21.20 ± 2.01b 1.00 ± 0.12c 25.32 ± 3.64b PTOM-M 19.69 ± 0.40b 23.68 ± 1.56b 1.78 ± 0.10a 45.52 ± 3.79a PTOM-H 17.13 ± 0.52c 20.08 ± 1.74b 1.98 ± 0.22a 42.31 ± 3.39a RTS 13.88 ± 0.28c 25.20 ± 2.44c 1.48 ± 0.03b 28.18 ± 2.72b RTOM-L 14.57 ± 0.43c 40.96 ± 4.09a 1.31 ± 0.07c 44.41 ± 2.88a RTOM-M 19.92 ± 0.63a 33.44 ± 3.24b 1.44 ± 0.13bc 27.42 ± 2.98b RTOM-H 15.50 ± 0.43b 25.52 ± 2.43c 1.78 ± 0.02a 27.09 ± 2.91b ANOVA (0–20) T ** ** ** ** R ** ** ** ** T × R ** ** ** ** ANOVA (20–40) T ** ** ** ** R ** ** ** ** T × R ** ** ** ** AG, BG, CBH, and XYL indicate the activities of α-glucosidase, β-glucosidase, cellobiohydrolase, and endo-1,4-β-xylanase, respectively. Different lowercase letters show significant differences between treatments (p < 0.05). ** represent p < 0.01, respectively. In the subsoil, tillage and fertilizer also significantly influenced all four enzymes, though activity was generally lower than in the topsoil. BG activity was highest under NT and lowest under PT; after the application of a low rate of microbial organic fertilizer, BG activity reached 33.5 μmol d−1 g−1, representing a 13.9% increase compared with NTN (p < 0.05). CBH activity followed a pattern like AG, generally increasing with fertilizer. XYL activity varied most under NT, first increasing then decreasing, similar to PT, while under RT it decreased with higher fertilizer input.
-
Tillage practice and microbial organic fertilizer inputs jointly shaped the physical environment and nutrient supply of albic soils, thereby regulating SOC accumulation and stabilization. Across tillage treatments, fertilization improved soil physicochemical conditions, but the magnitude of responses varied with disturbance intensity and soil depth. Plough tillage and rotary tillage markedly alleviated compaction and increased porosity, with plough tillage showing a greater improvement in the subsoil, indicating that mechanical loosening can rapidly relieve key physical constraints in albic soils[22]. The resulting gains in aeration and rooting space likely facilitated nutrient redistribution and uptake, creating more favorable conditions for SOC turnover and retention. In contrast, no-tillage alone produced limited improvements in physical properties, yet combining no-tillage with microbial organic fertilizer still significantly reduced bulk density, suggesting that under low disturbance, exogenous organic inputs and microbially mediated processes can compensate for structural limitations.
Comparing straw return alone with straw plus microbial organic fertilizer further clarifies the incremental contribution of microbial organic fertilizer. Straw return alone improved some physicochemical properties and significantly increased AG and BG activities; however, except under plough tillage, SOC gains across 0–40 cm were limited and in some cases tended to decline. This pattern suggests that, in albic soils, straw inputs may preferentially accelerate decomposition without a proportional increase in stabilized carbon pools. The correlation network supports this interpretation, showing strong coupling among SOC, aggregate properties, and key enzymes. Previous work has linked elevated BG activity to enhanced mineralization of labile organic carbon, which can reduce net SOC accumulation[23]. Consistently, our results indicate that higher enzyme activities did not necessarily translate into greater SOC increases. Therefore, over short time scales, the carbon concentration benefit of straw return may be constrained by nutrient availability, decomposition intensity, and the capacity for aggregate-mediated protection.
Associations between extracellular enzyme activities, SOC concentration, and aggregate composition
-
The correlation networks in Fig. 5 showed significant associations among SOC concentration, aggregate characteristics, and extracellular enzyme activities, and these relationships varied with tillage practice and soil depth, suggesting that SOC dynamics are jointly regulated by substrate decomposition and the capacity for structural protection. In this study, AG and BG were generally positively associated with aggregate composition, indicating that enhanced glycoside-hydrolysis processes often coincided with aggregate reorganization[24,25]. However, AG and BG showed an overall negative association with SOC accumulation, implying that stronger decomposition-related activity did not translate into net SOC gains, potentially because faster turnover of labile substrates, together with insufficient protection, limited short-term stabilization of newly processed carbon. Compared with glycoside-hydrolysis enzymes, XYL and CBH better reflected whether depolymerization of structural substrates occurred alongside improvements in structural protection. In the tillage layer, XYL and CBH were negatively correlated with MWD, GMD, and LMC, and these negative relationships were more pronounced under rotary tillage, consistent with disturbance-driven aggregate disruption and greater substrate exposure that enhanced the decomposition of hemicellulose and cellulose. In contrast, under plough tillage, XYL and CBH in the tillage layer were positively correlated with SOC, indicating that higher enzyme activities were more likely to co-occur with increased residue incorporation and substrate supply rather than being driven solely by aggregate breakdown. In the subsoil, XYL and CBH were positively correlated with LMC but showed no significant relationship with SOC, suggesting that sub-tillage SOC may be more constrained by mineral association and physicochemical conditions, whereas enzyme activities more directly responded to the presence and processing of residue-derived carbon within macroaggregates.
Following microbial organic fertilizer application on top of straw return, the activity patterns of AG, BG, CBH, and XYL, as well as their associations with aggregate stability and SOC shifted, suggesting that microbial organic fertilizer may regulate carbon retention through functional complementarity among key inoculants. Bacillus subtilis may increase AG and BG and enhance particle cohesion via extracellular polymeric substances (EPS), thereby strengthening aggregate binding and creating structural niches for carbon occlusion[26]. Bacillus amyloliquefaciens may increase the availability of soluble carbon substrates and stimulate microbial growth, indirectly supporting glycoside-hydrolysis processes and microbial product formation that contribute to aggregate binding and carbon occlusion[27]. Consistent with the positive correlations between XYL, CBH, and SOC in the tillage layer under plough tillage, higher enzyme activities under greater residue incorporation may reflect increased substrate supply rather than carbon loss. Trichoderma harzianum may further promote depolymerization of cellulose and hemicellulose, strengthening CBH- and XYL-linked decomposition and sustaining substrate release[28]. This interpretation aligns with the frequent negative correlations of XYL and CBH with MWD, GMD, and LMC in the tillage layer, particularly under rotary tillage, where limited structural protection coincided with smaller aggregate size and lower macroaggregate carbon. Overall, the three dominant strains may have contributed jointly to shifts in enzyme activity, aggregate stability, and SOC accumulation through complementary effects on substrate depolymerization, microbial processing, and EPS-mediated structural protection. These inferences should, however, be interpreted cautiously because neither inoculant persistence nor strain-specific functional activity was directly measured. Likewise, the subsoil correlations do not directly resolve the mechanisms responsible for deep SOC accumulation, which may reflect the short-term nature of the experiment. Further work combining inoculant tracking (e.g., strain- or genus-specific qPCR and amplicon sequencing) with SOC fractionation, including both LMC and MAOC, is needed to disentangle the relative contributions of the three strains.
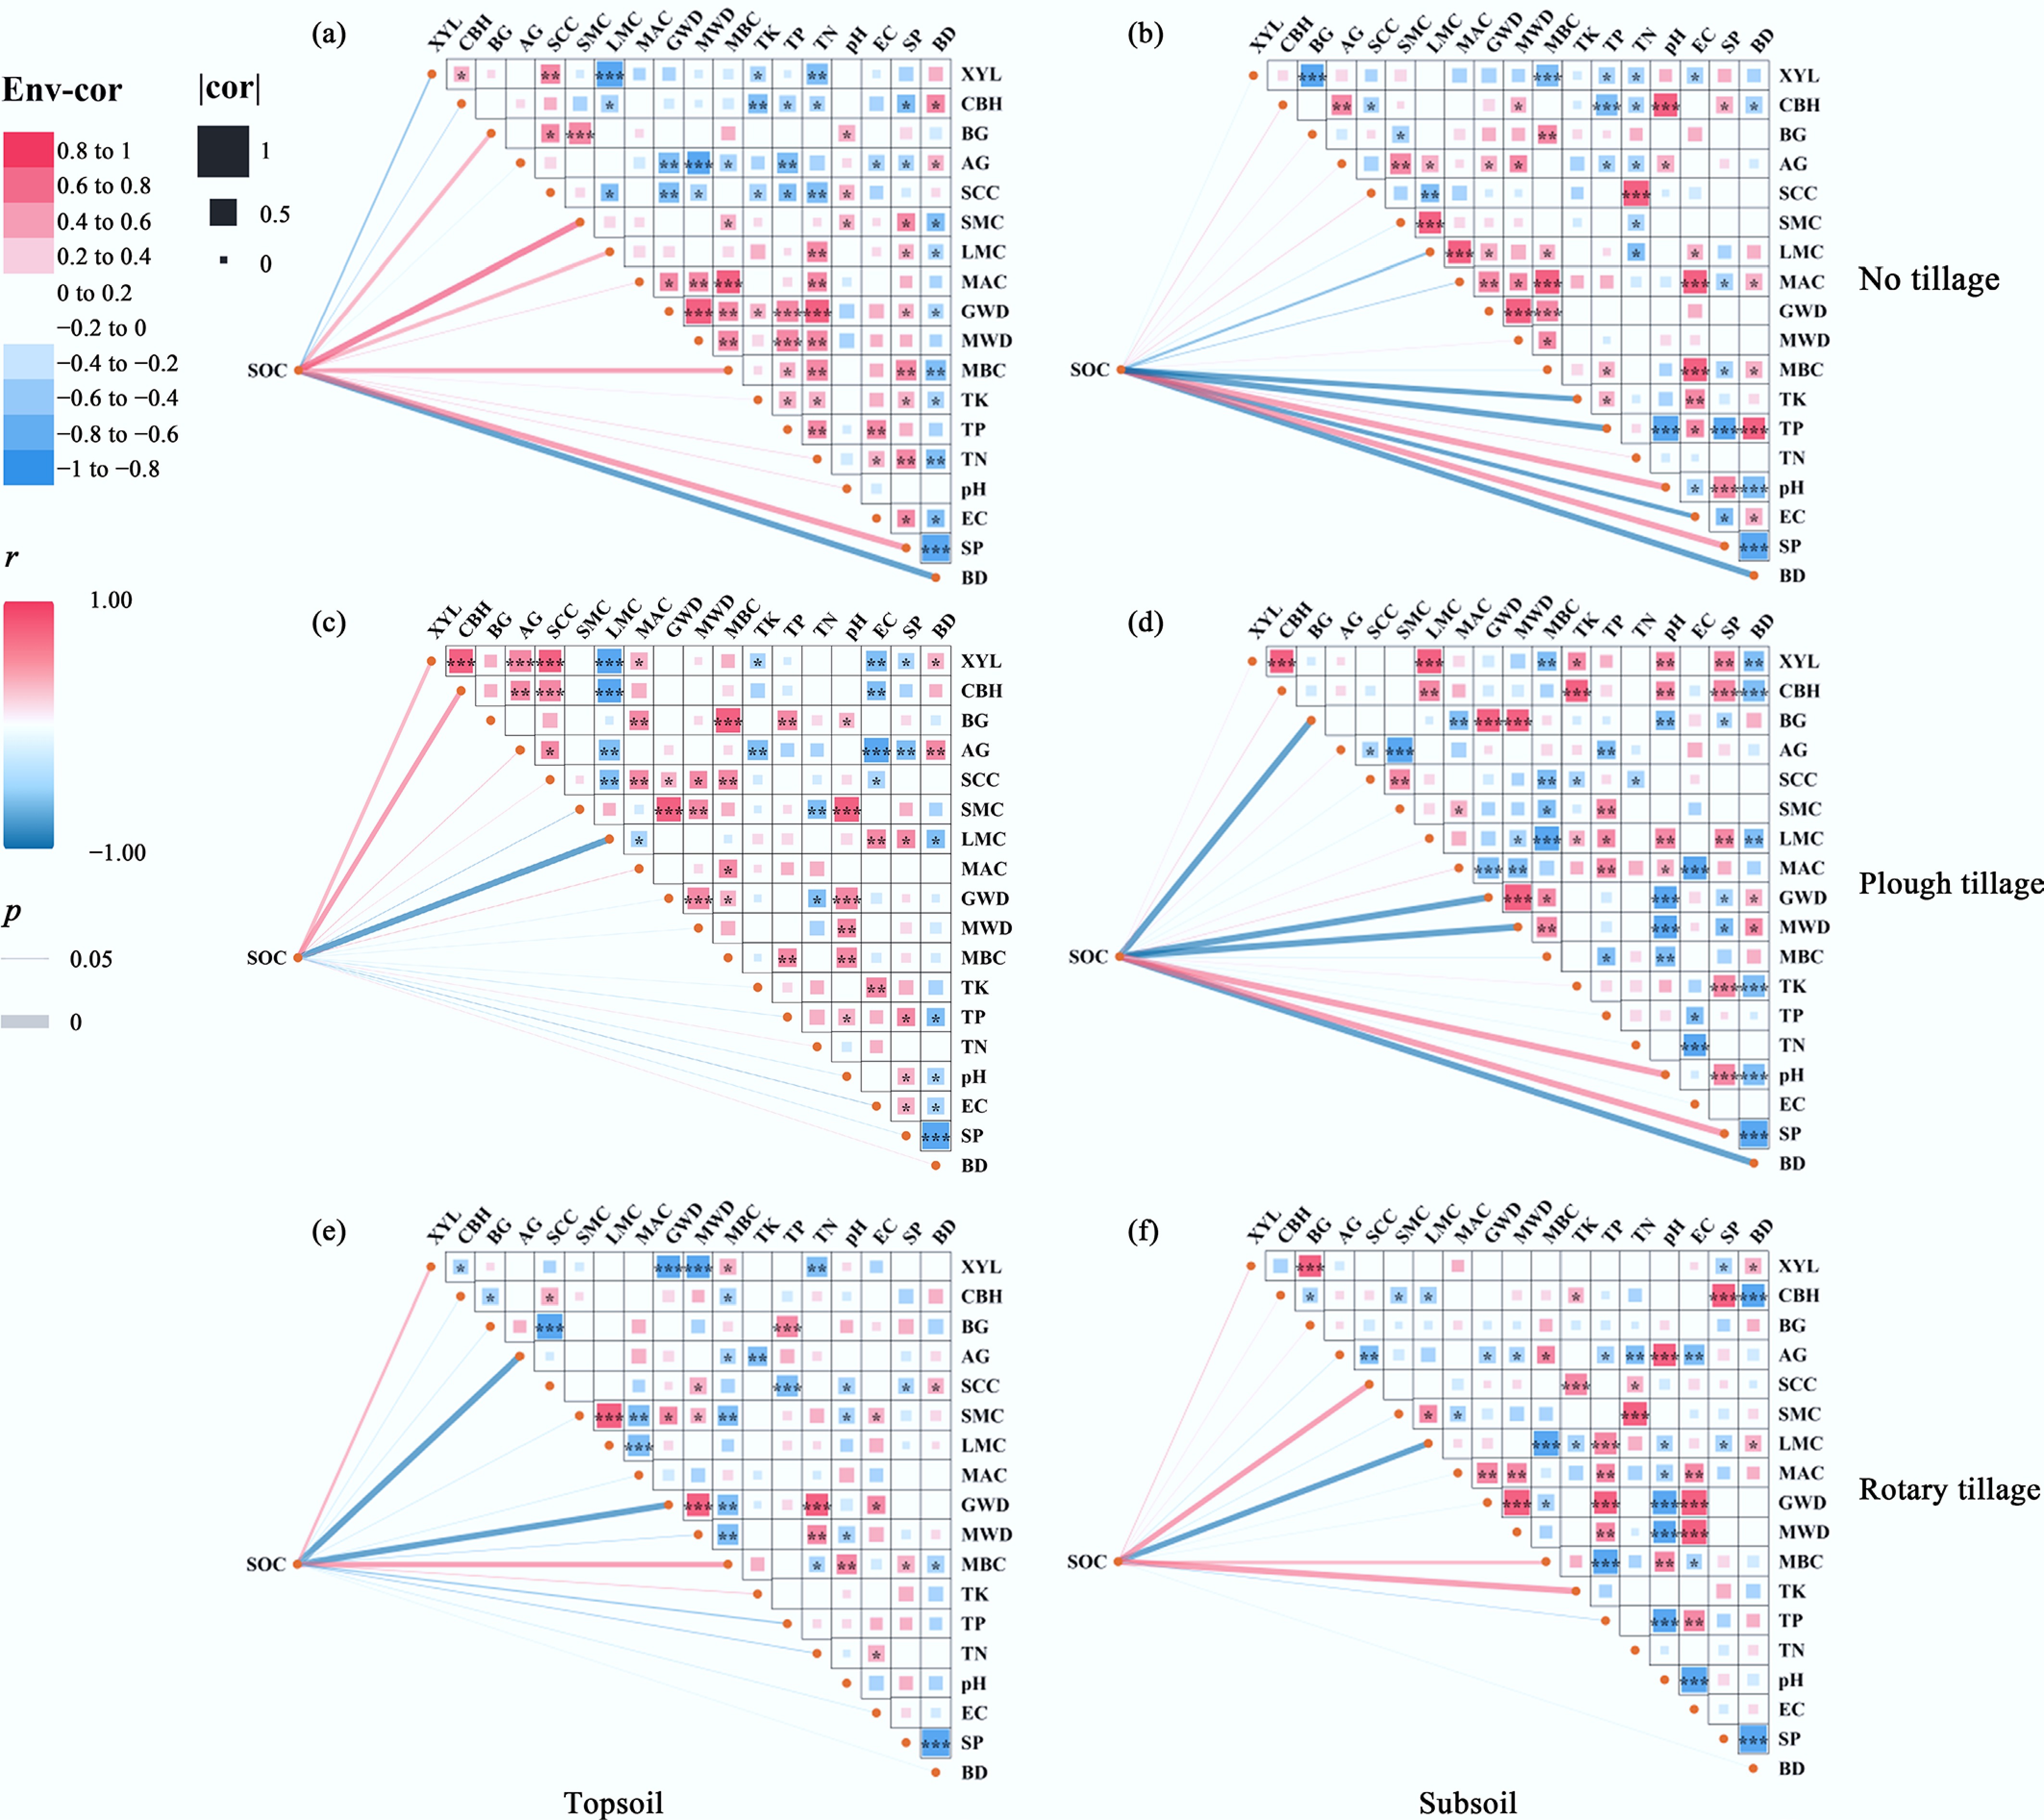
Figure 5.
Correlation network analysis of SOC in relation to tillage methods and microbial organic fertilizer application rates in the topsoil and subsoil. (a) and (b) represent NT topsoil and subsoil; (c) and (d) represent PT; (e) and (f) represent RT. The color scale ranges from −1 (blue, strong negative correlation) to +1 (red, strong positive correlation). Statistical significance is indicated by * (p < 0.05) , ** (p < 0.01), and *** (p < 0.001).
-
This one-year field experiment shows that tillage practice and microbial organic fertilizer rate jointly regulate SOC concentration in albic soil by altering physical constraints, aggregate structure, and extracellular enzyme activities. No-tillage combined with straw return and the high input rate produced the largest SOC gain in the surface layer and increased SOC across 0–40 cm, whereas plough tillage favored SOC increases in the subsoil but often reduced macroaggregate stability, indicating a potential trade-off between deep SOC accumulation and aggregate-mediated physical protection. By comparing straw return alone with straw return plus microbial organic fertilizer, we further show that microbial organic fertilizer provides an incremental benefit beyond straw inputs. This benefit may arise from direct exogenous carbon inputs and from shifts in carbohydrate-degrading enzymes linked to residue transformation and stabilization. Given the short duration of the experiment and the lack of inoculant-tracing evidence, longer-term monitoring combined with SOC fractionation and inoculant tracking (e.g., strain- or genus-specific qPCR and amplicon sequencing) is needed to confirm persistence and underlying mechanisms.
-
The authors confirm contributions to the paper as follows: Zhenlin Zhao: conceptualization, methodology, visualization, writing; Song Cheng: resources; Xiaolin Li: resources; Chang Zhang: writing; Ximing Liu: methodology, writing − review & editing; Jinyao Yan: methodology, writing − review & editing; Jingchao Yuan: writing − review & editing; Jianzhao Liu: resources, supervision; Yao Liang: resources, conceptualization, methodology, supervision; Wei Fan: investigation, conceptualization, methodology, visualization, writing − review & editing, supervision, funding acquisition; Hongguang Cai: investigation, conceptualization, methodology, resources, supervision. All authors reviewed the results and approved the final version of the manuscript.
-
All data generated or analyzed during this study are included in this published article.
-
This work was supported by the National Key Research and Development Program of China (Grant No. 2023YFD1501100), the Natural Science Foundation of Jilin Province, China (Grant No. 20220301018NY), and the 7th Batch of Jilin Province's Project to Support Young Science and Technology Talents (Grant No. QT202318).
-
The authors declare that they have no conflict of interest.
-
Full list of author information is available at the end of the article.
- Copyright: © 2026 by the author(s). Published by Maximum Academic Press, Fayetteville, GA. This article is an open access article distributed under Creative Commons Attribution License (CC BY 4.0), visit https://creativecommons.org/licenses/by/4.0/.
-
About this article
Cite this article
Zhao Z, Cheng S, Li X, Zhang C, Liu X, et al. 2026. Tillage methods and microbial fertilizers synergistically enhance soil organic carbon concentration in albic soil. Agricultural Ecology and Environment 2: e016 doi: 10.48130/aee-0026-0013 

Tillage methods and microbial fertilizers synergistically enhance soil organic carbon concentration in albic soil
- Received: 14 November 2025
- Revised: 13 April 2026
- Accepted: 29 April 2026
- Published online: 28 May 2026
Abstract: Albic soils often exhibit high bulk density and low organic matter content, which constrains soil organic carbon (SOC) accumulation and aggregate development. A one-year field experiment (2023–2024) in Shulan, Jilin Province (China) evaluated how tillage intensity and microbial organic fertilizer rate jointly regulate SOC, aggregate size stability, and carbon-cycling extracellular enzymes across two depths (0–20 and 20–40 cm). Three tillage practices—no-tillage (NT), plough tillage (PT), and rotary tillage (RT)—were combined with three microbial organic fertilizer rates (600, 1,200, and 2,400 kg ha−1). NT without straw return served as the control. The tillage methods with microbial organic fertilizer interactions improved soil physicochemical conditions (lower bulk density and higher porosity and nutrient status) with depth-dependent responses. Under NT, the high microbial organic fertilizer rate increased SOC by 22% in the topsoil and by 93% in the subsoil relative to the control, indicating that reduced disturbance coupled with high rates of microbial organic inputs can promote SOC accumulation throughout 0–40 cm. Aggregate responses were treatment-specific: NT generally maintained a higher proportion and stability of macroaggregates, whereas PT tended to increase subsoil SOC but reduce macroaggregate stability, suggesting a trade-off between deep SOC gains and aggregate-based physical protection. Enzyme activities (AG, BG, CBH, and XYL) and correlation networks indicated that the dominant associations varied with depth. Topsoil SOC showed closer links with microbial indicators and aggregate properties, while subsoil SOC was more related to physicochemical constraints. Overall, conservation tillage (especially NT) combined with adequate microbial organic fertilizer inputs shows short-term potential to enhance SOC in Albic soils, while longer-term monitoring is needed to assess persistence and mechanisms.
-
Key words:
- Soil organic carbon /
- Organic fertilizers /
- Tillage methods /
- Carbon concentration /
- Albic soil