-
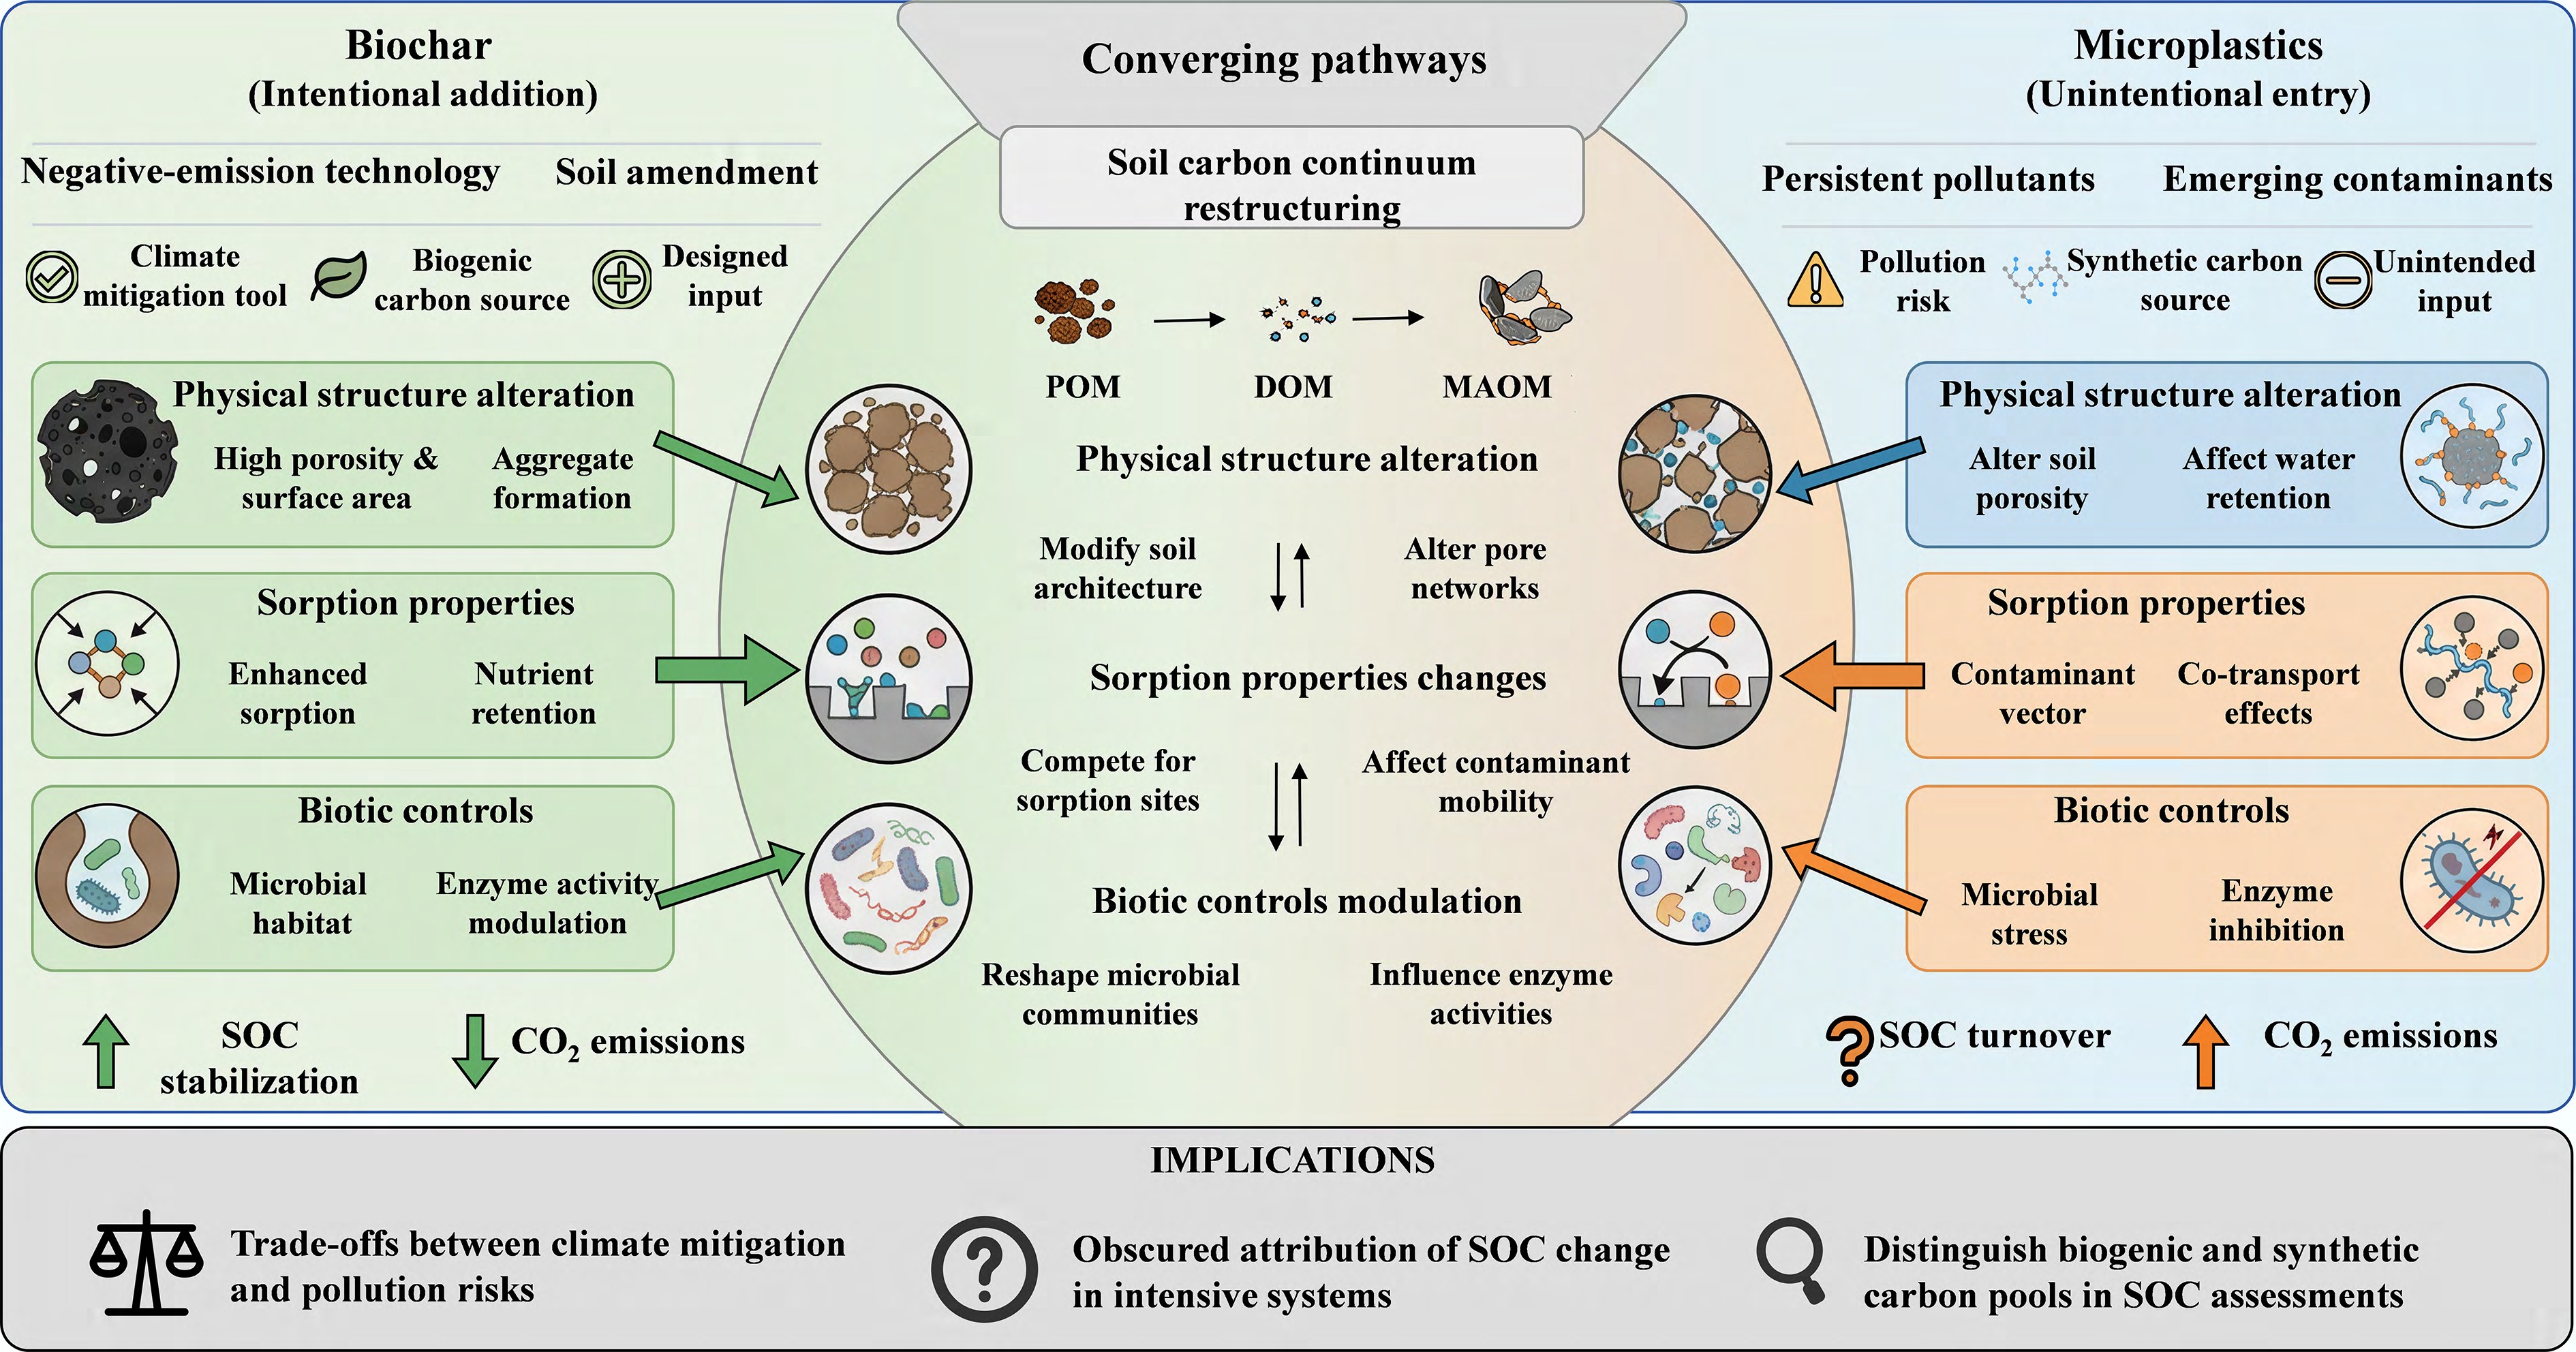
Figure 1.
Contrasting and converging pathways by which biochar and MPs reshape SOC stocks and fluxes. Biochar is intentionally added as a negative-emission technology and soil amendment, whereas MPs enter soils largely unintentionally as persistent pollutants. Despite this contrast, both act as persistent carbonaceous particles that enter the soil carbon continuum and alter physical structure, sorption properties, and biotic controls on SOC turnover, thereby influencing the formation, stabilization, and mineralization of SOC and associated CO2 emissions. In the central overlap, biochar and MPs co-occur in many intensively managed systems, jointly restructuring the continuum from particulate organic matter to dissolved and mineral-associated forms. This unified framework highlights trade-offs between climate mitigation and emerging pollution risks, obscures attribution of SOC change and associated climate feedbacks in intensive systems, and underscores the need to distinguish biogenic and synthetic carbon pools in SOC assessments and models.
-
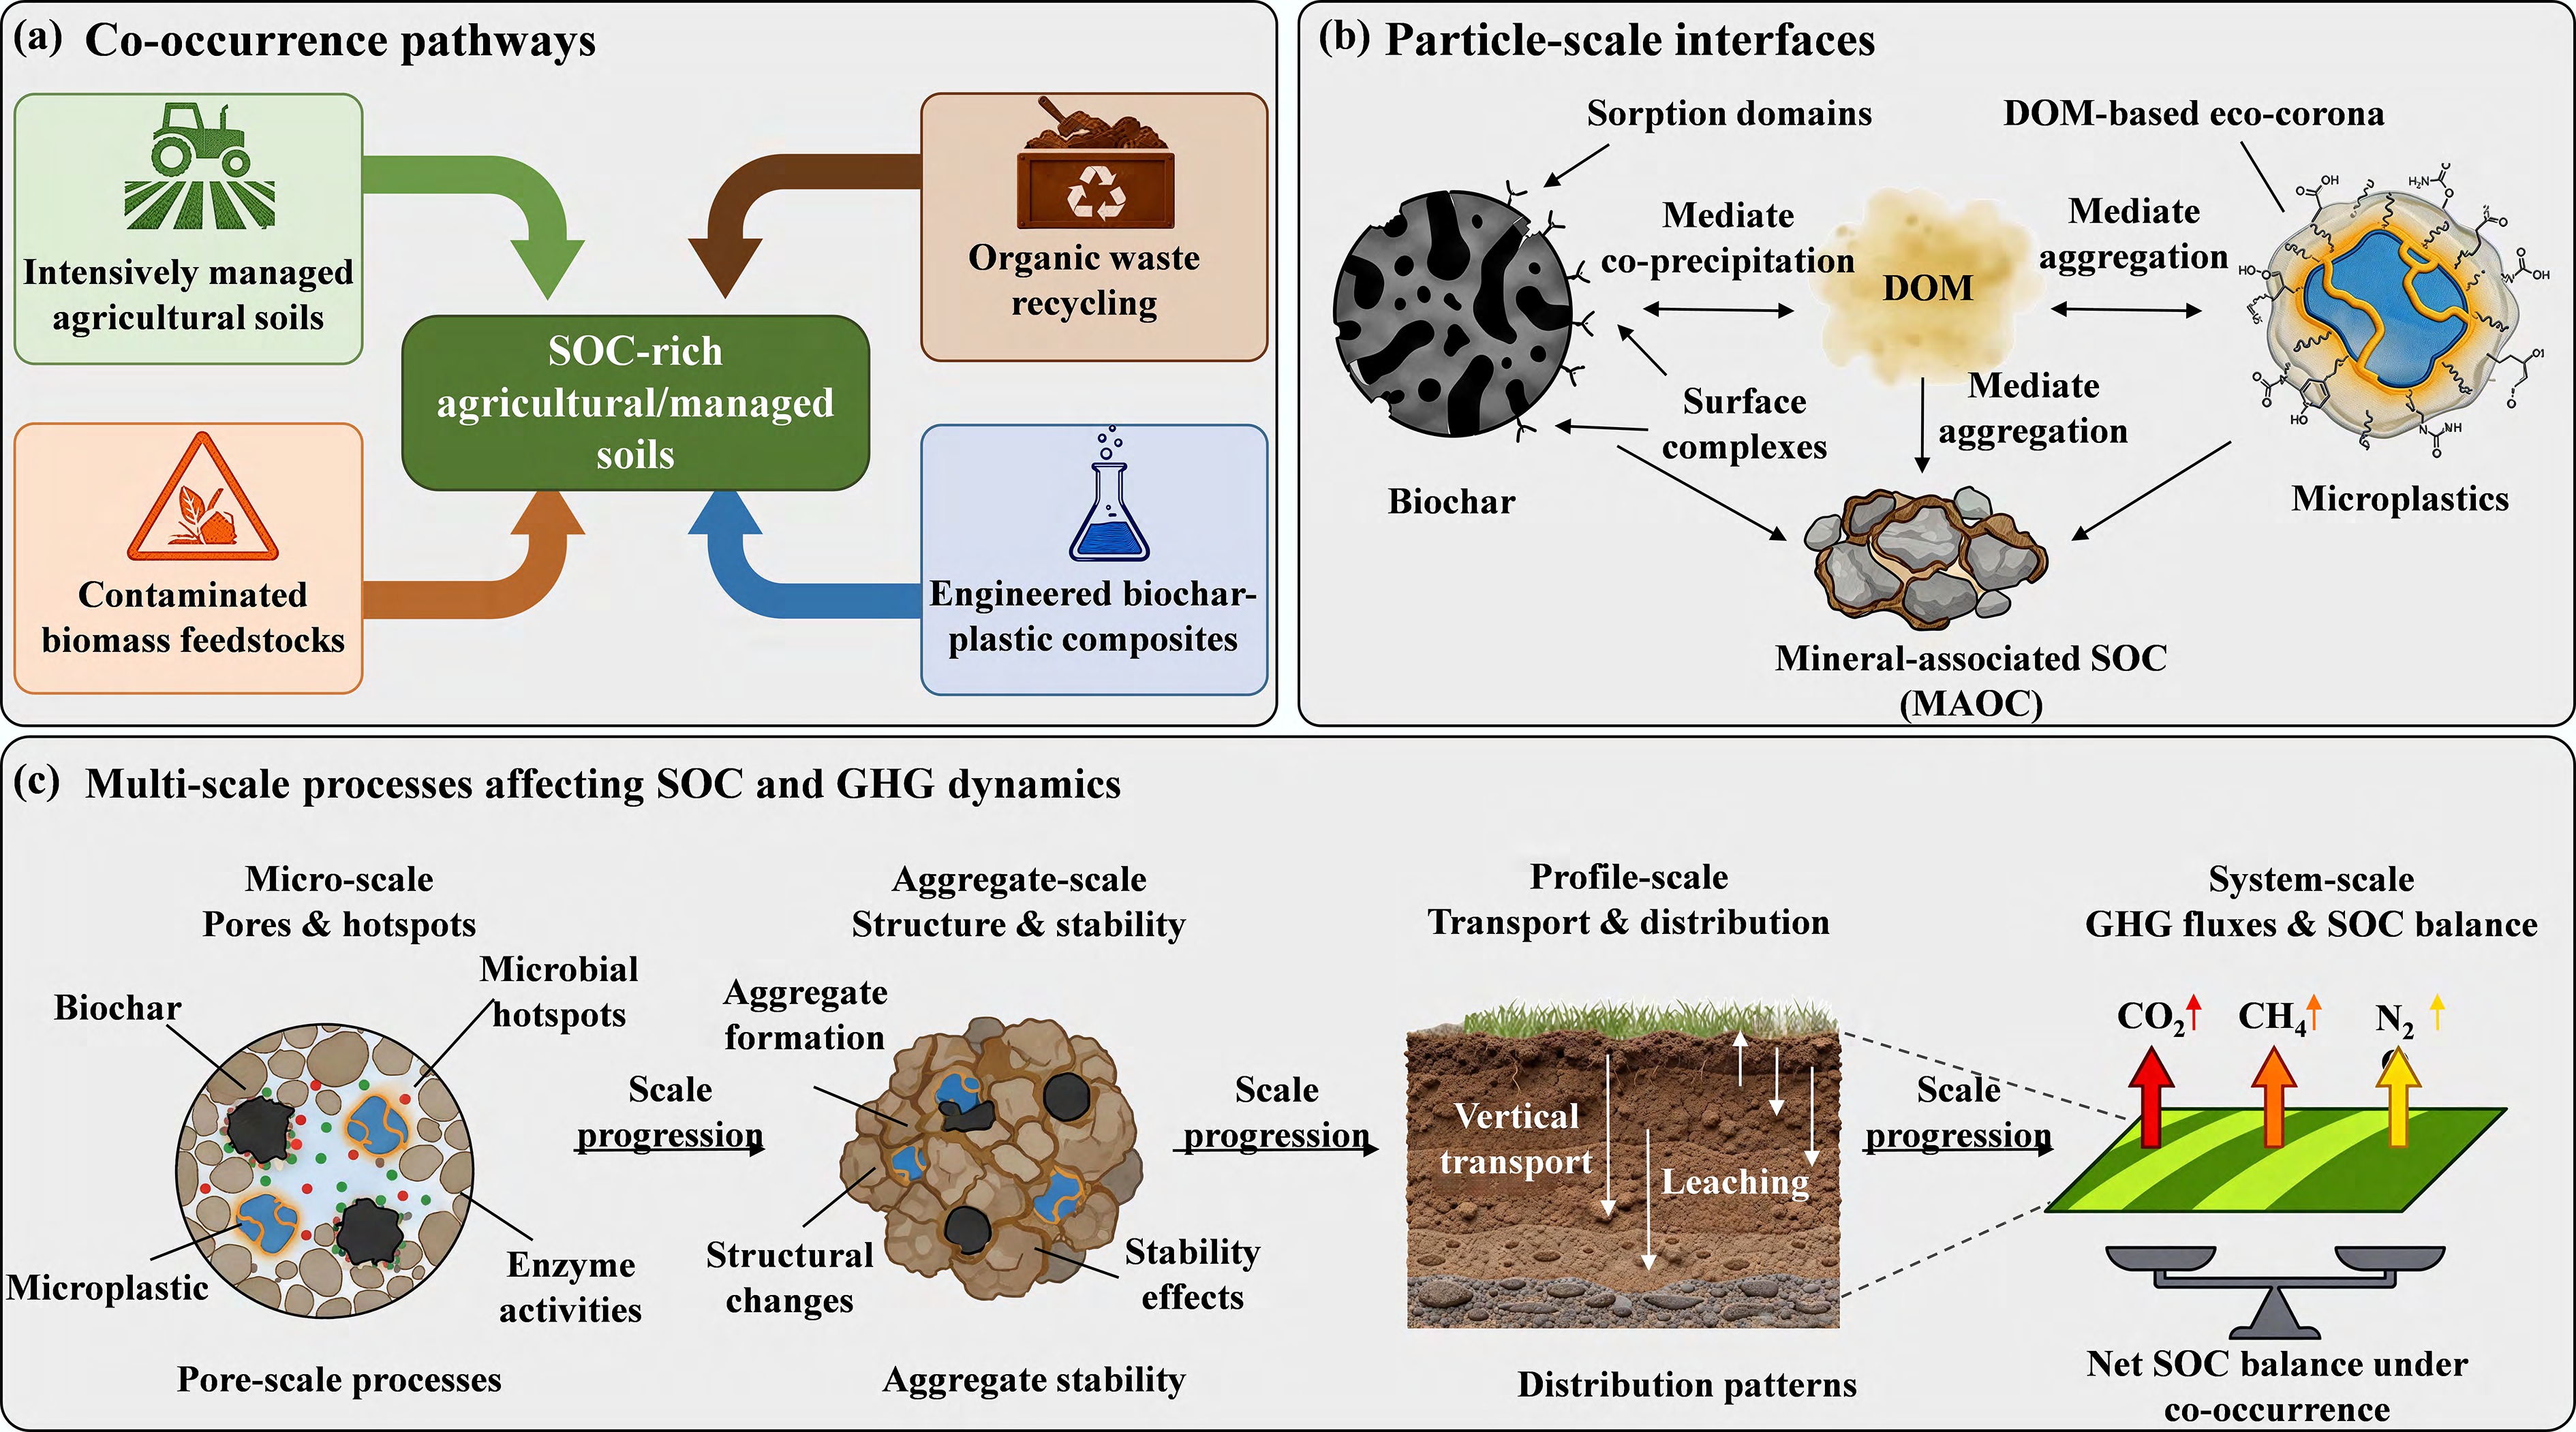
Figure 2.
Conceptual framework linking co-occurrence scenarios, particle-scale interfaces, and multi-scale processes of biochar–MPs-SOC interactions. (a) Pathways by which biochar and MPs co-occur in soils, including intensively managed agricultural soils, organic waste recycling, contaminated biomass feedstocks, and engineered biochar-plastic composites, converge on SOC-rich agricultural/managed soils. (b) Particle-scale interfaces among biochar, microplastics, DOM, and mineral-associated SOC. Biochar forms sorption domains and surface complexes, MPs develop DOM-based eco-coronas, and DOM mediates co-precipitation and aggregation that influence MAOC formation. (c) Multi-scale processes through which these interfaces affect SOC and greenhouse gas (GHG) dynamics, from micro-scale pores and hotspots, through aggregate- and profile-scale changes in structure and transport, to system-scale CO2, CH4, and N2O fluxes and net SOC balance under co-occurrence.
-
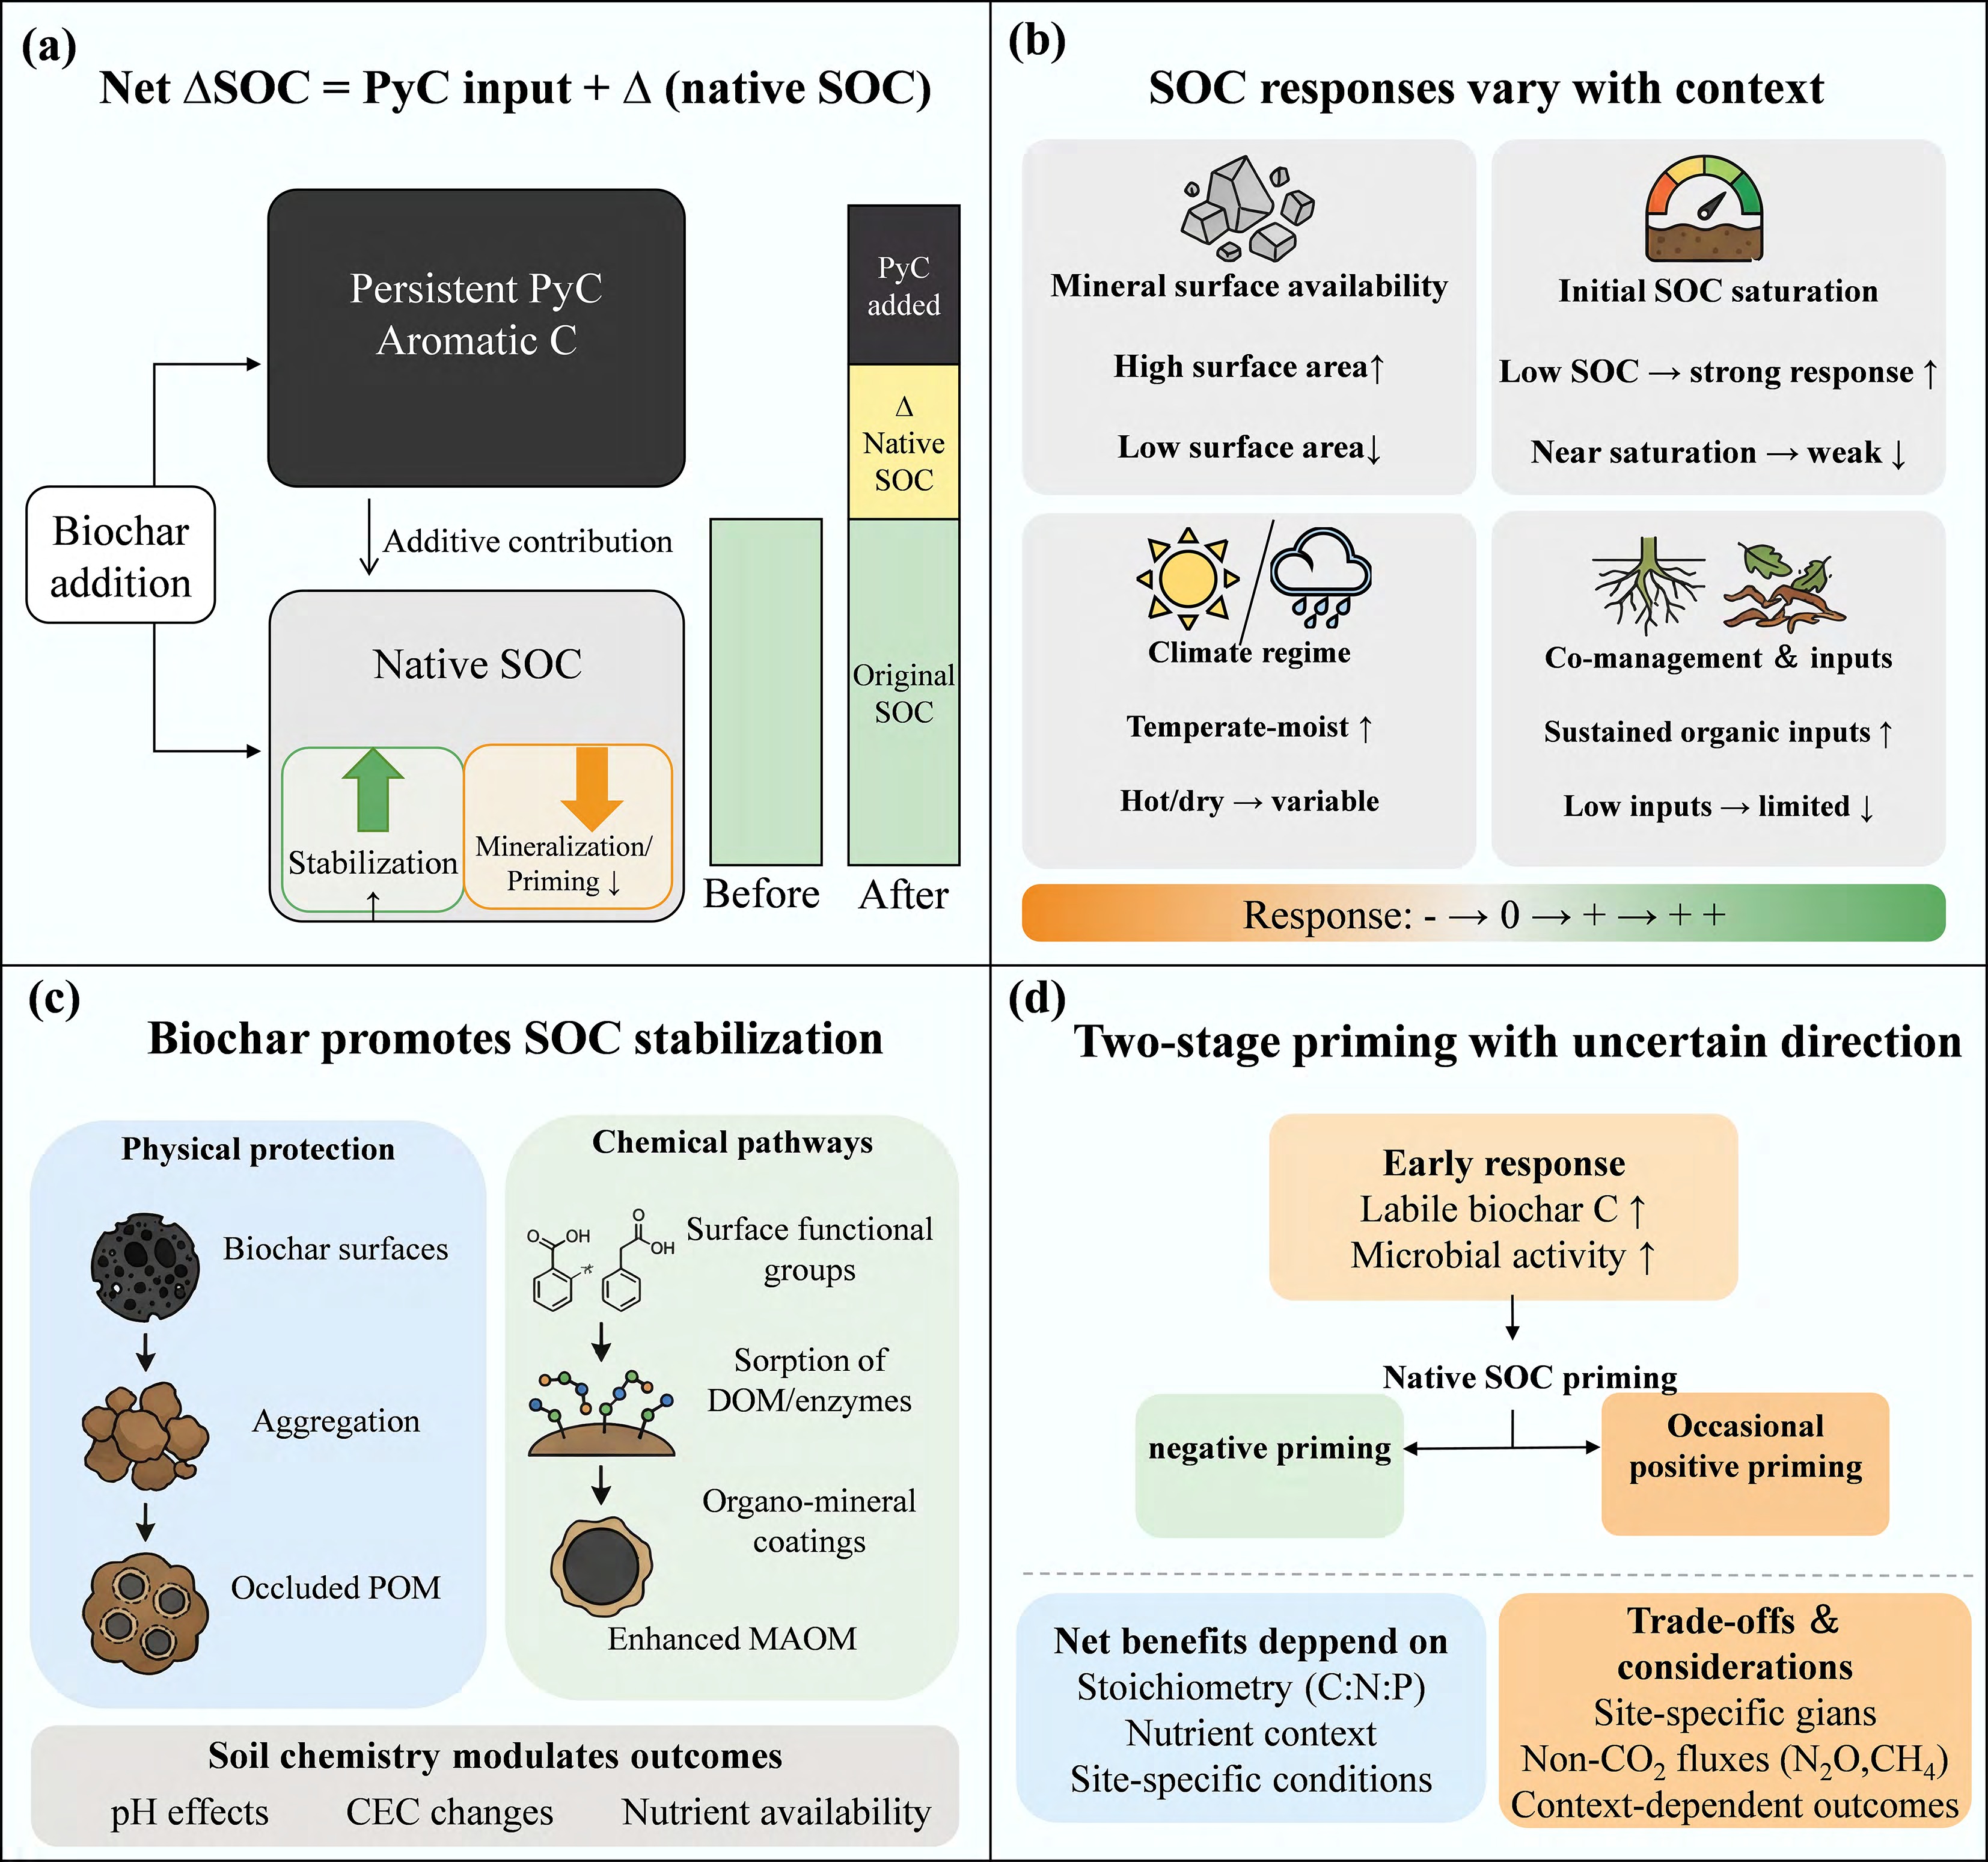
Figure 3.
Conceptual synthesis of biochar impacts on SOC stocks. (a) Net SOC change reflects the additive contribution of persistent PyC and context-dependent changes in native SOC (stabilization vs mineralization/priming). (b) SOC responses vary with mineral surface availability, initial SOC saturation status, climate regime, and co-management sustaining organic inputs. (c) Biochar promotes SOC stabilization via physical protection (aggregation and occluded POM) and chemical pathways (sorption and organo-mineral coatings enhancing MAOM), with soil chemistry (pH/CEC/nutrients) modulating outcomes. (d) Priming is often dynamic (early CO2 pulse followed by neutral/negative effects), and net benefits depend on stoichiometry and nutrient context, with site-specific gains and trade-offs requiring consideration of non-CO2 fluxes.
-
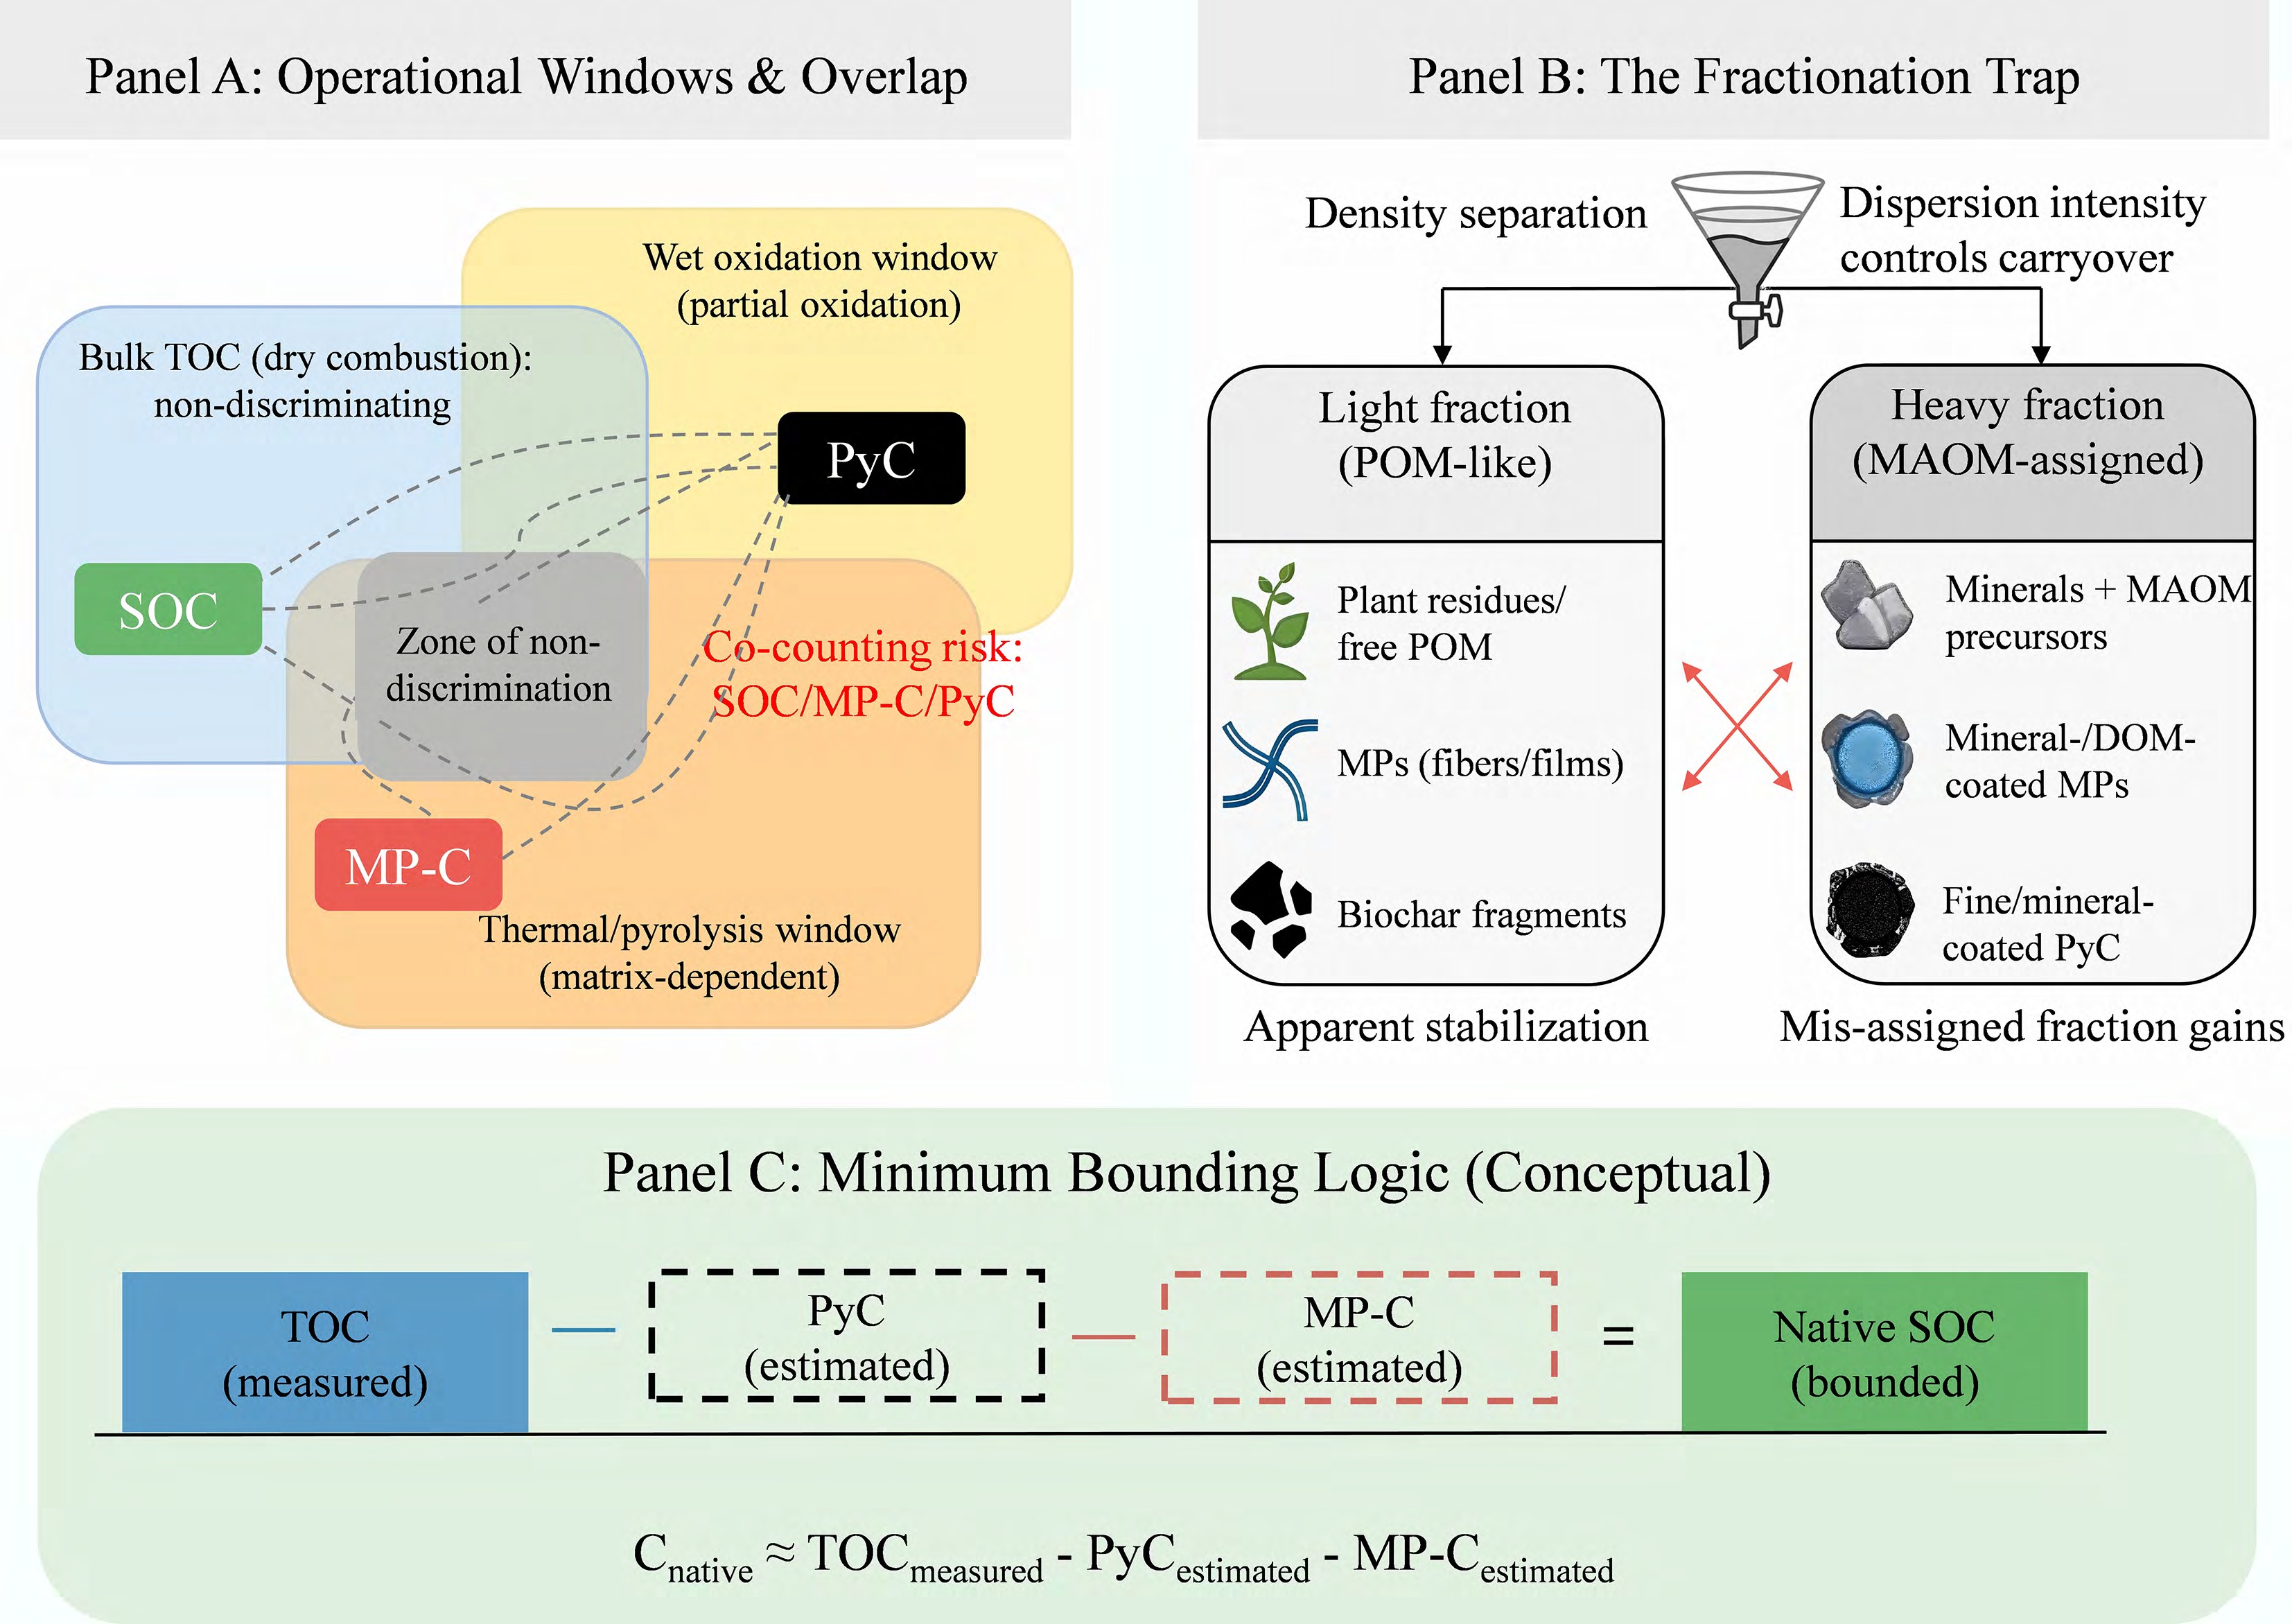
Figure 4.
Analytical artifacts and misclassification pathways in biochar–MPs-soil systems. (Panel A) Operational windows and overlap. Native biogenic SOC, pyrogenic carbon (PyC, biochar-derived and related forms), and polymeric carbon from MPs (MPs-C) can co-occur and be co-counted because common bulk-carbon assays and operational oxidation/thermal pyrolysis window do not uniquely discriminate among these phases. Their overlap defines a zone of non-discrimination, in which apparent changes in 'SOC/TOC' may reflect admixture and method-defined recoveries rather than a true change in native SOC persistence. Dashed links indicate potential co-counting under each operational window (schematic, not to scale). (Panel B) The fractionation trap. During operational fractionation (e.g., density separation followed by POM/MAOM partitioning), low-density MPs (fibers/films) and biochar fragments can be co-recovered in the light fraction (POM-like), whereas mineral-/DOM-coated MPs and fine or mineral-coated PyC can be carried over into the heavy fraction that is often interpreted as MAOM. Such co-recovery and carryover can generate apparent stabilization and mis-assigned fraction gains unless fractions are screened for polymer- and PyC-derived contributions. (Panel C) Minimum bounding logic (conceptual). To interpret native SOC in co-occurring systems, measured total carbon should be treated as a composite metric, and native SOC should be evaluated as a bounded estimate by subtracting independently quantified PyC and MPs-C. This panel illustrates the correction logic rather than a prescriptive protocol.
-
Agricultural context Dominant MPs features Representative abundance reported
in agricultural surveysTypical field state Implication for factorial experiments Plastic-mulched, greenhouse, or irrigation-intensive systems PE/PP films, fragments, and fibers derived from mulch films, drip lines, and greenhouse plastics Commonly within the upper agricultural range, often 103 to > 105 particles kg−1 and from tens of mg kg−1 to g kg−1, depending strongly on method and management Mostly weathered; topsoil-enriched and spatially heterogeneous Prioritize aged PE/PP fragments and fibers, legacy topsoil placement, and realistic rather than pristine inputs Organic-waste amended systems (sludge, compost, manure-associated inputs) More compositionally diverse mixtures, including PE, PP, PET, PS, and fiber-rich materials Broad but measurable backgrounds that commonly fall within 102 to 104 particles kg−1 and mg kg−1 to g kg−1 ranges, with strong source dependence Mixed aged and less-aged particles; pulsed rather than purely legacy inputs Use polymer mixtures, fiber-rich treatments, and pulsed co-input scenarios rather than single-polymer additions only General intensively managed cropland background Heterogeneous legacy residues, secondary fragments, fibers, and weathered surface-oxidized particles Overall cropland surveys span about 102 to > 105 particles kg−1 and from tens of mg kg−1 to g kg−1 Aged, weathered, and patchily distributed across the plough layer Constrain experiments with realistic loading ranges, weathering state, and management history The abundance values are intended as field-relevant orders of magnitude synthesized from agricultural surveys; they remain strongly method-dependent because size cutoffs, extraction procedures, and polymer-identification methods differ among studies[3−7]. Table 1.
Representative field-relevant microplastic backgrounds in agricultural soils where biochar is likely to be deployed or evaluated
-
Mechanism Scale Key indicators Expected direction Boundary conditions Methods and MRV notes Ref. Plastic use → fragmentation → MPs accumulation Field/profile MPs abundance; polymer types; size spectrum MPs ↑ over time Intensive croplands; mulch/greenhouse; tillage and UV aging Extraction and ID bias; size cutoffs; density separation limits [3] Biochar → aggregation and physical protection pathways Aggregate WSA; MWD; aggregate-associated C WSA ↑; protected C ↑ Texture and dose dependent; feedstock/pyrolysis T Fractionation logic needed; biochar particles may be
co-recovered[18] MPs → aggregate disruption/pore reconfiguration Aggregate/profile WSA; bulk density; pore metrics WSA ↓ or ± Strongly depends on shape (fiber/film), loading, texture, moisture Physical shifts may precede SOC response; report MPs shape and dose [19] Sorption/partitioning at biochar interfaces → DOM routing changes Micro (particle–solution) DOC; SUVA254; fluorescence indices DOC bioavailability ↓ or ± Depends on biochar surface chemistry/ash; DOM type; aging Sorption ≠ stabilization; distinguish solution loss vs mineral association [8] MPs affect DOM transport/mobilization (DOC export and routing) Micro→profile DOC flux; DOM composition DOC transport ↑ or ± Polymer type and aging; colloids; flow regime Filtration pore size and DOC methods bias signals; MPs-leachates confound [20] MPs alter soil C cycling and microbial processes (synthesis-level evidence) Micro→system CO2, CH4; microbial metrics/CO2, CH4 CO2 ↑ and CH4 ↓, but ± Plastic type/size/dose; moisture and texture Strong scale dependence; report dose (w/w) and exposure time [21] Non-additive outcomes under biochar × MPs co-occurrence Microcosm/incubation Cumulative CO2; priming index Non-additive common (±) Requires factorial design; biochar × MPs × soil context Must test interaction term; avoid single-factor inference [15] Co-occurrence reshapes GHG trade-offs (CO2–CH4–N2O) System CO2, CH4, N2O; GWP Direction ± (trade-offs frequent) Redox + N availability govern sign If using GWP, state time horizon; report moisture/redox [15−17] Paddy/flooded soils: MPs perturb CH4/N2O processes System (redox) CH4, N2O flux; redox proxies Direction ±; flooding-dependent Flooding regime + substrate + soil type Record redox proxies (Eh, DO, Fe[II]) and flooding duration/regime. [22] SOM 'continuum' view: accessibility > intrinsic recalcitrance Conceptual Accessibility proxies; mineral association Emphasizes context dependence Universal theory anchor Avoid 'recalcitrance-only' framing; stress accessibility/protection [23] MRV bias: MPs carbon inflates operational SOC (chemical oxidation) MRV Walkley–Black/dichromate SOC SOC overestimation risk ↑ MPs-contaminated soils; low native SOC higher risk Must declare artifact; use blanks/parallel methods [24] MRV bias: biochar/PyC causes 'CDR double counting' risk MRV/accounting PyC quantification; attribution logic Over-crediting risk ↑ Biochar-amended soils; project accounting contexts Separate native SOC change vs exogenous PyC stock [25] This table synthesizes cross-scale pathways by which biochar and microplastics (MPs) co-occur in agricultural soils and jointly shape soil organic carbon (SOC) formation, stabilization, and mineralization, highlighting where methodological artefacts and attribution errors can bias SOC and greenhouse-gas (GHG) assessments. Scale indicates the primary level of observation (particle–solution, aggregate/pore, soil profile/field, system flux, or MRV/accounting). Expected direction (↑, ↓, ±) is relative to appropriate controls; ± denotes strong context dependence. Boundary conditions summarize dominant controls on response magnitude/sign. Methods and MRV notes flag key biases (e.g., fractionation co-recovery, DOM/DOC method artefacts, and misclassification of exogenous pyrogenic/polymeric C as 'operational SOC'). SOC, soil organic carbon; SOM, soil organic matter; MPs, microplastics; DOM, dissolved organic matter; DOC, dissolved organic carbon; SUVA254, specific ultraviolet absorbance at 254 nm; WSA, water-stable aggregates; MWD, mean weight diameter; MAOM, mineral-associated organic matter; Ksat, saturated hydraulic conductivity; CUE, carbon use efficiency; GHG, greenhouse gases; CO2, carbon dioxide; CH4, methane; N2O, nitrous oxide; GWP, global warming potential; MRV, measurement, reporting and verification; PyC, pyrogenic carbon; Eh, redox potential; DO, dissolved oxygen; Fe(II), ferrous iron; CDR, carbon dioxide removal. Table 2.
Mechanism–scale evidence matrix linking biochar–microplastic co-occurrence to soil organic carbon dynamics and measurement, reporting, and verification (MRV) risks
-
To understand the risk microplastics pose to carbon accounting (MRV), one must define the components of measured soil carbon. In a co-contaminated system, the measured Total Organic Carbon (TOCmeasured) is: $ TO{C}_{measured}={C}_{native}+{C}_{PyC}+{C}_{MP}\text{+ϵ} $ where, Cnative is biogenic SOC, CPyC is pyrogenic carbon (if biochar is applied), and CMP is the polymeric carbon from microplastics. The risk: Without specific separation, standard protocols count CMP as soil carbon. The reality: High CMP loads can mask a decline in Cnative, creating a 'false positive' signal of sequestration. Table 3.
The accounting dilemma (conceptual equation)
-
Under co-occurrence, at least three persistent carbon phases, native biogenic SOC, PyC, and polymer-derived MPs-C, can be co-counted by routine carbon assays and co-recovered during fractionation. This checklist defines a minimum reporting/evidence structure to reduce misclassification, support mechanistic attribution, improve cross-study comparability, and enable MRV-relevant interpretation. A. System definition and boundary conditions Biochar description Feedstock, pyrolysis temperature, residence time, ash content, pH, H/C and O/C (or elemental ratios), particle size, application rate. Microplastic description Polymer type (PE/PP/PS/PET, etc.), morphology (fiber/film/fragment/bead), size range, pristine vs weathered/aged, and loading. Soil background Texture, pH, Fe/Al oxide or clay + silt content (as mineral-capacity proxies), initial SOC/TOC, moisture, and redox regime (upland vs flooded/periodically reducing). B. PyC quantification (state the analytical 'window') PyC method and targeted pool Specify BPCA/HyPy/solid-state13C NMR/thermal methods, and state which PyC domain is captured (operational window). QA/quality metrics Recovery, precision/replicates, reference materials/standards where applicable, and key QA notes. Isotopes/tracers (if used) 13C and 14C or compound-specific isotopes, target, assumptions, and boundaries (mandatory if used for apportionment). C. Microplastic quantification and identification (align endpoint with inference) Pre-treatment and separation Sieve cutoffs, density medium, and density, digestion approach (H2O2/Fenton/enzymatic), and their potential impacts on polymer integrity. Identification and thresholds µ-FTIR/µ-Raman match criteria and size detection limits, or Py-GC/MS markers and quantification strategy. QA/QC essentials Procedural blanks, contamination control (especially fibers), polymer-specific spike-recovery, false-positive control. Reported endpoints Number-based (counts per mass, plus size/shape distributions) and/or mass-based (mg kg−1 polymer mass). If TOC/SOC-based conclusions or MRV are involved, mass-based metrics and MPs-C bounding are strongly recommended. D. SOC/TOC and fractionation safeguards ('misclassification protection') Total carbon statement Report TC/TOC method (dry combustion vs wet oxidation, etc.) and whether MPs-C and PyC are included, if used for sequestration claims, specify the bounding/correction approach. Fraction verification For POM/MAOM (or free/occluded) fractions, verify PyC and polymer signals in key fractions (e.g., BPCA/HyPy markers for PyC, Py-GC/MS or spectroscopy for polymers) to detect co-recovery/carryover. Carbon saturation boundaries If using saturation concepts, define the operational MAOM pool, mineral-capacity proxy, and provide evidence that MAOM changes are not driven by fine biochar fragments or nano-/microplastic carryover. E. Attribution and MRV minimum evidence Three-phase bounding Report or bound Cnative ≈ TOC − PyC − MPs-C (at least provide PyC and MPs quantification, or defensible upper/lower bounds). Process–endpoint pairing Pair ≥ 1 process indicator (CO2/CH4/N2O, porewater DOC, enzymes/microbial biomass) with ≥ 1 stabilization endpoint (POM/MAOM, necromass markers, organo-mineral association evidence). Reusable metadata Moisture/temperature regime, application timing/method, sampling depth/time, and effect-size/statistical model reporting sufficient for meta-analysis and MRV scrutiny. Table 4.
Minimum evidentiary checklist to bound native SOC in biochar–microplastic co-occurring systems (recommended reporting items)
Figures
(4)
Tables
(4)