-
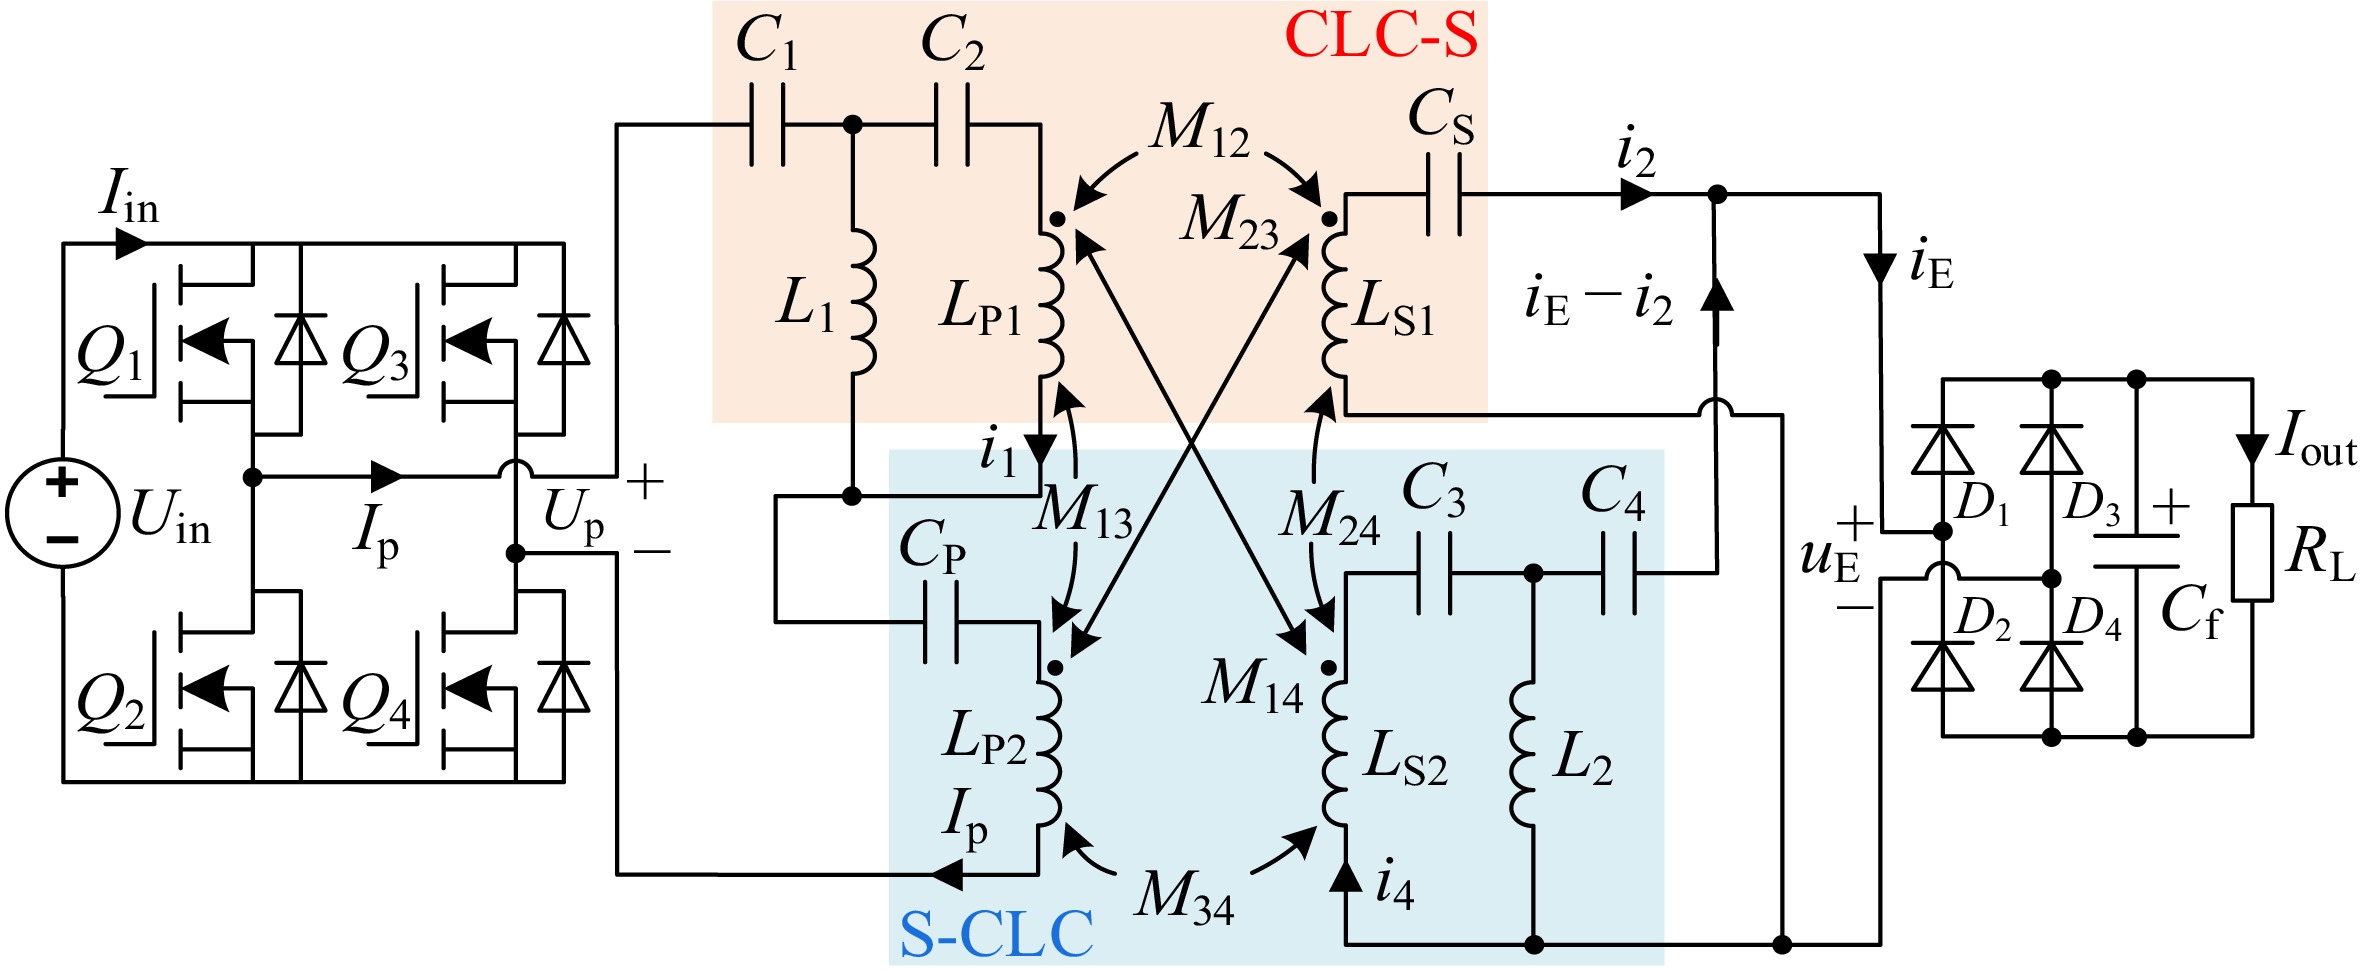
Figure 1.
Schematic circuit diagram of the WPT system with hybrid topology.
-
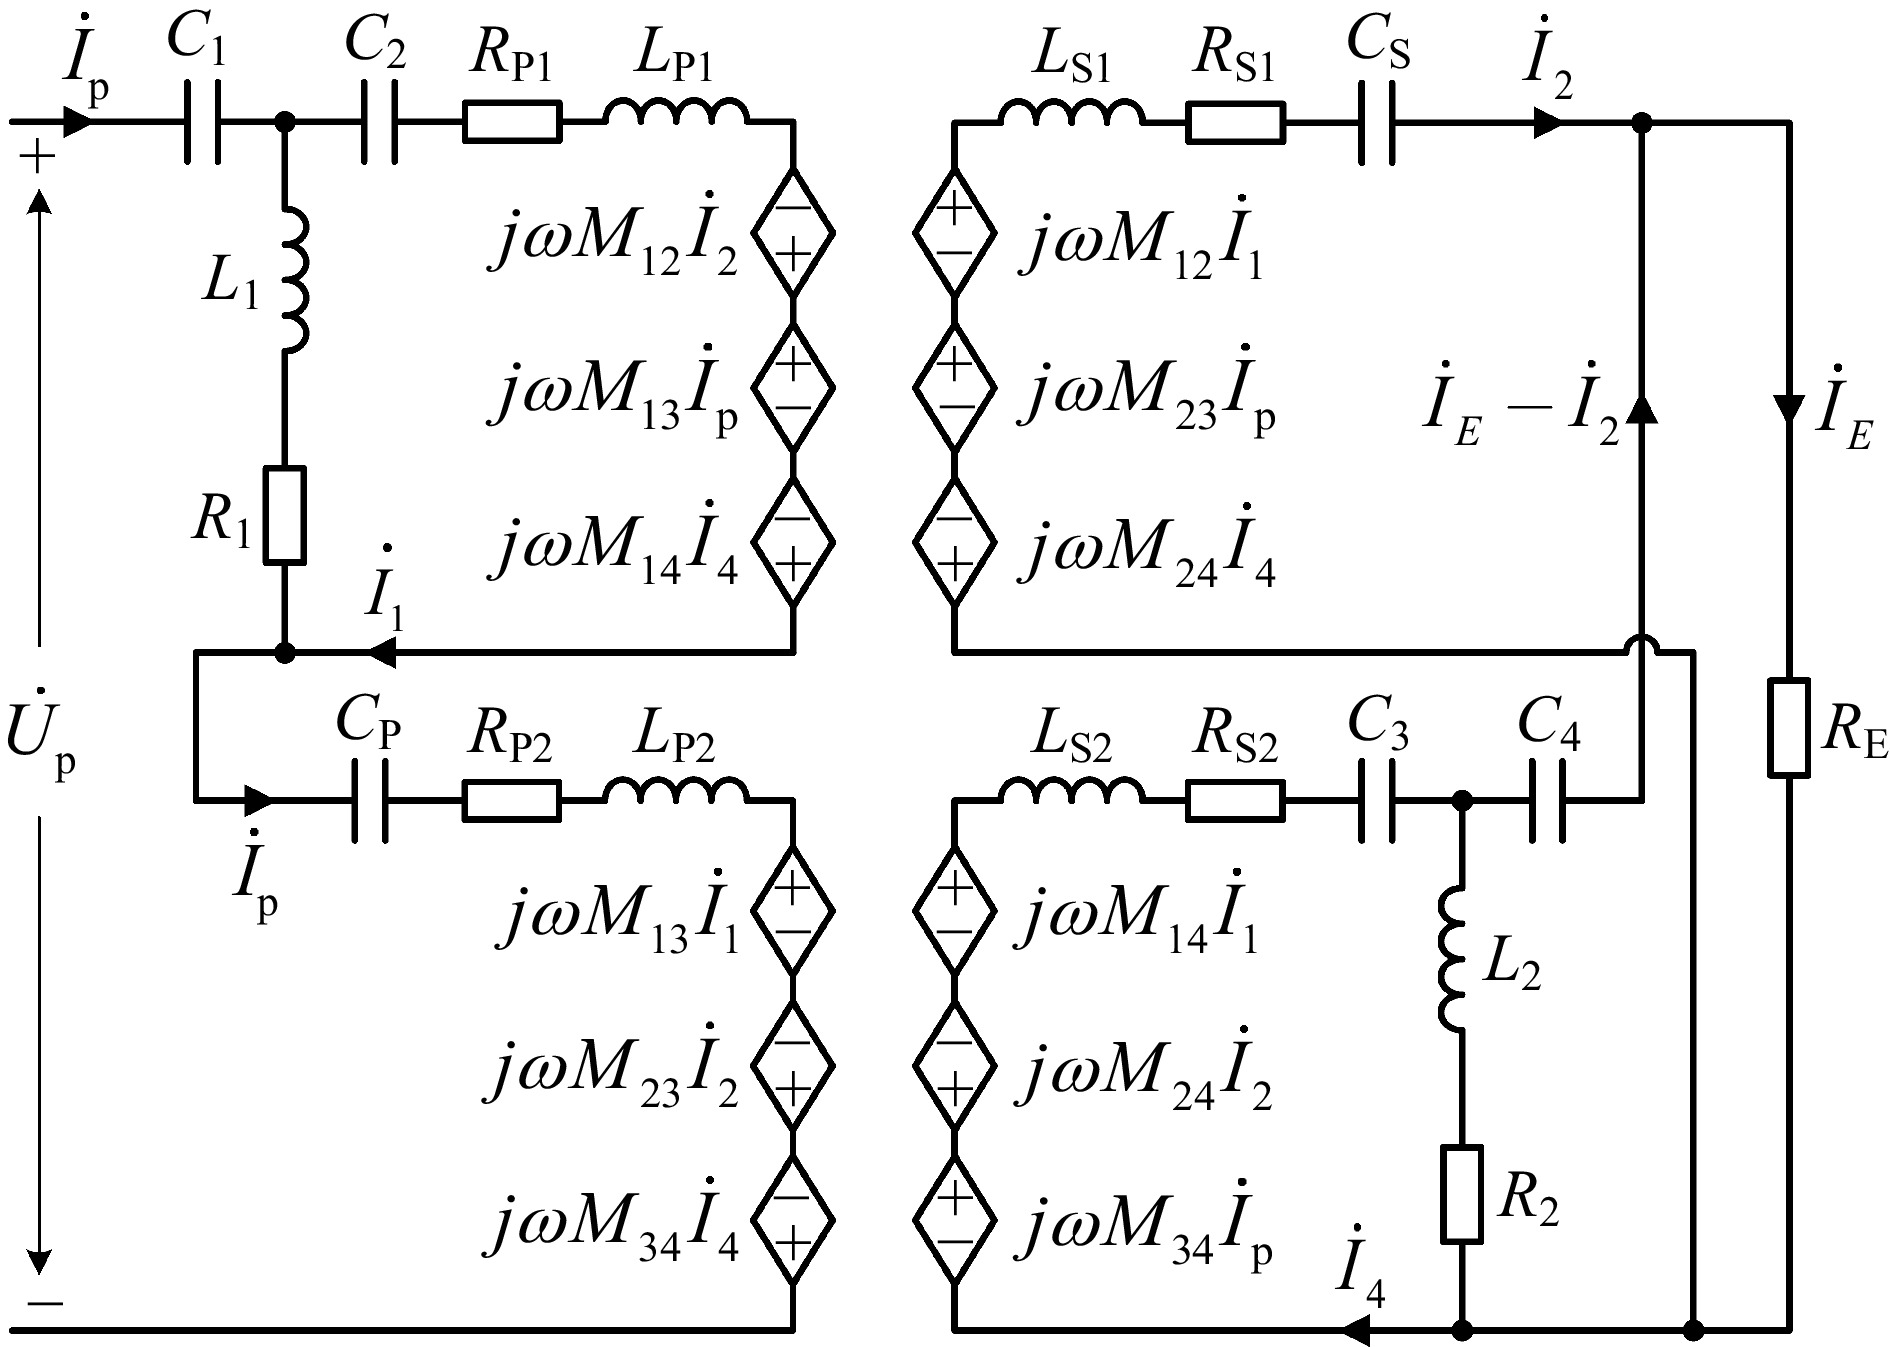
Figure 2.
The equivalent circuit model of the WPT system with a hybrid topology.
-
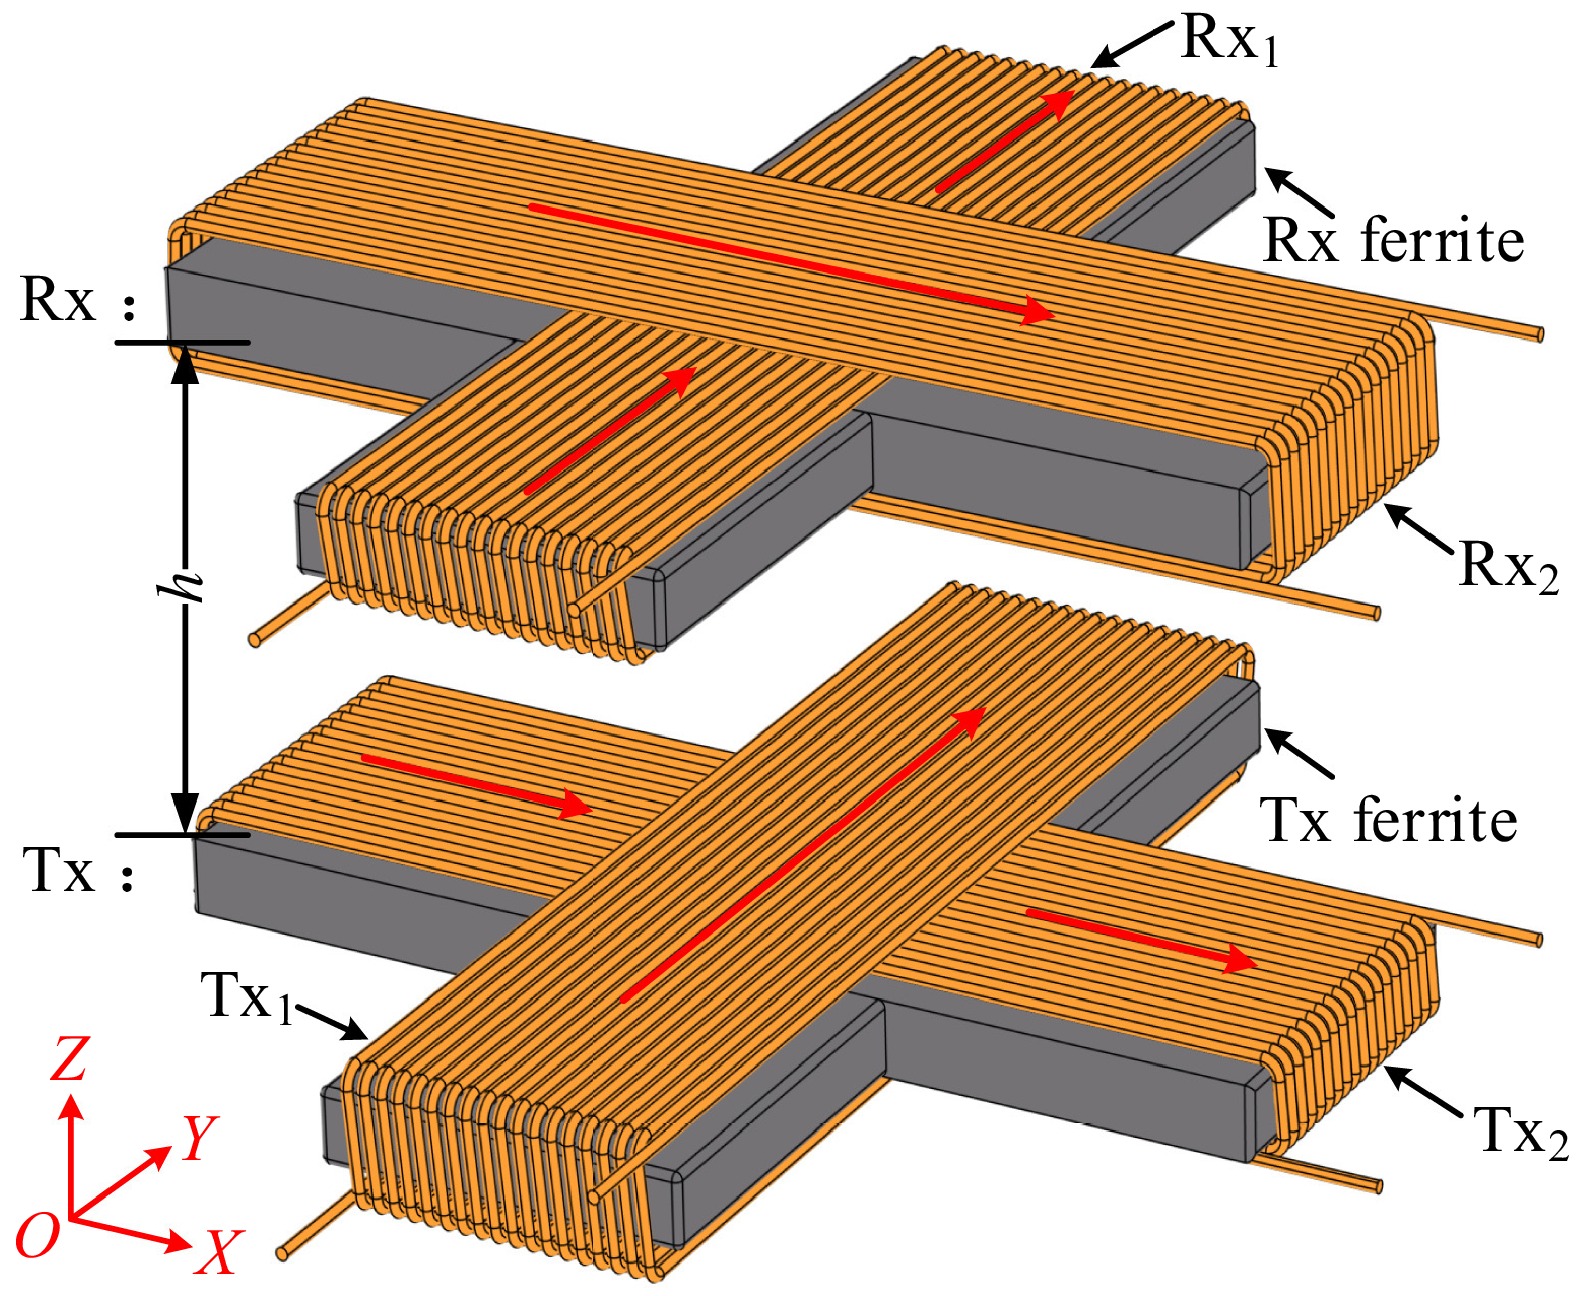
Figure 3.
Self-decoupling cross coil.
-
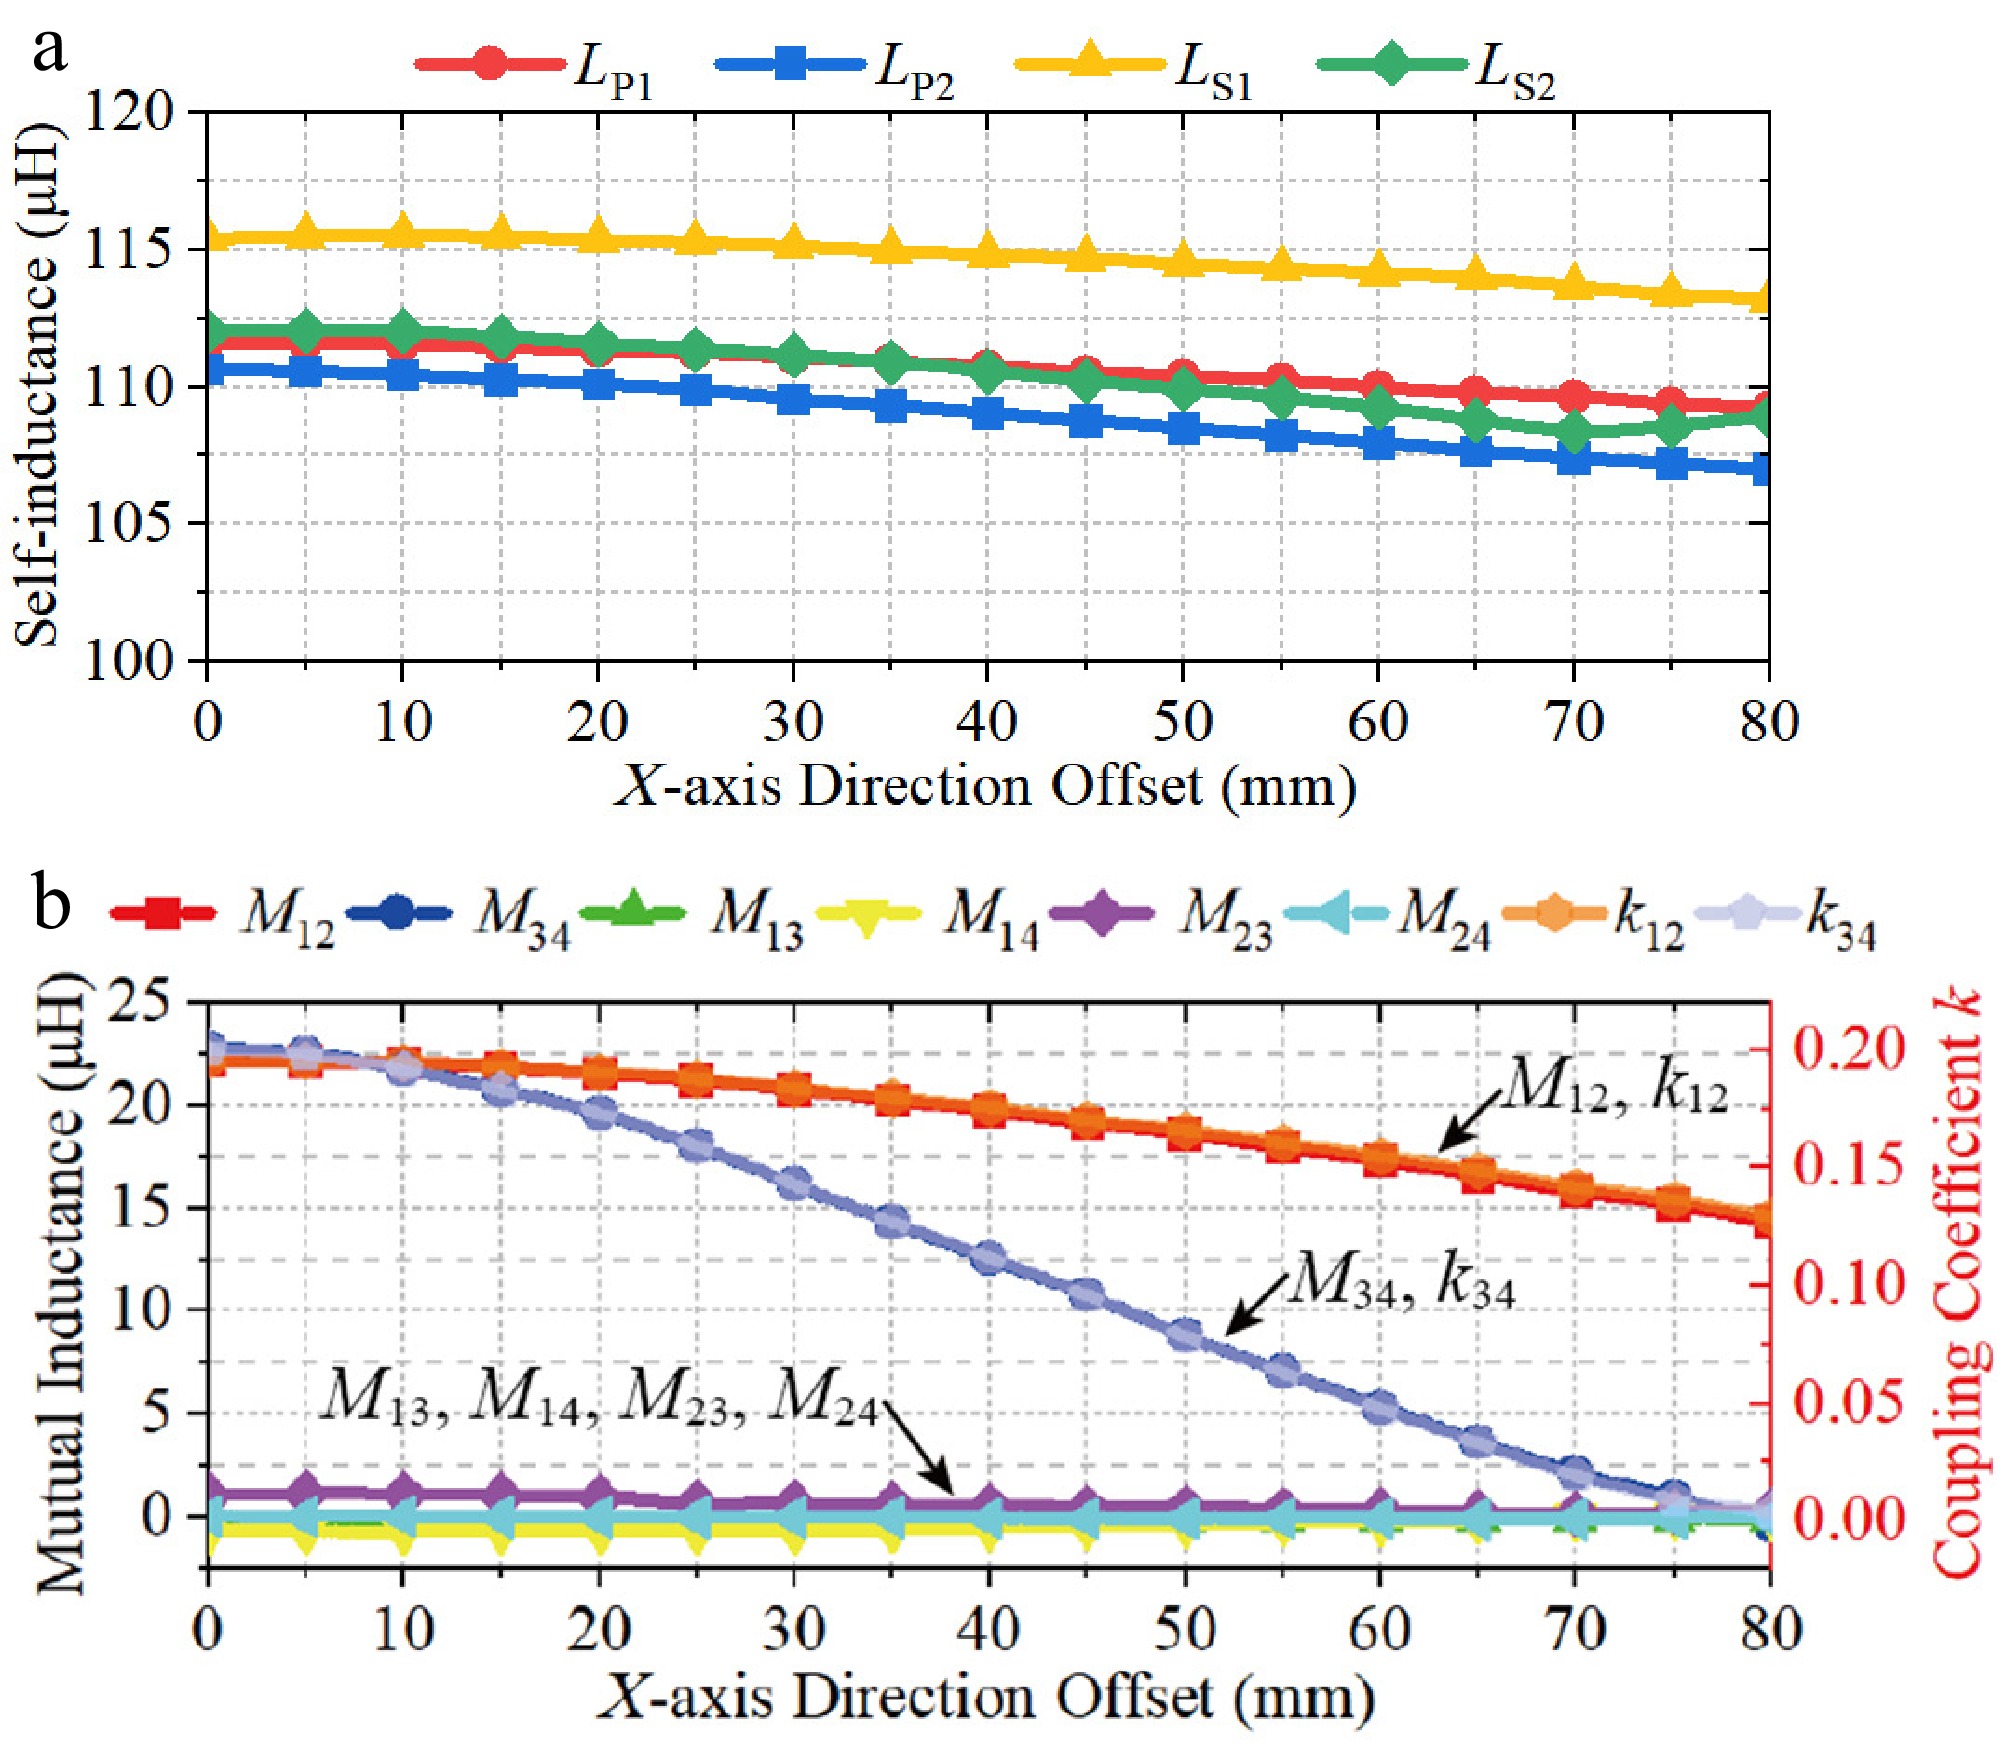
Figure 4.
X-axis direction offset. (a) Self-inductance. (b) Mutual inductance and coupling coefficient k.
-
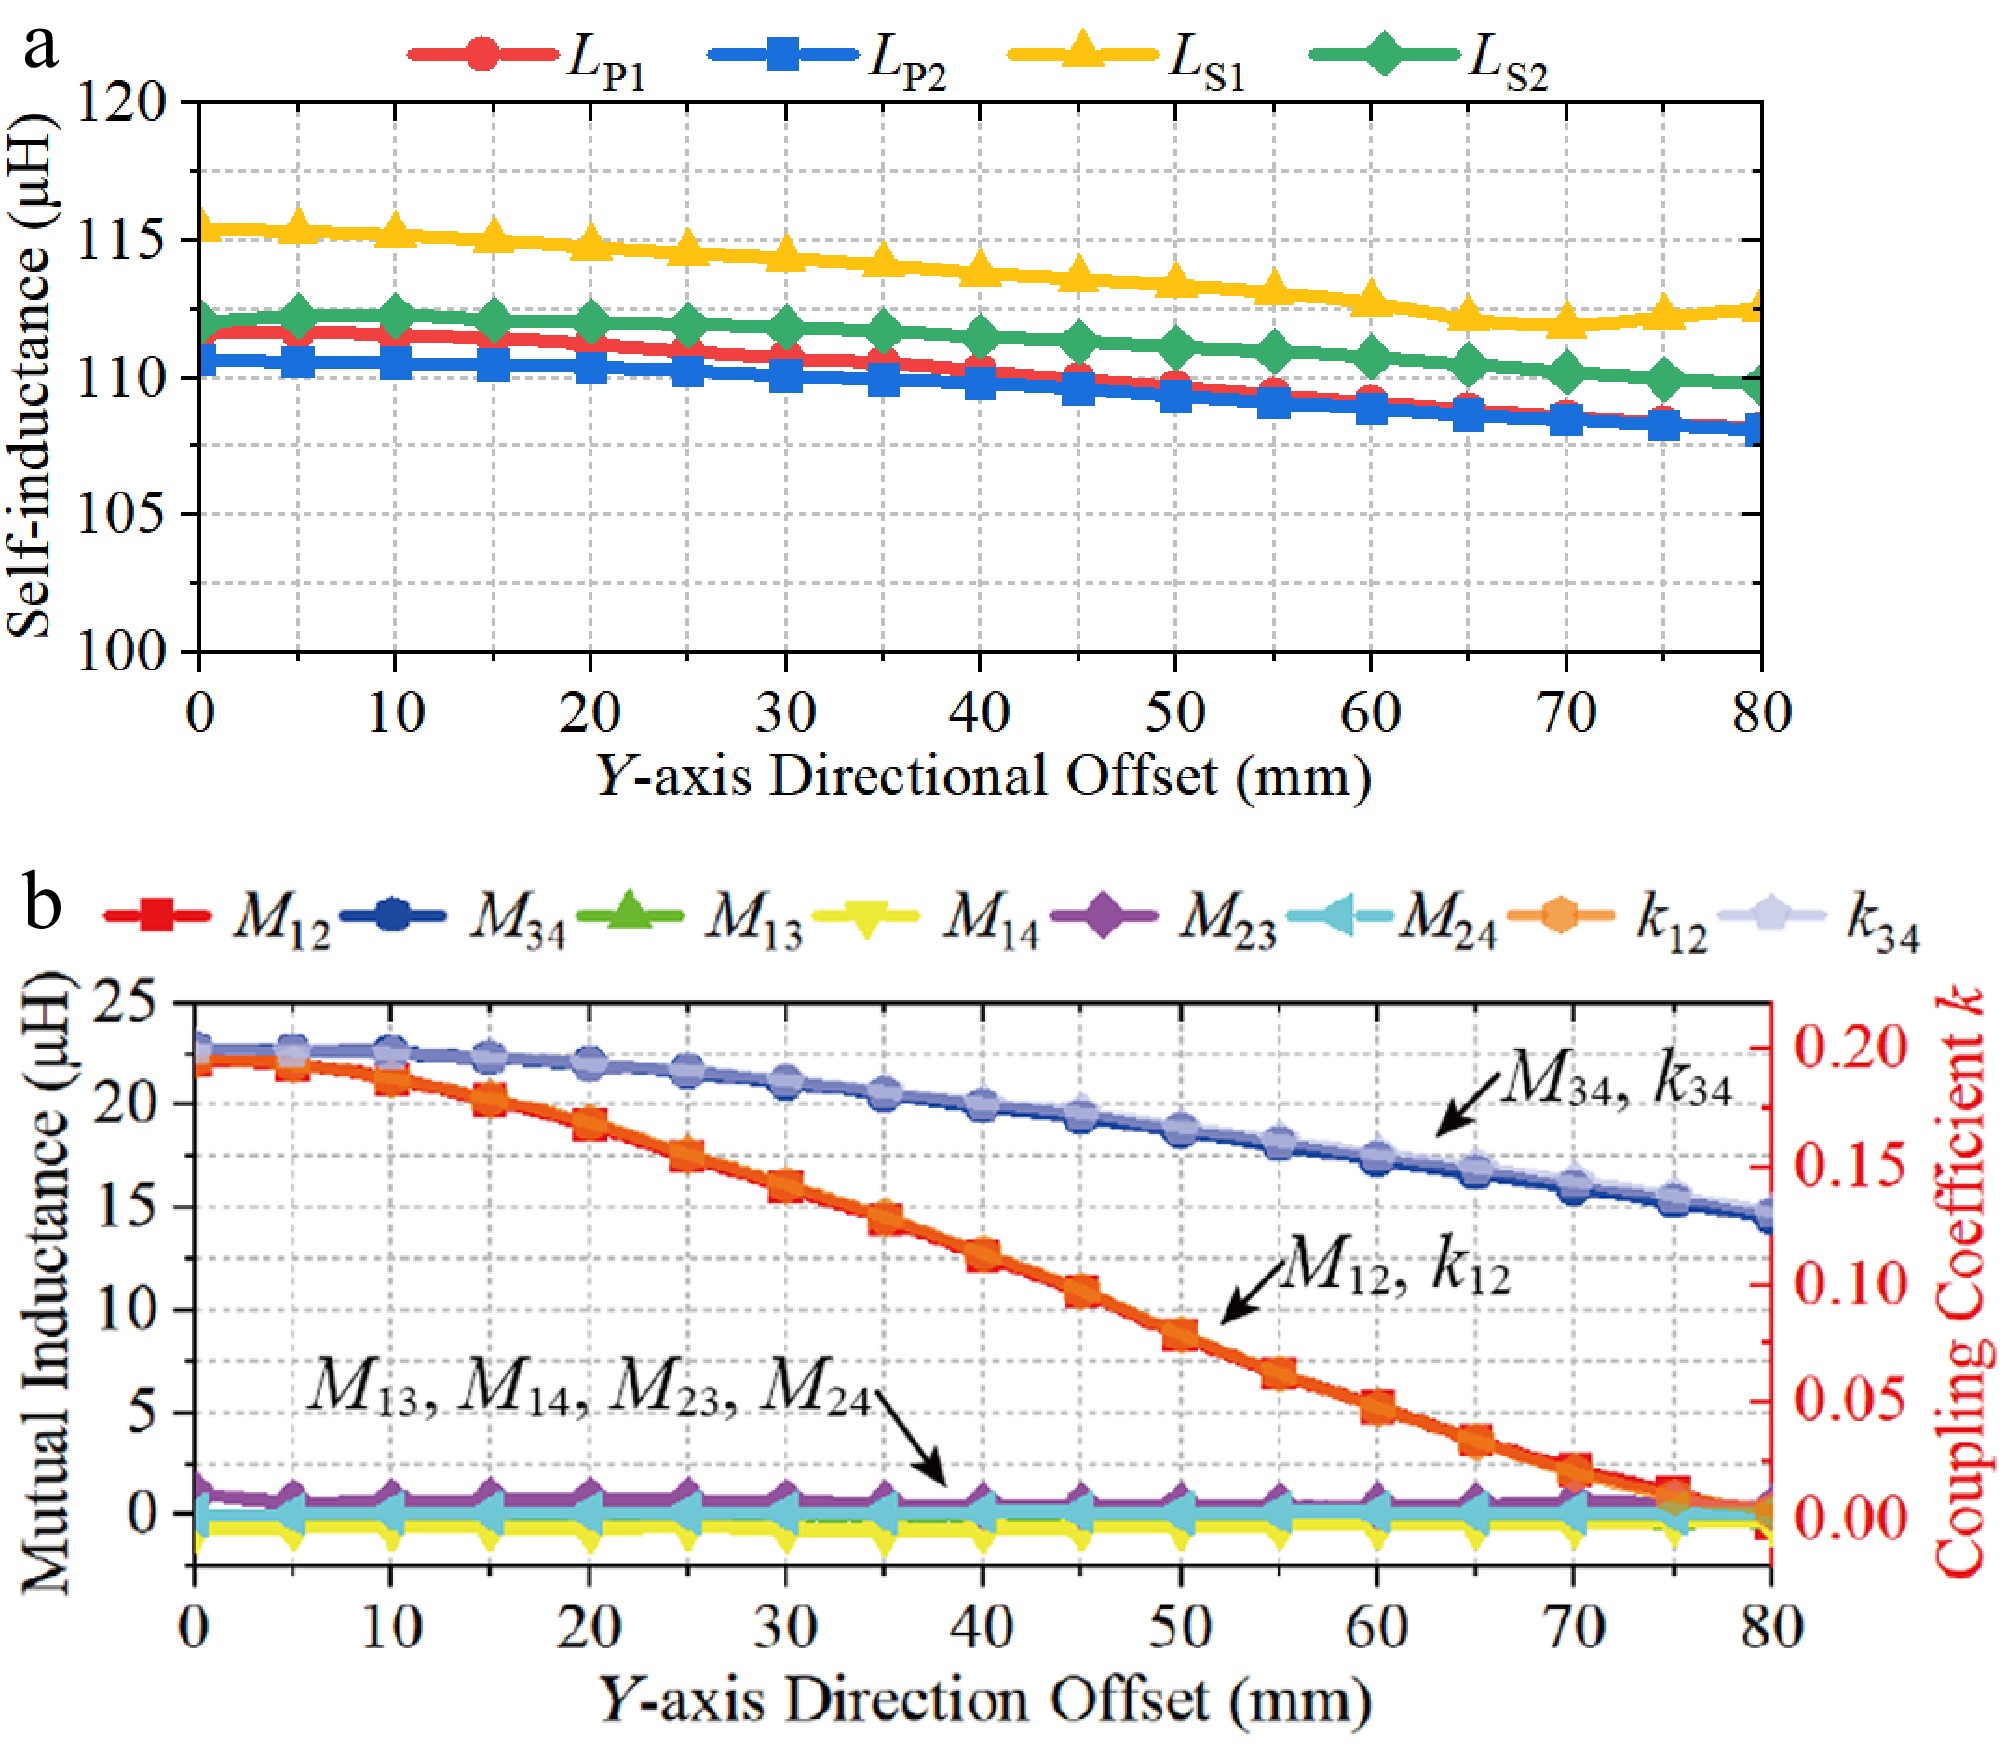
Figure 5.
Y-axis direction offset. (a) Self-inductance. (b) Mutual inductance, and coupling coefficient k.
-
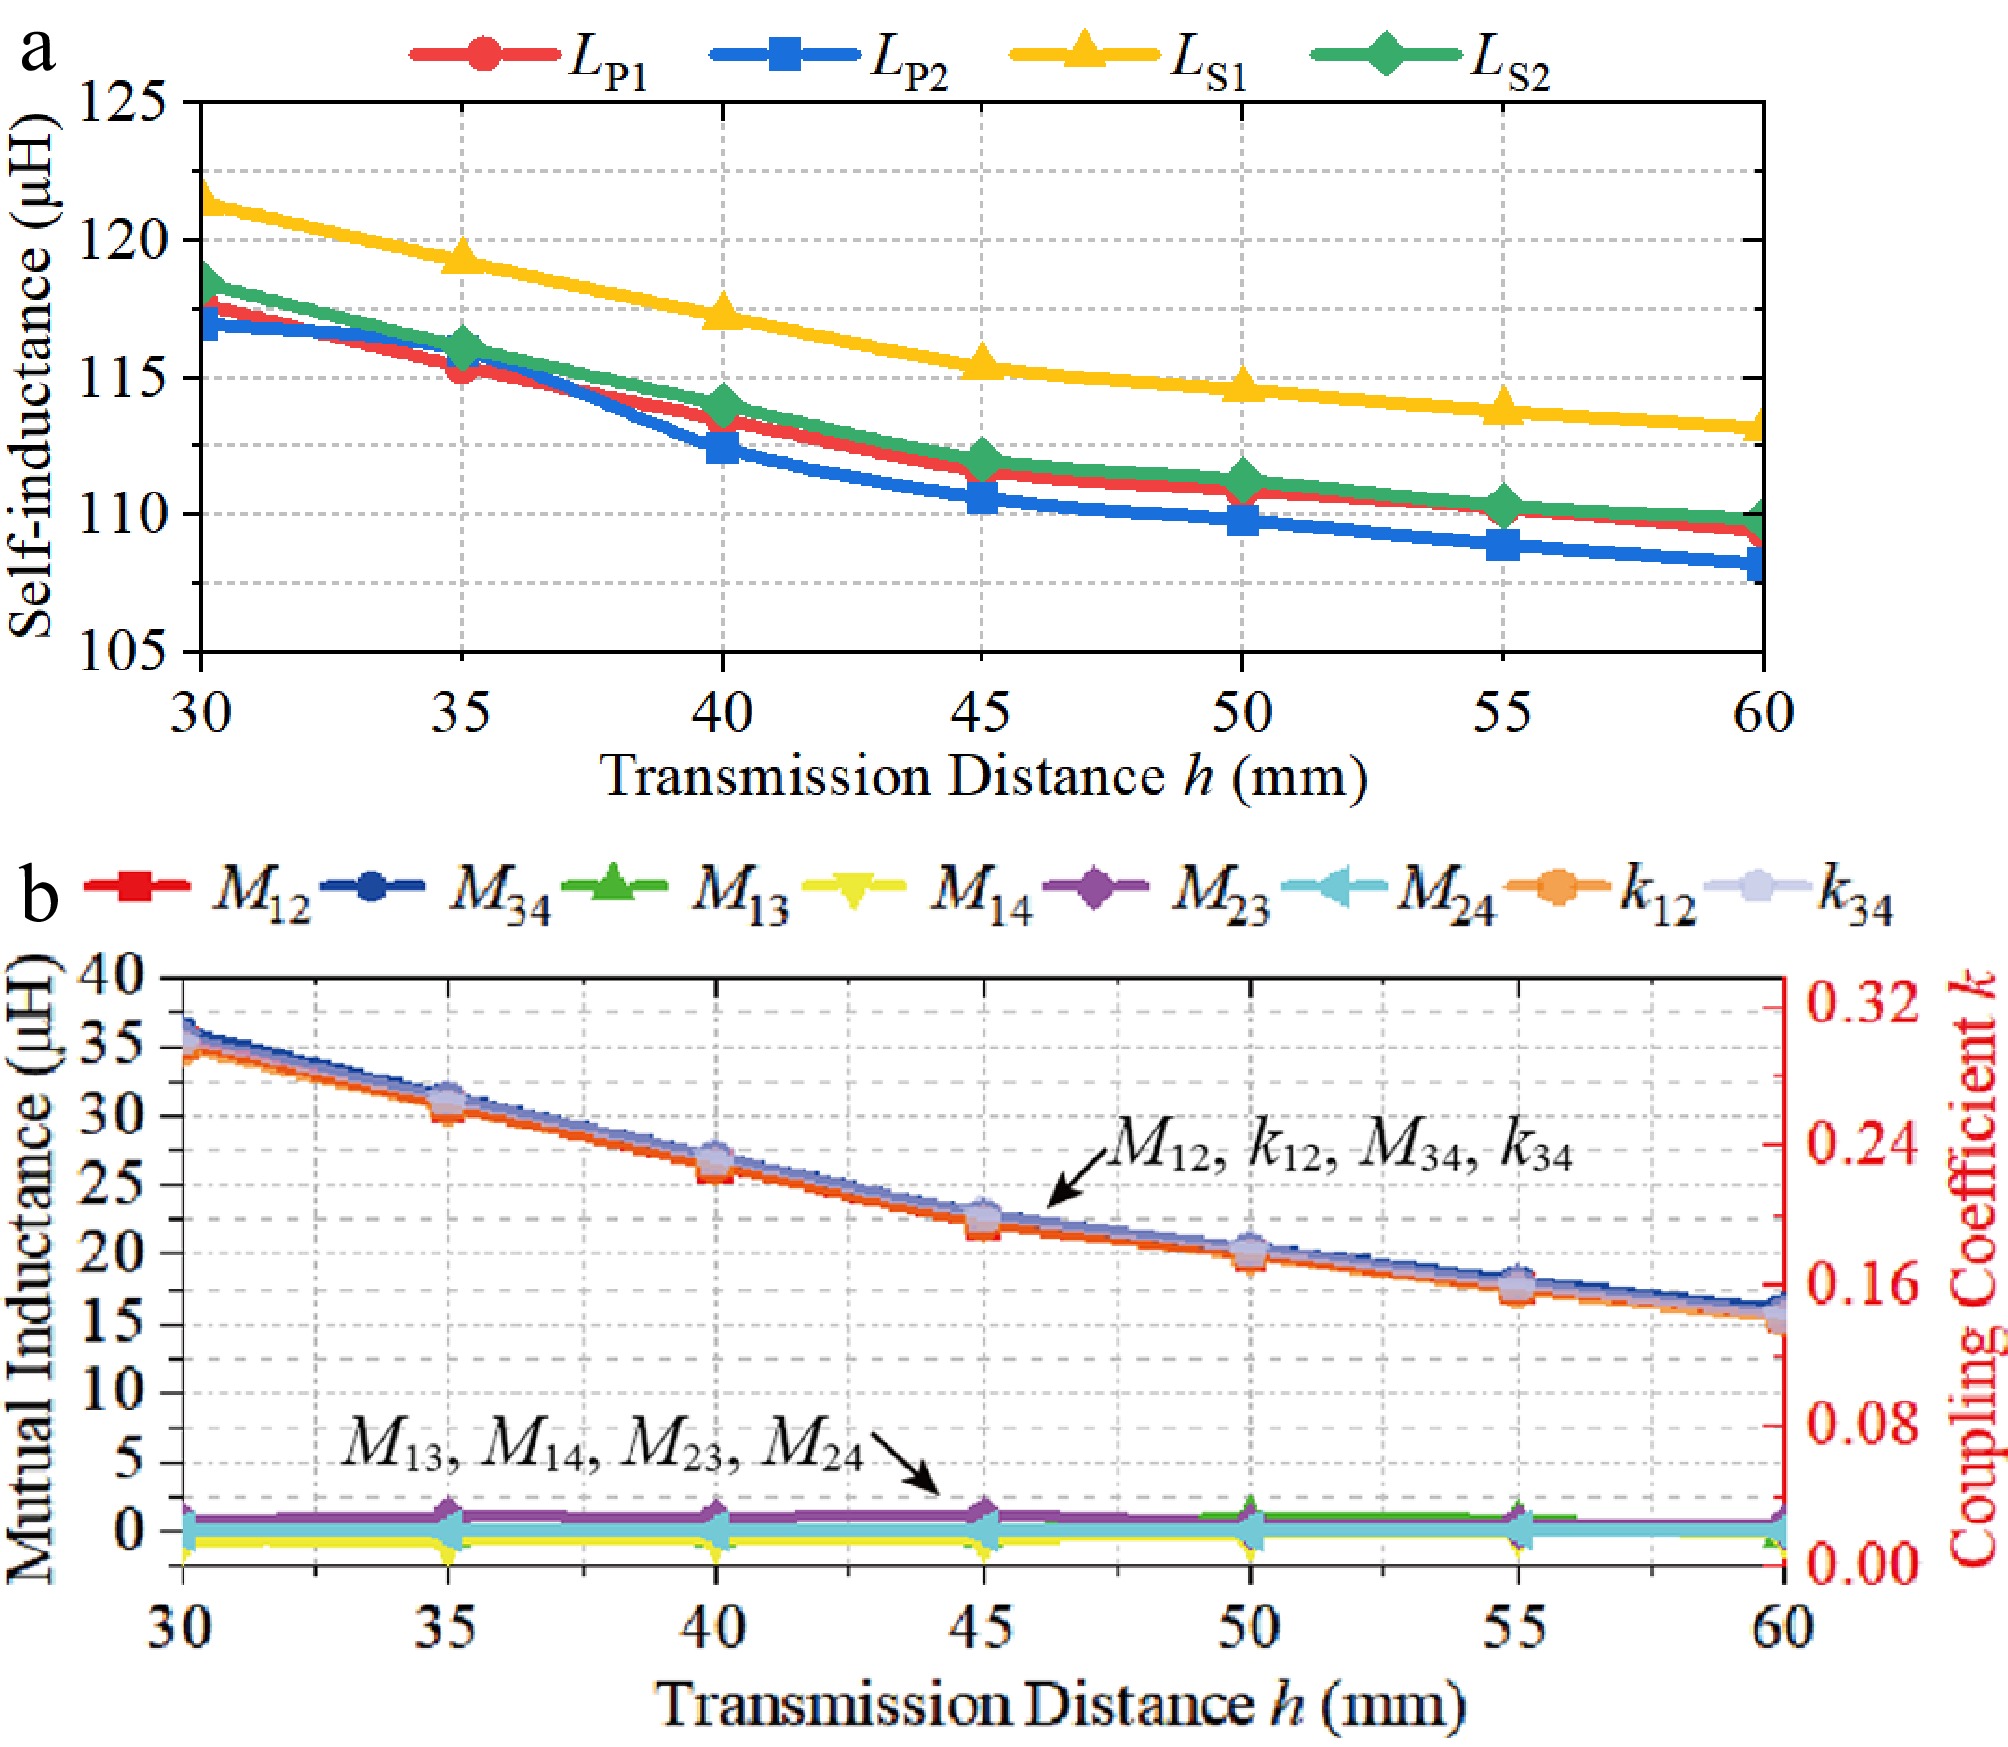
Figure 6.
Z-axis direction offset. (a) Self-inductance. (b) Mutual inductance, and coupling coefficient k.
-
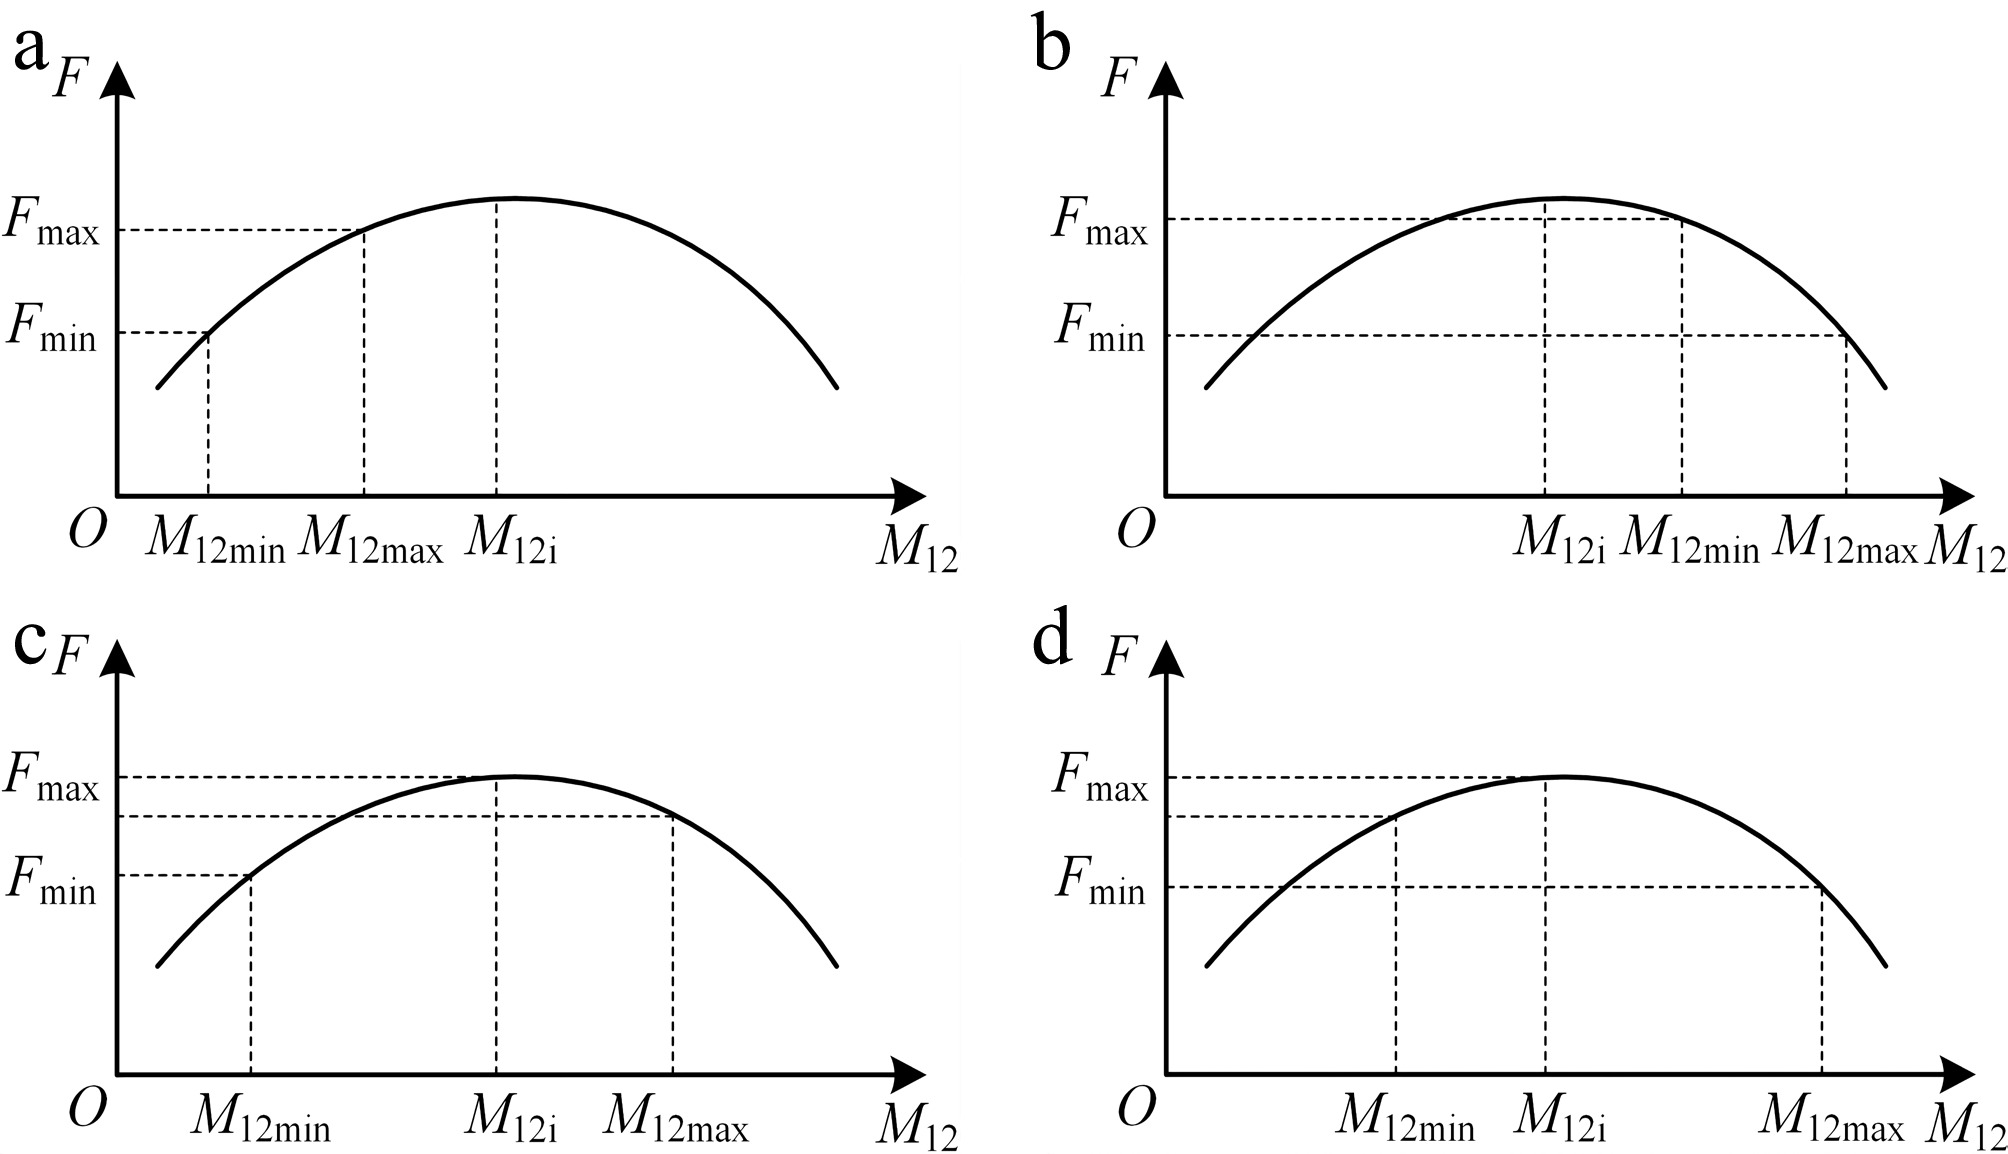
Figure 7.
Curve depicting the relationship between system voltage gain and the primary mutual inductance M12. (a) Monotonically increasing. (b) Monotonically decreasing. (c) Take the minimum value at M12min. (d) Take the minimum value at M12max.
-
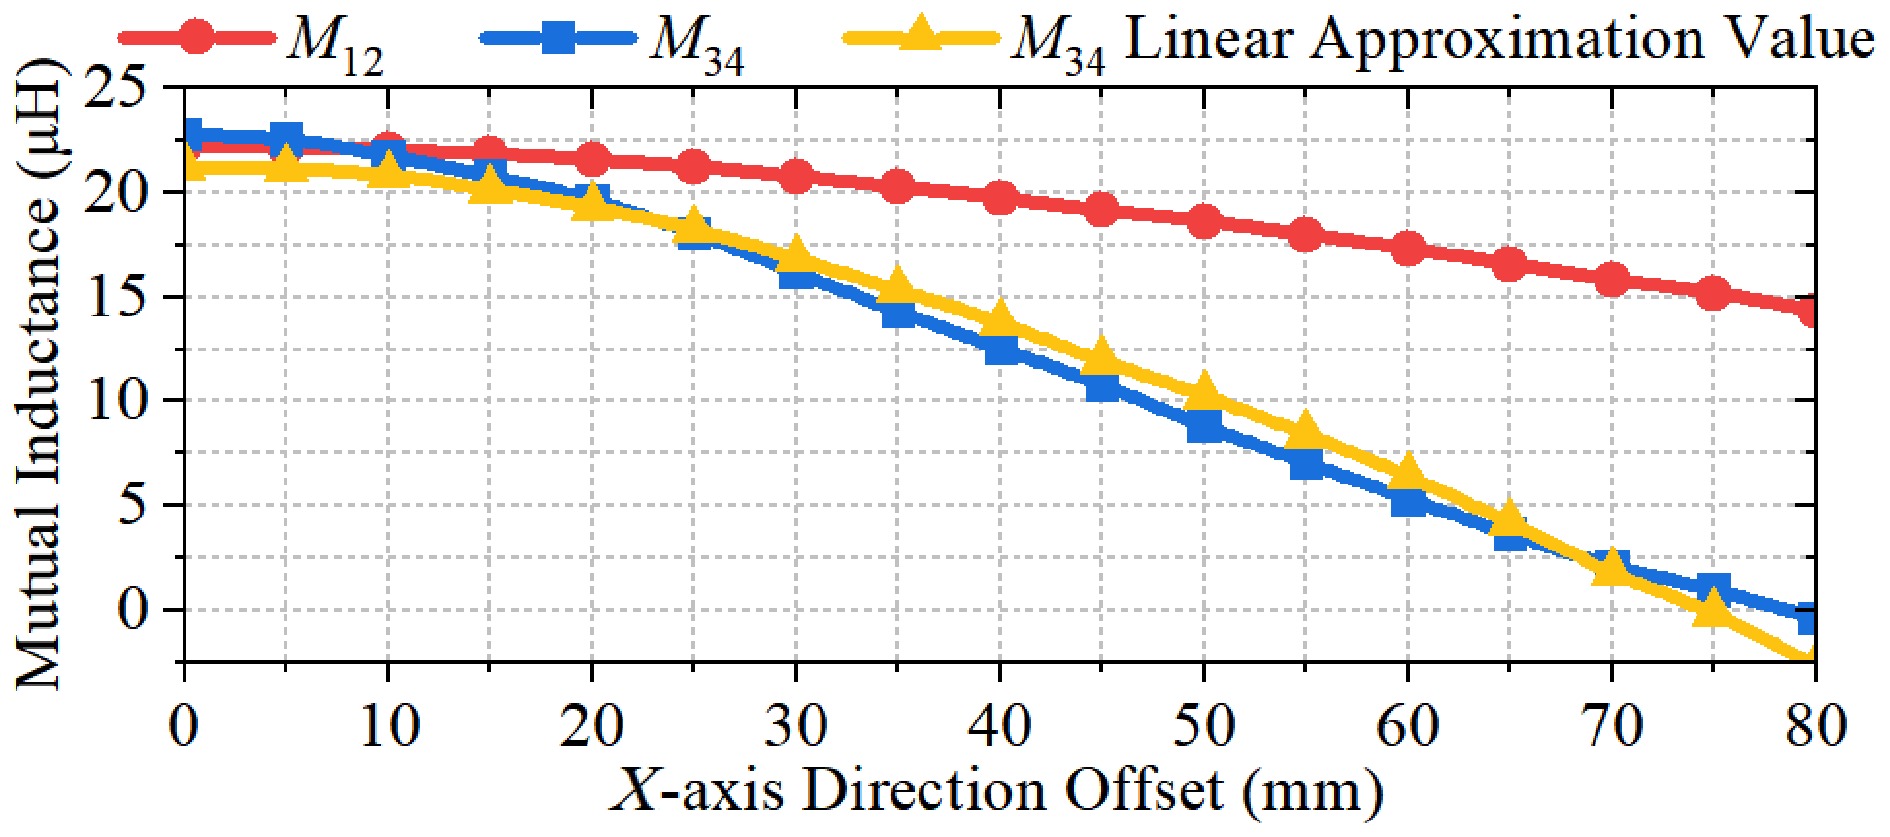
Figure 8.
The linear approximation value, and the actual value of the M34 line.
-
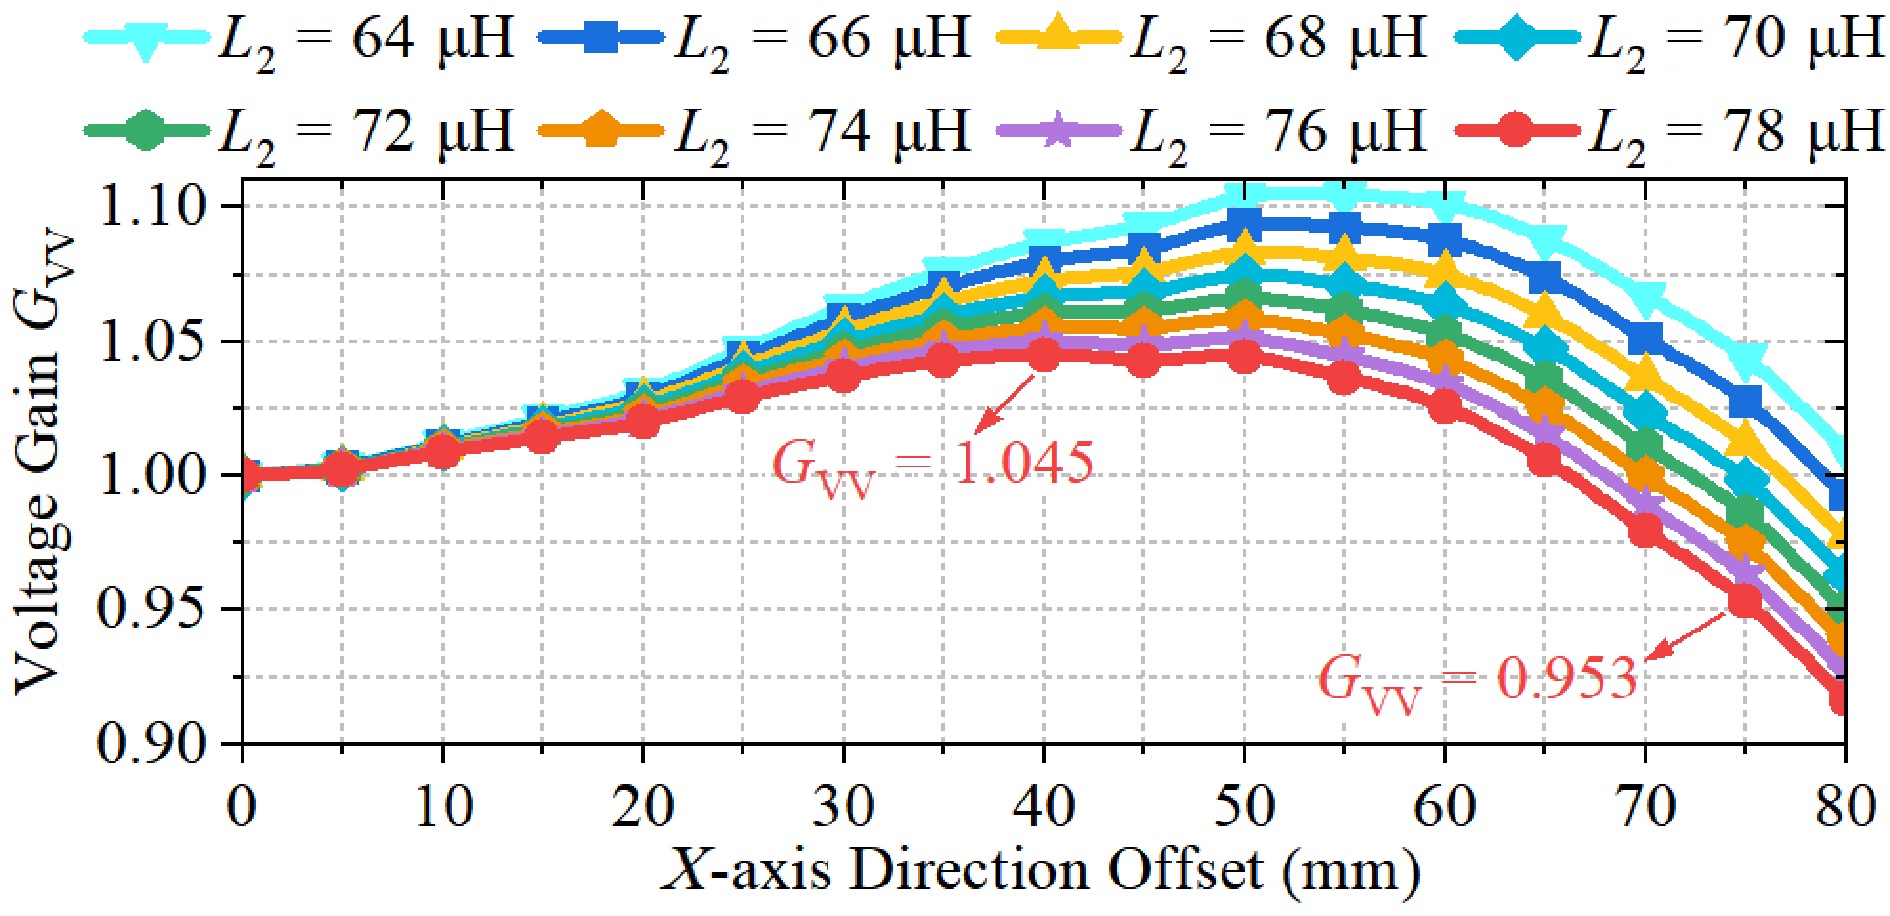
Figure 9.
Voltage gain GVV under different L2 values.
-
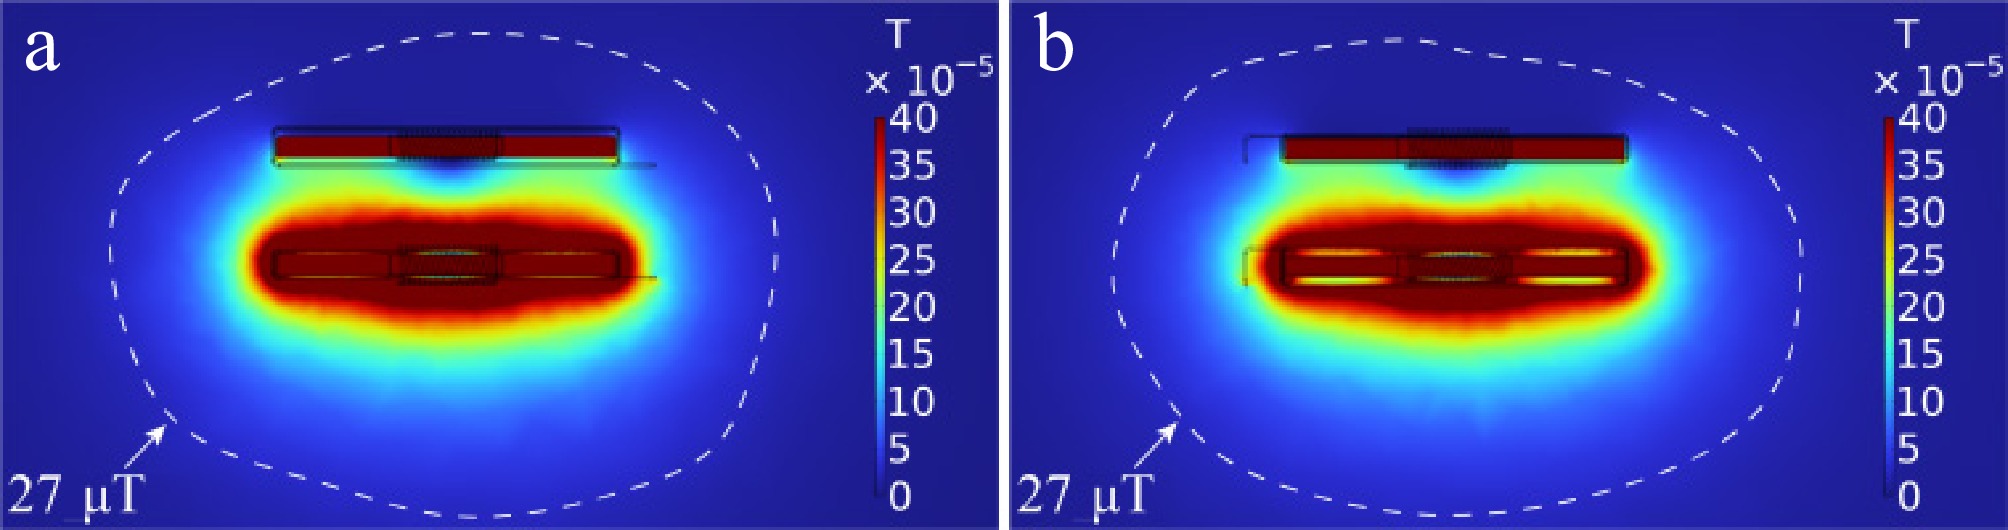
Figure 10.
The magnetic flux density distribution of the self-decoupled cross coil presented. (a) Side view of the XOZ plane. (b) Side view of the YOZ plane.
-
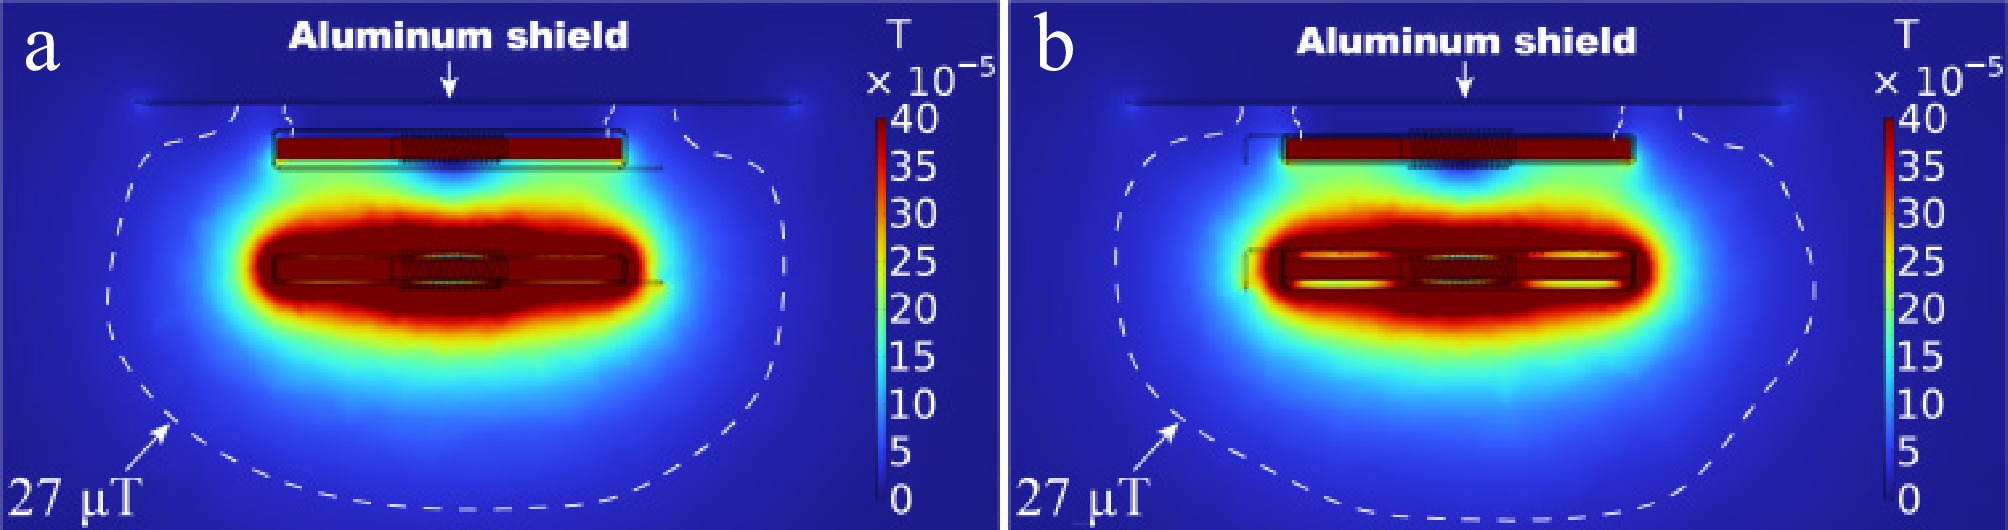
Figure 11.
Magnetic flux density distribution of the proposed self-decoupling cross coil after magnetic shielding. (a) Side view of the XOZ plane. (b) Side view of the YOZ plane.
-
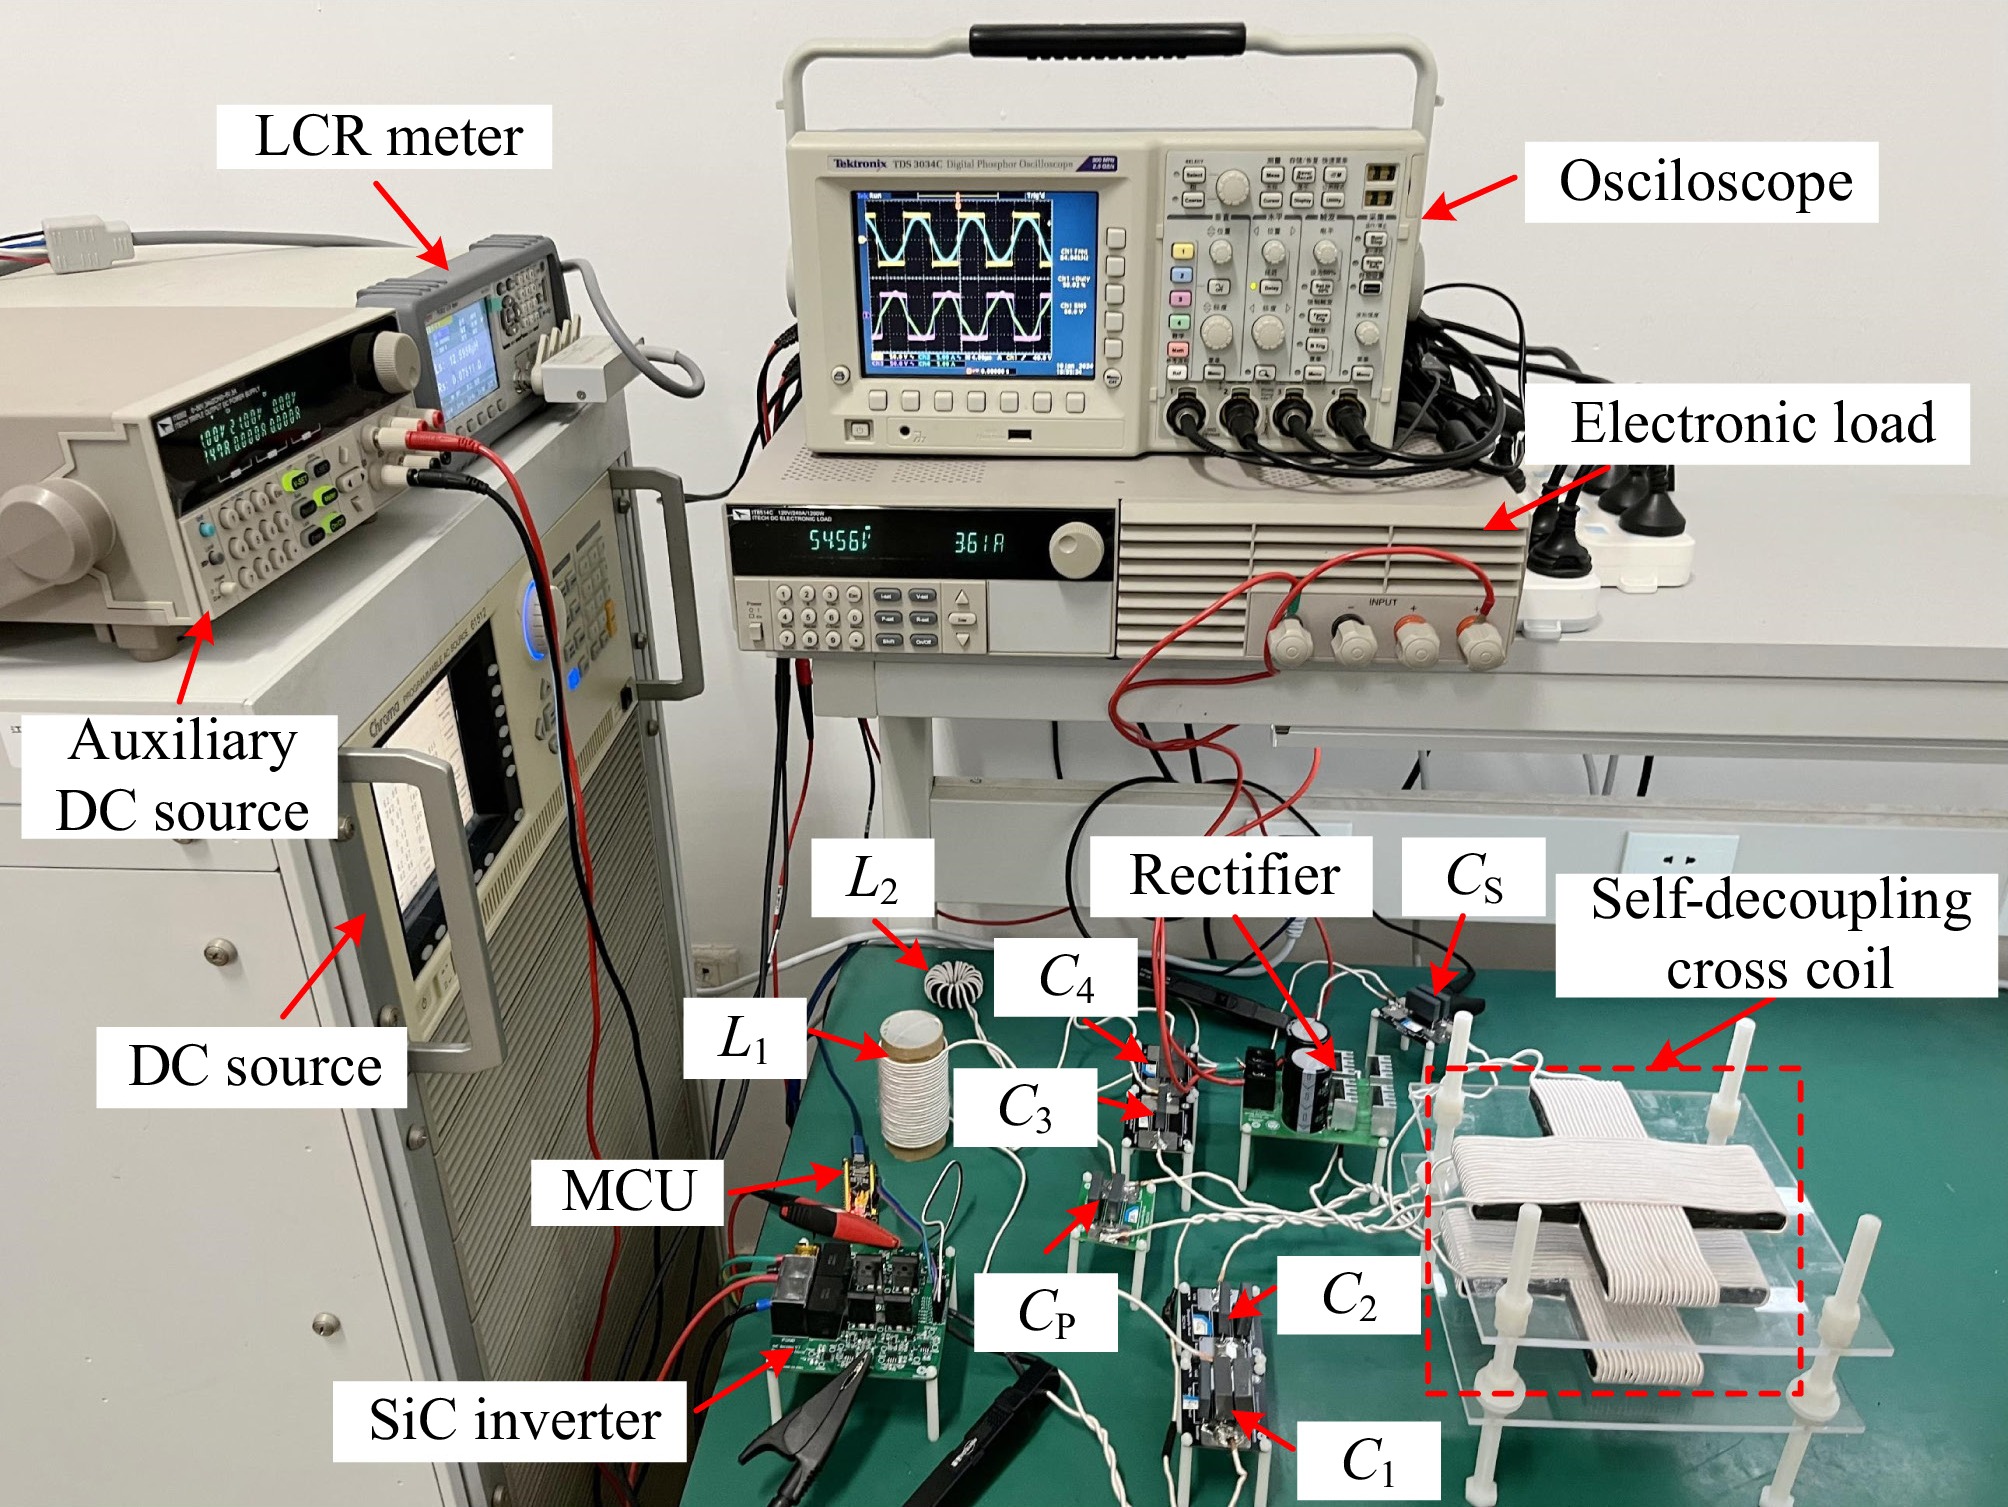
Figure 12.
Photograph of the experimental platform.
-
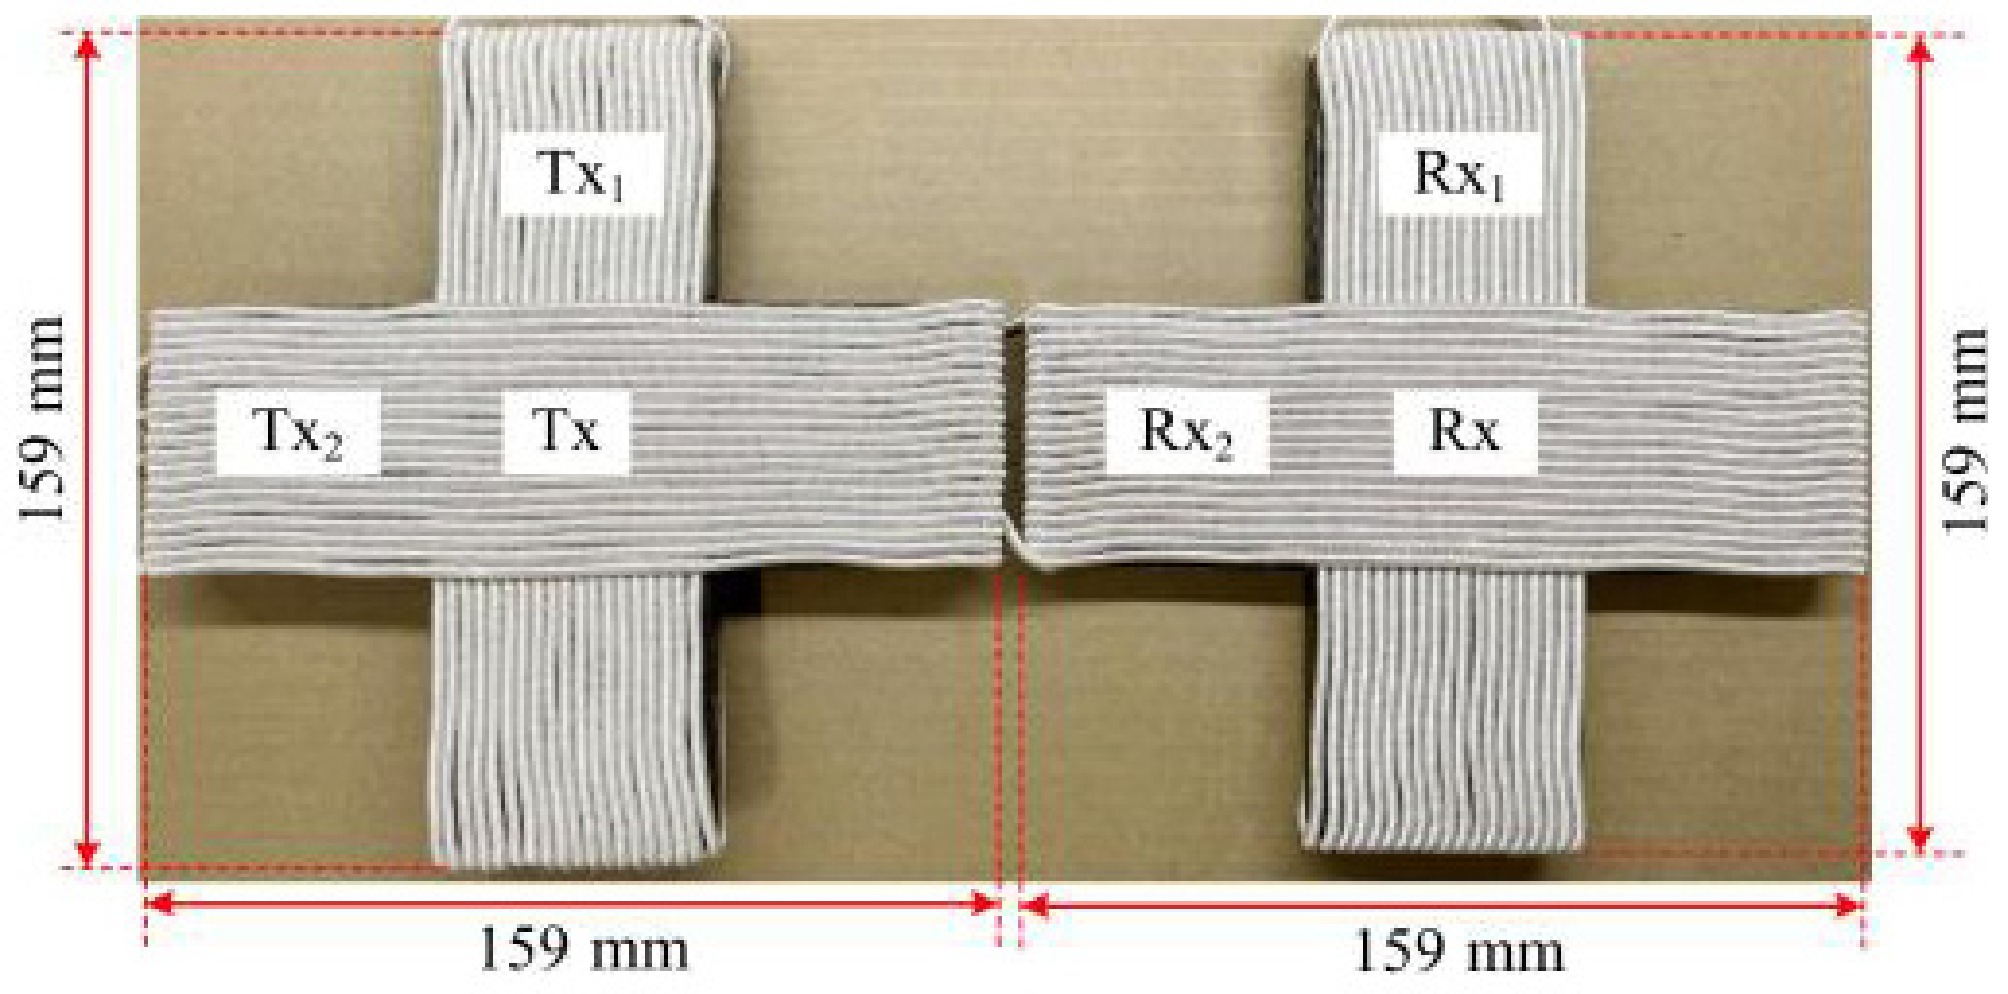
Figure 13.
Photo of decoupled cross coil.
-
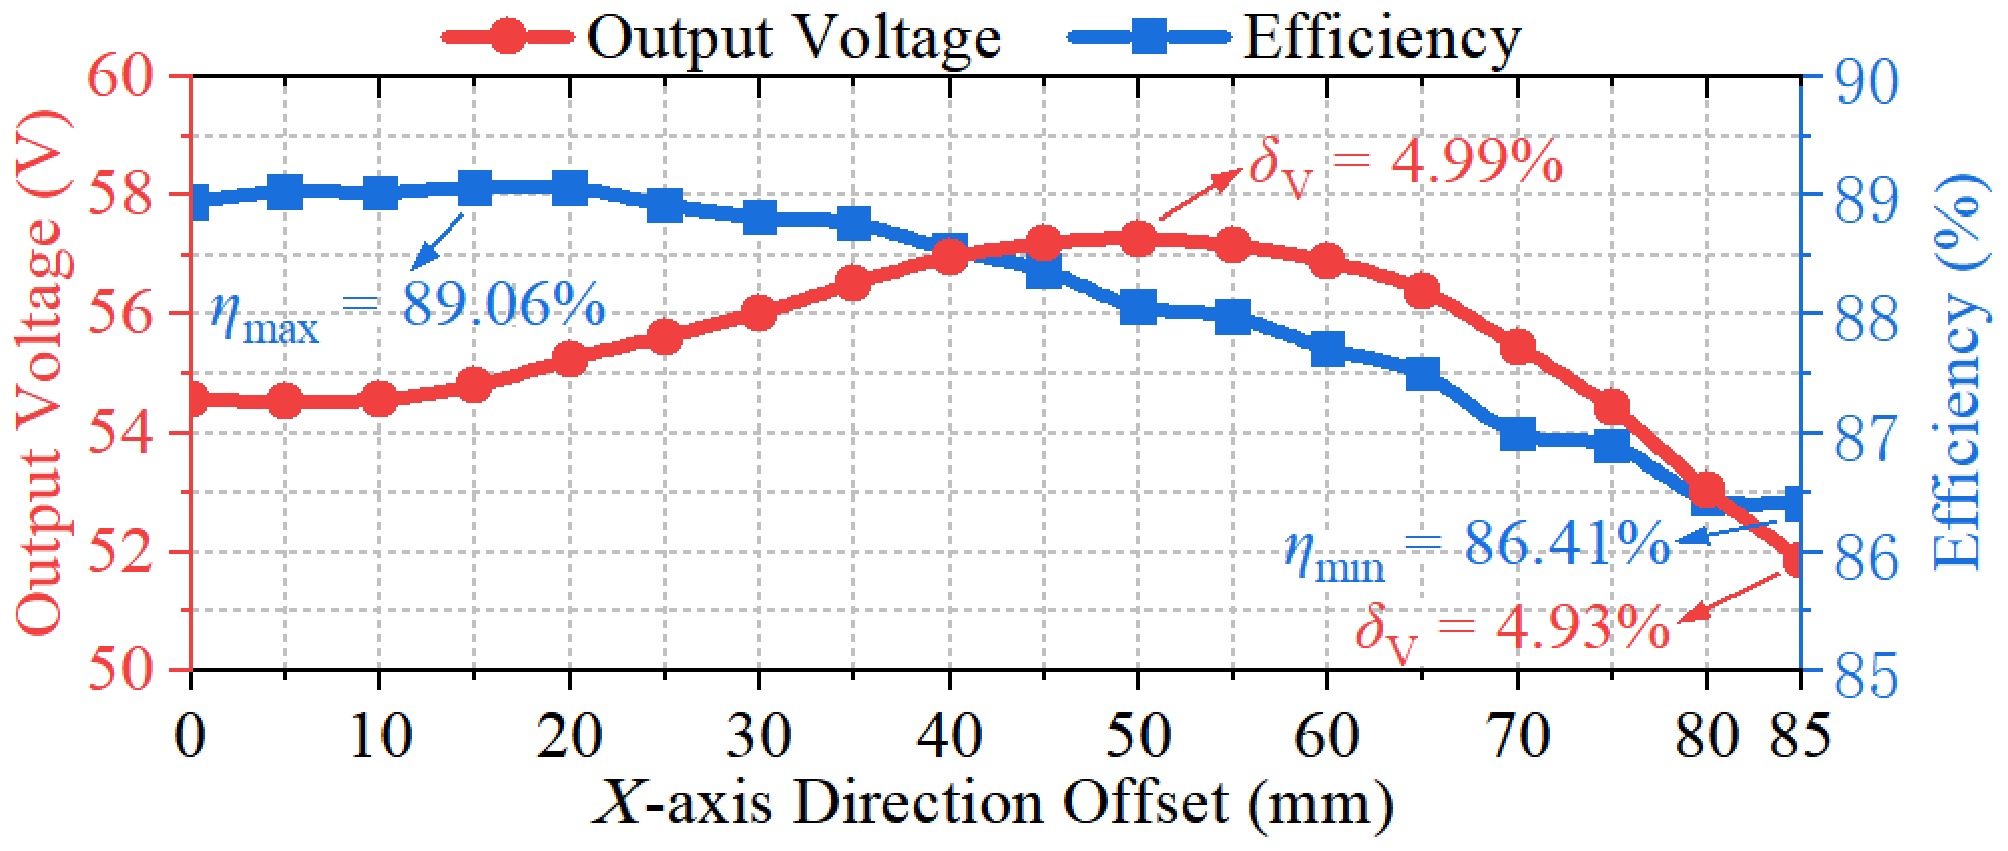
Figure 14.
Output voltage and efficiency when the X-axis direction is offset.
-
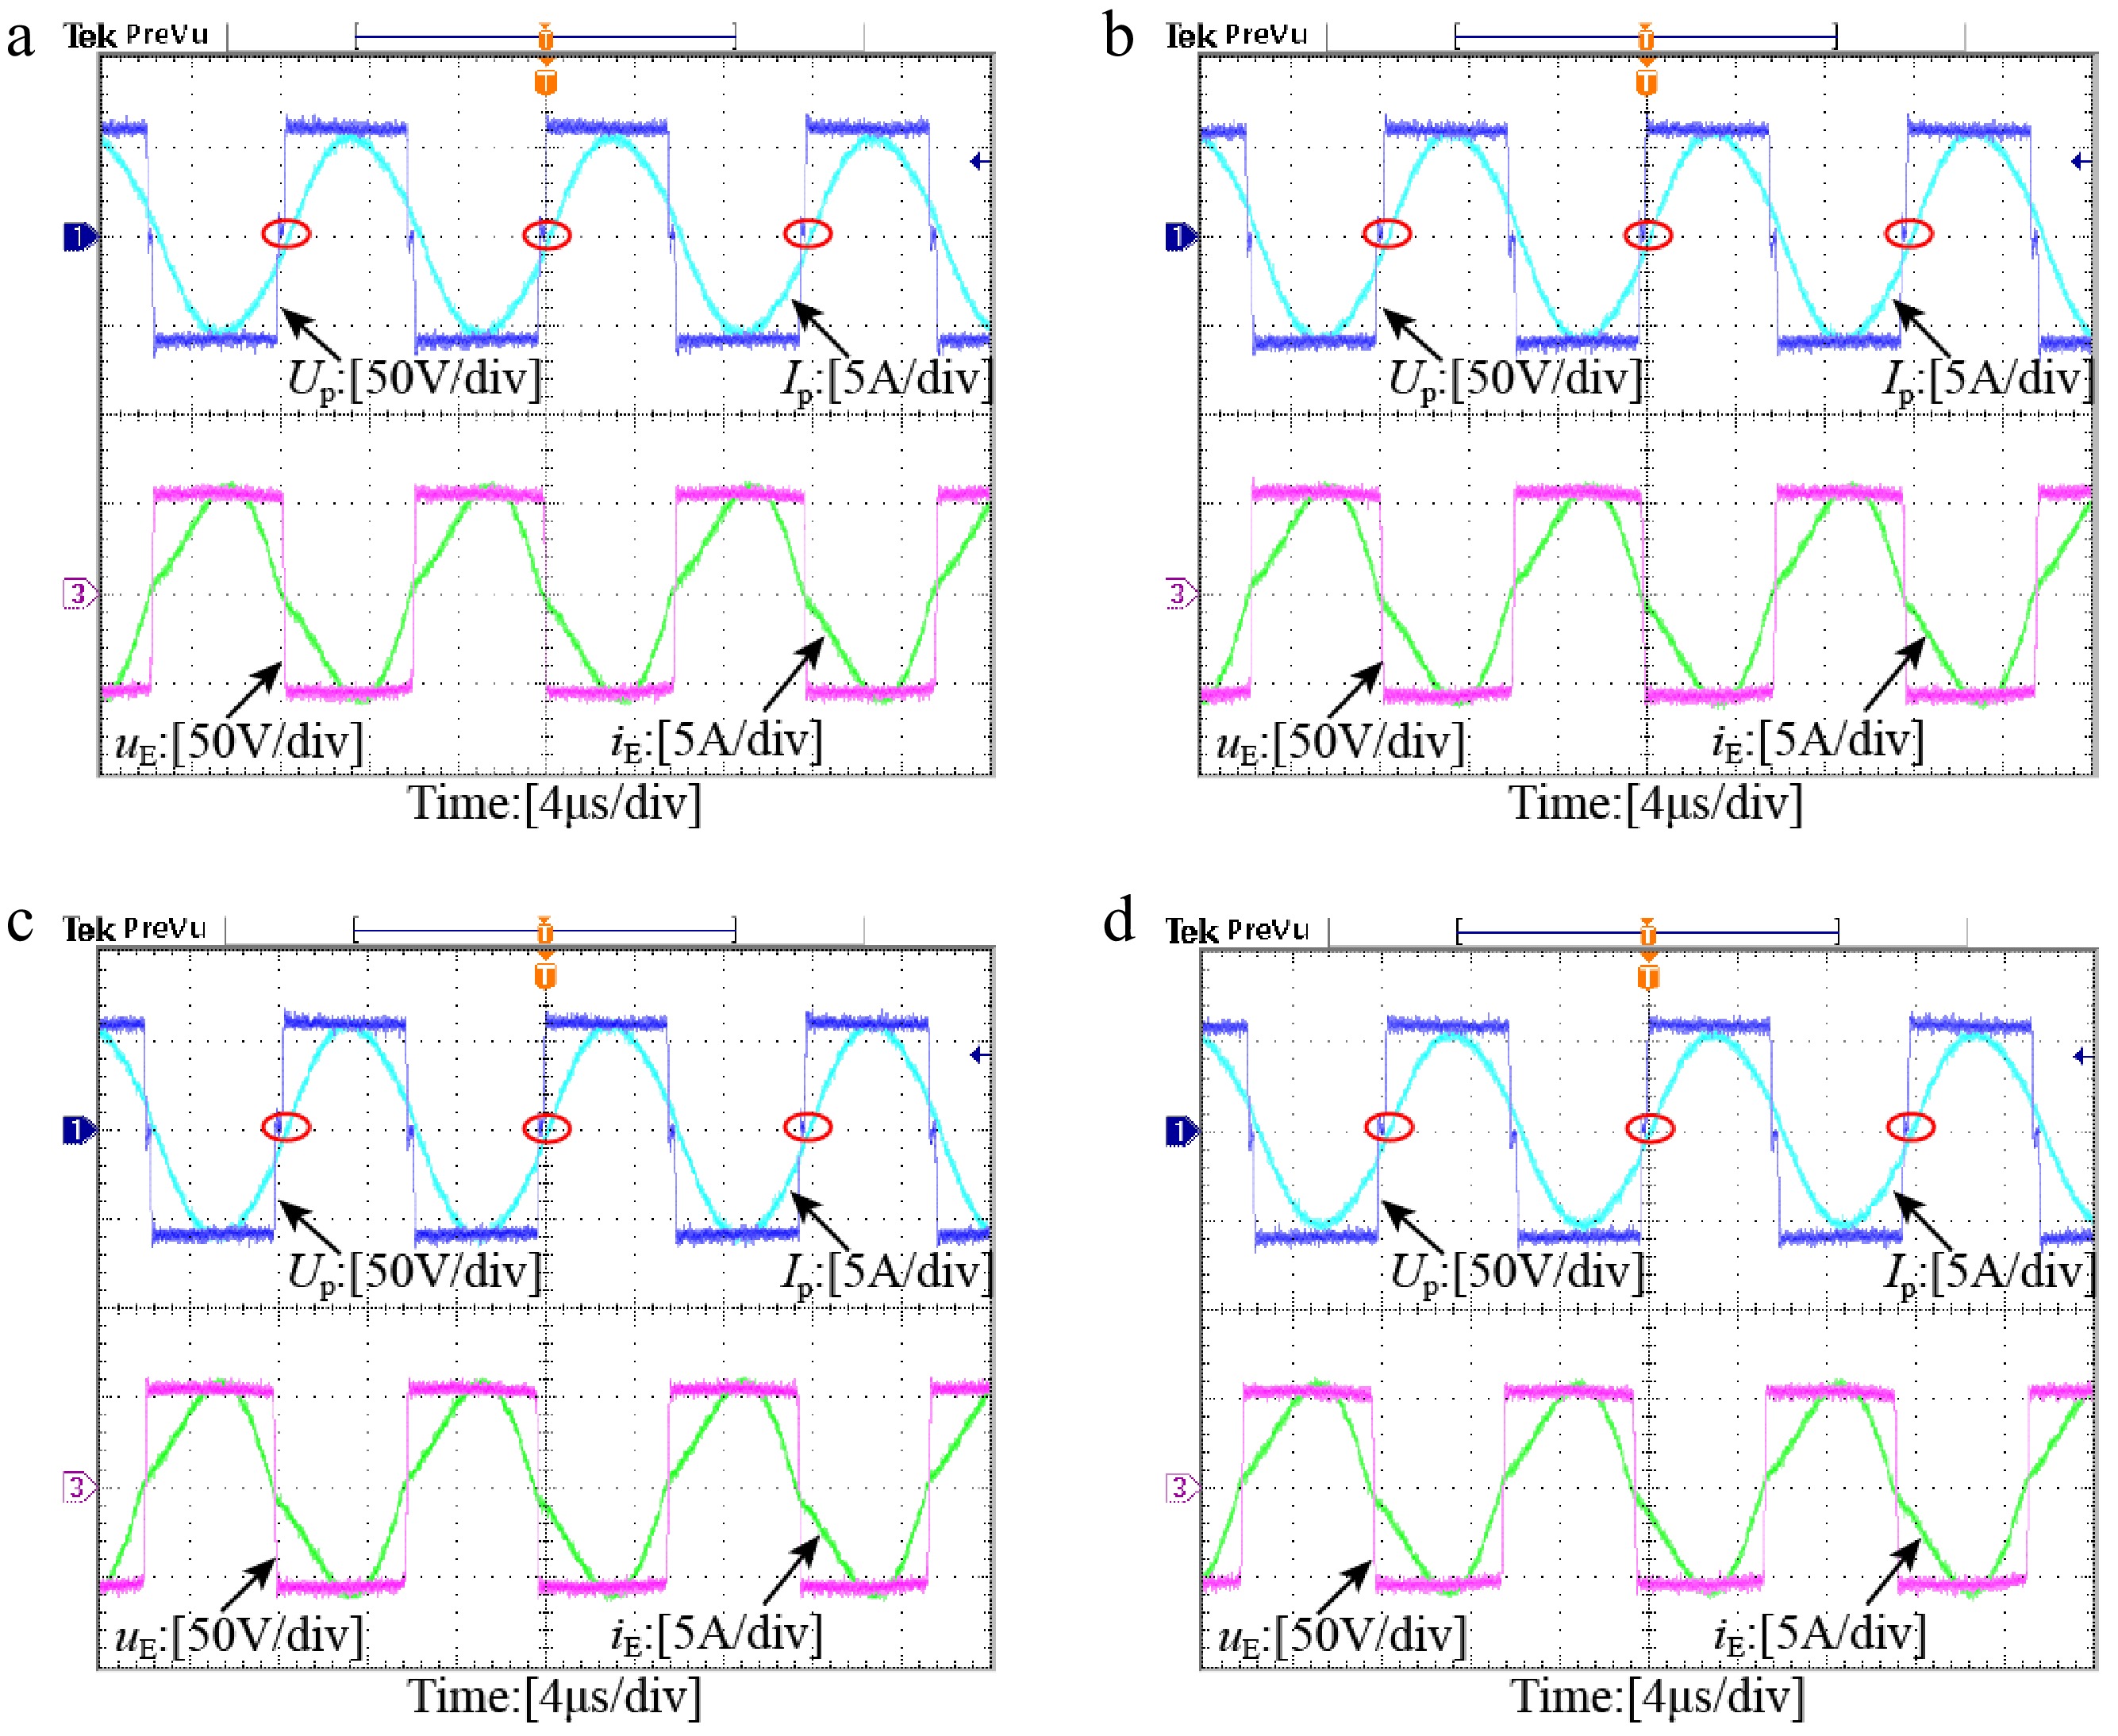
Figure 15.
Experimental waveforms under different X-axis offsets. (a) X = 0. (b) X = 30 mm. (c) X = 60 mm. (d) X = 85 mm.
-
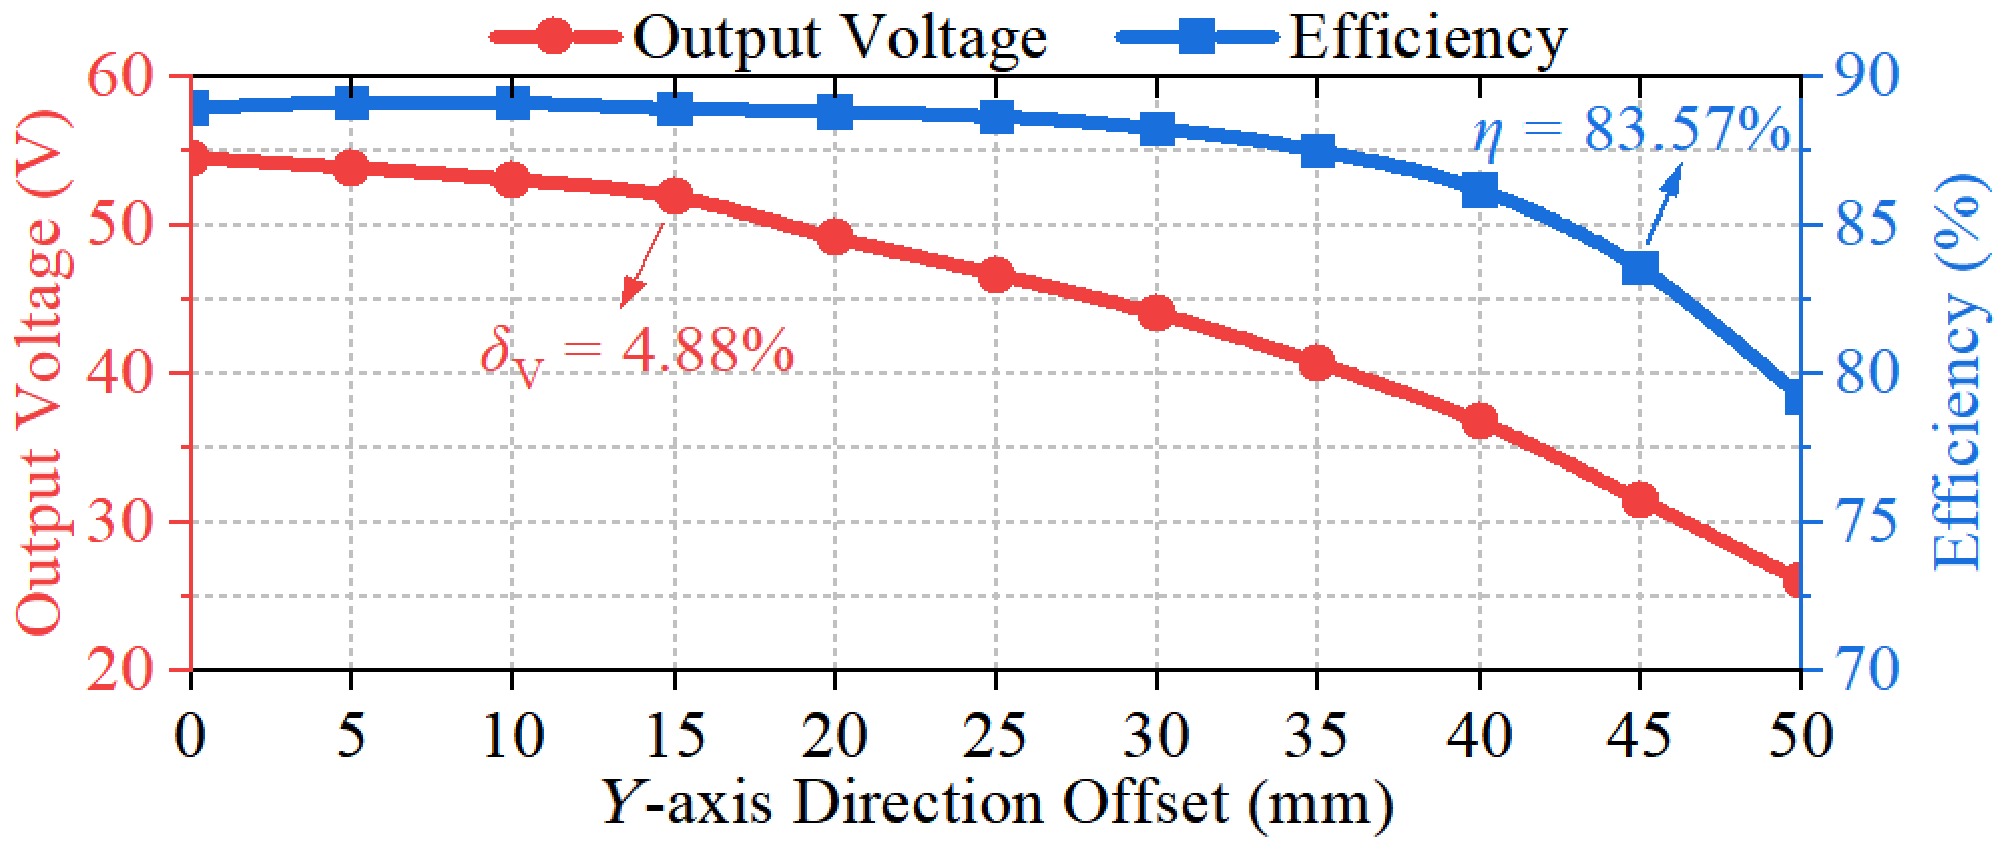
Figure 16.
Output voltage and efficiency when the Y-axis direction is offset.
-
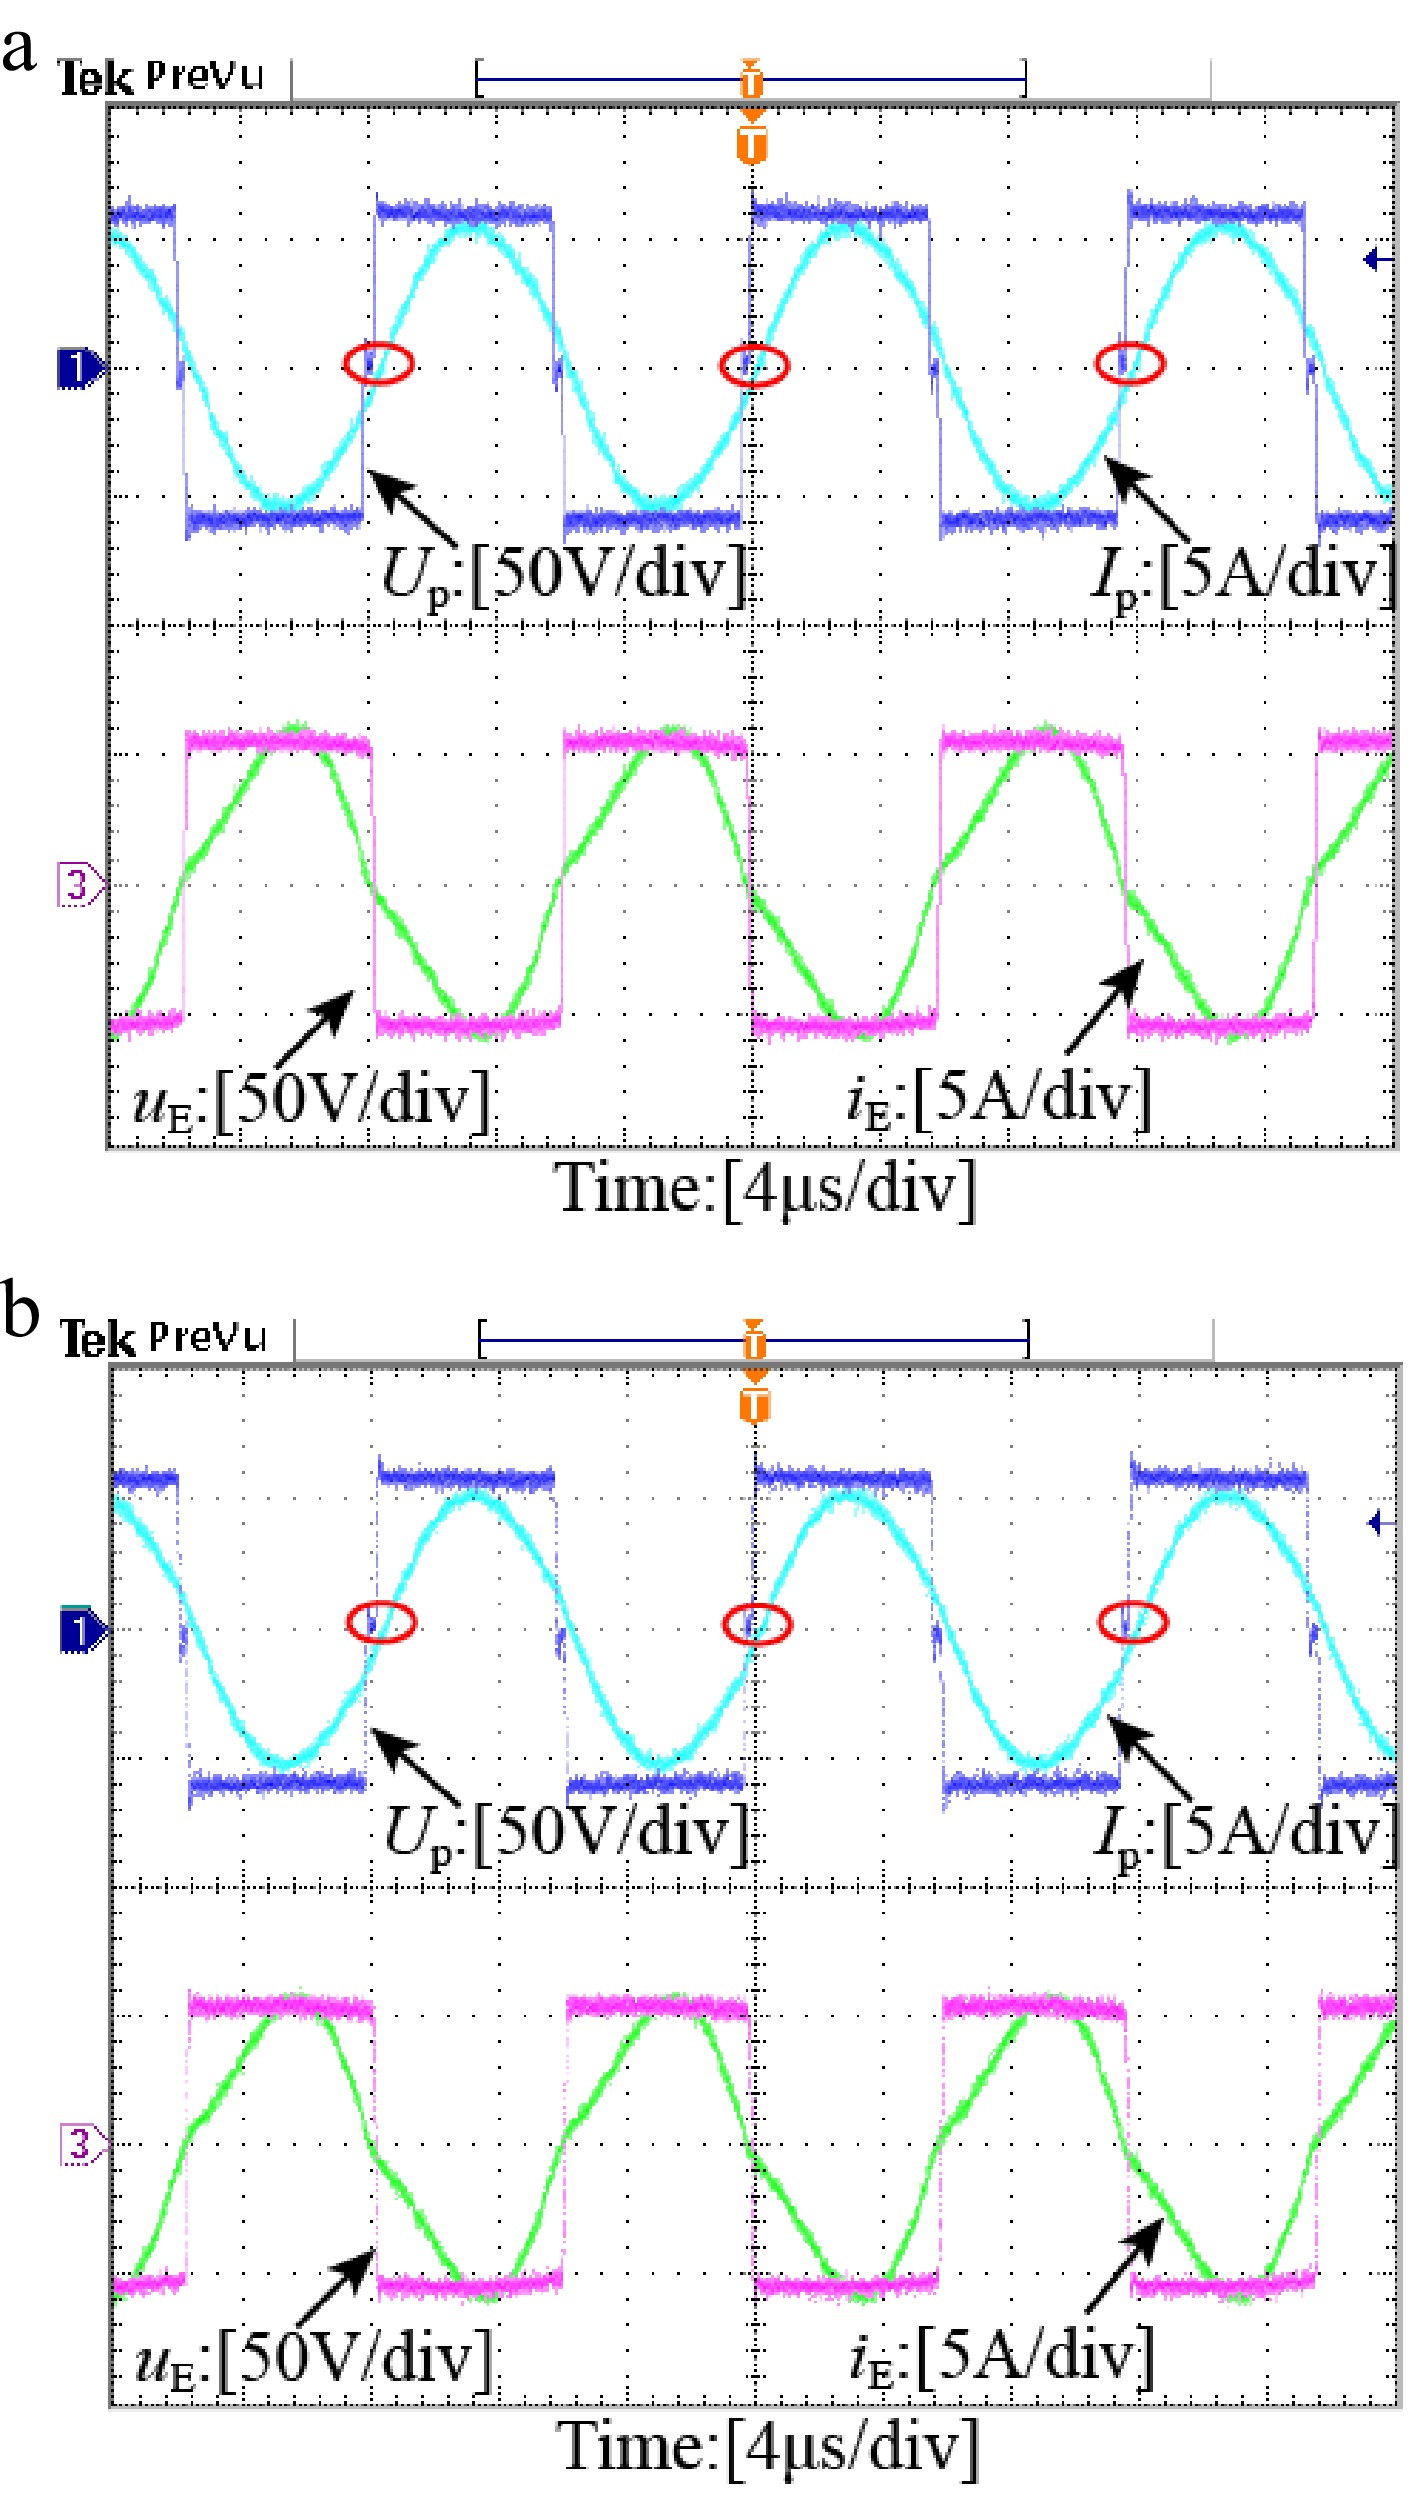
Figure 17.
Experimental waveforms under different Y-axis offset conditions. (a) Y = 10 mm. (b) Y = 15 mm.
-
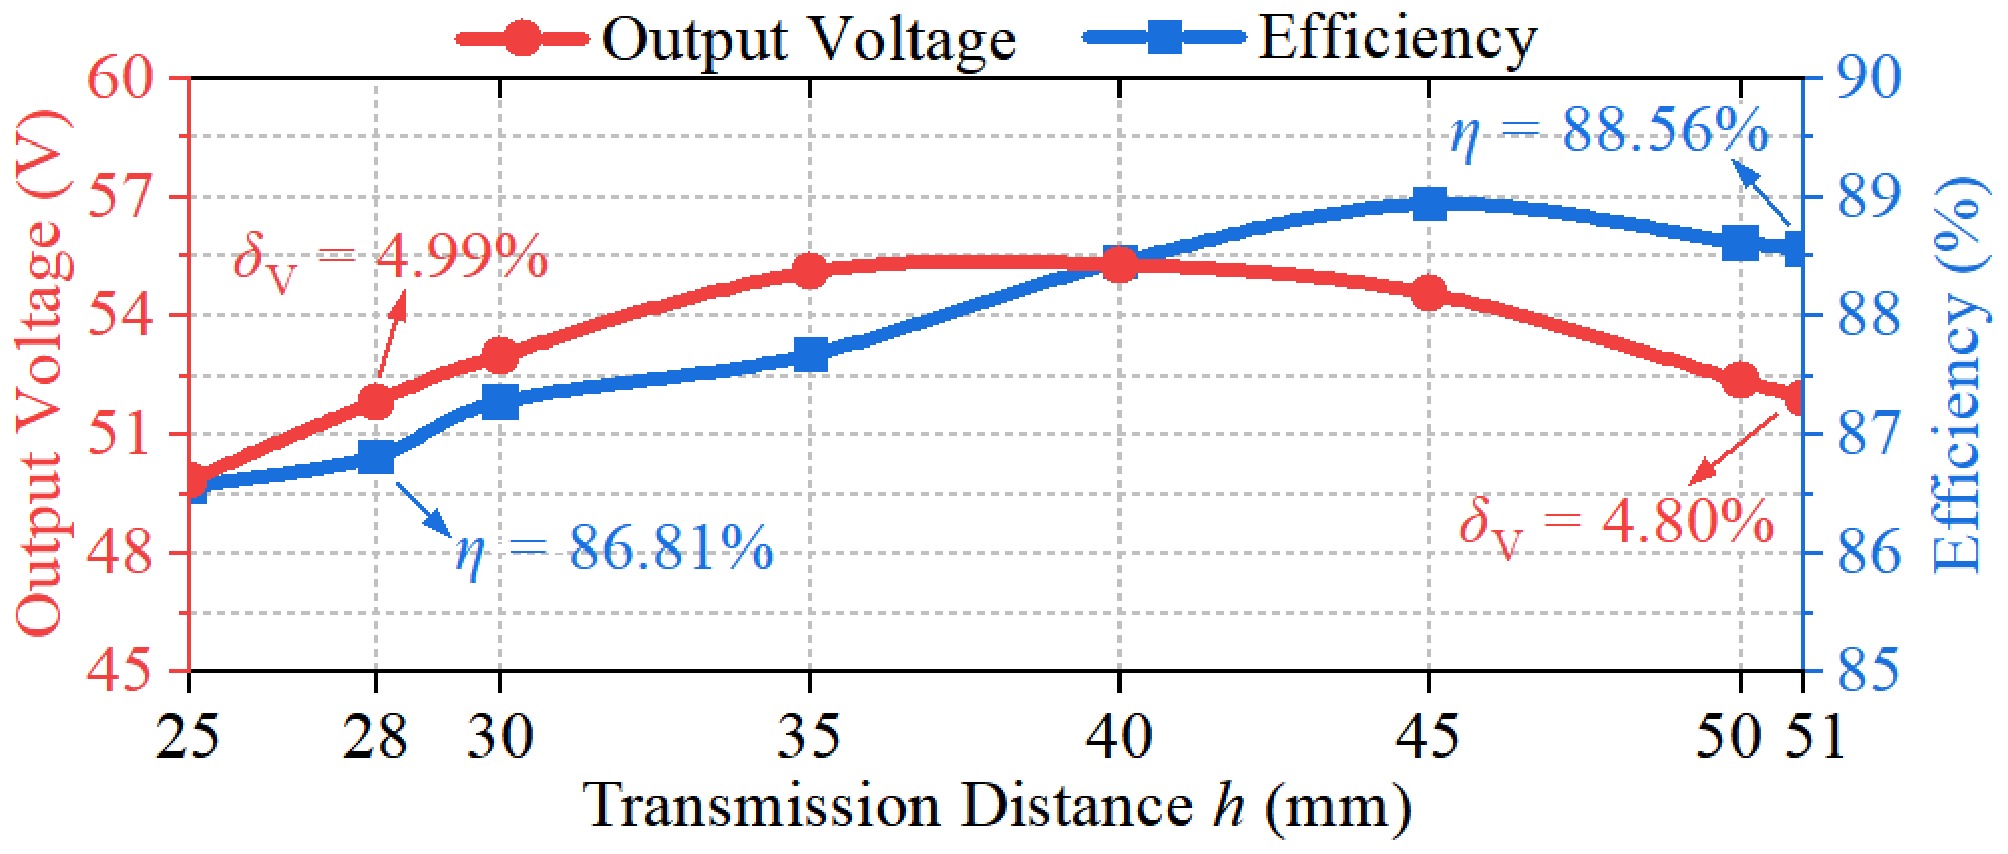
Figure 18.
Output voltage and efficiency when the Z-axis direction is offset.
-
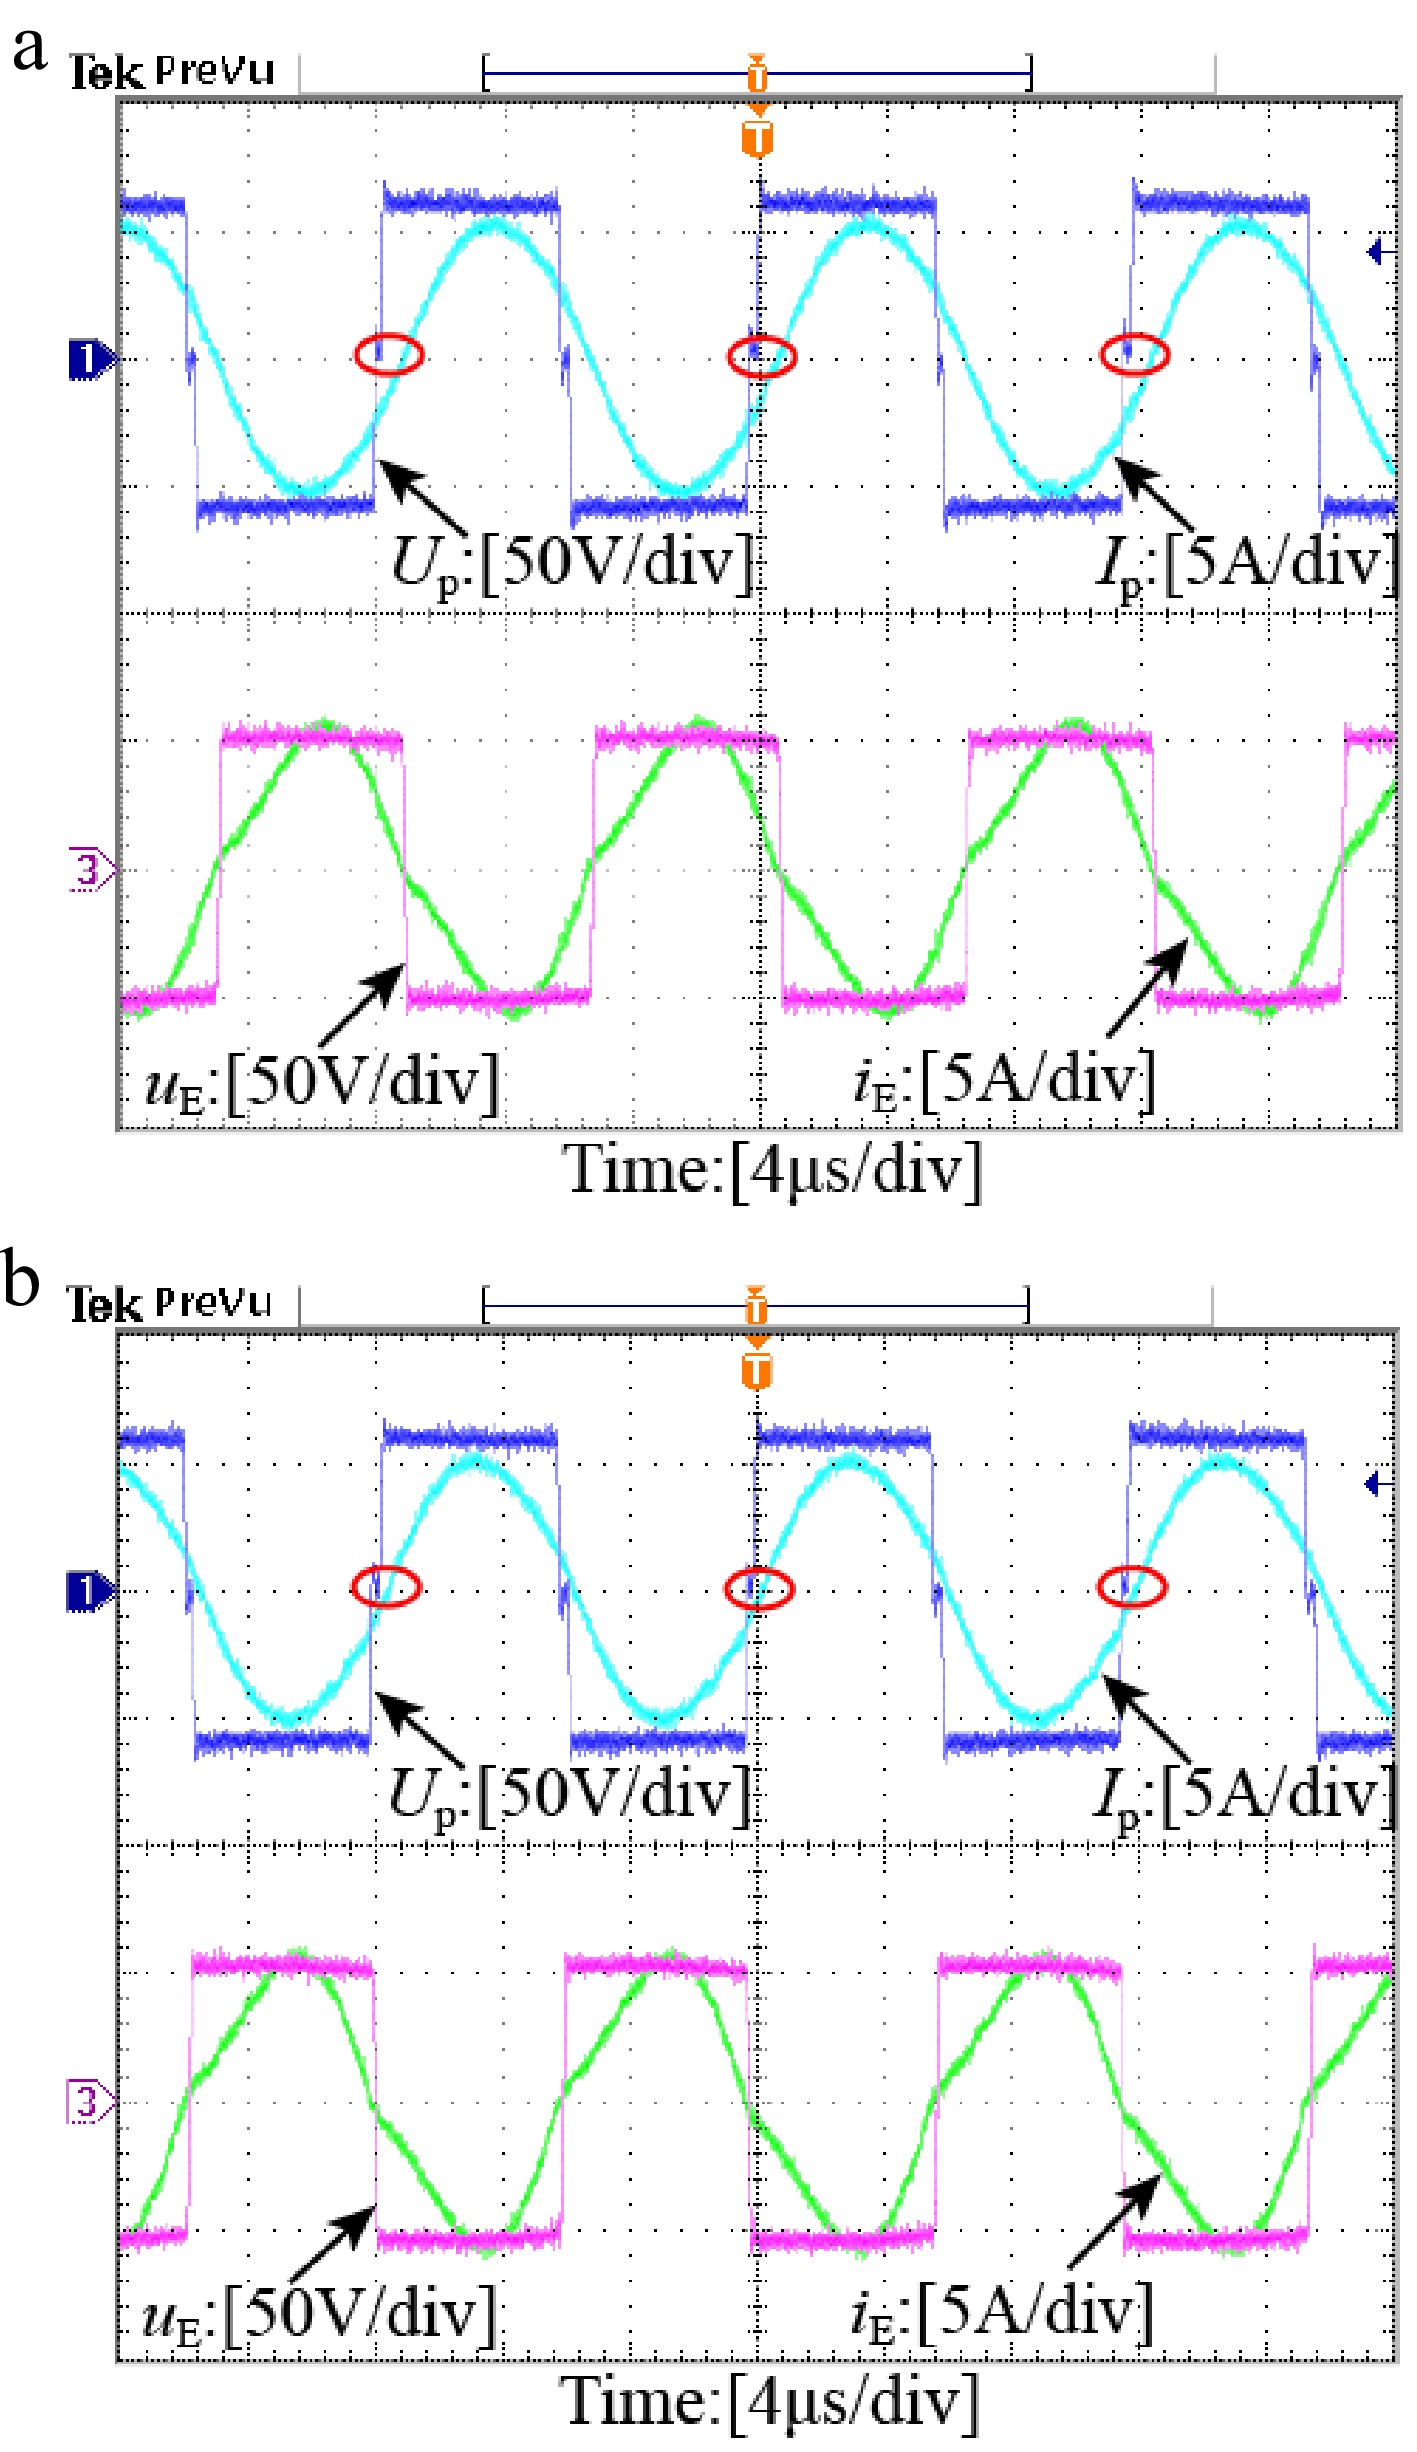
Figure 19.
Experimental waveforms under different Z-axis offsets. (a) h = 28 mm. (b) h = 51 mm.
-
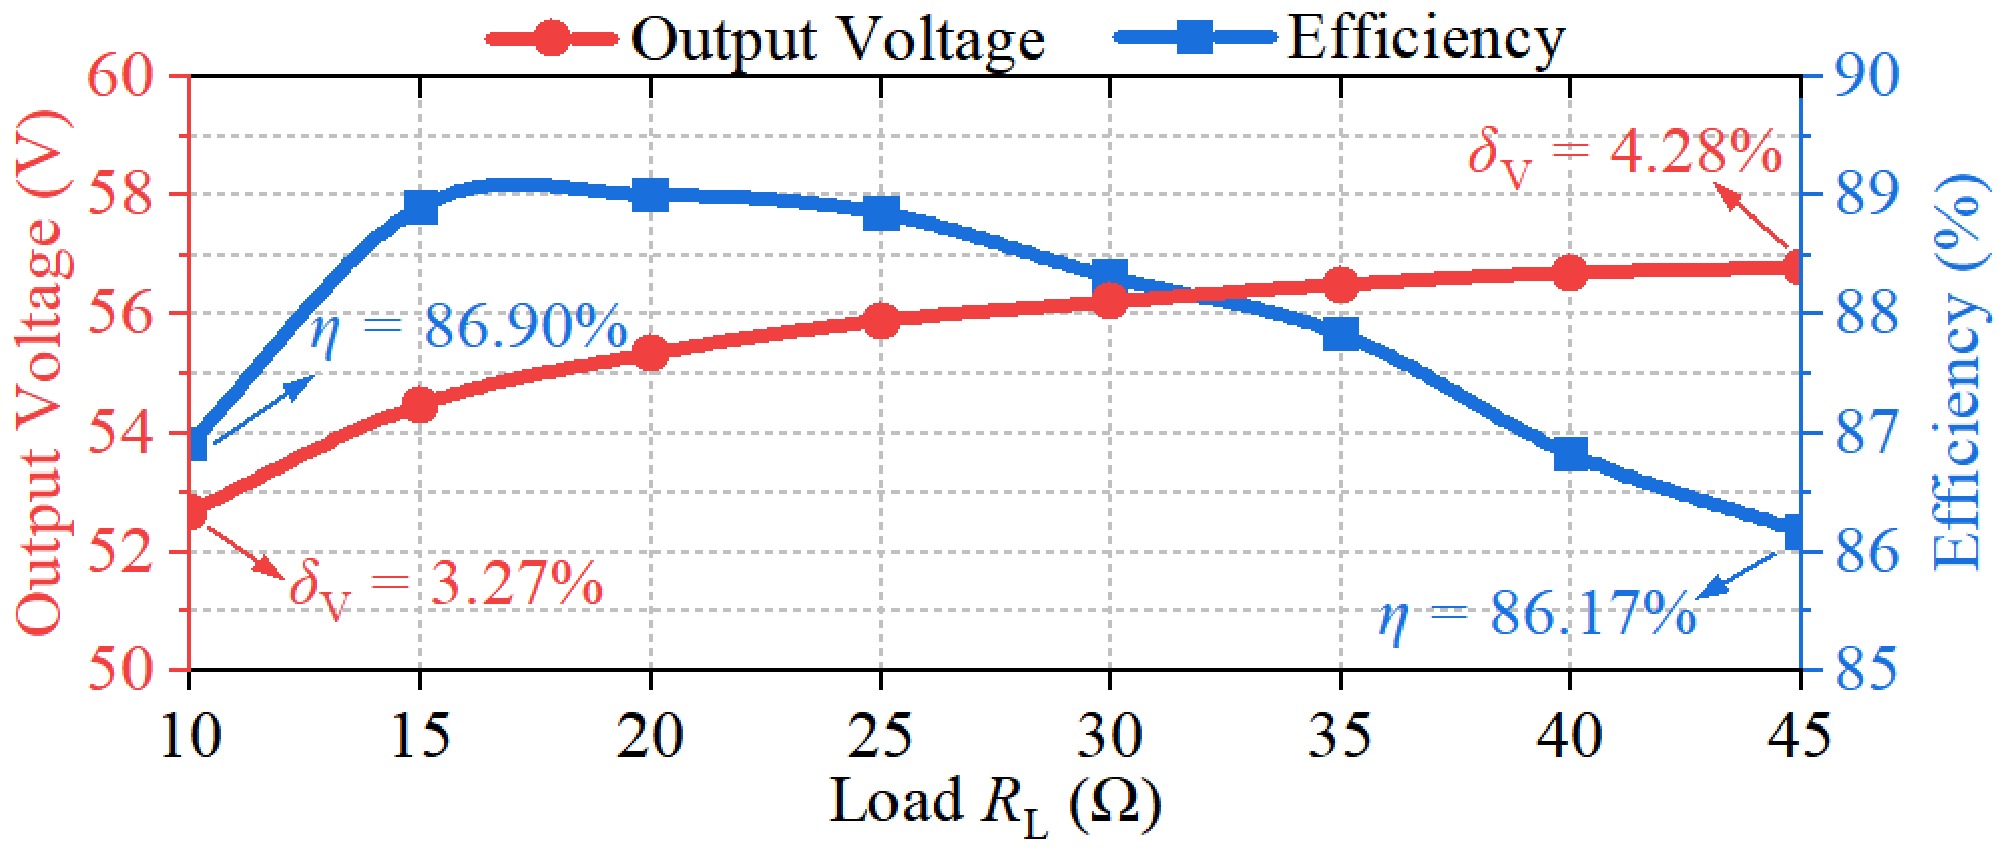
Figure 20.
Output voltage and efficiency under different load resistances RL.
-
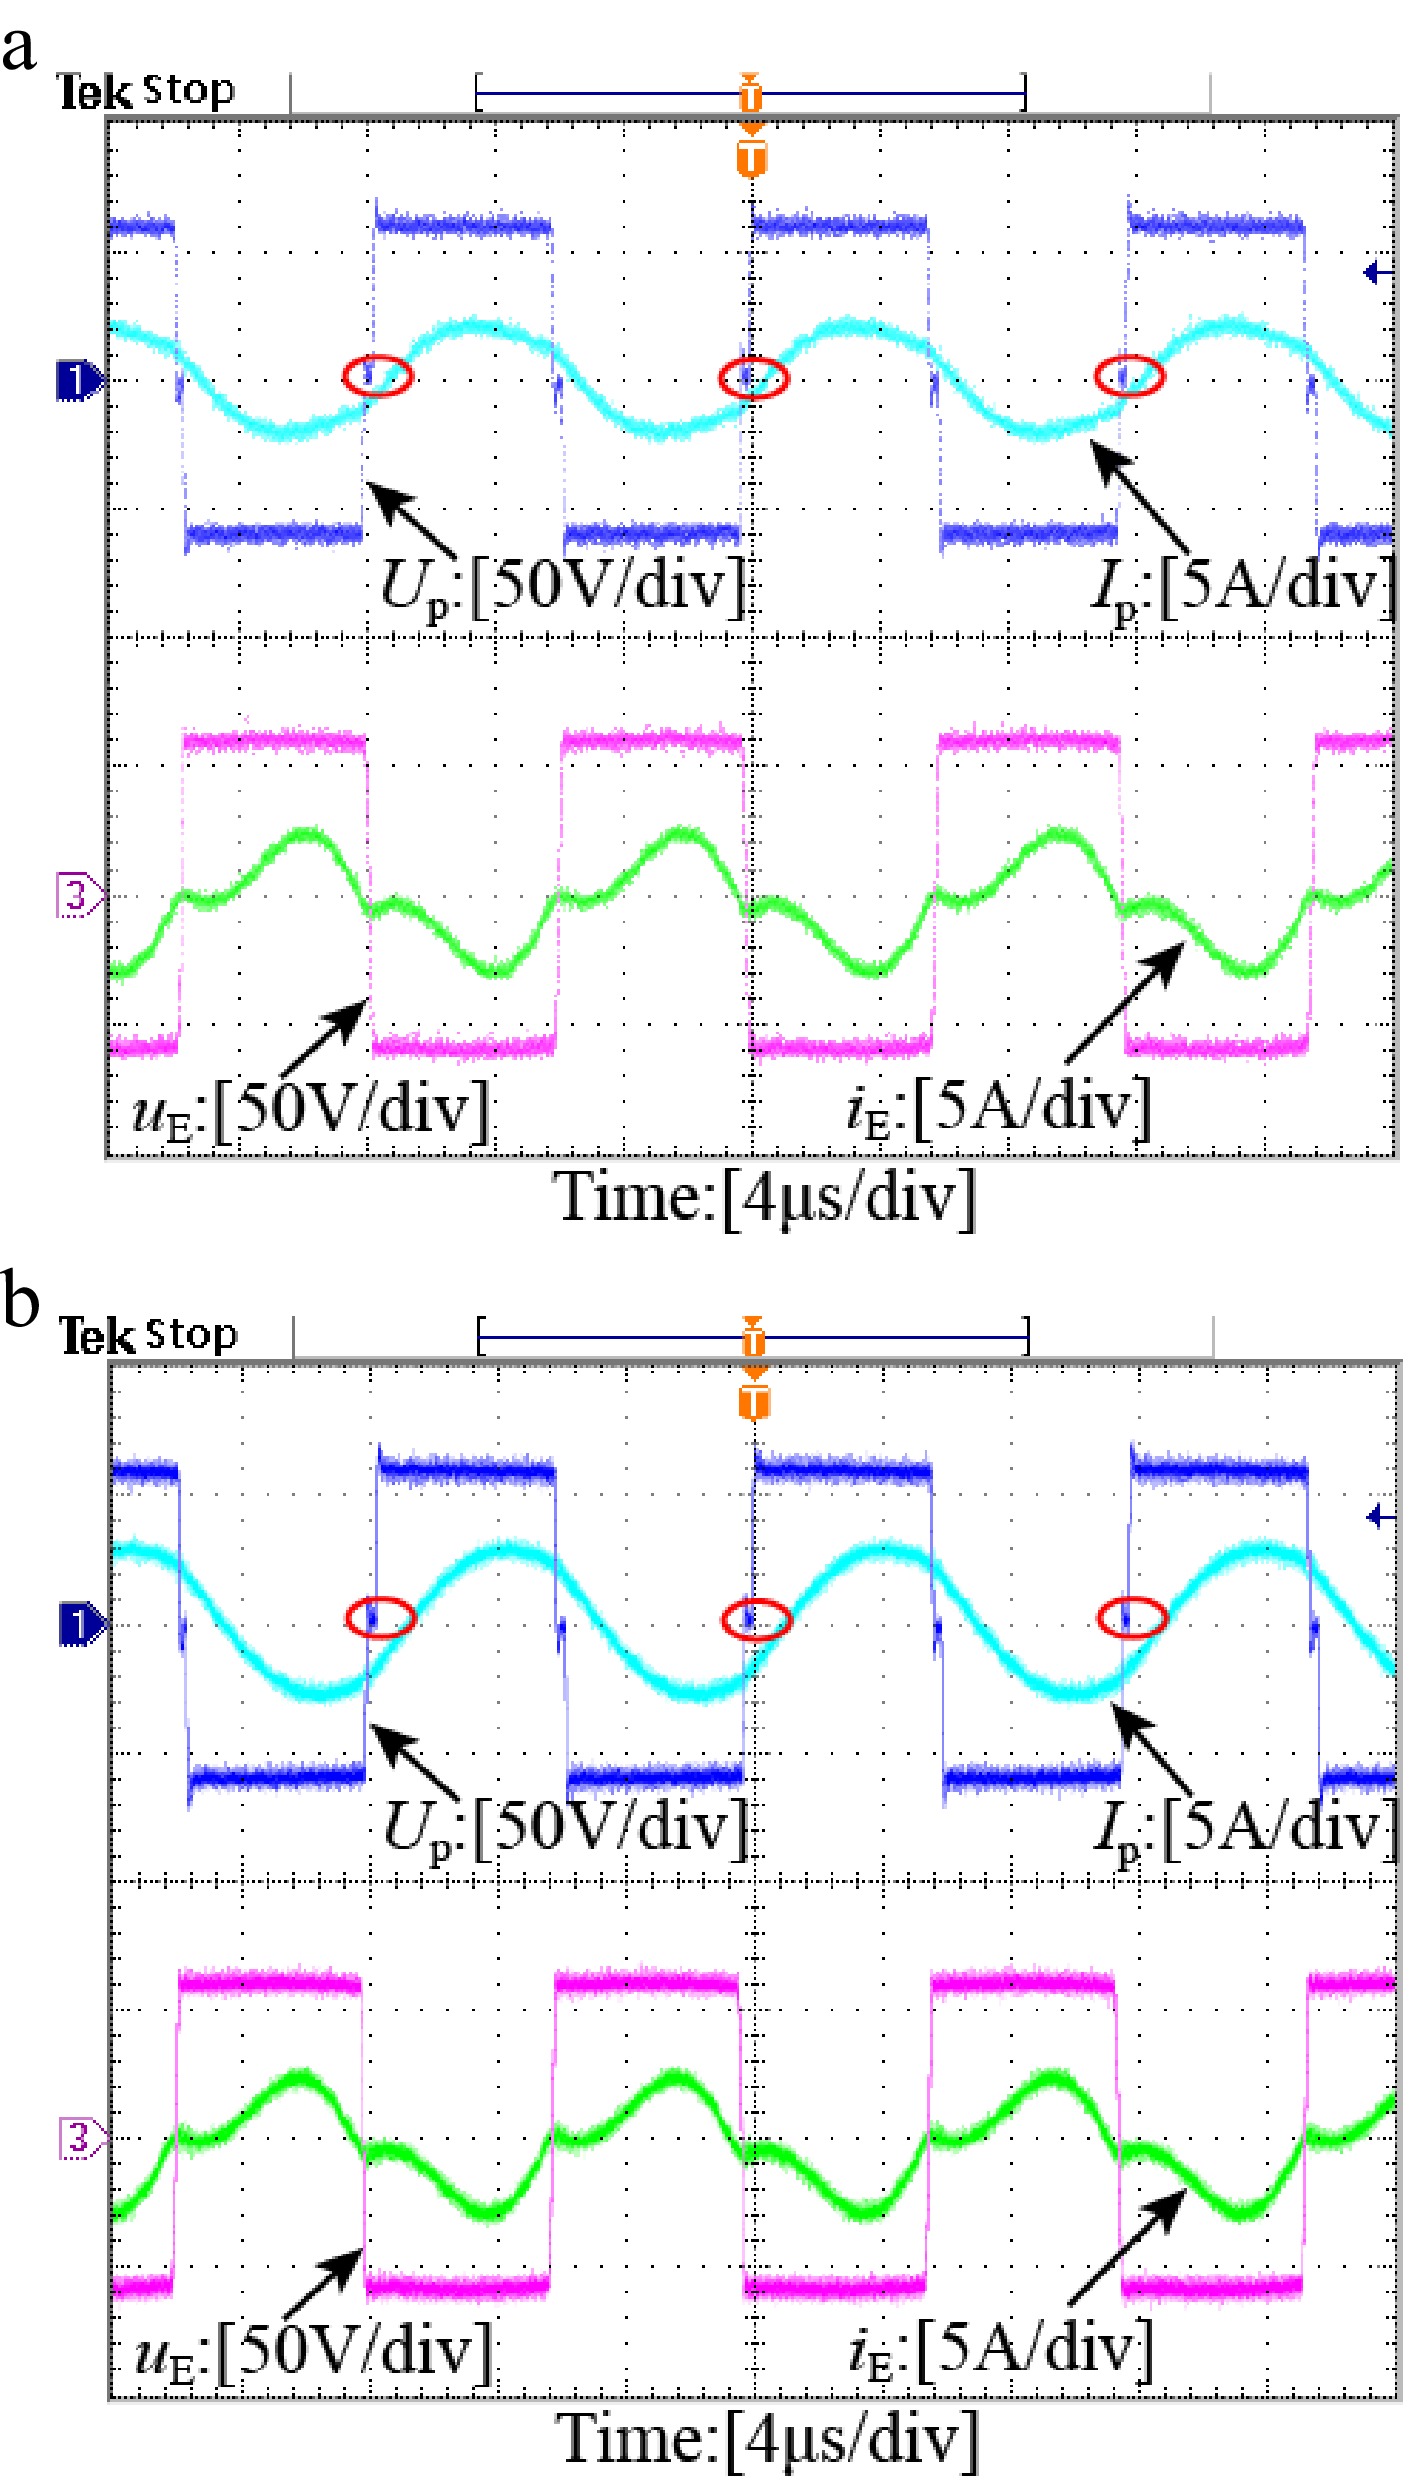
Figure 21.
Experimental waveforms under different X-axis offsets when the load resistance is 45 Ω. (a) X = 0. (b) X = 30 mm.
-
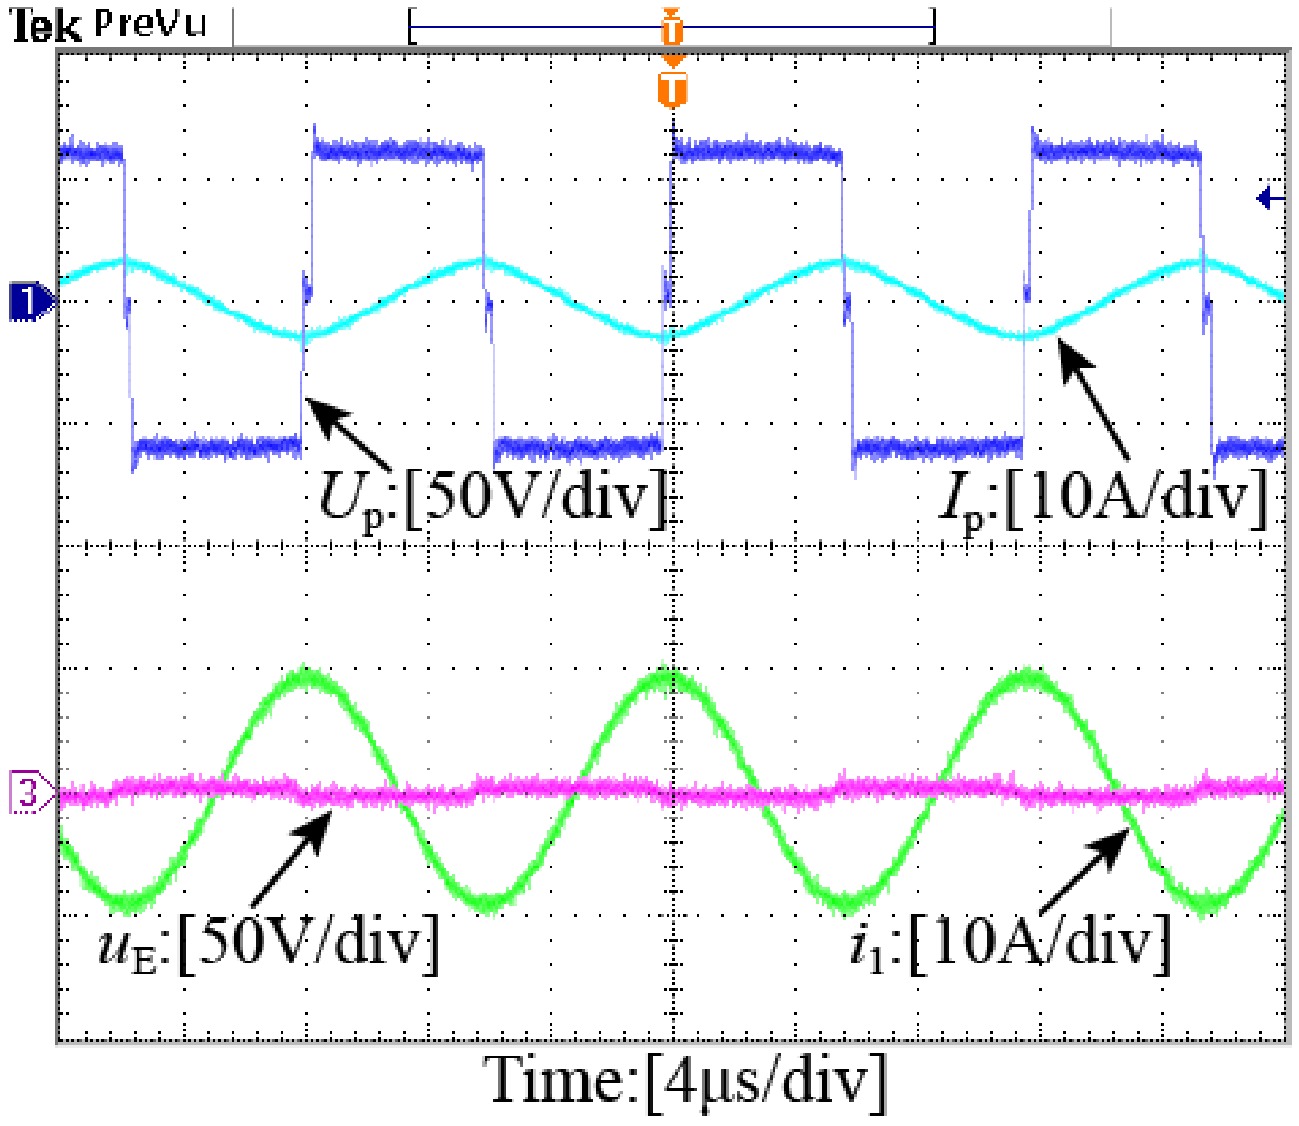
Figure 22.
Experimental waveforms showing that the system is in a weak coupling state when Rx is far away from Tx.
-
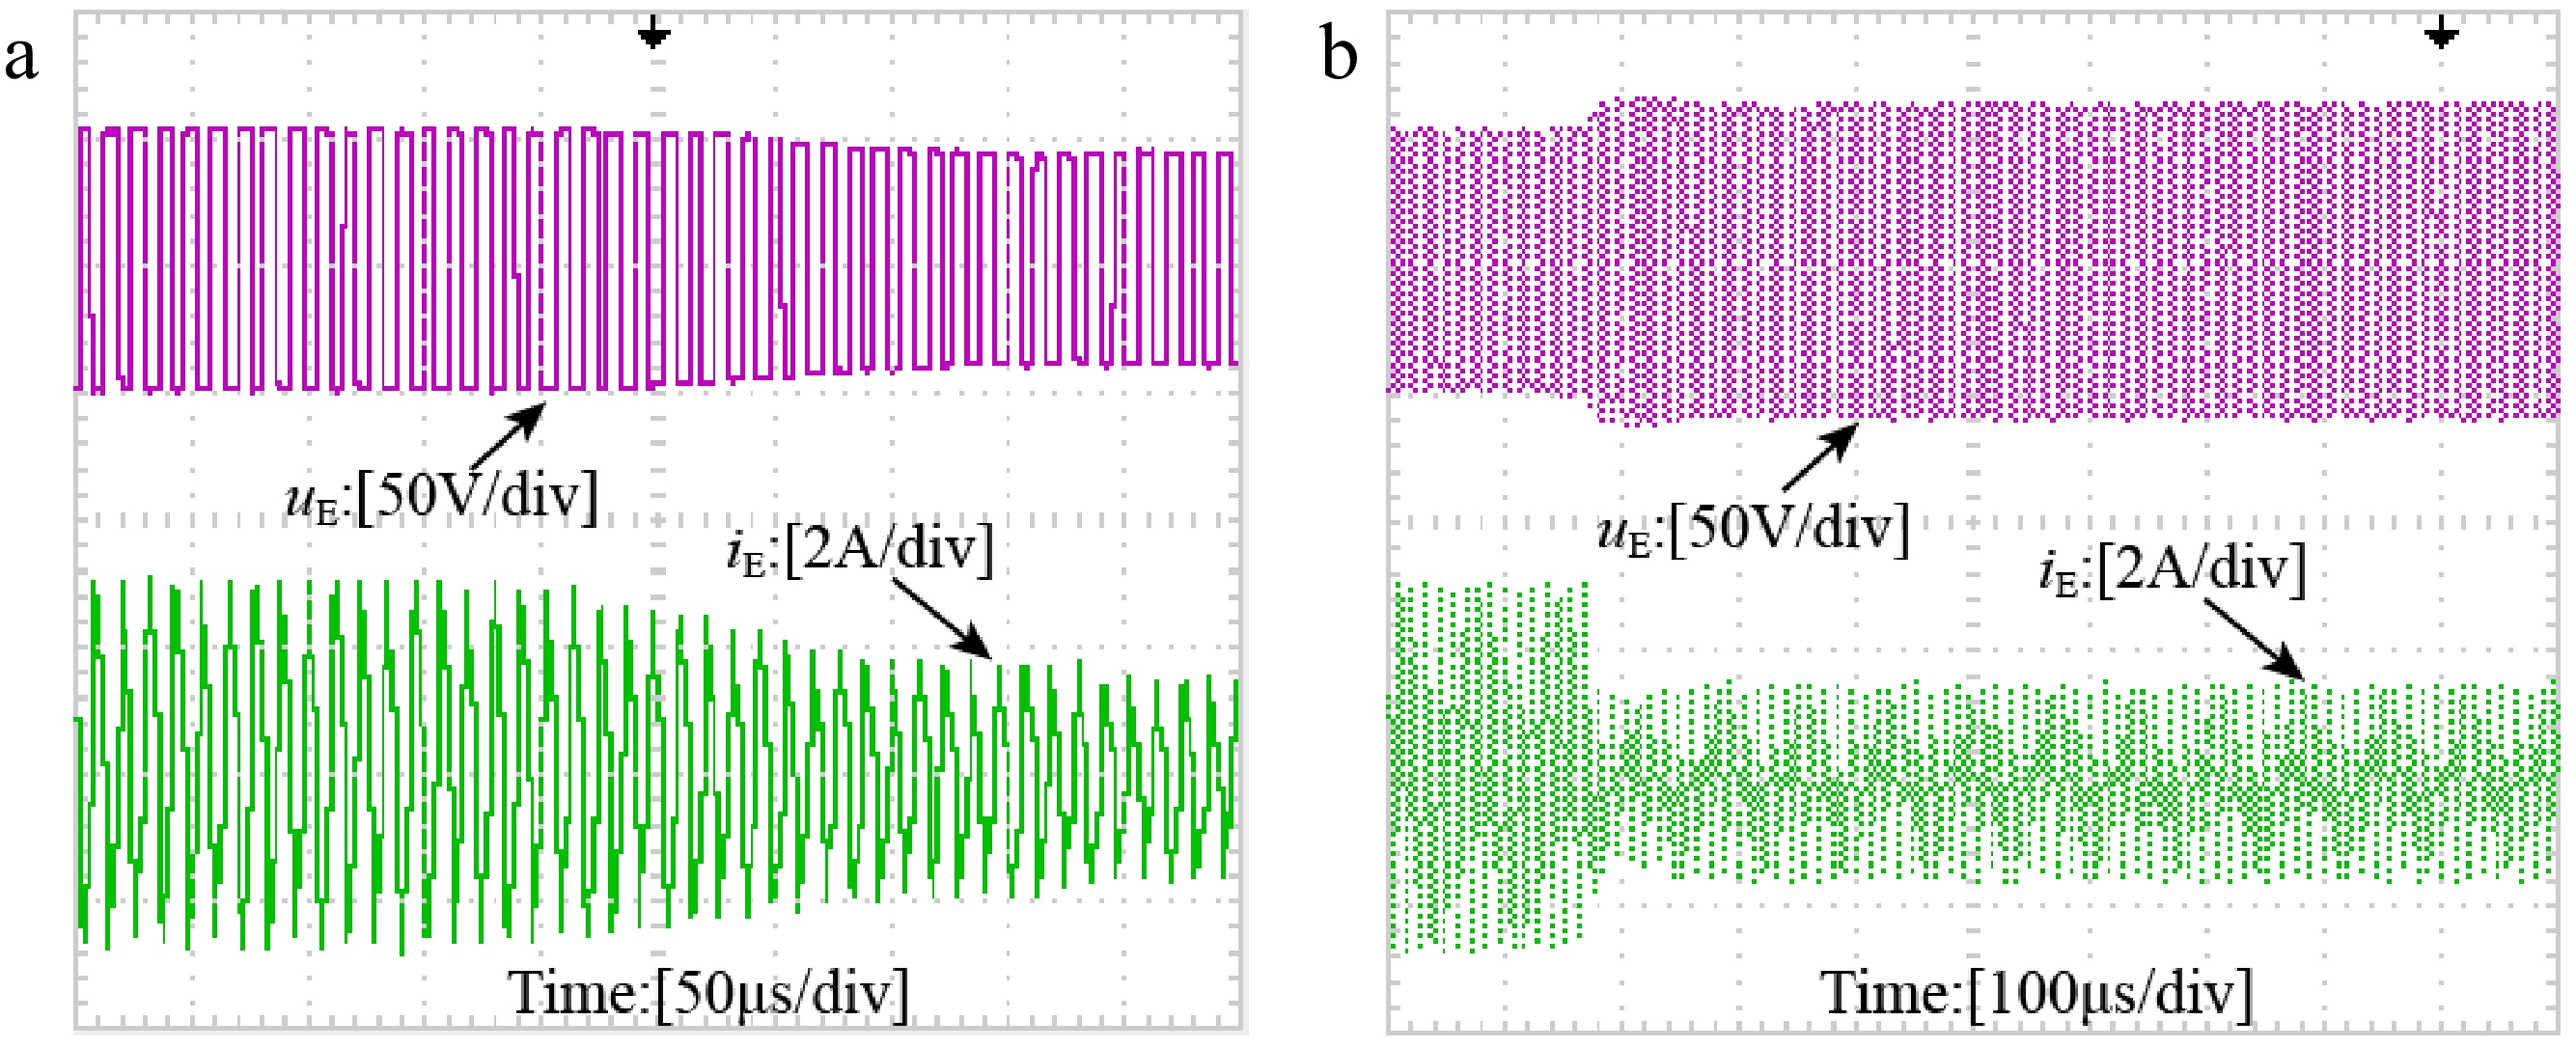
Figure 23.
Dynamic experimental waveforms. (a) The X-axis offset value changes from X = 0 to X = 40 mm. (b) The load resistance changes from RL = 15 Ω to RL = 45 Ω.
-
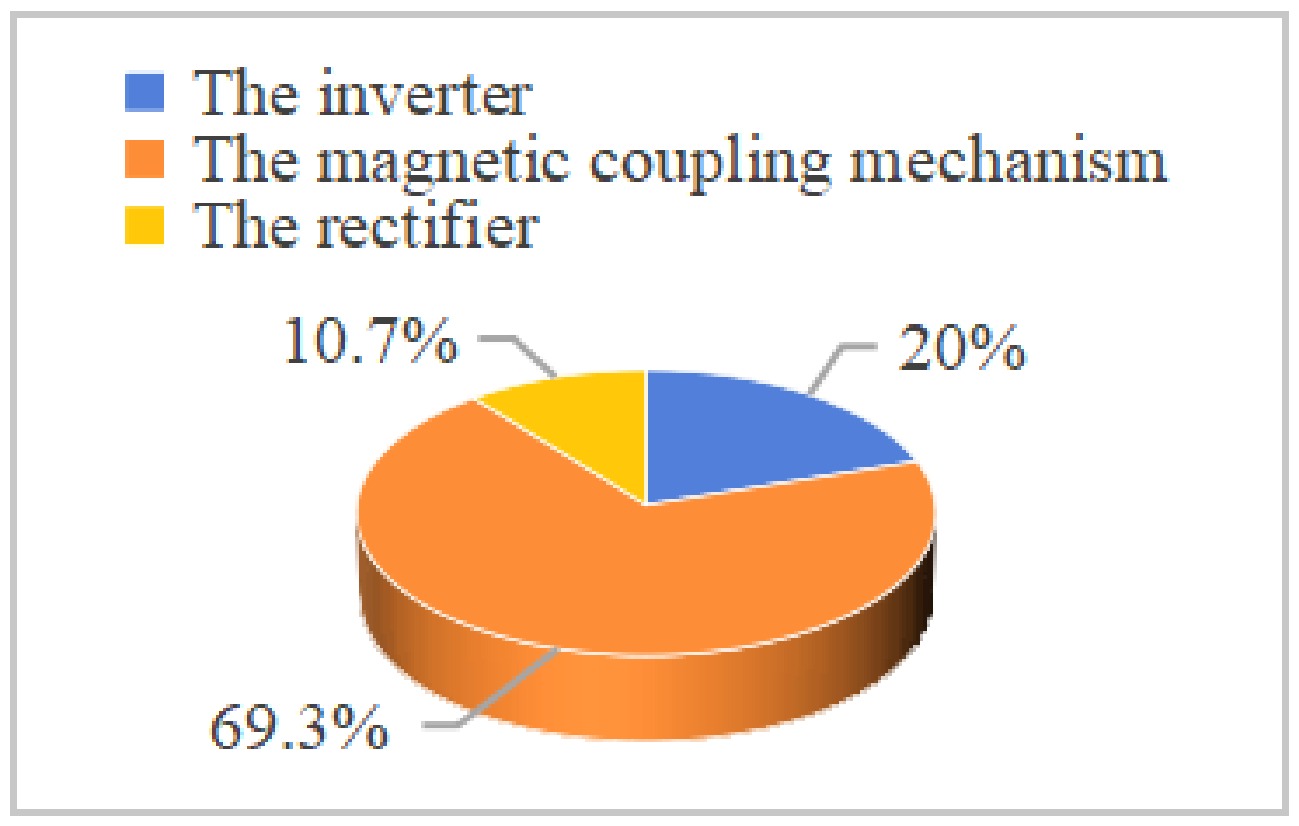
Figure 24.
Power loss distribution.
-
Parameters Value Parameters Value LP1 111.61 μH L1 15.77 μH LP2 110.63 μH L2 78.64 μH LS1 115.38 μH CP 31.73 nF LS2 112.01 μH CS 30.39 nF C1 222.48 nF C3 18.37 nF C2 27.52 nF C4 44.57 nF M12N 22.21 μH M34N 22.79 μH M12min 14.35 μH M34min −0.39 μH a 3.043 b −46.34 μH f0 85 kHz GVVN 1 hN 45 mm Uin 60 V Δ 5% RLN 15 Ω Table 1.
Key parameters of the experimental prototype.
-
Ref. Topology structure h (cm) Coil structure Wire coil size (cm) Offset range (cm) Output fluctuation Load independent Weak coupling security [17] S-S LCC-LCC 12 BP X: 39.1
Y: 73.8X: 16 (40.9%)
Y: No data
Z: −2~+2
(−16.7%~+16.7%)5% CC NO [18] S-S LCC-LCC 12 DD X: 77.5
Y: 39.1X: 12 (15.5%)
Y: 16 (40.9%)
Z: −2~+2
(−16.7%~+16.7%)5% CC YES [24] S-S LCC-LCC 7.5 Unipolar coil and novel
bipolar coil combinationX: 30
Y: 30X: 7.5 (25%)
Y: 7.5 (25%)
Z: No Data7% CC YES LCC-S S-LCC 1% CV [25] LCC-S S-LCC 7 Crossed solenoid magnetic coupler X: 22
Y: 22X: 9 (40.9%)
Y: 9 (40.9%)
Z: 0~40 (0~57.1%)5% CV YES This paper CLC-S S-CLC 4.5 Self-decoupled
cross-windingX: 15.9
Y: 15.9X: 8.5 (53.5%)
Y: 1.5 (9.4%)
Z: −1.7~+0.6
(−37.8%~+13.3%)5% CV YES h represents the transmission distance. Table 2.
Comparison with existing research on hybrid topology.
Figures
(24)
Tables
(2)